home health care services · 2017-03-15 · medicare beneficiaries received care, and the program...
TRANSCRIPT

Home health care services
C H A P T E R9

R E C O M M E N D A T I O N
9 The Congress should reduce home health payment rates by 5 percent in 2018 and implement a two-year rebasing of the payment system beginning in 2019. The Congress should direct the Secretary to revise the prospective payment system to eliminate the use of the number of therapy visits as a factor in payment determinations, concurrent with rebasing.
COMMISSIONER VOTES: YES 17 • NO 0 • NOT VOTING 0 • ABSENT 0

231 Repo r t t o t h e Cong r e s s : Med i ca r e Paymen t P o l i c y | Ma r ch 2017
Home health care services
Chapter summary
Home health agencies (HHAs) provide services to beneficiaries who are
homebound and need skilled nursing or therapy. In 2015, about 3.5 million
Medicare beneficiaries received care, and the program spent about $18.1
billion on home health care services. In that year, over 12,300 agencies
participated in Medicare.
Assessment of payment adequacy
The indicators of payment adequacy for home health care are generally
positive.
Beneficiaries’ access to care—Access to home health care is generally
adequate: Over 99 percent of beneficiaries lived in a ZIP code where a
Medicare home health agency operated in 2015, and 86 percent lived in a ZIP
code with five or more agencies.
• Capacity and supply of providers—In 2015, the number of agencies fell
slightly by 0.9 percent after a long period of growth. From 2004 to 2014,
the number of agencies increased by 63 percent. The decline in 2015 was
concentrated in areas that experienced sharp increases in supply in prior
years.
• Volume of services—In 2015, the volume of services increased by 0.3
percent, reversing a three-year trend of modest decline. The total number
In this chapter
• Are Medicare payments adequate in 2017?
• How should Medicare payments change in 2018?
C H A P T E R 9

232 Home hea l t h c a r e s e r v i c e s : A s s e s s i ng paymen t adequacy and upda t i ng paymen t s
of users increased slightly, while the average number of episodes per home
health user declined by 0.6 percent. From 2002 to 2015, home health utilization
increased substantially, with the number of episodes increasing by over 60
percent and the episodes per home health user increasing from 1.6 to 1.9
episodes. Episodes not preceded by a hospitalization account for most of the
growth in this period, and, between 2001 and 2015, these episodes increased
from about half to two-thirds of total episodes.
Quality of care—In 2015, performance on quality measures improved. The share
of beneficiaries reporting improvement in walking and transferring increased; the
share of beneficiaries hospitalized during their home health spell decreased from
27.8 percent to 25.4 percent.
Providers’ access to capital—Access to capital is a less important indicator of
Medicare payment adequacy for home health care because this sector is less capital
intensive than other health care sectors. The major publicly traded for-profit home
health companies had sufficient access to capital markets for their credit needs.
Several acquisitions by large post-acute care companies to expand home health
capacity indicate this sector is an attractive market to investors.
Medicare payments and providers’ costs—Between 2014 and 2015, Medicare
spending increased by 2.3 percent to $18.1 billion. For more than a decade,
payments have consistently and substantially exceeded costs in the home health
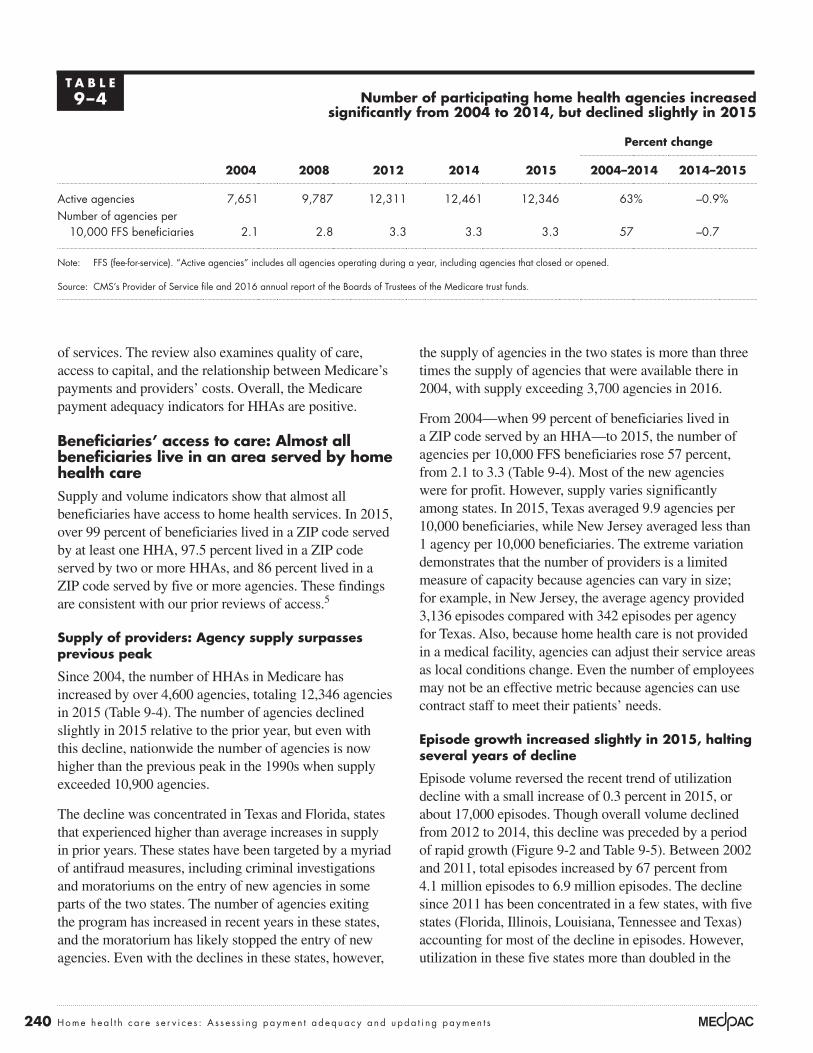
prospective payment system (PPS). In 2015, Medicare margins for freestanding
agencies averaged 15.6 percent and averaged 16.5 percent between 2001 and
2014. The marginal profit for HHAs in 2015 was 18.1 percent. The Commission
projects that Medicare margins for 2017 will equal 13.7 percent. Two factors have
contributed to payments exceeding costs: Agencies have reduced episode costs by
lowering the number of visits provided, and cost growth has been lower than the
annual payment updates for home health care.
The high Medicare margins of home health agencies have led the Commission to
recommend a 5 percent reduction in the base rate for 2018 and a two-year rebasing
beginning in 2019. The chronic overpayments Medicare has made need to be
addressed. These two actions should help to better align payments with actual costs,
ensuring better value for beneficiaries and taxpayers without impeding access to
home health care services.
We are also recommending, as we have for the last five years, that Medicare
eliminate the use of the number of therapy visits as a payment factor in the home
health PPS beginning in 2019. A review of utilization trends and further research

233 Repo r t t o t h e Cong r e s s : Med i ca r e Paymen t P o l i c y | Ma r ch 2017
by the Commission and others suggest that this aspect of the PPS creates financial
incentives that distract agencies from focusing on patient characteristics when
setting plans of care. Eliminating the number of therapy visits as a payment factor
would base home health payment solely on patient characteristics, a more patient-
focused approach to payment. ■


235 Repo r t t o t h e Cong r e s s : Med i ca r e Paymen t P o l i c y | Ma r ch 2017
Background
Medicare home health care consists of skilled nursing, physical therapy, occupational therapy, speech therapy, aide services, and medical social work provided to beneficiaries in their homes. To be eligible for Medicare’s home health benefit, beneficiaries must need intermittent (fewer than eight hours per day) skilled care to treat their illnesses or injuries and must be unable to leave their homes without considerable effort. Medicare requires that a physician certify a patient’s eligibility for home health care and that a patient receiving services be under the care of a physician. In contrast to coverage for skilled nursing facility services, Medicare does not require a preceding hospital stay to qualify for home health care. Also, unlike for most services, Medicare does not require copayments or a deductible for home health services. In 2015, about 3.5 million Medicare beneficiaries received home care, and the program spent $18.1 billion on home health services. Between 2001 and 2015, Medicare spending for home health care more than doubled and currently accounts for about 5 percent of fee-for-service (FFS) spending.
Medicare pays for home health care in 60-day episodes. Payments for an episode are adjusted for patient severity based on patients’ clinical and functional characteristics and the number of therapy visits provided. If beneficiaries need additional covered home health services at the end of the initial 60-day episode, another episode commences and Medicare pays for an additional episode. Episodes delivered to beneficiaries in rural areas receive a 3 percent payment increase through 2017. (An overview of the home health prospective payment system (PPS) is available at http://medpac.gov/docs/default-source/payment-basics/medpac_payment_basics_16_hha_final.pdf?sfvrsn=0.) Coverage for additional episodes generally has the same requirements as the initial episode (i.e., the beneficiary must be homebound and need skilled care).
In 2011, Medicare implemented a requirement that a beneficiary have a face-to-face encounter with the physician ordering home health care. The encounter must take place in the 90 days preceding or 30 days following the initiation of home health care. Contacts through nonphysician practitioners or authorized telehealth services may be used to satisfy the requirement.
Use and growth of the home health benefit have varied substantially because of changes in coverage and payment policy The delivery of the home health benefit has changed substantially since the 1980s. Implementation of the inpatient hospital PPS in 1983 led to increased use of home health services as hospital lengths of stay decreased. Medicare tightened coverage of some services, but the courts overturned these curbs in 1988. After this change, the number of home health agencies (HHAs), users, and services expanded rapidly in the early 1990s. Between 1990 and 1995, the number of annual users increased by 75 percent, and the number of visits more than tripled to about 250 million a year. Spending increased more than fourfold between 1990 and 1995, from $3.7 billion to $15.4 billion. As the rates of use and the duration of home health spells increased, there was concern that the benefit was serving more as a long-term care benefit (Government Accountability Office 1996). Further, many of the services provided were believed to be improper. For example, in one analysis of 1995 to 1996 data, the Office of Inspector General found that about 40 percent of the services in a sample of Medicare claims did not meet Medicare requirements for reimbursement, mostly because services did not meet Medicare’s standards for a reasonable and necessary service, patients did not meet the homebound coverage requirement, or the medical record did not document that a billed service was provided (Office of Inspector General 1997).
The trends of the early 1990s prompted increased program integrity actions, refinements of coverage standards, temporary spending caps through an interim payment system (IPS), and replacement of the cost-based payment system with a PPS in 2000.1 Between 1997 and 2000, the number of beneficiaries using home health services fell by about 1 million, and the number of visits fell by 65 percent (Table 9-1, p. 236). The mix of services changed from predominantly aide services in 1997 to predominantly nursing visits in 2000, and therapy visits increased between 1997 and 2015 from 10 percent of visits to 37 percent. Between 1997 and 2000, total spending for home health services declined by 52 percent. The reduction in payments had a swift effect on the supply of agencies, and by 2000, the number of agencies had fallen by 31 percent. However, after this period, the PPS was implemented, and service use and agency supply rebounded at a rapid pace. Between 2001 and 2015, the number of home health episodes rose from 3.9 million to 6.6 million (data not shown). The

236 Home hea l t h c a r e s e r v i c e s : A s s e s s i ng paymen t adequacy and upda t i ng paymen t s
number of agencies in 2015 was 12,346. Almost all the new agencies since implementation of the PPS have been for-profit providers (data not shown).
The steep declines in services under the IPS did not appear to adversely affect the quality of care beneficiaries received; one analysis found that patient satisfaction with home health services was mostly unchanged in that period (McCall et al. 2004, McCall et al. 2003). In 2004, the Commission also concluded that the quality of care did not decline between use of the IPS and the implementation of the PPS (Medicare Payment Advisory Commission 2004). The similarity in quality of care under the IPS and the PPS suggests that the payment reductions in the Balanced Budget Act of 1997 led agencies to reduce costs and utilization without a measurable difference in the quality of patient care.
Medicare has always overpaid for home health services under the PPSPayments for home health care have substantially exceeded costs since Medicare established the PPS. In 2001, the first year of the PPS, average Medicare margins equaled 23 percent (Figure 9-1). The high margins in the first year
suggest that the PPS established a base rate well in excess of costs. The base rate assumed that the average number of visits per episode would decline about 15 percent between 1998 and 2001, while the actual decline was about 32 percent (Table 9-2). In addition, agencies have been able to hold the rate of episode cost growth below 1 percent in many years, lower than the rate of inflation assumed in the home health payment update. Consequently, HHAs were able to garner extremely high average payments relative to the cost of services provided. Since 2001, agencies have been able to reduce visits further, and between 2001 and 2014, margins have averaged 16.5 percent (Figure 9-1). Furthermore, the reported margins may be low. An audit of 2011 cost reports by CMS found that a sample of 98 agencies overstated their costs by 8 percent; adjusting for the overstatement of costs, margins for this year would have been in excess of 20 percent.
Changes to payment for home health services required by the Patient Protection and Affordable Care Act of 2010In 2010, the Commission recommended that Medicare lower home health payments to make them more consistent with costs, a process referred to as payment
T A B L E9–1 Changes in supply and utilization of home health care, 1997–2015
1997 2000 2014 2015
Percent change
1997–2000
2000–2014
2014–2015
Agencies 10,917 7,528 12,461 12,346 –31% 66% –1%
Total spending (in billions) $17.7 $8.5 $17.7 $18.1 –52 108 2
Users (in millions) 3.6 2.5 3.4 3.5 –31 37 1
Number of visits (in millions) 258.2 90.6 115.1 115.1 –65 27 <0.1
Visit type (percent of total)Skilled nursing 41% 49% 52% 52% 20 5 –2Home health aide 48 31 12 10 –37 –62 –10Therapy 10 19 36 37 101 85 5Medical social services 1 1 1 1 1 –32 <0.1
Number of visits per user 73 37 34 33 –49 –9 –1
Percent of FFS beneficiaries who used home health services 10.5% 7.4% 9.1% 9.1% –30 23 1
Note: FFS (fee-for-service). Medicare did not pay on a per episode basis before October 2000. Yearly figures presented in the table are rounded, but figures in the percent change columns were calculated using unrounded data.
Source: Home health standard analytical file 2015; Health Care Financing Review, Medicare and Medicaid Statistical Supplement 2002.
237 Repo r t t o t h e Cong r e s s : Med i ca r e Paymen t P o l i c y | Ma r ch 2017
rebasing. The Patient Protection and Affordable Care Act of 2010 (PPACA) included several reductions intended to address home health care’s high Medicare payments, including rebasing the payment system. However, these policies will not likely achieve the Commission’s goal of making payments more consistent with actual costs.
PPACA calls for the annual rebasing adjustment to be offset by the payment update for each year from 2014 through 2017. CMS set the rebasing reduction to the maximum amount permitted under the PPACA formula, which was equal to 3.5 percent of the 2010 base rate, or an annual reduction of $81 per 60-day episode. However,
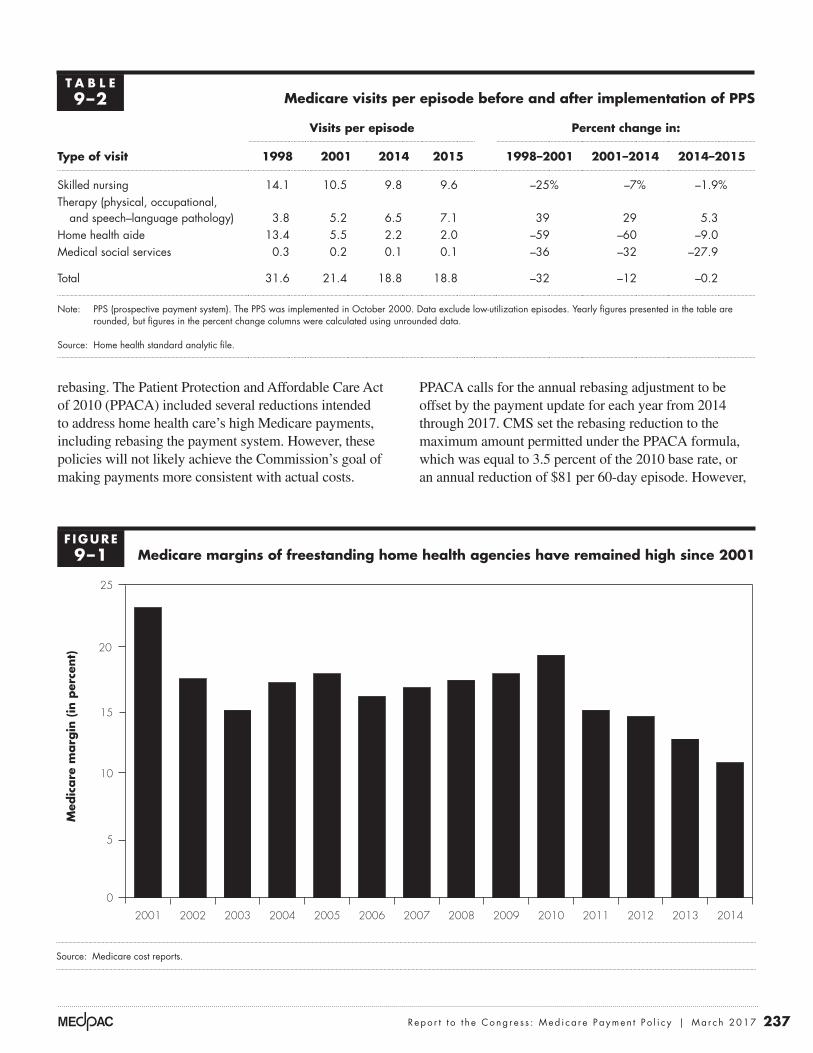
T A B L E9–2 Medicare visits per episode before and after implementation of PPS
Type of visit
Visits per episode Percent change in:
1998 2001 2014 2015 1998–2001 2001–2014 2014–2015
Skilled nursing 14.1 10.5 9.8 9.6 –25% –7% –1.9%Therapy (physical, occupational,
and speech–language pathology) 3.8 5.2 6.5 7.1 39 29 5.3Home health aide 13.4 5.5 2.2 2.0 –59 –60 –9.0Medical social services 0.3 0.2 0.1 0.1 –36 –32 –27.9
Total 31.6 21.4 18.8 18.8 –32 –12 –0.2
Note: PPS (prospective payment system). The PPS was implemented in October 2000. Data exclude low-utilization episodes. Yearly figures presented in the table are rounded, but figures in the percent change columns were calculated using unrounded data.
Source: Home health standard analytic file.
Medicare margins of freestanding home health agencies have remained high since 2001
Source: Medicare cost reports.
Medicare margins....
Med
icare
marg
in (
in p
erce
nt)
FIGUREX-X
Note: Note and Source are in InDesign.
Source:
Notes about this graph:• Data is in the datasheet. Make updates in the datasheet.• WATCH FOR GLITCHY RESETS WHEN YOU UPDATE DATA!!!!• The column totals were added manually.• I had to manually draw tick marks and axis lines because they kept resetting when I changed any data.• I can’t delete the legend, so I’ll just have to crop it out in InDesign.• Use direct selection tool to select items for modification. Otherwise if you use the black selection tool, they will reset to graph default when you change the data.• Use paragraph styles (and object styles) to format. • Data was from: R:\Groups\MGA\data book 2007\data book 2007 chp1
0
5
10
15
20
25
20142013201220112010200920082007200620052004200320022001
F IGURE9–1

238 Home hea l t h c a r e s e r v i c e s : A s s e s s i ng paymen t adequacy and upda t i ng paymen t s
During the 2001 to 2012 period, HHAs’ overall rate of unexpected hospitalization during the home health episode—an indicator of poor quality—remained steady at about 28 percent, while average payment per episode increased in most years.2 This finding suggests that hospitalization was not sensitive to changes in payments; that is, higher payments to HHAs did not lead to fewer hospitalizations, and conversely, lower payments did not lead to higher hospitalization rates. Performance on two functional measures of quality—the share of patients demonstrating improvement in walking and the share of patients demonstrating improvement in transferring—generally increased during this period. These increases in quality occurred in years in which the average payment per episode decreased as well as in years in which the average payment per episode increased, suggesting that changes in payment have little direct relationship to rates of functional improvement.
The Commission will continue to review access to care and quality as data for additional years become available. However, experience suggests that the small PPACA rebasing reductions will not change average episode payments significantly. HHA margins are likely to remain high under the current rebasing policy, and quality of care and beneficiary access to care are unlikely to be negatively affected.
Ensuring appropriate use of home health care is challengingPolicymakers have long struggled to define the role of the home health benefit in Medicare (Benjamin 1993). From the outset, there was a concern that setting a narrow policy could result in beneficiaries using other, more expensive services, while a policy that was too broad could lead to wasteful or ineffective use of the home
the size of the base rate has increased since 2010, so this reduction will actually be less than 3.5 percent and, in fact, has averaged about 2.75 percent in each year from 2014 through 2017. In addition, over this period, the payment update has offset these reductions, resulting in a cumulative net payment reduction of 3 percent (Table 9-3). This modest reduction will likely leave substantial margins for HHAs, margins that have exceeded 10 percent since the implementation of PPS.
PPACA required the Commission to assess the impact of these payment changes on quality of care and beneficiary access (Medicare Payment Advisory Commission 2014). To meet this mandate, the Commission examined the historical relationship between changes in payment and changes in quality and access for the 2001 through 2012 period. The volume of episodes grew substantially in this period, even in years that Medicare reduced home health payments. From 2001 through 2010, episode volume for urban, rural, for-profit, and nonprofit providers grew on a per beneficiary basis. These increases in utilization occurred in years in which the average episode payment decreased as well as in years in which the average episode payment increased, suggesting that PPACA’s modest payment reduction has not had a negative effect on access. Utilization decreased slightly in 2011 and 2012, but these declines coincided with policy changes intended to address potential overuse, such as the face-to-face visit requirement and antifraud efforts in several high-use areas. The slowdown also coincided with an economy-wide slowdown in health spending and utilization.
The Commission examined three quality measures to assess the relationship between past payment reductions and quality, and the results suggest that payment changes during this period did not have a significant effect.
T A B L E9–3 Impact of PPACA rebasing on payments for 60-day episodes
Annual percent changeCumulative change,
2014–20172014 2015 2016 2017
Rebasing adjustment –2.8% –2.7% –2.7% –2.8% –11.4%Legislated payment update 2.3 2.1 1.9 1.9 8.5Net payment reduction –0.6 –0.7 –0.8 –0.9 –3.0
Note: PPACA (Patient Protection and Affordable Care Act of 2010). Effects of payment changes are multiplicative.
Source: MedPAC analysis based on data from CMS.

239 Repo r t t o t h e Cong r e s s : Med i ca r e Paymen t P o l i c y | Ma r ch 2017
health benefit (Feder and Lambrew 1996). Medicare relies on the skilled care and homebound requirements as primary determinants of home health eligibility, but these broad coverage criteria permit beneficiaries to receive services in the home even though they are capable of leaving home for medical care, which most home health beneficiaries do (Wolff et al. 2008). Medicare does not provide any incentives for beneficiaries or providers to consider alternatives to home health care, such as outpatient services. Beneficiaries who meet program coverage requirements can receive an unlimited number of home health episodes and face no cost sharing. In addition, the program relies on agencies and physicians to follow program requirements for determining beneficiary needs, but evidence from prior years suggests that they do not consistently follow Medicare’s standards (Cheh et al. 2007, Office of Inspector General 2001). Concerns about ensuring the appropriate use of home health episodes not preceded by a hospitalization, which have increased faster than post-acute episodes, led the Commission to recommend a copayment for these episodes (Medicare Payment Advisory Commission 2011).
Even when enforced, the standards permit a broad range of services. For example, the skilled care requirement mandates that a beneficiary need therapy or nursing care to be eligible for the home health benefit. The intent of the skilled services requirement is that the home health benefit serve a clear medical purpose and not be an unskilled, personal-care benefit. However, Medicare’s coverage standards do not require that skilled visits compose the majority of the home health services a patient receives. For example, in about 6 percent of episodes in 2014, most services provided were visits from an unskilled home health aide. Assistance with activities of daily living is a common part of post-acute care in institutional settings. However, the home health benefit is unique in that many episodes are provided without a preceding hospital stay (see Table 9-7, p. 243). These episodes raise questions about whether Medicare’s broad standards for coverage are adequate to ensure that skilled care remains the focus of the home health benefit.
Fraud and abuse are continuing challenges in home health careIn 2010, the Commission made a recommendation to curb wasteful and fraudulent home health services (Medicare Payment Advisory Commission 2010). This recommendation calls on the Health and Human Services Secretary to use the department’s authorities under
current law to examine providers with aberrant patterns of utilization for possible fraud and abuse. PPACA permits Medicare to implement temporary moratoriums on the enrollment of new agencies in areas believed to have a high incidence of fraud. In 2013, Medicare implemented moratoriums for home health agencies in the Chicago, Dallas, Detroit, Houston, and Miami-Dade areas (Fort Lauderdale was later included). CMS expanded these moratoriums statewide in Florida, Illinois, Michigan, and Texas in 2016. There have also been numerous criminal prosecutions for home health fraud, most notably in Detroit and Miami. However, the Commission observes that many areas continue to have aberrant patterns of utilization. For example, even though Miami has been an area of concentrated effort by CMS and law enforcement agencies, this area still has a utilization rate well in excess of other areas. The persistence of aberrant utilization patterns suggests that continued, or perhaps even expanded, efforts by all enforcement agencies are needed to address the scope of fraud in many areas. In addition, Medicare has other regulatory powers, such as requiring HHAs to hold surety bonds, but has not exercised this authority.3
A CMS review of 2015 services found that 59 percent of home health claims were missing information needed to justify eligibility for services or appropriate use; in 2016, Medicare expanded its administrative review of home health claims to address the high rate of erroneous claims. This rate led CMS to launch a preclaims review process, targeted at Florida, Illinois, Massachusetts, Michigan, and Texas.4 The review began in Illinois in August 2016, and CMS intends to expand it to the other four states in the future. The initiative focuses on incentivizing agencies to improve their documentation since incomplete documentation of a beneficiary’s eligibility or need for home health services was a major factor in 2015’s high error rate. Agencies that do not comply with preclaims review will be subject to automatic postpayment review of claims and reduced final payments and may be subject to payment reductions.
Are Medicare payments adequate in 2017?
The Commission reviews several indicators to determine the level at which payments will be adequate to cover the costs of an efficient provider in 2017. We assess beneficiary access to care by examining the supply of home health providers and annual changes in the volume
240 Home hea l t h c a r e s e r v i c e s : A s s e s s i ng paymen t adequacy and upda t i ng paymen t s
the supply of agencies in the two states is more than three times the supply of agencies that were available there in 2004, with supply exceeding 3,700 agencies in 2016.
From 2004—when 99 percent of beneficiaries lived in a ZIP code served by an HHA—to 2015, the number of agencies per 10,000 FFS beneficiaries rose 57 percent, from 2.1 to 3.3 (Table 9-4). Most of the new agencies were for profit. However, supply varies significantly among states. In 2015, Texas averaged 9.9 agencies per 10,000 beneficiaries, while New Jersey averaged less than 1 agency per 10,000 beneficiaries. The extreme variation demonstrates that the number of providers is a limited measure of capacity because agencies can vary in size; for example, in New Jersey, the average agency provided 3,136 episodes compared with 342 episodes per agency for Texas. Also, because home health care is not provided in a medical facility, agencies can adjust their service areas as local conditions change. Even the number of employees may not be an effective metric because agencies can use contract staff to meet their patients’ needs.
Episode growth increased slightly in 2015, halting several years of decline
Episode volume reversed the recent trend of utilization decline with a small increase of 0.3 percent in 2015, or about 17,000 episodes. Though overall volume declined from 2012 to 2014, this decline was preceded by a period of rapid growth (Figure 9-2 and Table 9-5). Between 2002 and 2011, total episodes increased by 67 percent from 4.1 million episodes to 6.9 million episodes. The decline since 2011 has been concentrated in a few states, with five states (Florida, Illinois, Louisiana, Tennessee and Texas) accounting for most of the decline in episodes. However, utilization in these five states more than doubled in the
of services. The review also examines quality of care, access to capital, and the relationship between Medicare’s payments and providers’ costs. Overall, the Medicare payment adequacy indicators for HHAs are positive.
Beneficiaries’ access to care: Almost all beneficiaries live in an area served by home health care Supply and volume indicators show that almost all beneficiaries have access to home health services. In 2015, over 99 percent of beneficiaries lived in a ZIP code served by at least one HHA, 97.5 percent lived in a ZIP code served by two or more HHAs, and 86 percent lived in a ZIP code served by five or more agencies. These findings are consistent with our prior reviews of access.5
Supply of providers: Agency supply surpasses previous peak
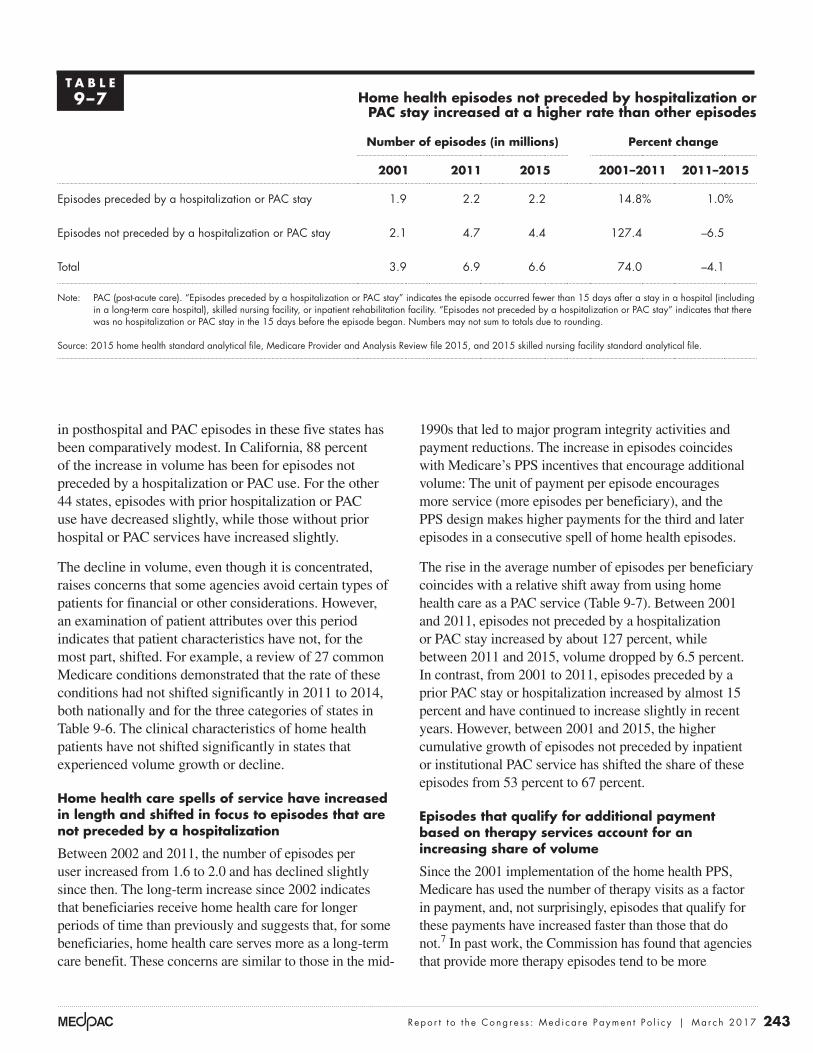
Since 2004, the number of HHAs in Medicare has increased by over 4,600 agencies, totaling 12,346 agencies in 2015 (Table 9-4). The number of agencies declined slightly in 2015 relative to the prior year, but even with this decline, nationwide the number of agencies is now higher than the previous peak in the 1990s when supply exceeded 10,900 agencies.
The decline was concentrated in Texas and Florida, states that experienced higher than average increases in supply in prior years. These states have been targeted by a myriad of antifraud measures, including criminal investigations and moratoriums on the entry of new agencies in some parts of the two states. The number of agencies exiting the program has increased in recent years in these states, and the moratorium has likely stopped the entry of new agencies. Even with the declines in these states, however,
T A B L E9–4 Number of participating home health agencies increased
significantly from 2004 to 2014, but declined slightly in 2015
Percent change
2004 2008 2012 2014 2015 2004–2014 2014–2015
Active agencies 7,651 9,787 12,311 12,461 12,346 63% –0.9%Number of agencies per
10,000 FFS beneficiaries 2.1 2.8 3.3 3.3 3.3 57 –0.7
Note: FFS (fee-for-service). “Active agencies” includes all agencies operating during a year, including agencies that closed or opened.
Source: CMS’s Provider of Service file and 2016 annual report of the Boards of Trustees of the Medicare trust funds.

241 Repo r t t o t h e Cong r e s s : Med i ca r e Paymen t P o l i c y | Ma r ch 2017
Cumulative change in home health episode volume since 2002 for different groups of states
Note: “Five states with largest decline in volume since 2011” include Florida, Illinois, Louisiana, Tennessee, and Texas.
Source: MedPAC analysis of home health standard analytic file from CMS.
Title here....Cum
ula
tive
change
(in p
erce
nt)
Note: Note and Source are in InDesign.
Source:
0
20
40
60
80
100
120
140
160
20152014201320122011201020092008200720062005200420032002
Notes about this graph:• Data is in the datasheet. Make updates in the datasheet.• I deleted the years from the x-axis and put in my own.• I had to manually draw tick marks and axis lines because they kept resetting when I changed any data.• The dashed line looked ok here, so I didn’t hand draw it.• I can’t delete the legend, so I’ll just have to crop it out in InDesign.• Use direct selection tool to select items for modification. Otherwise if you use the black selection tool, they will reset to graph default when you change the data.• Use paragraph styles (and object styles) to format.
FIGURE1-XX
All states
5 states with largest decline in volume since 2011
45 other states
F IGURE9–2
T A B L E9–5 Fee-for-service home health care services have increased significantly since 2002
Percent change
2002 2010 2011 2012 2013 2014 20152002–2014
2014–2015
Home health users (in millions) 2.5 3.4 3.4 3.4 3.4 3.4 3.5 37.3% 0.9%
Share of beneficiaries using home health care 7.2% 9.4% 9.4% 9.2% 9.2% 9.1% 9.1% 25.8 1.1
Episodes (in millions): 4.1 6.8 6.9 6.7 6.7 6.6 6.6 60.2 0.3Per home health user 1.6 2.0 2.0 2.0 1.9 1.9 1.9 17.7 –0.6Per FFS beneficiary 0.12 0.19 0.19 0.18 0.18 0.17 0.17 48.1 0.4
Payments (in billions) $9.6 $18.4 $18.4 $18.0 $17.9 $17.7 $18.1 84.4 2.3Per home health user 3,803 5,679 5,347 5,247 5,156 5,156 5,225 35.6 1.3Per home health episode 2,645 3,084 2,916 2,900 2,896 2,908 2,965 12.1 1.9Per FFS beneficiary 274 540 504 484 476 468 478 70.5 2.4
Note: FFS (fee-for-service). Percent change is calculated on numbers that have not been rounded; payment per episode excludes low-utilization payment adjustment cases.
Source: MedPAC analysis of home health standard analytical file.

242 Home hea l t h c a r e s e r v i c e s : A s s e s s i ng paymen t adequacy and upda t i ng paymen t s
2002 to 2011 period, higher than in most other areas (Figure 9-2, p. 241).
The changes in average payment per full episode (defined as comprising more than four visits) underscore the limited impact of the PPACA rebasing policy that was implemented in 2014.6 Average payment per episode increased in the first two years of rebasing, and average payment per episode in 2015, the second year of rebasing, was 2.3 percent higher than average payment per episode in 2013, before rebasing was implemented (Table 9-5, p. 241). The growth is even more remarkable since Medicare implemented additional reductions during this period, such as reductions for changes in coding practices. As the Commission has noted in the past, agencies have been successful in increasing payment through higher reported case-mix severity, without incurring the higher costs that higher severity should incur. If the trend continues, it is likely that average payment per episode in 2017, the last year of rebasing, will be higher than in 2013.
The decline in home health utilization between 2011 and 2014 reflects changes in both the demand for home health services and the supply of agencies. The number of hospital discharges, a common source of referrals, has declined since 2009, mitigating the demand for post-acute services. The period has also seen relatively low growth in economy-wide health care spending. In addition, several actions have been taken to curb fraud, waste, and abuse in Medicare home health care. The Department of Justice
and other enforcement agencies have launched a number of investigative efforts that scrutinize Medicare home health agencies. CMS has implemented moratoriums on new agencies in several areas that have seen rapid growth in supply and utilization, including Florida, Illinois, and Texas. In 2011, Medicare implemented a PPACA requirement that physicians have a face-to-face encounter with the beneficiary for home health services to be covered.
The decline in volume since 2011 has not been uniform across the country (Table 9-6). Since 2011, Florida, Illinois, Louisiana, Tennessee, and Texas (the five states with the fastest growing volume before 2011) have seen a decline of about 15.8 percent compared with an increase in volume of 24.8 percent in California. The remaining 44 states have seen 0.6 percent growth. This variation across states emphasizes that many areas continue to see growth despite the overall drop in volume since 2011. The volume decrease in areas that have been targeted by program integrity efforts suggests that these efforts can address excessive or unwarranted services, and the expansion of these efforts to other areas with excessive growth rates is appropriate.
The types of episodes that have declined and increased also vary by region. Over 90 percent of the decline in Florida, Louisiana, Illinois, Tennessee, and Texas has been for episodes that are not preceded by a hospitalization or post-acute care (PAC) use. The decline
T A B L E9–6 Changes in volume have varied among states since 2011
Number of episodes (in millions)
Change in the number of episodes
(in millions) 2011–2015
Percent change
2011–20152011 2015
All states 6.9 6.6 –0.3 –4.1%
California 0.4 0.6 0.1 24.8
5 states with highest home health volume growth in 2002–2011 2.6 2.2 –0.4 –15.8
All other states 3.8 3.8 * 0.6
Note: “Five states with highest home health volume growth in 2002–2011” include Florida, Illinois, Louisiana, Tennessee, and Texas. Yearly figures presented in the table are rounded, but figures in the change columns were calculated using unrounded data. *Increased by fewer than 100,000 episodes.
Source: Home health standard analytical file, Medicare Provider and Analysis Review file, and skilled nursing facility standard analytical file for 2011 and 2015.
243 Repo r t t o t h e Cong r e s s : Med i ca r e Paymen t P o l i c y | Ma r ch 2017
1990s that led to major program integrity activities and payment reductions. The increase in episodes coincides with Medicare’s PPS incentives that encourage additional volume: The unit of payment per episode encourages more service (more episodes per beneficiary), and the PPS design makes higher payments for the third and later episodes in a consecutive spell of home health episodes.
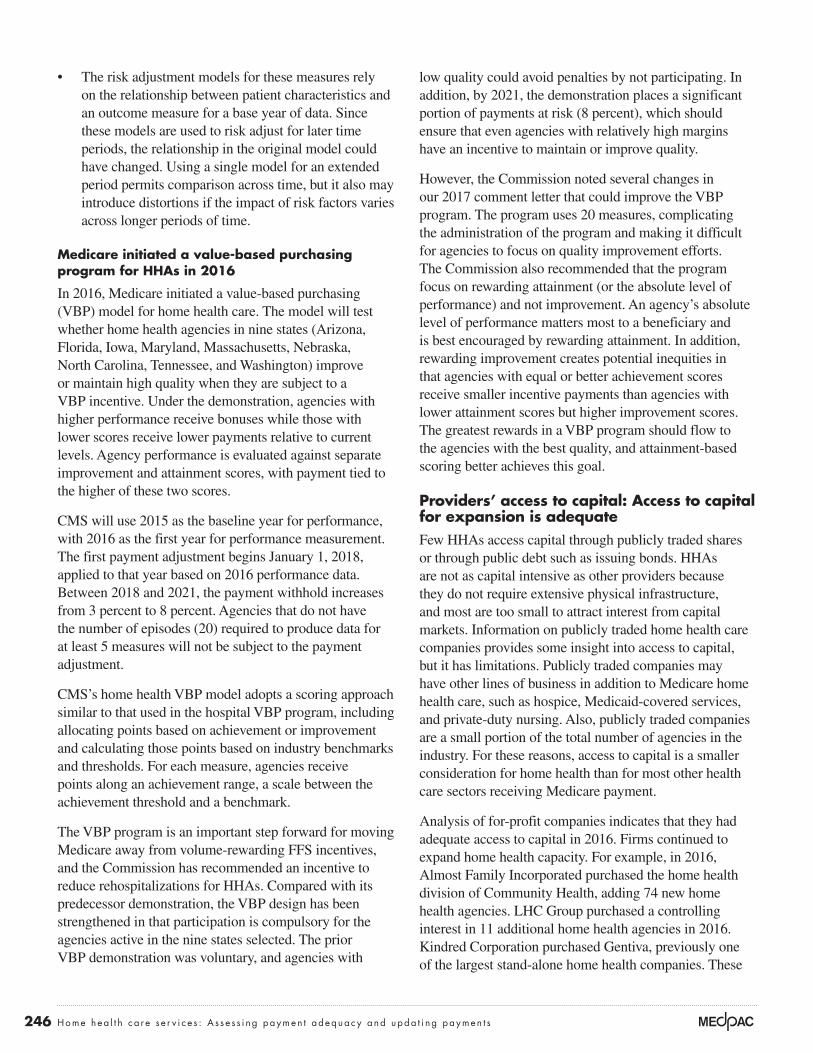
The rise in the average number of episodes per beneficiary coincides with a relative shift away from using home health care as a PAC service (Table 9-7). Between 2001 and 2011, episodes not preceded by a hospitalization or PAC stay increased by about 127 percent, while between 2011 and 2015, volume dropped by 6.5 percent. In contrast, from 2001 to 2011, episodes preceded by a prior PAC stay or hospitalization increased by almost 15 percent and have continued to increase slightly in recent years. However, between 2001 and 2015, the higher cumulative growth of episodes not preceded by inpatient or institutional PAC service has shifted the share of these episodes from 53 percent to 67 percent.
Episodes that qualify for additional payment based on therapy services account for an increasing share of volume
Since the 2001 implementation of the home health PPS, Medicare has used the number of therapy visits as a factor in payment, and, not surprisingly, episodes that qualify for these payments have increased faster than those that do not.7 In past work, the Commission has found that agencies that provide more therapy episodes tend to be more
in posthospital and PAC episodes in these five states has been comparatively modest. In California, 88 percent of the increase in volume has been for episodes not preceded by a hospitalization or PAC use. For the other 44 states, episodes with prior hospitalization or PAC use have decreased slightly, while those without prior hospital or PAC services have increased slightly.
The decline in volume, even though it is concentrated, raises concerns that some agencies avoid certain types of patients for financial or other considerations. However, an examination of patient attributes over this period indicates that patient characteristics have not, for the most part, shifted. For example, a review of 27 common Medicare conditions demonstrated that the rate of these conditions had not shifted significantly in 2011 to 2014, both nationally and for the three categories of states in Table 9-6. The clinical characteristics of home health patients have not shifted significantly in states that experienced volume growth or decline.
Home health care spells of service have increased in length and shifted in focus to episodes that are not preceded by a hospitalization
Between 2002 and 2011, the number of episodes per user increased from 1.6 to 2.0 and has declined slightly since then. The long-term increase since 2002 indicates that beneficiaries receive home health care for longer periods of time than previously and suggests that, for some beneficiaries, home health care serves more as a long-term care benefit. These concerns are similar to those in the mid-
T A B L E9–7 Home health episodes not preceded by hospitalization or
PAC stay increased at a higher rate than other episodes
Number of episodes (in millions) Percent change
2001 2011 2015 2001–2011 2011–2015
Episodes preceded by a hospitalization or PAC stay 1.9 2.2 2.2 14.8% 1.0%
Episodes not preceded by a hospitalization or PAC stay 2.1 4.7 4.4 127.4 –6.5
Total 3.9 6.9 6.6 74.0 –4.1
Note: PAC (post-acute care). “Episodes preceded by a hospitalization or PAC stay” indicates the episode occurred fewer than 15 days after a stay in a hospital (including in a long-term care hospital), skilled nursing facility, or inpatient rehabilitation facility. “Episodes not preceded by a hospitalization or PAC stay” indicates that there was no hospitalization or PAC stay in the 15 days before the episode began. Numbers may not sum to totals due to rounding.
Source: 2015 home health standard analytical file, Medicare Provider and Analysis Review file 2015, and 2015 skilled nursing facility standard analytical file.

244 Home hea l t h c a r e s e r v i c e s : A s s e s s i ng paymen t adequacy and upda t i ng paymen t s
oversight requirements. However, despite these efforts, the share of episodes qualifying for additional payment because of therapy use continues to increase. Under the current PPS, additional therapy visits increase payments once six or more visits are provided in an episode, and the share of these episodes increased between 2008 and 2015 from 37 percent to 46 percent. In 2016, CMS announced it was developing a new home health case-mix system that ends the use of therapy visits provided as a payment factor, as well as several other changes intended to improve the system. The new system would be consistent with the
profitable. The higher profitability and rapid growth in the number of these episodes suggest that financial incentives are causing agencies to favor therapy services when possible. In 2011 and 2016, the Commission recommended that Medicare eliminate the use of the number of therapy visits provided in an episode as a payment factor, a recommendation that has yet to be implemented.
CMS has acknowledged the issue with therapy in the home health PPS and has made a number of efforts to address it, including lowering payments and increasing
T A B L E9–8 Most counties with the highest rates of beneficiaries using home health in 2015 were rural
Share of FFS beneficiaries using home health services
Episodes per user
Episodes per 100 FFS beneficiariesState County
National average 9.1% 1.9 17
TX Duval 37 4.4 161TX Brooks 30 4.2 126TX Willacy 27 3.9 105TX Jim Hogg 27 4.2 114TX Jim Wells 26 4.0 103TX Zapata 24 3.9 95LA East Carroll 24 3.9 94OK Choctaw 24 4.0 95TX Starr 24 3.8 91MS Claiborne 22 2.3 52OK Coal 22 3.0 67FL Miami-Dade* 21 2.2 47OK Greer 21 3.2 67TX Falls* 21 3.3 70TX Webb* 21 3.9 80KY Cumberland 20 3.6 73TX Milam 20 3.3 66LA Madison 20 3.9 78
TX Baylor 20 3.3 66TX Kleberg 19 3.4 66OK Atoka 19 3.5 68
TX Wilbarger 19 3.7 71TN Hancock 19 2.9 55TX Hidalgo* 19 3.4 65MS Holmes 19 3.1 59
Note: FFS (fee-for-service). *Urban county; all others rural.
Source: MedPAC analysis of the 2015 home health standard analytical file and the 2015 Medicare denominator file.

245 Repo r t t o t h e Cong r e s s : Med i ca r e Paymen t P o l i c y | Ma r ch 2017
Quality of care: Quality measures generally held steady or improvedMedicare reports several quality measures on its Home Health Compare website, from which we obtained recent trend data (Table 9-9). The risk-adjusted rate of hospitalization during the home health stay has decreased in recent years but remains over 25 percent. In 2015, the share of patients improving in walking and transferring increased.
Like most categories of providers, the performance of HHAs varies significantly on these quality measures. For example, regarding the share of patients demonstrating improvement in walking in 2015, the values ranged from 44 percent for the agency at the 25th percentile of the distribution to 66 percent for the agency at the 75th percentile. This broad variation indicates that opportunities exist for improving performance, particularly for low-performing agencies.
Moreover, the annual data indicating improved quality should be viewed with caution:
• These data reflect agency assessment practices, which may reflect the incentive to show improved agency performance to attract patient referrals or seek financial reward for better performance. HHAs self-report these data, and some measures are difficult to independently verify.
• The functional improvement data are collected only for beneficiaries who do not have their home health care stays terminated by a hospitalization, which means that beneficiaries included in the measure are probably healthier and more likely to have positive outcomes.
Commission’s recommendation, but it is unclear when CMS plans to implement it.
Rural add-on payments are poorly targeted and most payments benefit areas that do not have low utilization
An add-on payment of 3 percent for each home health care episode provided to beneficiaries in rural areas expires in 2017. The intent of the add-on is presumably to bolster access, but the high level of utilization in many rural areas results in the poor targeting of Medicare’s per episode add-on, with most payments made to areas with higher than average utilization. For example, 77 percent of the episodes that received the add-on payments in 2015 were in rural counties with utilization higher than the median utilization for all counties. Rural counties in the lowest fifth of utilization accounted for just 2 percent of the episodes that received the rural add-on payment.
In its June 2012 report to the Congress, the Commission noted that Medicare should target rural payment adjustments to those areas that have access challenges (Medicare Payment Advisory Commission 2012). The large share of payments made to rural areas with above-average utilization does nothing to improve access to care in those areas and raises payments in markets that appear to be more than adequately served by HHAs. Some of the counties with aberrant patterns of utilization suggestive of fraud and abuse are rural; for example, 21 of the 25 top-use counties in 2015 are rural areas (Table 9-8). Higher payments in areas without access problems can encourage the entry or expanded operations of agencies that seek to exploit Medicare’s financial incentives. More targeted approaches that limit rural add-on payments to areas with access problems should be pursued.
T A B L E9–9 Average home health agency performance on select quality measures
2004 2008 2012 2013 2014 2015
Rate of hospitalization 27.7% 28.8% 27.5% 26.5% 27.8% 25.4%
Share of an agency’s beneficiaries with improvement in:Walking 35.9% 41.9% 52.5 % 54.4 % 56.0% 66.9%Transferring 49.2 48.1 48.9 50.5 51.3 63.3
Note: All data are for fee-for-service beneficiaries only and are risk adjusted for differences in patient condition among home health patients.
Source: MedPAC analysis of data provided by the University of Colorado.
246 Home hea l t h c a r e s e r v i c e s : A s s e s s i ng paymen t adequacy and upda t i ng paymen t s
low quality could avoid penalties by not participating. In addition, by 2021, the demonstration places a significant portion of payments at risk (8 percent), which should ensure that even agencies with relatively high margins have an incentive to maintain or improve quality.
However, the Commission noted several changes in our 2017 comment letter that could improve the VBP program. The program uses 20 measures, complicating the administration of the program and making it difficult for agencies to focus on quality improvement efforts. The Commission also recommended that the program focus on rewarding attainment (or the absolute level of performance) and not improvement. An agency’s absolute level of performance matters most to a beneficiary and is best encouraged by rewarding attainment. In addition, rewarding improvement creates potential inequities in that agencies with equal or better achievement scores receive smaller incentive payments than agencies with lower attainment scores but higher improvement scores. The greatest rewards in a VBP program should flow to the agencies with the best quality, and attainment-based scoring better achieves this goal.
Providers’ access to capital: Access to capital for expansion is adequateFew HHAs access capital through publicly traded shares or through public debt such as issuing bonds. HHAs are not as capital intensive as other providers because they do not require extensive physical infrastructure, and most are too small to attract interest from capital markets. Information on publicly traded home health care companies provides some insight into access to capital, but it has limitations. Publicly traded companies may have other lines of business in addition to Medicare home health care, such as hospice, Medicaid-covered services, and private-duty nursing. Also, publicly traded companies are a small portion of the total number of agencies in the industry. For these reasons, access to capital is a smaller consideration for home health than for most other health care sectors receiving Medicare payment.
Analysis of for-profit companies indicates that they had adequate access to capital in 2016. Firms continued to expand home health capacity. For example, in 2016, Almost Family Incorporated purchased the home health division of Community Health, adding 74 new home health agencies. LHC Group purchased a controlling interest in 11 additional home health agencies in 2016. Kindred Corporation purchased Gentiva, previously one of the largest stand-alone home health companies. These
• The risk adjustment models for these measures rely on the relationship between patient characteristics and an outcome measure for a base year of data. Since these models are used to risk adjust for later time periods, the relationship in the original model could have changed. Using a single model for an extended period permits comparison across time, but it also may introduce distortions if the impact of risk factors varies across longer periods of time.
Medicare initiated a value-based purchasing program for HHAs in 2016
In 2016, Medicare initiated a value-based purchasing (VBP) model for home health care. The model will test whether home health agencies in nine states (Arizona, Florida, Iowa, Maryland, Massachusetts, Nebraska, North Carolina, Tennessee, and Washington) improve or maintain high quality when they are subject to a VBP incentive. Under the demonstration, agencies with higher performance receive bonuses while those with lower scores receive lower payments relative to current levels. Agency performance is evaluated against separate improvement and attainment scores, with payment tied to the higher of these two scores.
CMS will use 2015 as the baseline year for performance, with 2016 as the first year for performance measurement. The first payment adjustment begins January 1, 2018, applied to that year based on 2016 performance data. Between 2018 and 2021, the payment withhold increases from 3 percent to 8 percent. Agencies that do not have the number of episodes (20) required to produce data for at least 5 measures will not be subject to the payment adjustment.
CMS’s home health VBP model adopts a scoring approach similar to that used in the hospital VBP program, including allocating points based on achievement or improvement and calculating those points based on industry benchmarks and thresholds. For each measure, agencies receive points along an achievement range, a scale between the achievement threshold and a benchmark.
The VBP program is an important step forward for moving Medicare away from volume-rewarding FFS incentives, and the Commission has recommended an incentive to reduce rehospitalizations for HHAs. Compared with its predecessor demonstration, the VBP design has been strengthened in that participation is compulsory for the agencies active in the nine states selected. The prior VBP demonstration was voluntary, and agencies with
247 Repo r t t o t h e Cong r e s s : Med i ca r e Paymen t P o l i c y | Ma r ch 2017
acquisitions by publicly traded companies suggest that access to capital remains adequate.
Medicare payments and providers’ costs: Payments increased and cost per episode decreased in 2015In 2015, average Medicare payments per episode increased by about 2.8 percent for freestanding agencies. Total spending increased by 2.3 percent to $18.1 billion. The average cost per episode decreased by 3.4 percent in 2015, a greater decline relative to the average annual decrease of about 0.1 percent for the last five years. Low or no cost growth has been typical for home health care, and in some years cost per episode declined. The ability of HHAs to keep costs low in most years has contributed to their high margins under the Medicare PPS.
Medicare margins increased in 2015
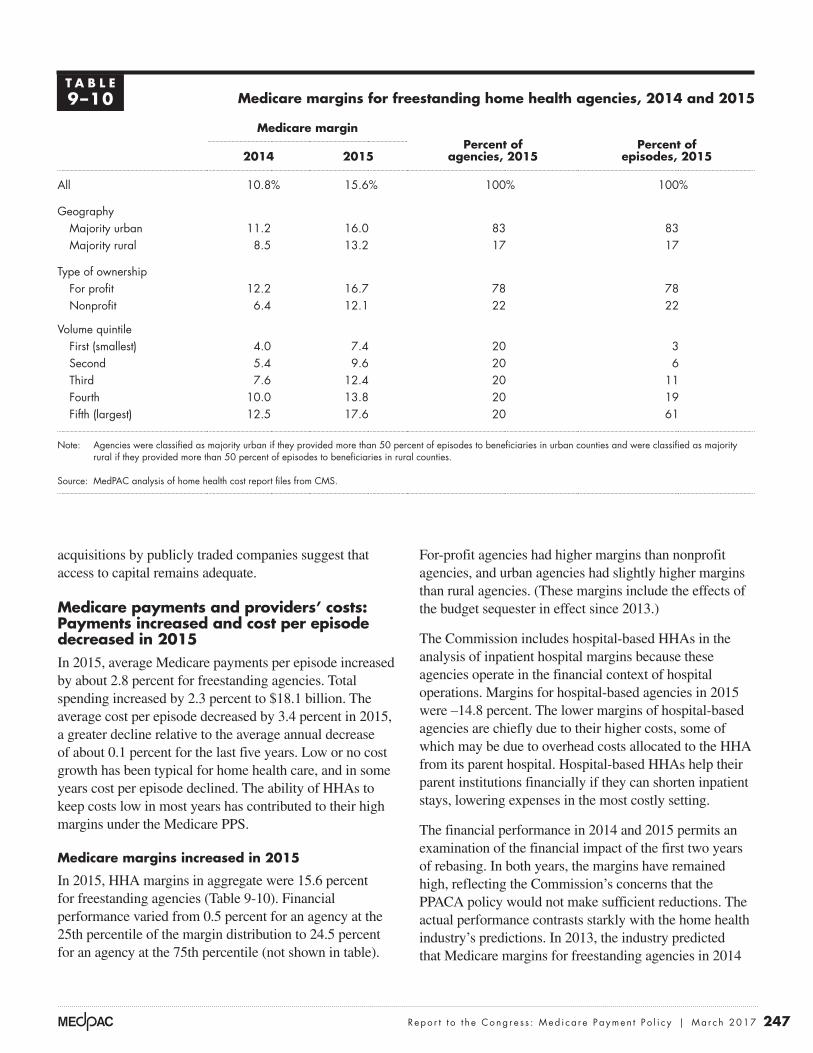
In 2015, HHA margins in aggregate were 15.6 percent for freestanding agencies (Table 9-10). Financial performance varied from 0.5 percent for an agency at the 25th percentile of the margin distribution to 24.5 percent for an agency at the 75th percentile (not shown in table).
For-profit agencies had higher margins than nonprofit agencies, and urban agencies had slightly higher margins than rural agencies. (These margins include the effects of the budget sequester in effect since 2013.)
The Commission includes hospital-based HHAs in the analysis of inpatient hospital margins because these agencies operate in the financial context of hospital operations. Margins for hospital-based agencies in 2015 were –14.8 percent. The lower margins of hospital-based agencies are chiefly due to their higher costs, some of which may be due to overhead costs allocated to the HHA from its parent hospital. Hospital-based HHAs help their parent institutions financially if they can shorten inpatient stays, lowering expenses in the most costly setting.
The financial performance in 2014 and 2015 permits an examination of the financial impact of the first two years of rebasing. In both years, the margins have remained high, reflecting the Commission’s concerns that the PPACA policy would not make sufficient reductions. The actual performance contrasts starkly with the home health industry’s predictions. In 2013, the industry predicted that Medicare margins for freestanding agencies in 2014
T A B L E9–10 Medicare margins for freestanding home health agencies, 2014 and 2015
Medicare marginPercent of
agencies, 2015Percent of
episodes, 20152014 2015
All 10.8% 15.6% 100% 100%
GeographyMajority urban 11.2 16.0 83 83Majority rural 8.5 13.2 17 17
Type of ownershipFor profit 12.2 16.7 78 78Nonprofit 6.4 12.1 22 22
Volume quintileFirst (smallest) 4.0 7.4 20 3Second 5.4 9.6 20 6Third 7.6 12.4 20 11Fourth 10.0 13.8 20 19Fifth (largest) 12.5 17.6 20 61
Note: Agencies were classified as majority urban if they provided more than 50 percent of episodes to beneficiaries in urban counties and were classified as majority rural if they provided more than 50 percent of episodes to beneficiaries in rural counties.
Source: MedPAC analysis of home health cost report files from CMS.

248 Home hea l t h c a r e s e r v i c e s : A s s e s s i ng paymen t adequacy and upda t i ng paymen t s
(Table 9-11). The cost measure was on a per episode basis, adjusted for risk (patient’s health status) and local wages; the quality measure was risk adjusted and counted hospitalizations. Our approach categorized an HHA as relatively efficient if the agency was in the lowest (best) third on at least one measure (either low cost per episode or a low hospitalization rate) and was not in the highest (worst) third of either measure for three consecutive years (2012 to 2014). About 15 percent of agencies met these criteria in this period.
In 2014, relatively efficient agencies compared with other HHAs had median margins that were about 9 percentage points higher, a median hospitalization rate that was 8 percentage points lower, and a median cost per visit that was 11 percent lower. Relatively efficient HHAs provided more episodes but 1.6 fewer visits per episode. The mix of nursing, therapy, aide, and social services visits did not differ significantly between relatively efficient and other HHAs. Efficient providers tended to provide fewer episodes in rural areas and had a lower share of episodes admitted from the community.
Medicare margins remain high in 2017In modeling 2017 payments and costs, we incorporate policy changes that will go into effect between the year of our most recent data, 2015, and the year for which we are making the margin projection, 2017. The major changes are:
• rebasing payment changes of –0.5 percent in 2016 and –0.1 percent in 2017 (the net impact of the PPACA rebasing adjustments, partially offset by the payment updates for each year);
• coding adjustments of –0.97 percent in 2016 and 2017 consistent with CMS’s policy;
• assumed nominal case-mix growth of 0.5 percent in 2016 and 2017;
• 3 percent add-on for episodes provided in rural areas in 2016 and 2017; and
• assumed episode cost growth of 0.5 percent per year.
On the basis of these policies and assumptions, the Commission projects a margin of 13.7 percent in 2017. This projection assumes that the budget sequester of 2 percent remains in effect through 2017.
The Commission has revised its assumptions for projecting margins based on our experience last year. In
would be 4.96 percent and 0.96 percent in 2015. These are significantly lower than the actual performance of 10.8 percent and 15.6 percent, respectively.
Marginal profits
Another consideration in evaluating the adequacy of payments is to assess whether providers have a financial incentive to increase the number of Medicare beneficiaries they serve. In considering the financial incentive to treat more Medicare patients, the provider compares the marginal revenue it will receive (i.e., the Medicare payment) with its marginal costs—that is, the costs that vary with volume. If Medicare payments are larger than the marginal costs of treating an additional beneficiary, a provider has a financial incentive to increase its volume of Medicare patients. In contrast, if marginal payments do not cover the marginal costs, the provider may have a disincentive to admit Medicare beneficiaries. To operationalize this concept, we compare payments for Medicare services with marginal costs, which is approximated as:
Marginal profit = (payments for Medicare services – (total Medicare costs – fixed building and equipment costs)) /Medicare payments
On average, the marginal profit for HHAs was approximately 18.1 percent in 2015. These HHAs can generate profit from additional volume, indicating they have a financial incentive to serve more Medicare beneficiaries.
Relatively efficient HHAs serve patients similar to all other HHAs’ patients
Across all health care sectors, the Commission follows two principles when selecting a set of efficient providers. First, the providers must do relatively well across cost and quality metrics. Second, the performance has to be consistent, meaning that the provider cannot have poor performance on any metric over a three-year period. The Commission’s approach is to develop a set of criteria and then examine how many providers meet them. It does not establish a set share of providers to be considered efficient and then define criteria to meet that pool size.
We examined the quality and cost efficiency of freestanding HHAs to identify a cohort that demonstrated better performance on these metrics relative to its peers

249 Repo r t t o t h e Cong r e s s : Med i ca r e Paymen t P o l i c y | Ma r ch 2017
How should Medicare payments change in 2018?
Our review of the Medicare home health benefit indicates that access is more than adequate in most areas and that Medicare payments are substantially in excess of costs. On the basis of these findings, the Commission has concluded that home health payments need to be significantly reduced. In addition to payment adequacy, the Commission is concerned that the current payment system
the 2016 March report to the Congress, we estimated that margins for 2016 would equal 8.8 percent, almost half of the actual margin we report for 2015 in this year’s report. Margins in 2015 increased approximately 5 percentage points because of a 3.4 percent decrease in costs and 2.3 percent increase in payment per episode. The Commission does not assume that these trends are sustainable; thus, for projecting margins in 2017, we have assumed nominal case-mix growth of 0.5 percent a year and estimated annual cost growth of 0.5 percent a year.
T A B L E9–11 Performance of relatively efficient home health agencies in 2014
Provider characteristics AllRelatively efficient
providersAll other providers
Number of agencies 4,443 668 3,775Share of for-profit agencies 87% 75% 89%
Median:
Medicare margin 9.8% 17.5% 8.6%Hospitalization during stay and following 30 days (rate) 24.7% 18.2% 26.0%Cost per visit, standardized for wages $143 $130 $146
Patient severity case-mix index 0.98 1.04 0.97
Visits per episode
Average visits per episode 17.3 16.0 17.6
Share of visits by type
Skilled nursing visits 53% 55% 52%
Aide visits 10% 8% 11%
MSS visits 1% 1% 1%
Therapy visits 36% 37% 35%
Size (number of 60-day payment episodes)
Median 484 536.5 470
Mean 2,036 1,182 2,187
Share of episodes
Low-use episode 8% 10% 8%
Outlier episode 2% 2% 2%
Community-admitted episodes 68% 56% 71%
Share of episodes provided to rural beneficiaries 16% 5% 18%
Note: MSS (medical social services). Sample includes freestanding agencies with complete data for three consecutive years (2012–2014). A home health agency is classified as relatively efficient if it is in the best third of performance for quality or cost and is not in the bottom third of either measure for three consecutive years. Low-use episodes are those with 4 or fewer visits in a 60-day episode. Outlier episodes are those that received a very high number of visits and qualified for outlier payments. Community-admitted episodes are those episodes that were not preceded by a hospitalization or prior post-acute care stay.
Source: Medicare cost reports and standard analytic file.
250 Home hea l t h c a r e s e r v i c e s : A s s e s s i ng paymen t adequacy and upda t i ng paymen t s
relies on a series of visit-number thresholds that increase payments beginning with 6 or more therapy visits and topping out at 20 visits per episode. Increasing the number of therapy visits increases payments significantly, sometimes by hundreds of dollars for a single additional visit. A Senate Finance Committee investigation of the therapy management practices of publicly traded home health companies concluded that CMS needs to eliminate the therapy thresholds in the home health PPS (Committee on Finance 2011). The continued use of these thresholds distorts the incentives of the payment system and distracts HHAs from focusing on patient needs and characteristics when delivering services. CMS has developed a new case-mix system that does not use therapy visits as a factor, and this recommendation would direct the Congress to establish a deadline for implementing this change.
The distributional effects of implementing a revised PPS would generally decrease payments for agencies that provide relatively more therapy episodes and raise it for those that provide fewer of these services. The Commission estimates that a revised PPS would increase payments for nonprofit HHAs by 4.8 percent and increase them for hospital-based HHAs by 3.9 percent. Payments would fall by 2.1 percent for for-profit HHAs and by 0.8 percent for freestanding HHAs. In general, payments would be redistributed from agencies that have higher than average margins to those with lower than average financial performance.
Because the current rural add-on payment is poorly targeted and most of the funds are paid to rural areas with high utilization levels, we conclude that the add-on should not be extended. Overall margins for rural providers were 13.2 percent, indicating that, like urban providers, on average these HHAs are paid well in excess of costs and generally do not need an additional subsidy. The untargeted higher payments in all rural areas do not create value for the beneficiary or the taxpayer. Future efforts to address the needs of rural areas should identify specific access problems and develop targeted policies that focus on the identified problems. The design of the current rural add-on payment does not fulfill this principle, and extending the policy appears unwarranted and inefficient.
I M P L I C A T I O N S 9
Spending
• The recommendation would lower payments by $750 million to $2 billion in 2018 and by more than $10 billion in 2018 to 2022.
provides a financial incentive for agencies to favor therapy services when delivering care. Though PPACA includes a provision intended to lower payments, the reductions under this provision are modest, and substantial margins for many agencies are likely to remain, particularly those that are efficient or focus on higher paying services.
R E C O M M E N D A T I O N 9
The Congress should reduce home health payment rates by 5 percent in 2018 and implement a two-year rebasing of the payment system beginning in 2019. The Congress should direct the Secretary to revise the prospective payment system to eliminate the use of the number of therapy visits as a factor in payment determinations, concurrent with rebasing.
R A T I O N A L E 9
The data for 2015, the second year of rebasing under PPACA, indicate that Medicare continues to overpay for home health care and will likely continue to do so unless additional reductions are made. Under current policy, it appears likely that the average payment per episode in 2017 will be higher than the average payment in effect before rebasing. While the PPACA rebasing has restrained the increase in home health payments, the margins for 2015 and projected margin for 2017 indicate that payments will be substantially greater than costs unless significant additional reductions occur.
An immediate reduction of 5 percent in 2018 would represent a significant action to address the magnitude of the overpayments embedded in Medicare’s rates. Subsequently, CMS should implement a revised rebasing beginning in 2018. Under the rebasing policy, CMS would assess the average margins of home health agencies in the most recent year of data available (using audited cost reports to the extent feasible) and reduce payments in 2019 and 2020. The experience of the PPACA rebasing indicates that the continued updating of payments using the market basket update has undermined the goal of lowering payments, and a revised policy should not include these updates. In determining the amount by which to reduce payments, CMS could also use information on the costs of efficient providers, not just the average provider, since data suggest that efficient providers can deliver adequate service for lower costs. With these adjustments, payments should be better aligned with costs compared with current policy.
The recommendation also calls for an end to the use of the number of therapy visits as a payment factor in the PPS when rebasing begins in 2019. The current system

251 Repo r t t o t h e Cong r e s s : Med i ca r e Paymen t P o l i c y | Ma r ch 2017
• The removal of therapy visits as a payment factor would be redistributive, after accounting for the effects of the recommendation mentioned above to reduce payments. The Commission estimates that a revised PPS would increase payments for nonprofit HHAs by 4.8 percent and decrease them by 2.1 percent for for-profit agencies. Payments would rise by 3.9 percent for facility-based home health agencies and fall by 0.8 percent for freestanding agencies. ■
Beneficiary and provider
• The payment reductions would lower payments for all providers. The elimination of therapy thresholds would redistribute payments among providers, generally raising payments for providers that furnish therapy less frequently, and lowering them for providers that deliver relatively more therapy. Lowering payments should not affect providers’ willingness to deliver appropriate home health care. Beneficiary access should not be adversely affected, and it should be improved for patients requiring nontherapy care.

252 Home hea l t h c a r e s e r v i c e s : A s s e s s i ng paymen t adequacy and upda t i ng paymen t s
1 The Balanced Budget Act of 1997 ended coverage of home health care for the sole purpose of venipuncture services.
2 The rate is risk adjusted and excludes hospitalizations that were not planned in advance or part of a normal course of treatment (for instance, organ transplant).
3 Surety bond firms review an HHA’s organizational and financial integrity and agree to cover the Medicare obligations, up to a set amount, for those agencies that the surety bond firm believes are low risk. A surety bond covers liabilities that occur when an agency does not repay funds it owes Medicare (for example, when an agency is found to have improperly billed for services) (Government Accountability Office 1999). Requiring a surety bond would prevent Medicare participation by agencies that a surety firm judges to be high risk.
4 Under preclaims review, agencies must submit records establishing a beneficiary’s eligibility for home health services before sending a final claim requesting payment. Medicare has committed to reviewing these submissions within 10 days of receipt. If CMS’s review affirms a patient’s eligibility for services, the agency may proceed with billing for the episode. If the submission does not contain sufficient information for an affirmative finding, the agency may submit additional information. An agency may submit a final claim for payment after services have been rendered, even if it does not have an
affirmative preclaims review decision, but the claim will be subject to the full postpayment medical review process. If an agency submits a final claim for payment without an attempt at preclaim review, the claim will undergo prepayment review. After the first three months of the start of the demonstration in each state, final payment will be reduced by 25 percent for any claim that did not have a successful preclaim review.
5 As of November 2016, our measure of access is based on data collected and maintained as part of CMS’s Home Health Compare database. The service areas listed are postal ZIP codes where an agency has provided services in the past 12 months. This definition may overestimate access because agencies need not serve the entire ZIP code to be counted as serving it. At the same time, the definition may understate access if HHAs are willing to serve a ZIP code but did not receive a request in the previous 12 months. The analysis excludes beneficiaries with unknown ZIP codes.
6 Medicare makes a case-mix-adjusted 60-day episode payment when more than 4 visits are provided. Episodes with four or fewer visits (low-utilization episodes) are paid on a per visit basis.
7 Between 2008 and 2015, episodes with six or more therapy visits, which qualify for additional payments, increased by 4.4 percent a year, compared with 1.0 percent a year for home health utilization overall.
Endnotes

253 Repo r t t o t h e Cong r e s s : Med i ca r e Paymen t P o l i c y | Ma r ch 2017
Benjamin, A. E. 1993. An historical perspective on home care policy. Milbank Quarterly 71, no. 1: 129–166.
Cheh, V., N. Duda, B. L. Carlson, et al. 2007. Evaluation of the Home Health Independence Demonstration: Barriers to a successful experiment were multifaceted and difficult policy issues remain. Prepared for the Centers for Medicare & Medicaid Services. Princeton, NJ: Mathematica Policy Research, Inc. October.
Committee on Finance, United States Senate. 2011. Staff report on home health and the Medicare therapy threshold. 112th Congress, 1st Session S. PRT. 2011 112–24. Report prepared by the staff of the Committee on Finance, United States Senate. Committee print.
Feder, J., and J. Lambrew. 1996. Why Medicare matters to people who need long-term care. Health Care Financing Review 18, no. 2 (Winter): 99–112.
Government Accountability Office. 1999. Medicare home health agencies: Role of surety bonds in increasing scrutiny and reducing overpayments. HEHS–99–23. Washington, DC: GAO.
Government Accountability Office. 1996. Medicare: Home health utilization expands while program controls deteriorate. GAO/HEHS–96–16. Washington, DC: GAO.
McCall, N., J. Korb, A. Petersons, et al. 2004. Decreased home health use: Does it decrease satisfaction? Medical Care Research and Review 61, no. 1 (March): 64–88.
McCall, N., A. Petersons, S. Moore, et al. 2003. Utilization of home health services before and after the Balanced Budget Act of 1997: What were the initial effects? Health Services Research 38, no. 1 part 1 (February): 85–106.
Medicare Payment Advisory Commission. 2014. Report to the Congress: Impact of home health payment rebasing on beneficiary access to and quality of care. Washington, DC: MedPAC.
Medicare Payment Advisory Commission. 2012. Report to the Congress: Medicare and the health care delivery system. Washington, DC: MedPAC.
Medicare Payment Advisory Commission. 2011. Report to the Congress: Medicare payment policy. Washington, DC: MedPAC.
Medicare Payment Advisory Commission. 2010. Report to the Congress: Medicare payment policy. Washington, DC: MedPAC.
Medicare Payment Advisory Commission. 2004. Report to the Congress: Medicare payment policy. Washington, DC: MedPAC.
Office of Inspector General, Department of Health and Human Services. 2001. The physician’s role in Medicare’s home health services. OEI–02–00–00620. Washington, DC: OIG.
Office of Inspector General, Department of Health and Human Services. 1997. Review of Medicare home health services in California, Illinois, New York, and Texas. A–04–99–01994. Washington, DC: OIG.
Wolff, J., A. Meadow, C. Weiss, et al. 2008. Medicare home health and the role of physicians. Presentation at Academy Health, Medicare and Post-Acute Care. June 8.
References
