home | journal of engineering research
TRANSCRIPT

Journal of Engg. Research Vol. 8 No. (3) September 2020 pp. 31-49
»dF « j dN ÁUO ∫Z UF w Ë√ VO d ÷u rOLB dO UF
s («b d�U V «u **Ë dOC bL ÕUH *‚«dF « ¨…dB « ¨…dB « WF U ¨W bMN « WOK ¨WO b*« W bMN « r w b U –U √*
‚«dF « ¨…dB « ¨…dB « WF U ¨—U « ÂuK WOK w b U ”—b **
W�ö)«
w D « ‚u ÊU d'« ‰bF qLA WOLOLB dO UF vK ÁUO*« W'UF UD w WO Ë_« VO d « ÷«u √ rOLB bL F
rOLB bM UN W UM*« rOI « —UO « VFB w U U Ë dO UF*« Ác rO b b% w WI U « U «—b « nK ÆÀuJ*« s “Ë
VO d ÷u( WOLOLB « dO UF*« rO b b% v ≈ W «—b « Ác ·bN ÆÂU)« ÁUO*« —bB hzUB) ÎUI Ë w Ë√ VO d ÷u
ÍœU VO d W d& Êu L Ë Èb ≈ sLC w d& qL ¡«d ≈ - ·bN « «c oOI Æ»dF « j dN ÁUO Z UF w Ë√
qLF « «c ZzU «b « - Æ¡U*« w WI UF « ULO '« Âu l “u qOK% Êu ö Ë WF Ë ©…d Ô œ«u «b « ÊËb ®
VO d « ÷u( W dEM «Ë WOKFH « «¡UHJ U rN öF ÀuJ*« s “Ë w D « ‚u ÊU d'« ‰bF rO b b w d «
w « Èd _« —UN _«Ë »dF « j dN ÁUO W'UF* w Ë√ VO d ÷u «b « Ê√ W «—b « Ác ZzU X {Ë√ Æw Ë_«
Ê√ VKD %50 “ËU …¡UHJ d ËdJO ©20.9-7.4® Èb*« vK ÕË«d jO u « U dD WI U W K� ULO vK Íu %
ÆW U 12.3 s d √ ÀuJ*« s “ WLO Ë Âu Ø Â 0.5 s q √ w D « ‚u ÊU d'« ‰bF WLO ÊuJ

Design criteria for presedimentation basin treats: Shatt Al-Arab River water 32
Design criteria for presedimentation basin treats: Shatt Al-Arab River water
Kifah M. Khudair* and Kawakib N. Abdulhasen**
*Assistant Professor, Civil Eng. Dep., College of Eng., Univ. of Basrah, Basrah City, Iraq. **Assistant Lecturer, College of Marine Sciences, Univ. of Basrah, Basrah City, Iraq. *Corresponding Author:
Submitted: 15/08/2018Revised: 19/02/2020Accepted: 25/05/2020
ABSTRACTThe design of presedimentation basins is based on design criteria including surface overflow rate and detention
time. The previous studies differ in specifying the criteria values, and, subsequently, it is difficult to choose the suitable ones according to raw water source characteristics. The aim of this study is to specify the design criteria values for presedimentation basin treating the water of Shatt Al-Arab River. To satisfy this aim, experimental work was conducted including 51 plain sedimentation experiments and 37 particle size distribution analyses. The work results were used to determine the values of surface overflow rate and detention time in terms of actual and theoretical efficiencies of presedimentation basin. The study results indicated that, to use a presedimentation basin in treating the water of Shatt Al-Arab River and other rivers, which have suspended solids with d50 values varying over the range (7.4-20.9) μm at efficiency exceeding 50%, the surface overflow rate must be less than 0.5 m/day and the detention time must be greater than 12.3 hr.
Keywords: Design criteria; Detention time; SOR; Pre-sedimentation basins; Shatt Al-Arab river.
INTRODUCTIONThe clarity of the rivers all over the world is varied due to the difference in types and concentration of suspended
solids present in their water. Turbidity is a measure of water clarity; the light penetration through the water decreases with the increase of suspended solids quantity, thus, more turbidity (Iqbal et al., 2010). The turbid water is aesthetically unattractive and harmful when it is consumed (Rangwala, 1982). So, water treatment plants are required to purify water from suspended solids and other undesirable impurities (Alnasrawi, 2015). The most widely applied water treatment processes train includes a combination of some or all of presedimentation, chemical coagulation, flocculation, sedimentation, filtration, disinfection, and sludge processing (Schulz & Okun, 1992). Presedimentation is a preliminary treatment process used to remove large suspended particles from the raw water by gravitation and natural aggregation of the settling particles (Punmia et al., 2005; Hendricks, 2011). Presedimentation basin is required when the raw water is containing sand, silt, or turbidity in excess of 1000 NTU (HDR Engineering Inc., 2001) or when it is desired to reduce coagulants demand and subsequently the cost of water treatment (Schulz & Okun, 1992).
Generally, the design of sedimentation basins is governed by two basic criteria (Schulz & Okun, 1992): (1) detention time and (2) surface overflow rate (SOR). Detention time is a theoretical time taken by water particle to pass between the entry and exit of the sedimentation basin. SOR is, numerically, the flow rate of water divided by the plan area of settling basin. Physically, it represents the settling velocity of slowest settling particle, which is 100% removed. All influent particles, which settle at velocities equal to or greater than the SOR, will be entirely removed, while those that

33Kifah M. Khudair and Kawakib N. Abdulhasen
settle at lower velocities will be removed directly proportional to the ratio of their settling velocity to SOR, assuming that they are uniformly distributed upon entering the basin (McGhee, 1991).
The selection of appropriate design criteria values for a proposed sedimentation basin must be done after knowing the characteristics of suspended solids present in the water source. Overdesign of sedimentation basins leads to not only unnecessary capital expenditure, but also water wastage in the form of excessive sludge (Al-Sammarraee et al., 2009), whereas underdesign can produce settling process with low removal efficiency of suspended solids. Thus, it is important to select the appropriate design criteria values of sedimentation basins to ensure their proper performance.
In Basrah Governorate, south of Iraq, all the water treatment plants draw their raw water, mainly, from Shatt Al-Arab River. They apply a water treatment train starting in coagulation process and ending in disinfection process. Recently, it is required to construct presedimentation basins in some of Basra water treatment plants. To design these basins, it is necessary to select the appropriate design criteria values. This selection is very difficult due to the lack of suspended solids data of Shatt Al-Arab River water and the wide ranges of available presedimentation basin design criteria. Table 1 presents a review of presedimentation basins design criteria values.
Table 1. Review of design criteria of presedimentation basins.
Detention time (hr.) SOR (m/day) Ref.
6-169a
(Smethurst, 1979)18b 24c
4-8 12-18 (Rangwala, 1982)3-8 - (McGhee, 1991)
0.5-3 20-80 (Schulz and Okun, 1992)≥ 3 - (Hammer and Hammer, 2001)3-4 15-30 (Punmia et al., 2005)- ≤ 86 (Hendricksr, 2006)
3-4 15-30 (Duggal, 2008)≥ 3 - (Harmmer et al., 2009)
0.1-0.25 200-400 (Crittenden et al., 2012)a for bad condition.b for easy condition.c for good condition.
It can be noticed from Table 1 that the values of detention time and SOR vary over the ranges (0.1-16) hr. and (9-400) m/day, respectively. This indicates wide differences in design criteria values with no guide for selecting the appropriate ones, excluding the remarks indicated by Smethurst (1979).
It can be shown from the above that the design criteria values of presedimentation basins are cited in previous studies without giving attention to the characteristics of suspended solids in the water source. Thus, there is no guide for selecting the appropriate design criteria values according to the suspended solids characteristics. The main aim of this study is to specify the design criteria values for presedimentation basin treating the water of Shatt Al-Arab River considering the characteristics of suspended solids in this river. The specified values can be applied in designing presedimentation basins treating the water of other rivers with the condition of similarity in suspended solids characteristics.

Design criteria for presedimentation basin treats: Shatt Al-Arab River water 34
MATERIALS AND METHODSTheory of suspended particles settling
Settling of suspended particles in presedimentation basins, which are not preceded by coagulation- flocculation process, is of Class-I. In this class, there is no change in the shape, size, or weight of discrete particles (do not form aggregates) (Duggal, 2008). Also, in this class, the plain sedimentation discussed by Newton’s law for discrete spherical particle is satisfied (Lee, 2007).
Newton’s law describes the sedimentation of discrete spherical particles, from which the terminal settling velocity is equal to (McGhee, 1991)
(1)
where ρs and ρw are the density of particle and water (kg/m3), respectively, d is the diameter of suspended solid particle (m), g is acceleration due to gravity (m/sec2), Cd is dimensionless drag coefficient, and Vs is terminal settling velocity (m/sec). In Equation 1, the drag coefficient incorporates the effect of flow pattern on settling velocity of suspended particles. The value of Cd depends on the magnitude of Reynolds number (Re) for settling particles (McGhee, 1991; Duggal, 2008; Crittenden et al., 2012). For spherical particles, Re is defined as
(2)
where v is kinematic viscosity of water, m2/sec, which depends on water temperature. For Re ≤ 0.5, Cd is defined as (McGhee, 1991)
(3)
while, for 0.5 < Re < 1000, Cd is defined as (McGhee, 1991)
(4)
The substitution of Equation 3 into Equation 1 gives Stokes’ equation for settling velocity:
(5)
Plain sedimentation basins efficiencyFor actual suspension of particles with a considerable variety of sizes and densities, prediction of plain sedimentation
basin efficiency requires a particle size distribution. Based on particle size distribution, a settling velocity cumulative frequency distribution curve can be plotted. Since all particles with settling velocity equal to or greater than SOR will be removed, then the fraction of all removed particles (theoretical efficiency of plain sedimentation basin) will be (McGhee, 1991).
(6)
In Equation 6, Xs represents the fraction of particles of settling velocity (Vs) less than SOR, (1-Xs) is the fraction of particles of Vs ≥ SOR, and the integral is the fraction of particles with Vs < SOR, which are removed in the settling tank. Thus, to predict the theoretical efficiency of plain sedimentation basins, the following procedure is adopted:
35Kifah M. Khudair and Kawakib N. Abdulhasen
Analyze the size distribution of suspended solid particles in raw water.1.
Calculate the settling velocity for each particle size using Equation 1 or 5, based on Reynolds number. 2.
Plot settling velocity cumulative frequency distribution curve.3.
Select the SOR value.4.
Determine the fraction of particles with settling velocity less than SOR (X5. S).
Calculate the theoretical efficiency of sedimentation basin using Equation 6.6.
The actual efficiency of sedimentation basins depends primarily on water turbidity (or suspended solids concentration) in influent and effluent of sedimentation basin and can be calculated using the following equation;
(7)
where Fm is measured fraction of removed turbidity (measured or actual efficiency) and Turbinf and Turbeff are influent and effluent water turbidity values (NTU), respectively.
Experimental workThe aim of experimental work is to (1) analyze the size distribution of suspended solid particles present in Shatt Al
Arab River water and (2) study the performance of plain sedimentation basin treats this water. The raw water samples of Shatt Al-Arab River, each of 530-liter volume, were collected from a depth of 2.5 to 3m below the water surface using a pump.
Particles size distribution analysis
The size distribution of suspended solid particles is required for estimating settling velocity of these particles and the theoretical efficiency of plain sedimentation basins. In this study, thirty-seven water samples were analyzed for suspended solid particles size distribution using Mastersizer 2000 instrument in sediments laboratory of Geology Department/ College of Science/ Basrah University. The Mastersizer has been designed to measure the size of suspended solid particles within a range of (0.02-2000) μm, or specifically the distribution of different particles size within a water sample. It works using the optical bench to capture the actual light scattering pattern from a field of particles. Then, it calculates the size of particles that created this pattern using Mie theory (Malvern Instruments Ltd, 2007).
Plain sedimentation experiments
Fifty-one plain sedimentation experiments were conducted in the hydraulic laboratory of Civil Engineering Department/ College of Engineering/ Basrah University. A plain sedimentation rig was used in these experiments, and it is composed of (a) sedimentation tank, (b) feed tank, (c) electrical pump, and (d) flow meter; see Figures 1 and 2. The sedimentation tank is rectangular Perspex tank divided into inlet, settling, and outlet sections. The inlet section has clear dimensions of 14cm width, 60cm length, and 40cm depth. This section receives the raw water through the inlet pipe and passes it to the settling section through an underflow weir. The settling section has clear dimensions of 60cm width, 120cm length, and 25cm depth. In this section, plain settling of suspended solid particles occurs. A drain opening is installed at the bottom of the settling section for draining the tank at the end of each experiment. From the settling section, the water is flowing to the outlet section over an outlet weir. This section has clear dimensions of 15cm width, 60cm length, and 40cm depth. At the base of this section, an effluent pipe is installed from which the settled water samples are collected.
During each plain sedimentation experiment, turbidity of raw (influent) and settled (effluent) waters and influent water temperature and flowrate were measured. The turbidity was measured using turbidity meter type TurbiDirect, Lovibond. The influent and effluent turbidity values were used to calculate the actual efficiency of plain sedimentation

Design criteria for presedimentation basin treats: Shatt Al-Arab River water 36
basin, and the temperature was used to specify the water viscosity, which affects the settling velocity of solid particles. The influent flowrate data was used for calculating the SOR and detention time values using the following equations:
(8)
(9)
where t is the detention time (hr.), Q is the influent flowrate (m3/hr.), V is water volume in the settling section (m3), SOR is surface overflow rate (m/day), and A is the surface area of settling section (m2).
Figure 1. Two prespectives of plain sedimentation rig.
Figure 2. Schematic diagram of plain sedimentation rig.

37Kifah M. Khudair and Kawakib N. Abdulhasen
RESULTS AND DISCUSSIONParticle size distribution
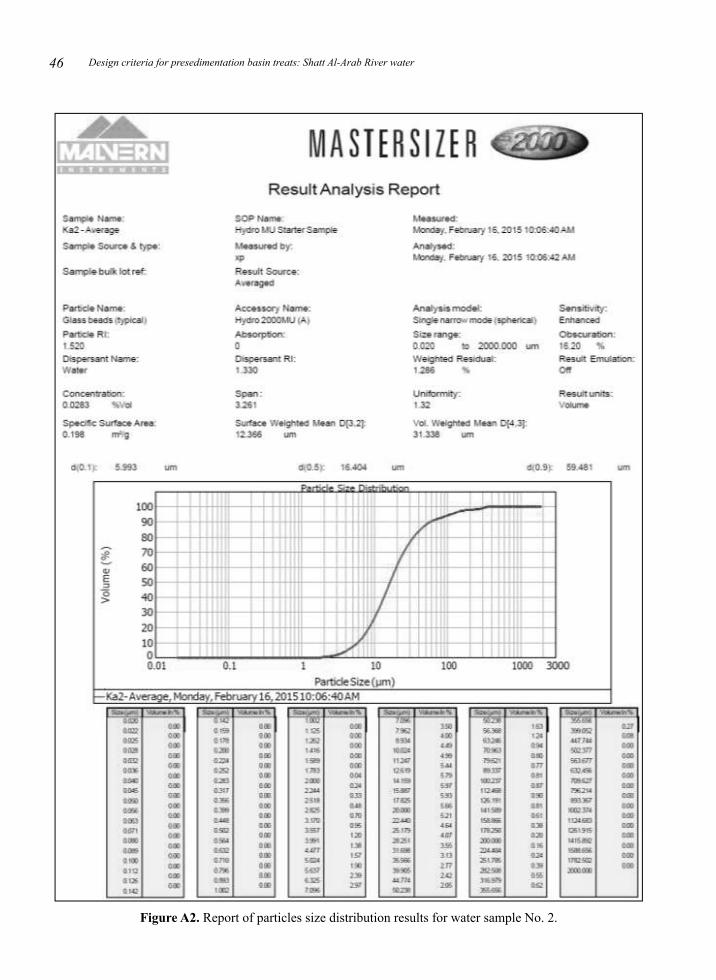
This section presents the results of suspended solid particles size distribution analysis conducted for 37 raw water samples of Shatt Al-Arab River using Malvern Mastersizer instrument. For each sample, the results include the relation between cumulative volume fraction and suspended particle size in plot and tabulated formats. They, also, include d10, d50 and d90 for suspended solid particles, where d10, d50 and d90 values indicate that 10, 50, and 90% of the particles measured were smaller than or equal to the size stated. Examples of particles size distribution analysis reports are presented for water sample Nos.1 to 3 in Figures 1A to 3A, Appendix-A. The complete analysis results of suspended particles size distribution for Shatt Al-Arab River water have shown that the size of these particles varied over the range (1.4-1096.5) μm, and the ranges of d10, d50, and d90 values were (2.8-8.1), (7.4-20.9), and (12.8-324.7) μm, respectively. The results of median particles size (d50) reflected that the suspended solid particles in Shatt Al-Arab River appear to be relatively fine when compared with those present in other rivers that have values of d50 ranging from <1μm to 100 μm (Walling et al., 2000). The results of particles size distribution were used to calculate the percentages of clay, silt, and sand, i.e., the texture of these particles. That was done with the referring to Wentworth grade scale for particle size classification (Bartram and Ballance, 1996). The obtained percentages of clay, silt, and sand are varied over the ranges (2.5-31.0) %, (52.5-94.5) %, and (0.0-16.5) %, respectively. The mean values of clay, silt, and sand percentages were 13.2%, 81.6%, and 5.2%, respectively. This result indicates that the suspended solids in Shatt Al-Arab River water are mainly composed of silt.
Cumulative distribution of particles settling velocityTo calculate the theoretical percent of suspended solids removal, plotting of settling velocity cumulative
distribution curve is required. Based on the results of suspended solids particles size distribution for each sample of Shatt Al-Arab River water, the settling velocity of each particle size was calculated adopting Newton’s or Stokes’ equation (Equations 1 or 5). By knowing the settling velocity of each particle size, the relation between settling velocity and volume fraction of cumulative particles with settling velocity less than indicated was plotted. Figure 3 shows a settling velocity cumulative distribution curves for samples Nos.1 to 6. The curves in this figure indicate that large volume fraction of suspended solids has low values of settling velocity. That is due to the fine size of suspended solid particles present in Shatt Al-Arab River water. The curves of Figure 3 are replotted for settling velocity up to 0.1 mm/sec to make them useful for determining the theoretical percentage of suspended solids removal as shown in Figure 4. The same graphs were developed for the remaining water samples.
Theoretical efficiency of presedimentation basinTheoretical efficiency values of presedimentation basin treating the water of Shatt Al-Arab River were calculated
with the aid of settling velocity cumulative distribution curves adopting different SOR values. Appendix-B presents an example for F determination if SOR equals 0.75m/day. Then, the relationship between the theoretical efficiency and SOR was plotted for each of the 37 samples. Figure 4 shows the relationships for samples Nos.1 and 2 as examples.

Design criteria for presedimentation basin treats: Shatt Al-Arab River water 38
Sample No.1(a) Sample No.2(b)
Sample No.3(c) Sample No.4(d)
Sample No.5(e) Sample No.6(f)
Figure 3. Settling velocity cumulative distribution curves for six water samples.

39Kifah M. Khudair and Kawakib N. Abdulhasen
Sample No.1(a) Sample No.2(b)
Sample No.3(c) Sample No.4(d)
Sample No.5(e) Sample No.6(f)
Figure 4. Settling velocity (up to 0.1mm/sec) cumulative distribution curves for six water samples.

Design criteria for presedimentation basin treats: Shatt Al-Arab River water 40
Sample No.1(a) Sample No.2(b)
Figure 5. Theoretical efficiency versus SOR for water sample Nos. 1 and 2.
To derive a unified equation for describing the relation between the theoretical efficiency of presedimentation basin treating the water of Shatt Al-Arab River and SOR (measured in m/day), the data of theoretical efficiency versus SOR obtained for 33 water samples were plotted on the same graph as shown in Figure 6. Regression analysis showed that theoretical efficiency is correlated well with SOR with a correlation coefficient R2 of 0.9244 (Figure 6). Therefore, the theoretical efficiency of presedimentation basin can be estimated as follows:
(10)
Figure 6. Theoretical efficiency of presedimentation basin treats the water of Shatt Al-Arab River versus SOR.
To incorporate the effect of d50 into the relation of F versus SOR, F (%) to d50 ratio was plotted versus SOR as shown in Figure 7. The relation between F/d50 to SOR is best represented by a power equation of the form
(11)
Equation 11 can be used to determine SOR after specifying d50 value for the suspended solids in the water source and the required efficiency of presedimentation basin, where d50 is specified by analyzing the size distribution of suspended particles.

41Kifah M. Khudair and Kawakib N. Abdulhasen
Figure 7. Theoretical efficiency to d50 ratio versus SOR.
Measured efficiency of presedimentation basinThe actual efficiency of presedimentation (plain sedimentation) basin treating the water of Shatt Al-Arab River
was obtained from the results of plain sedimentation experiments presented in Table C1, Appendix-C. From these results, the values of SOR and detention time were determined using Equations 8 and 9, respectively, whereas the values of measured efficiency (percent of turbidity removal) were determined using Equation 7. Then, the relationships between measured efficiency (Fm) and SOR and Fm and detention time (t) were plotted as shown in Figures 8 and 9, respectively. Figure 8 shows that Fm increases with the decrease of SOR, and the relation between them is best represented (R2=0.7964) by a power equation of the following form:
(12)
where SOR is measured in m/day. Figure 9 shows that Fm increases with the increase of detention time, and the relation between them is best represented (R2=0.7964) by a power equation of the following form:
(13)
Figure 8. Measured efficiency versus SOR. Figure 9. Measured efficiency versus detention time.
To correlate the measured efficiency (Fm), influent turbidity, (Turbinf) and SOR, the Fm to Turbinf ratio was plotted versus SOR as shown in Figure 10. The relation between Fm/Turbinf and SOR is best represented by the following equation:

Design criteria for presedimentation basin treats: Shatt Al-Arab River water 42
(14)
Figure 10. Measured efficiency to influent turbidity ratio versus SOR.
Comparison of theoretical and measured efficienciesTo compare the theoretical and measured efficiencies, their values were calculated for the same SOR, and their
existing and ideal relations are plotted as shown in Figure 11. The ideal relation means that the measured values match the theoretical ones. From this figure, it can be noticed that the theoretical efficiency values are greater than the measured ones, and the difference between them increases with the decrease of SOR. This can be attributed to the ignoring of the effects of detention time and horizontal flow velocity variations, due the existence of inlet and outlet, in calculating the theoretical efficiency values. Also, the low measured efficiency values may be due to the use of experimental settling basin, which has a length to width ratio of (2:1), and it was shown by Tay (1986) that settling tanks with higher length/width ratio would have better clarification efficiency. The relation between measured and theoretical efficiencies is best represented by Equation 15. This equation is valid for presedimentation basin treating the water of Shatt Al-Arab River and has length to width ratio of 2:1.
(15)
Figure 11. Measured efficiency versus theoretical efficiency for presedimentation tank treating the water of Shatt Al-Arab River.

43Kifah M. Khudair and Kawakib N. Abdulhasen
Design Criteria of Presedimentation BasinThe results of plain sedimentation experiments and particles size analysis were used to develop the appropriate
values of SOR and detention time. In this study, the appropriate values of design criteria for a presedimentation basin treating the Shatt Al-Arab River water are defined as those producing efficiency values of presedimentation basin not less than 50%. To find these values, Equations (10), (12), and (13) are rewritten as
(16)
(17)
(18)
The substitution of an efficiency value of 50% into Equations 16 and 17 gives SOR values of 2.25 and 0.49 m/day, respectively, whereas the substitution of the same efficiency value into Equation 18 gives t value of 12.3hr. Thus, if it is required to use presedimentation basin to treat the water of Shatt Al Arab, the appropriate design criteria are
SOR≤0.5 m/day •
Detention time≥12.3 hr.•
The above design criteria were selected based on worst condition, i.e., by treating the water in a rectangular presedimentation tank having length to width ratio of 2:1. For the best condition, the maximum SOR value is 2.25m/day. The developed design criteria values were compared with those given in Table 1. The comparison results show that the determined value of detention time approaches to some given values, but the SOR value is lower than the lowest value given in Table 1, which is 9m/day. This can be attributed to the existing of fine size of suspended solids in Shatt Al-Arab River water. It is important to mention here that the developed values of design criteria can be applied for designing presedimentation tanks to treat other water sources if the suspended solids in these sources are fine with median size (d50) varying over the range of (7.4-20.9) μm.
CONCLUSIONSThe following were concluded from this study:
Using regression analysis of experimental results, power functions were put to determine the following:1.
SOR in terms of theoretical efficiency of presedimentation basins.a-
SOR in terms of actual efficiency of presedimentation basins.b-
Detention time in terms of actual efficiency of presedimentation basins.c-
Theoretical efficiency to medium size of suspended particles ratio in terms of SOR. d-
Actual efficiency of presedimentation basin to influent water turbidity ratio in terms of SOR.e-
The size of suspended particles in water of Shatt AL-Arab River varied over the range (1.4-1096.5) μm, and 2. the ranges of d10, d50, and d90 values were (2.8-8.1), (7.4-20.9), and (12.8-324.7) μm, respectively.
To use presedimentation basin for treating the water of Shatt Al-Arab River (or other rivers with the same 3. characteristics of suspended solids) at efficiency exceeding 50%, the design criteria are
SOR≤ 0.5m/day.a.
Detention time≥ 12.3 hr.b.
Design criteria for presedimentation basin treats: Shatt Al-Arab River water 44
ACKNOWLEDGMENTOur sincere appreciation is forwarded to all the staff of sediments laboratory of Geology Department/ College of
Science/ Basrah University and Al-Garma and Al- Robatt water treatment plants.
REFERENCESAlnasrawi, F.A.M. 2015. Modeling of Hussain City Water Treatment Plant in holly Karbala governorate (HCWTP). International
Journal of Advanced Research, Vol.3, Issue 1, pp.144-155.
Al-Sammarraee, M., Chan, A., Salim, S.M. & Mahabaleswar, U.S. 2009. Large-eddy simulations of particle sedimentation in a longitudinal sedimentation basin of a water treatment plant. Part I: particle settling performance. Chemical Engineering Journal, Vol.152, Issues 2–3, pp.307-314.
Bartram, J. & Ballance, R. 1996. Water quality monitoring; a practical guide to the design and implementation of fresh water quality studies and monitoring programs, 1st Ed., United Nations Environment Program and the World Health Organization, p.396.
Crittenden, J.C., Trussell, R.R., Hand, D.W., Howe, K.J. & Tchobanoglous, G. 2012. Water treatment principles and design, 3rd Ed., John Wiley and Sons Inc., p.1901.
Duggal, K.N. 2008. Elements of environmental engineering, S. CHAND and company LTD. 7361, RAMNAGAR, New Delhi – 110055, p.440.
Hammer, M.J. & Hammer, M.J.Jr. 2001. Water and wastewater technology, 4th Ed., Prentice-Hall Inc., USA, p.536.
Harmmer, M.J., Perez, E.M., Chadik, P.A. & Viessman, Jr. 2009. Water supply and pollution control, 8th Ed., Pearson Education Inc., upper Saddle River, New Jersey, 07458, p.861.
McGhee, T. J. 1991. Water supply and sewerage, 6th Ed., McGraw -Hill Inc., p.605.
HDR Engineering Inc. 2001. Handbook of Public Water System, 2nd Ed., John Wiley and Sons, p.1152.
Hendricks, D. 2006. Water treatment unit processes physical and chemical, Taylor and Francis Group, LLC, p.1261.
Hendricks, D. 2011. Fundamentals of water treatment unit processes physical, chemical and biological, Taylor and Francis Group, LLC, p.927.
Iqbal, J., Mumtaz, M.W., Mukhtar, H., Iqbal, T., Mahmood, S. & Razaq, A. 2010. Particle size distribution analysis and physico-chemical characterization of Chenab River water at Marala head works. Pak. J. Bot., 42(2), pp.1153-1161.
Lee, C.C. 2007. Water and wastewater calculation manual, 2nd Ed., McGraw- Hill companies Inc., p.945.
Malvern Instruments Ltd. 2007. Mastersizer 2000 user manual, Malvern Instruments Ltd., England, Man 0384, Issue 1.
Punmia, B.C., Jain, As.K. & Jain, Ar.K. 2005. Water Supply Engineering. 2nd Ed., Mehra Offset press, Delhi, p.585.
Rangwala, S.G., 1982. Fundamental of Water Supply and Sanitary Engineering. 7th Ed., Chartortar Publishing House, India, p.682.
Schulz, C.R. & Okun, D.A., 1992. Surface water treatment for communities in developing countries. John Wiley and Sons Inc., p.297.
Smethurst, G. 1979. Basic Water Treatment for Application world-wide. Thomas Telford Ltd, London, p.216.
Tay, J.H. 1986. Effects of Length to Width Ratio on Hydraulic Behaviour of Settling Tank. In Arndt, R.E. A., et al., Advancements in Aerodynamics, Fluid Mechanics and Hydraulics, NewYork: American Society of Civil Engineers, pp.136-145.
Walling, D.E., Owens, P.N., Waterfall, B.D., Leeks, G.J.L. & Wass, P.D. 2000. The Particle Size Characteristics of Fluvial Suspended Sediment in the Humber and Tweed Catchments, UK. The Science of the Total Environment, Vol.251/252, pp.205-222.

45Kifah M. Khudair and Kawakib N. Abdulhasen
Appendix-AThirty-seven water samples of Shatt Al Arab River were analyzed for size distribution of suspended solid particles
using Mastersizer 2000 instrument. The report results of water sample Nos. 1 to 3, as examples, are presented in Figures A1 to A3, respectively.
Figure A1. Particles size distribution results for water sample No. 1.
Design criteria for presedimentation basin treats: Shatt Al-Arab River water 46
Figure A2. Report of particles size distribution results for water sample No. 2.

47Kifah M. Khudair and Kawakib N. Abdulhasen
Figure A3. Report of particles size distribution results for water sample No. 3.

Design criteria for presedimentation basin treats: Shatt Al-Arab River water 48
APPENDIX-BExample on Determination of Theoretical Efficiency for Presedimentation Basin
In this example, the theoretical efficiency of presedimentation basin (F) treating the water of Shatt Al Arab, represented by sample No. 22, is calculated. The calculation is performed in accordance to the procedure given below with the aid of cumulative curve of settling velocity for water sample No. 22:
Let SOR=0.75m/day (=0.0087 mm/sec).1.
From the cumulative curve of settling velocity, the fraction of suspended particles with settling velocity less 2. than SOR (Xs) (see Figure B1) is 0.56.
From the cumulative curve of settling velocity, the magnitude of 3. , as tabulated below, is 0.002068.
i ΔXi VSi (mm/sec) VSi ×ΔXi 1 0.04 0.0005 0.0000202 0.04 0.0007 0.0000283 0.04 0.0010 0.0000404 0.04 0.0014 0.0000565 0.04 0.0019 0.0000766 0.04 0.0024 0.0000967 0.04 0.0030 0.0001208 0.04 0.0035 0.0001409 0.04 0.0042 0.00016810 0.04 0.0048 0.00019211 0.04 0.0056 0.00022412 0.04 0.0065 0.00026013 0.04 0.0075 0.00030014 0.04 0.0087 0.000348
Σ 0.002068
By substituting the values of X4. s, SOR, and in Eqution 6, the value of F is
Figure B1. Cumulative distribution of particle settling velocity for sample No. 22.

49Kifah M. Khudair and Kawakib N. Abdulhasen
Appendix-CFifty-one plain sedimentation experiments were conducted in this study. The measured parameters were water
flowrate and temperature and influent and effluent turbidity. The obtained results are presented in Table C1.
Table C1. Results of plain sedimentation experiments.
Experiment No. Flowrate (l/min) Temperature (°C) Turbidity (NTU)
Influent Effluent1 1.50 18 19.3 15.42 1.50 21 19.5 15.53 1.50 17 20.6 16.34 1.50 19 22.1 17.45 1.50 20 28.2 20.76 1.50 17 39.1 27.77 1.25 18 19.1 15.38 1.25 19 21.8 17.39 1.25 18 22 17.310 1.25 20 26.2 20.511 1.25 18 26.7 20.812 1.25 17 28.6 22.213 1.00 15 17 13.714 1.00 18 18.3 14.615 1.00 18 19.7 15.616 1.00 20 21.7 17.117 1.00 19 22.4 16.718 1.00 21 30.6 21.519 1.00 21 41.6 28.820 0.75 18 18.4 13.421 0.75 18 19.4 1422 0.75 20 22.4 1623 0.75 18 26.7 1924 0.75 20 27 18.425 0.75 21 30.8 20.726 0.75 21 39.8 26.427 0.50 15 17.5 12.228 0.50 21 20 11.829 0.50 20 21 14.430 0.50 18 21.5 14.331 0.50 20 28.3 16.432 0.50 20 33.9 1933 0.375 17 20.4 14.734 0.375 19 20.4 13.635 0.375 20 20.9 13.736 0.375 19 21 13.637 0.375 17 29.3 18.938 0.375 17 32.9 2039 0.375 20 33 1840 0.30 17.5 21.6 13.241 0.30 25 23.2 1442 0.30 20 26.9 1643 0.30 23 27.5 1644 0.30 22 28.8 16.745 0.30 21 31.6 17.446 0.25 17.5 21.6 12.647 0.25 25 22.6 12.948 0.25 23 27.4 15.449 0.25 20 27.8 15.350 0.25 22 28.8 15.651 0.25 21 31 15