home office statisticalbulletin - uk government web...
TRANSCRIPT
Home Office Statistical Bulletin
The Research, Developmentand Statistics Directorate existsto improve policy making,decision taking and practicein support of the Home Officepurpose and aims, to providethe public and Parliament withinformation necessar y forinformed debate and topublish information for futureuse.
Stat is t ical Bul le t ins areprepared by staff in HomeOffice Statistics under theNational Statistics Code ofPract ice and can bedownloaded from both the UKStatistics Authority websiteand the Home Of f iceResearch, Development andStatistics website:
www.statistics.gov.ukwww.homeoffice.gov.uk/rds
© Crown Copyright 2009ISSN 1358-510X
Perceptions of crime and anti-social behaviour: Findings from the 2008/09 British Crime Survey Supplementary Volume 1 to Crime in England and Wales 2008/09
Debbie Moon (Ed.), Alison Walker (Ed.), Rachel Murphy, John Flatley, Jenny Parfrement-Hopkins and Philip Hall
November 2009 17/09
Acknowledgements
This bulletin has been prepared by staff in the Crime Surveys team which is part of the Home Office Statistics area of the Science and Research Group.
The editors and authors are grateful for the support and assistance of other colleagues in the Crime Surveys team: Bryony Green, Jacqueline Hoare, Bryce Millard, Stephen Roe and Katharine Thorpe.
We would also like to thank the staff involved in the work on the BCS at BMRB Social Research, the interviewers working on the BCS and the members of the public who kindly agreed to take part in the survey. Finally, we would also like to thank those colleagues in the Communications Development Section who assisted in preparing the report.
Copies of this and other Home Office statistical bulletins are available from the Research Development Statistics Internet site: http://www.homeoffice.gov.uk/rds/
For further information about the British Crime Survey, please email [email protected] or write to the Crime Surveys team, Home Office Statistics, 5th Floor, Peel Building, Home Office, 2 Marsham Street, London, SW1P 4DF.
This statistical bulletin is a National Statistics output produced to the highest professional standards and free from political interference. It has been produced by statisticians working in the Home Office Statistics Unit. The governance arrangements in the Home Office for statistics were strengthened on 1 April 2008 to place the statistical teams under the direct line management of a Chief Statistician, who reports to the National Statistician with respect to all professional statistical matters.
Introduction This bulletin is the first in a series of supplementary volumes that accompany the main annual Home Office Statistical Bulletin, ‘Crime in England and Wales 2008/09’ (Walker et al., 2009). These supplementary volumes report on additional analysis not included in the main annual publication. Figures included in this bulletin are from the British Crime Survey (BCS), a large, nationally representative victimisation survey of approximately 46,000 adults resident in households in England and Wales.1
Since 2001/02 the BCS has run continuously with interviewing being carried out throughout the year. Respondents are asked about their experiences of crime-related incidents in the 12 months prior to interview. BCS respondents are also asked about their attitudes towards different crime-related issues such as the police, criminal justice system, perceptions of crime and anti-social behaviour.
This bulletin presents findings from additional analyses on perceptions of crime and anti-social behaviour based on the 2008/09 BCS.
1 For more information about the BCS see http://www.homeoffice.gov.uk/rds/bcs1.html.
GUIDE TO TABLES AND FIGURES
‘No answers’ (missing values) All BCS analysis excludes don’t know/refusals unless otherwise specified.
Percentages may not add to 100 per cent due to rounding.
A percentage may be quoted in the text for a single category that is identifiable in the tables only by summing two or more component percentages. In order to avoid rounding errors, the percentage has been recalculated for the single category and therefore may differ by one percentage point from the sum of the percentages derived from the tables.
Weighting All BCS percentages presented in the tables in this bulletin are based on data weighted to compensate for differential non response. Tables show the unweighted base which represents the number of people interviewed in the specified group.
Table abbreviations
‘ints’ used as an abbreviation for ‘interviews’ and refers to BCS interviews conducted in the specified year.
‘0’ indicates less than 0.5 per cent (this does not apply when percentages are presented to one decimal point) or no response in that particular category.
‘n/a’ indicates that the BCS question was not applicable or not asked in that particular year.
‘..’ indicates that data are not reported because the unweighted base is less than 100, unless otherwise stated.
‘**’ indicates that the change is statistically significant at the five per cent level.
‘ns’ in the logistic regression model table this indicates that the change is not statistically significant at the five per cent level.
Statistical significance
BCS estimates are based on a representative sample of the population of approximately 46,000 respondents aged 16 or over each year. Any sample survey may produce estimates that differ from the figures that would have been obtained if the whole population had been interviewed. The size of this difference (known as sampling error) depends on the sample size, the size and variability of the estimate and the design of the survey.
Because of this sampling error differences between estimates from successive years of the survey or between population subgroups may occur by chance. In other words, the difference may be simply due to which adults were randomly selected for interview. We are able to measure whether this is likely to be the case using standard statistical tests. Survey results that are statistically significant at the five per cent level, according to these tests, are identified by asterisks in the tables. Only results that are statistically significant at the five per cent level are commented on within this bulletin. Where an apparent change over time is not statistically significant the figures may be described in the text as ‘stable’ or ‘similar’.
Contents
Page
Contents
List of figures and tables
Chapter 1 Public perceptions of crime .............................................................................1
Rachel Murphy and John Flatley
1.1 Summary ...................................................................................................1
1.2 Introduction.................................................................................................2
1.3 New questions on perceptions of crime in 2008/09......................................3
1.4 Perceptions of specific crime types .............................................................4
1.5 Perceptions of comparative level of crime in local area................................7
1.6 Perceptions of specific crimes by level of crime in local area ......................9
1.7 Socio-demographic differences .................................................................10
Chapter 2 Perceptions of anti-social behaviour.............................................................23
Jenny Parfrement-Hopkins and Philip Hall
2.1 Summary ..................................................................................................23
2.2 Introduction...............................................................................................24
2.3 Relationships between individual ASB strands ..........................................25
2.4 Nature of ASB...........................................................................................26
Appendix 1 Bibliography ...................................................................................................41
List of figures and tables Chapter 1
Figure 1.1 Trends in BCS crime and perceptions of changing crime levels, 1995 to 2008/09 BCS
Figure 1.2 Proportion of people who think crime has gone up by individual crime type, 2008/09 BCS
Figure 1.3 Perception of crime in local area compared to the country as a whole by Index of Multiple Deprivation (Crime Domain) level, (England only), 2008/09 BCS
Figure 1.4 Perceptions of national and local crime levels by Index of Multiple Deprivation (Crime Domain) level, (England only), 2008/09 BCS
Figure 1.5 Perception of crime in local area compared to the country as a whole by perceptions of change in local crime levels, 2008/09 BCS
Figure 1.6 Perceptions of increase in individual crime types in the local area by Index of Multiple Deprivation (Crime Domain) level, (England only), 2008/09 BCS
Table 1a Net perception gap between national and local crime levels, 2008/09 BCS
Table 1.1 Perceptions of changing crime levels by personal characteristics
Table 1.2 Perceptions of changing crime levels by household and area characteristics
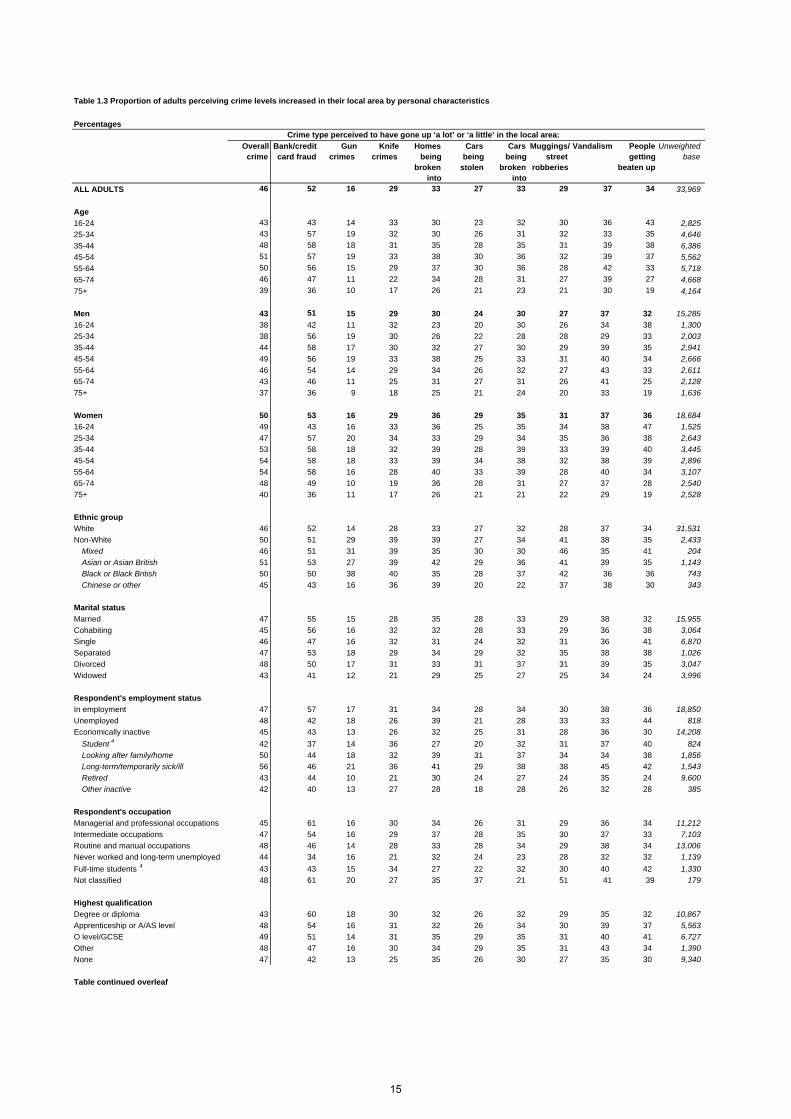
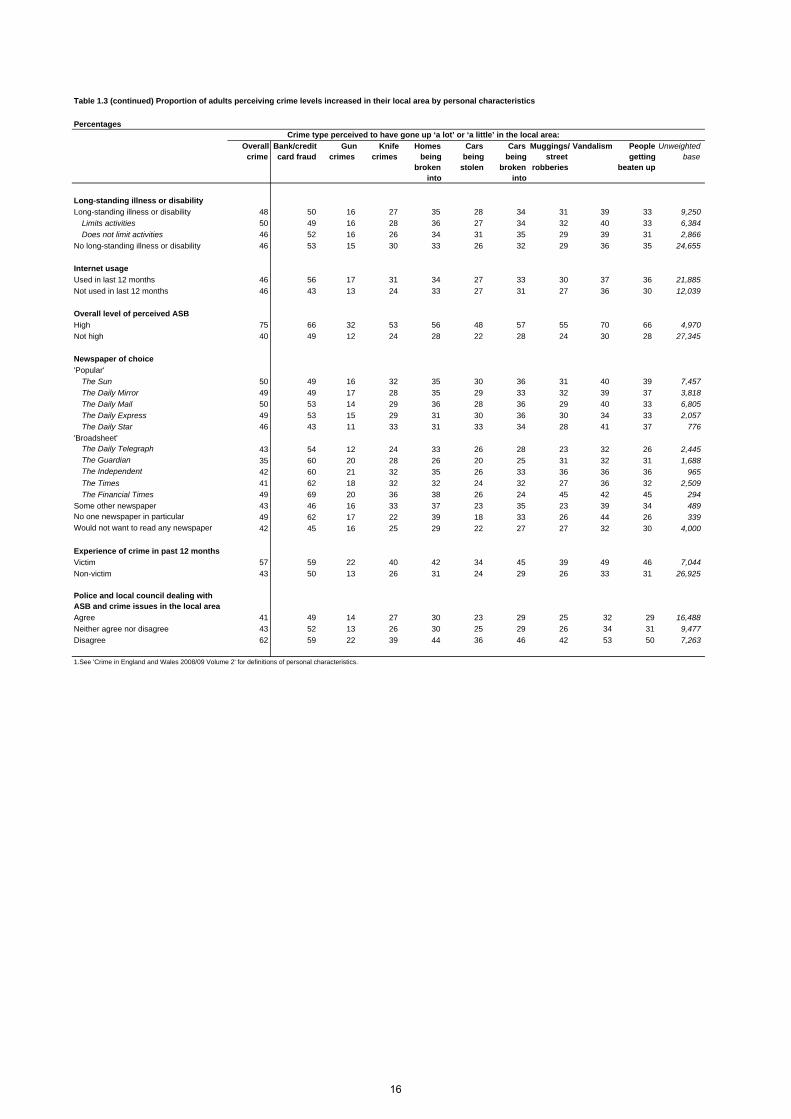
Table 1.3 Proportion of adults perceiving crime levels increased in their local area by personal characteristics
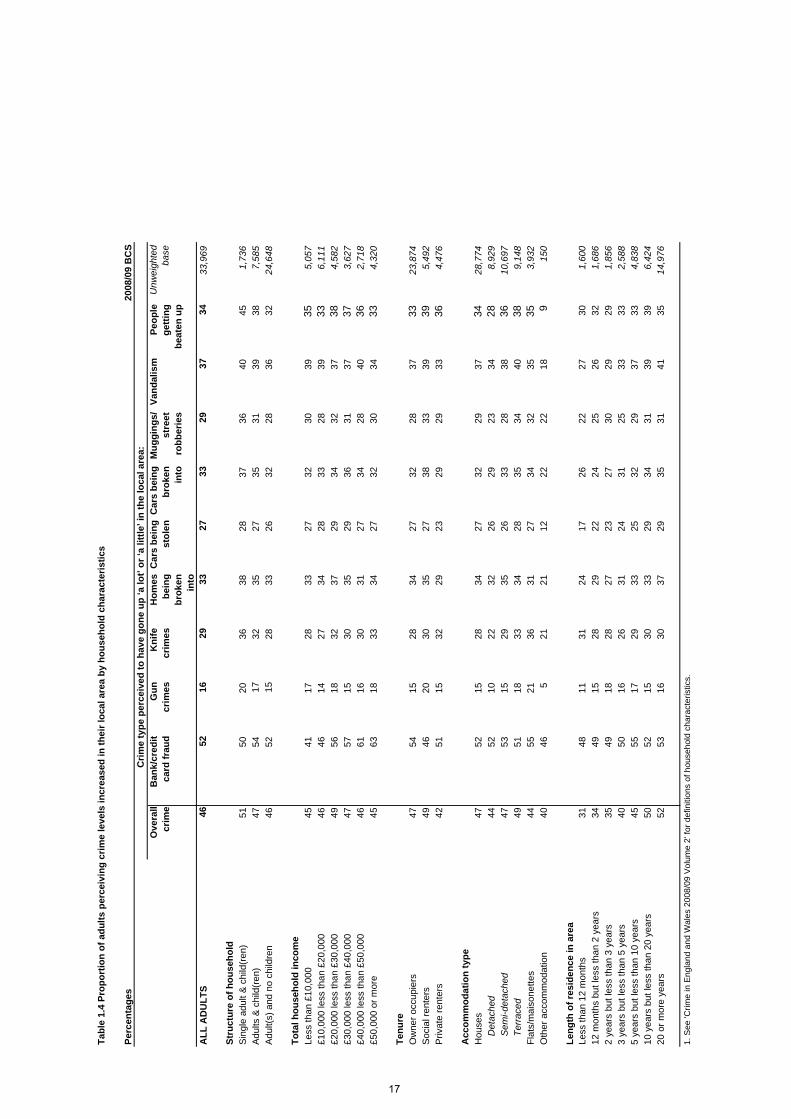
Table 1.4 Proportion of adults perceiving crime levels increased in their local area by household characteristics
Table 1.5 Proportion of adults perceiving crime levels increased in their local area by area characteristics
Table 1.6 Perception of crime in the local area, compared with the country as a whole, by personal characteristics
Table 1.7 Perception of crime in the local area, compared with the country as a whole, by household and area characteristics
Chapter 2
Figure 2.1 Number of ASB strands perceived as a problem, 2008/09 BCS
Figure 2.2 Most commonly perceived combinations of strands of ASB, for people perceiving three or more strands of ASB as a problem, 2008/09 BCS
Figure 2.3 Influences on impressions of drug use and drug dealing, 2008/09 BCS
Table 2.1 Top two most commonly reported combinations of ASB strands, by number of strands in combination
Table 2.2 Nature of behaviours experienced by those who perceive teenagers’ behaviour to be anti-social
Table 2.3 Nature of problems experienced by those who do not perceive teenagers’ behaviour to be anti-social
Table 2.4 How impressions of problem with drugs are formed, by drug use, drug dealing and those unsure which is a problem
Table 2.5 Proximity of drug use and dealing in the local area
Table 2.6 Frequency of drug use and dealing in the local area
Table 2.7 Nature of behaviours experienced by those who perceive people being drunk or rowdy to be a problem in their local area
Table 2.8 How impressions of problems with people being drunk or rowdy are formed
Table 2.9 Frequency of people being drunk or rowdy in the local area

1 Public perceptions of crime
Rachel Murphy and John Flatley
1.1 SUMMARY
This chapter presents findings from new questions added to the 2008/09 British Crime Survey (BCS) on public perceptions of crime. Previous BCS results have been used to describe two types of “perception gap”: one related to differences between what is happening nationally and in the local area; and, the second, the difference between perceptions of crime and actual crime levels.
New questions on “changes in the past few years” to crime “in the country as whole” confirmed previous findings that much higher proportions of the public think crime has been rising nationally than locally.
The perception gap between changes nationally and in the local area is greater for the more serious violent (and therefore rarer) crimes and smaller for acquisitive crimes. This suggests that personal experience is more likely to play a part in the perceptions of the more common crimes while perceptions of rarer crime types are likely to be influenced by media reporting, which tends to focus on the more violent crimes.
Analysis of new questions on specific types of crime and on perceptions of the comparative levels of crime suggests the gap between perceptions of crime and actual crime levels might not be as great as previously thought.
Analysis of small area police recorded crime data showed a clear linear relationship between actual levels of crime and perceptions of the comparative level of crime in the local area. For example, 28 per cent of those living in areas with the highest crime rates perceived they lived in a higher than average crime area compared with just one per cent of those living in the areas with the lowest crime rates.
The proportion of people perceiving increased crime levels locally tended to be higher in the areas with highest police recorded crime levels across all crime types, with the exception of bank and credit card fraud. This difference is more marked for violent (and rarer) crimes (gun crime, knife crime, muggings/street robberies, and people getting beaten up).
Perceptions of increased national crime levels were higher than perceptions of increased local crime levels across all areas. In other words, there is no relationship between perceptions of increased national crime levels and the level of crime in the area of residence, therefore the perception gap is wider for those people living in the areas with the lowest levels of recorded crime.
1
Supplementary Volume 1 to Crime in England and Wales 2008/09
1.2 INTRODUCTION
The British Crime Survey (BCS) collects a wide range of information about public perceptions of crime and related issues. Headline findings from the 2008/09 survey were reported in the annual volume ‘Crime in England and Wales 2008/09’ (Walker et al., 2009) and included first findings from a new set of questions relating to perceptions of crime. This chapter provides more detailed analysis of these new questions.
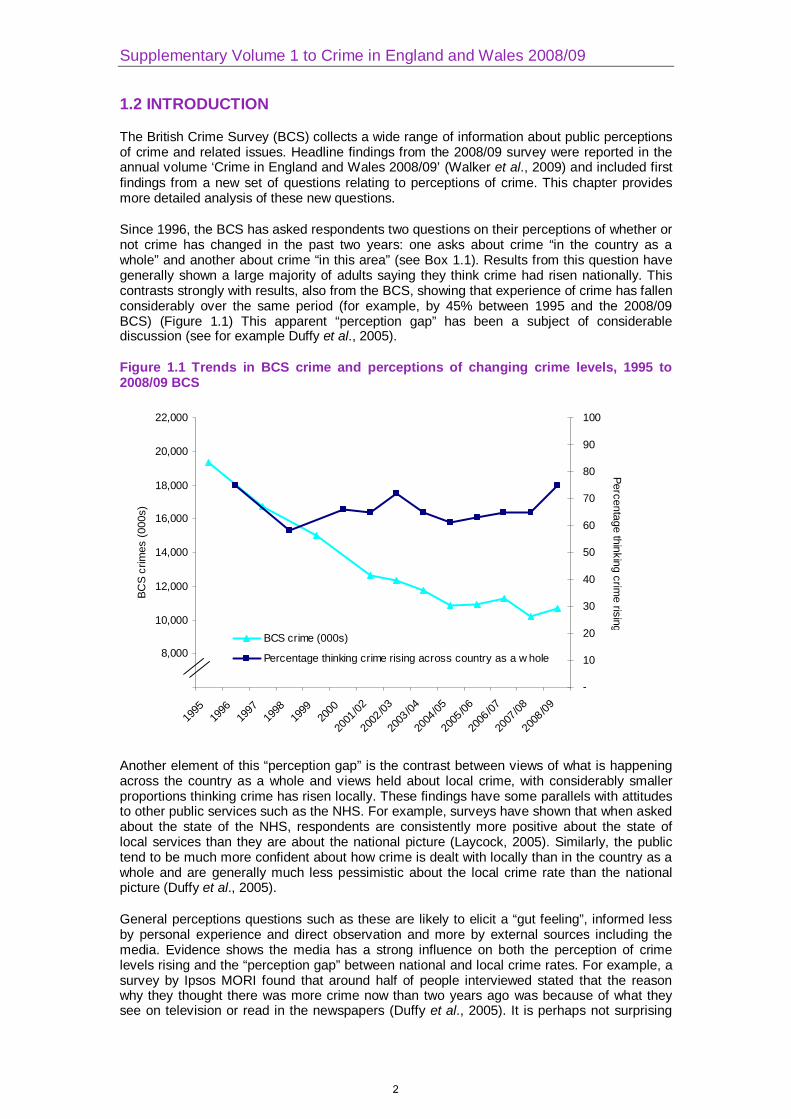
Since 1996, the BCS has asked respondents two questions on their perceptions of whether or not crime has changed in the past two years: one asks about crime “in the country as a whole” and another about crime “in this area” (see Box 1.1). Results from this question have generally shown a large majority of adults saying they think crime had risen nationally. This contrasts strongly with results, also from the BCS, showing that experience of crime has fallen considerably over the same period (for example, by 45% between 1995 and the 2008/09 BCS) (Figure 1.1) This apparent “perception gap” has been a subject of considerable discussion (see for example Duffy et al., 2005).
Figure 1.1 Trends in BCS crime and perceptions of changing crime levels, 1995 to 2008/09 BCS
6,000
8,000
10,000
12,000
14,000
16,000
18,000
20,000
22,000
1995
1996
1997
1998
1999
2000
2001
/02
2002
/03
2003
/04
2004
/05
2005
/06
2006
/07
2007
/08
2008
/09
BCS
crim
es (0
00s)
-
10
20
30
40
50
60
70
80
90
100
Percentage thinking crime rising
BCS crime (000s)
Percentage thinking crime rising across country as a w hole
Another element of this “perception gap” is the contrast between views of what is happening across the country as a whole and views held about local crime, with considerably smaller proportions thinking crime has risen locally. These findings have some parallels with attitudes to other public services such as the NHS. For example, surveys have shown that when asked about the state of the NHS, respondents are consistently more positive about the state of local services than they are about the national picture (Laycock, 2005). Similarly, the public tend to be much more confident about how crime is dealt with locally than in the country as a whole and are generally much less pessimistic about the local crime rate than the national picture (Duffy et al., 2005).
General perceptions questions such as these are likely to elicit a “gut feeling”, informed less by personal experience and direct observation and more by external sources including the media. Evidence shows the media has a strong influence on both the perception of crime levels rising and the “perception gap” between national and local crime rates. For example, a survey by Ipsos MORI found that around half of people interviewed stated that the reason why they thought there was more crime now than two years ago was because of what they see on television or read in the newspapers (Duffy et al., 2005). It is perhaps not surprising
2
Perceptions of crime and anti-social behaviour
that the general public think crime is rising when crime features so prominently in the news media. For example, extensive coverage of rarer crimes such as gun and knife-related crime may influence public thinking about “crime” in general, overwhelming messages about the considerable falls in higher-volume crime types.
One view is that the “perception gap” is evidence that the public do not believe or trust the crime statistics. However, an alternative view, based on the evidence above, is that people form their opinions without any reference to official statistics.
1.3 NEW QUESTIONS ON PERCEPTIONS OF CRIME IN 2008/09
To better understand public perceptions of crime, a new set of questions was included in the 2008/09 BCS. This comprised an alternative form of the questions on perceptions of change in national and local crime levels, an additional set of questions on perceptions of changes in particular crime types and a general question comparing crime in the local area with the national average.
Comparison of original and new questions on changes in crime levels
There was concern that responses to the original national and local questions could have been subject to a context effect, which means that prior questions affect responses to subsequent questions. The original national crime question was asked much later in the interview than the local question and may have been influenced by both the length of questioning about crime before the question and in particular the immediately preceding questions about severity of sentencing which is known to be an area where people have strong views.
Thus the new questions were asked in the same section of the questionnaire, the local question immediately after the national one. The new questions differed from the original questions in a number of other ways. First, the time period over which respondents were asked to assess changes was amended from the “last two years” to the “past few years” and there were also minor changes to the response options. In addition, for the local crime question only, the original question was asked only of those who had lived in the area for three years or more whereas the new version was asked of all people (Box 1.1 details the wording of original and new questions). The original questions were retained for a small random part of the sample to compare the responses to the original and the new questions.
As stated in Walker et al. (2009), based on the original questions 36 per cent of people think that crime in their local area has increased, while 75 per cent think that crime has increased nationally. First results from analysis of the new questions show that these figures are around ten percentage points higher, with 46 per cent of people thinking that crime levels locally have gone up and 84 per cent thinking that national crime levels have gone up. This could be due in part to the reference period being extended (from “two years” to “the past few years”) and possibly because of their new location within the questionnaire. A similar proportion of people think that crime levels locally have stayed the same (50% answering the original question and 47% answering the new question, data not shown).
Although analysis of the new questions shows a higher proportion of people perceiving that crime has increased than the original questions, the pattern for perceptions of crime levels by demographic, socio-economic and other factors is similar (see Tables 1.1 and 1.2).
The persisting difference between perceptions of national and local crime shown by the new questions demonstrates that the “perception gap” indicated by responses to the original questions is likely to reflect real differences between perceptions of national and local crime rather than being an artefact of the questionnaire design.
3
Supplementary Volume 1 to Crime in England and Wales 2008/09
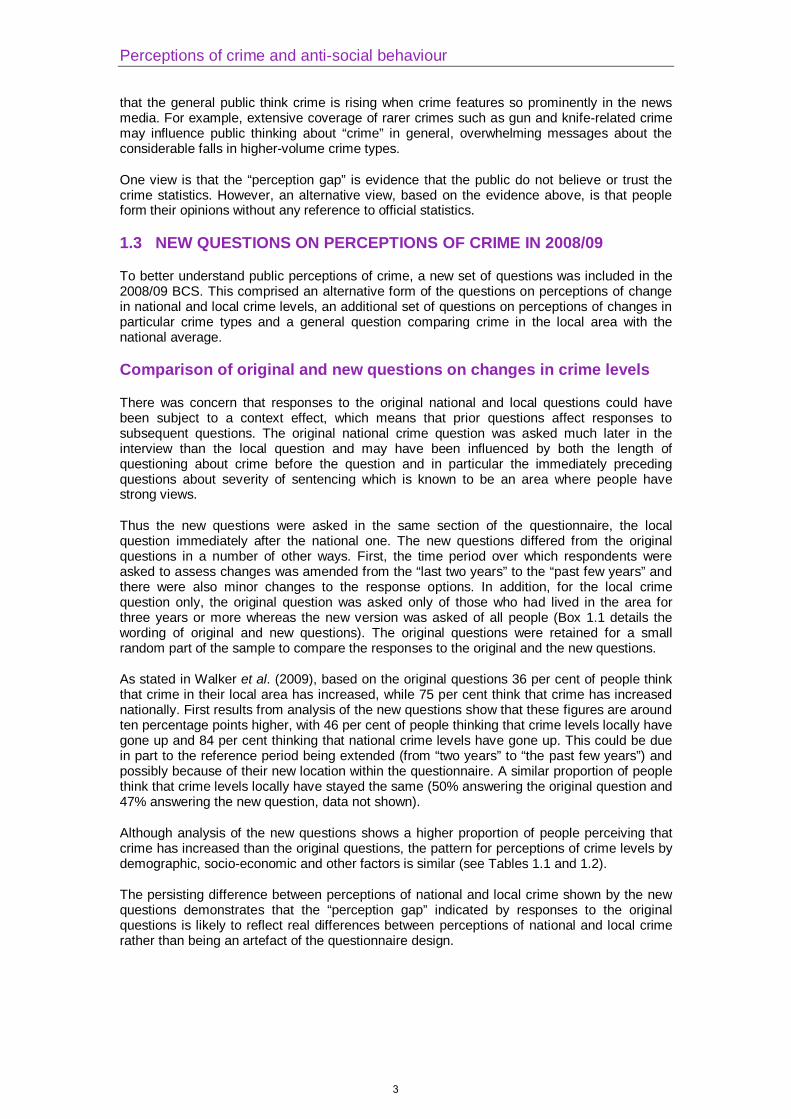
Box 1.1 BCS questions on perceptions of changing crime levels Original question on perceptions of changes in the NATIONAL crime rates I would like to ask whether you think that the level of crime in the country as a whole has changed over the past two years. Would you say there is more crime, less crime or about the same amount (since two years ago)? 1. A lot more crime 2. A little more crime 3. About the same 4. A little less crime 5. A lot less crime Original question on perceptions of changes in the LOCAL crime rates (asked only of those who had lived in the area for three years or more) How much would you say the crime rate here has changed since two years ago? In this area, would you say there is more crime or less crime? 1. A lot more crime 2. A little more crime 3. About the same 4. A little less crime 5. A lot less crime New questions on perceptions of changes in NATIONAL and LOCAL crime rates Looking at this card, what do you think has happened to crime in the country as a whole over the past few years? 1. Gone up a lot 2. Gone up a little 3. Stayed about the same 4. Gone down a little 5. Gone down a lot And what do you think has happened to crime in your local area over the past few years? 1. Gone up a lot 2. Gone up a little 3. Stayed about the same 4. Gone down a little 5. Gone down a lot
1.4 PERCEPTIONS OF SPECIFIC CRIME TYPES
It is possible that particular crimes affect perceptions when responding to a general question about “crime”. Therefore, an additional set of questions on changes in particular crime types was added to the 2008/09 BCS to explore whether or not the public discriminated between different types of crimes.
This included a set of nine questions about perceptions of changes to specific types of crime at both national and local level. To ease respondent burden and control for any possible order effect, each respondent was presented with questions about just four of the nine crime types in a random order (see Box 1.2).
4
Perceptions of crime and anti-social behaviour
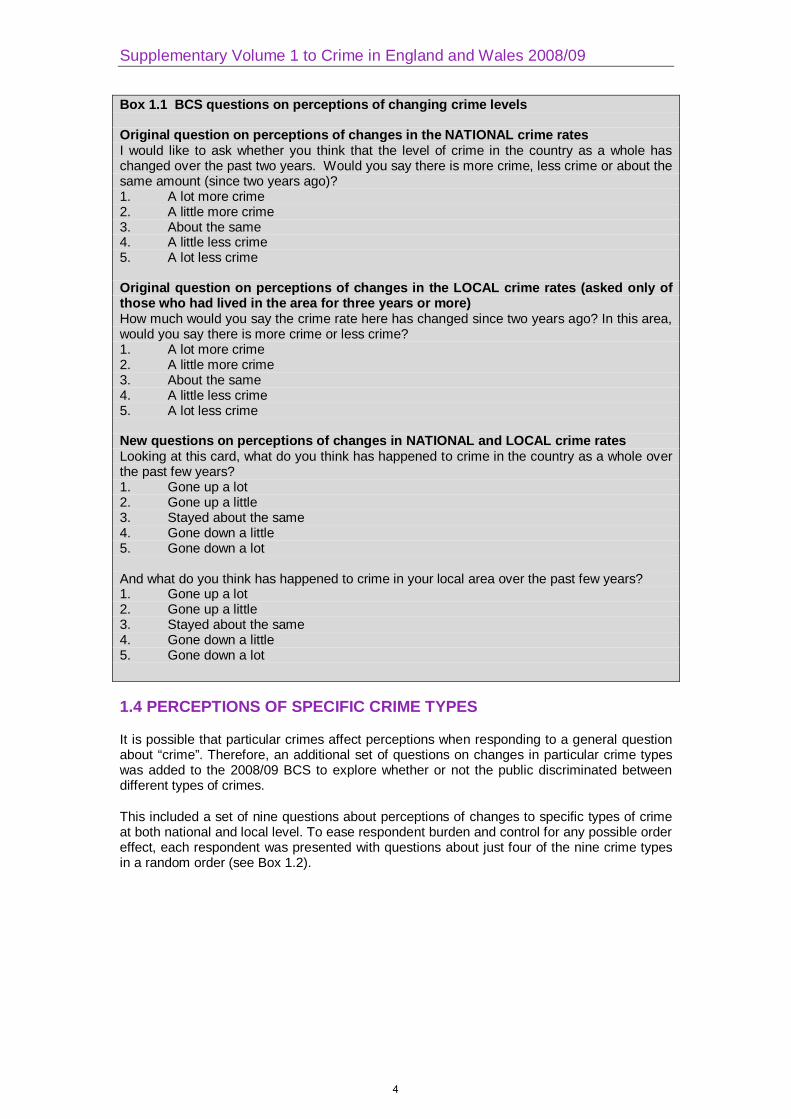
Box 1.2 New questions on perception of changes in different types of crime; 2008/09 BCS I’m now going to ask you about different types of crime. For each one I’d like you to tell me whether you think the number of crimes has gone up, gone down or stayed the same over the past few years, both in the country as a whole and in your local area. (Looking at this card) what do you think has happened to the [CRIME TYPE] in the country as a whole over the past few years? 1. Gone up a lot 2. Gone up a little 3. Stayed about the same 4. Gone down a little 5. Gone down a lot And what about in your local area? Same questions and answer responses as above. Crime types (random order – any four from nine). 1. amount of bank and credit card fraud 2. number of gun crimes 3. number of knife crimes 4. number of homes being broken into 5. number of cars being stolen 6. number of cars being broken into 7. number of muggings or street robberies 8. amount of vandalism 9. number of people getting beaten up Treatment of don’t know responses It should be noted that ‘don’t know’ responses are usually excluded from BCS analysis presented in Home Office statistical bulletins when they form five per cent or less of the total responses. However, the proportion of missing responses for the questions on perceptions of local bank/credit card fraud (11%) and perceptions of cars being stolen nationally (6%) exceeded this limit and so would usually be shown as a separate category. However, as the inclusion of these ‘don’t know’ responses does not change the overall picture in terms of the relationship between national and local perceptions, all figures presented here exclude ‘don’t know’ responses. This does, however, indicate that the question on local increases in bank/credit card fraud posed some difficulties for respondents which may partly explain the different profile for this crime.
First results for the new questions on perceptions of changes in specific crime types have already been reported (see Chapter 5 in Walker et al., 2009). This showed, as with the general crime question, a marked difference between national and local perceptions.
The difference between perceptions of changes in the national and local crime levels were particularly marked for knife crime (93% of people perceiving an increase nationally compared with 29% locally) and gun crime (86% nationally compared with 16% locally)1. This might be partly related to the fact that these types of crime are rare in number but geographically concentrated with, for example, over half of all firearm offences in England and Wales being concentrated in just three police forces: the Metropolitan Police, Greater Manchester and West Midlands (Povey et al., 2009). They are also the types of crime that attract most media attention and public concern and are therefore likely to influence perceptions about national crime figures.
1 Some numbers appear different to those in Figure 1.2 due to rounding.
5
Supplementary Volume 1 to Crime in England and Wales 2008/09
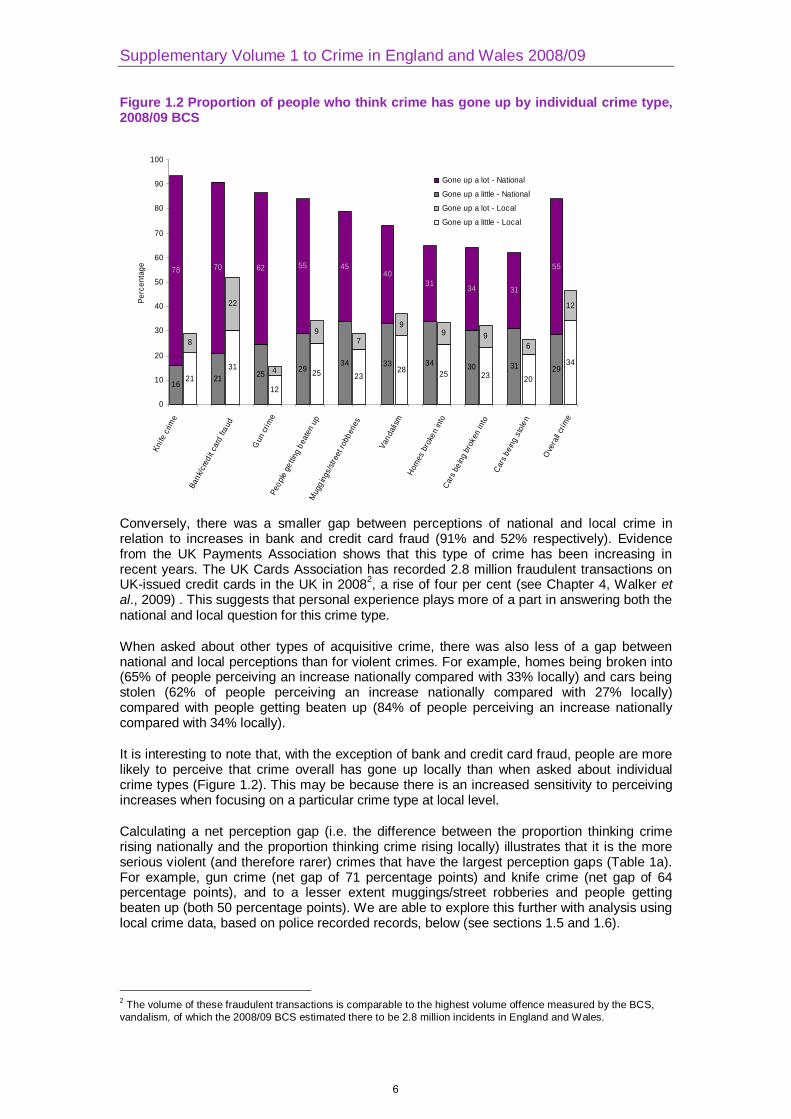
Figure 1.2 Proportion of people who think crime has gone up by individual crime type, 2008/09 BCS
2131
12
25 2328 25 23 20
34
8
22
4
97
99 9
6
12
1621 25 29
34 33 34 30 31 29
78 70 62 55 45
31 34 31
5540
0
10
20
30
40
50
60
70
80
90
100Kn
i fe c
rime
Bank
/cre
d it c
ard
fraud
Gun
crim
ePe
ople
gettin
g be
aten
up
Mug
g ing
s/str
eet r
obbe
ries
Vand
alism
Hom
es b
roke
n int
oCa
rs b
e ing
bro
ken
into
Cars
be i
ng s
tole
n
Ove
rall c
rime
Perc
enta
ge
Gone up a lot - National
Gone up a little - National
Gone up a lot - Local
Gone up a little - Local
Conversely, there was a smaller gap between perceptions of national and local crime in relation to increases in bank and credit card fraud (91% and 52% respectively). Evidence from the UK Payments Association shows that this type of crime has been increasing in recent years. The UK Cards Association has recorded 2.8 million fraudulent transactions on UK-issued credit cards in the UK in 20082, a rise of four per cent (see Chapter 4, Walker et al., 2009) . This suggests that personal experience plays more of a part in answering both the national and local question for this crime type.
When asked about other types of acquisitive crime, there was also less of a gap between national and local perceptions than for violent crimes. For example, homes being broken into (65% of people perceiving an increase nationally compared with 33% locally) and cars being stolen (62% of people perceiving an increase nationally compared with 27% locally) compared with people getting beaten up (84% of people perceiving an increase nationally compared with 34% locally).
It is interesting to note that, with the exception of bank and credit card fraud, people are more likely to perceive that crime overall has gone up locally than when asked about individual crime types (Figure 1.2). This may be because there is an increased sensitivity to perceiving increases when focusing on a particular crime type at local level.
Calculating a net perception gap (i.e. the difference between the proportion thinking crime rising nationally and the proportion thinking crime rising locally) illustrates that it is the more serious violent (and therefore rarer) crimes that have the largest perception gaps (Table 1a). For example, gun crime (net gap of 71 percentage points) and knife crime (net gap of 64 percentage points), and to a lesser extent muggings/street robberies and people getting beaten up (both 50 percentage points). We are able to explore this further with analysis using local crime data, based on police recorded records, below (see sections 1.5 and 1.6).
2 The volume of these fraudulent transactions is comparable to the highest volume offence measured by the BCS, vandalism, of which the 2008/09 BCS estimated there to be 2.8 million incidents in England and Wales.
6
Perceptions of crime and anti-social behaviour
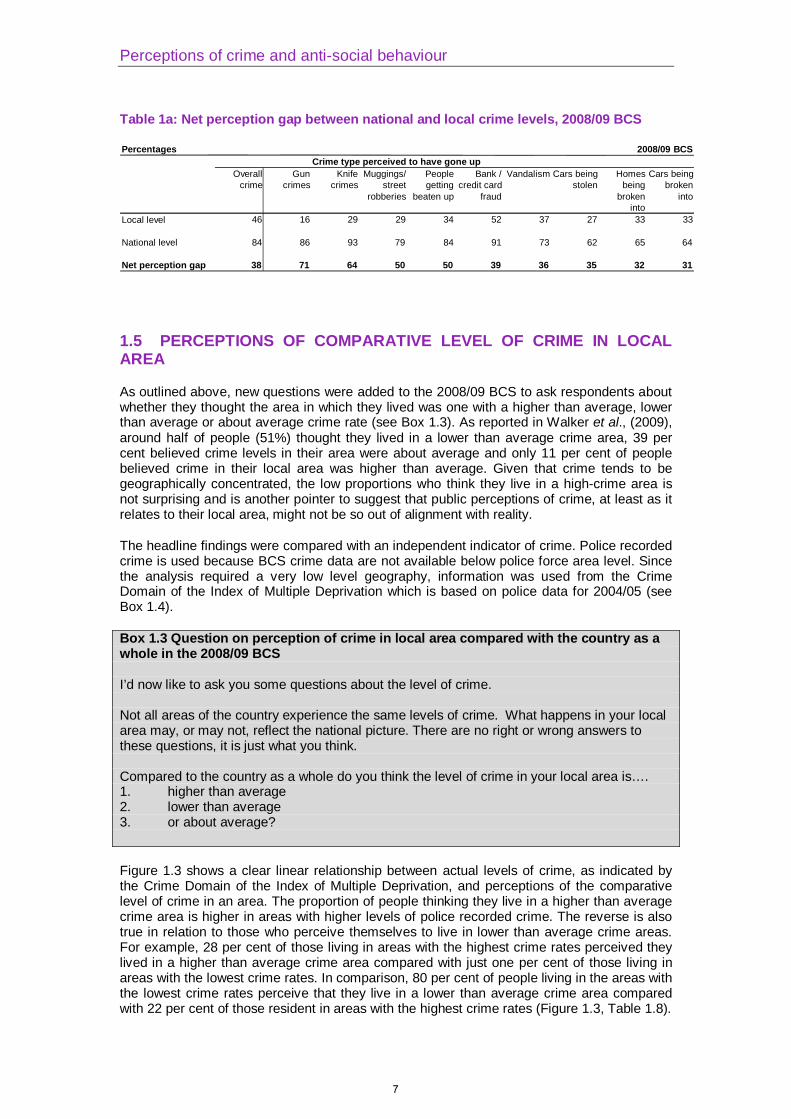
Table 1a: Net perception gap between national and local crime levels, 2008/09 BCS
1.5 PERCEPTIONS OF COMPARATIVE LEVEL OF CRIME IN LOCAL AREA
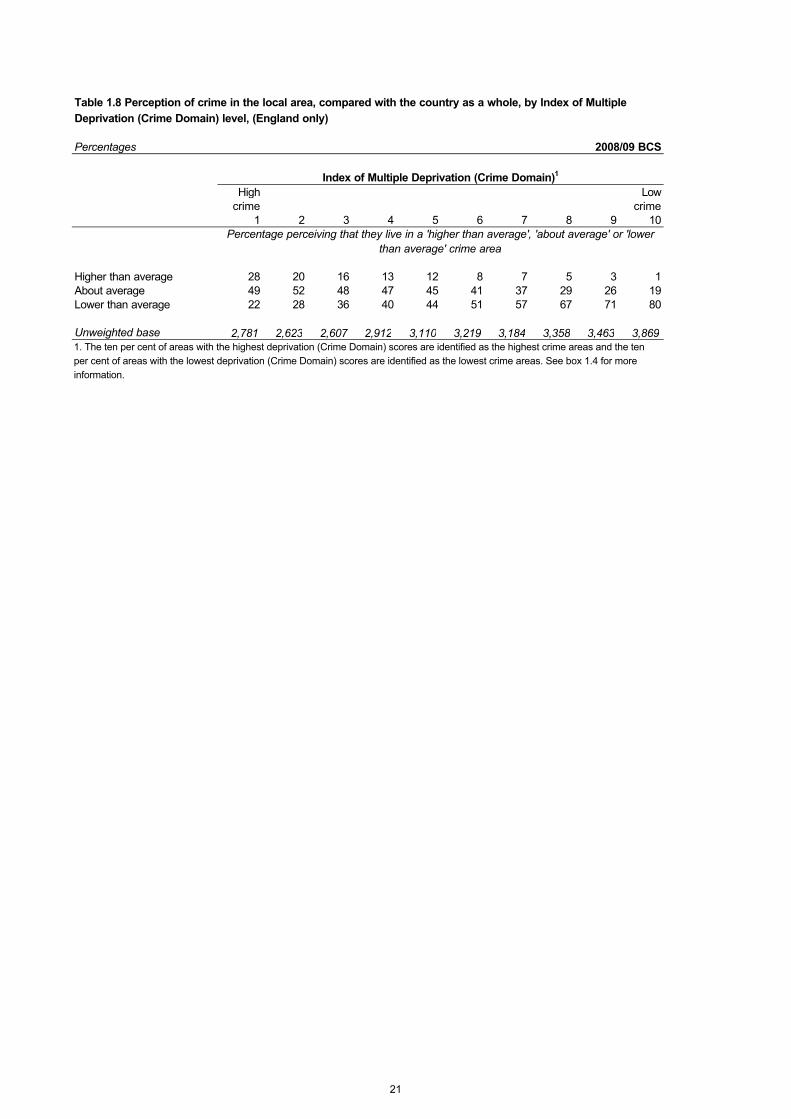
As outlined above, new questions were added to the 2008/09 BCS to ask respondents about whether they thought the area in which they lived was one with a higher than average, lower than average or about average crime rate (see Box 1.3). As reported in Walker et al., (2009), around half of people (51%) thought they lived in a lower than average crime area, 39 per cent believed crime levels in their area were about average and only 11 per cent of people believed crime in their local area was higher than average. Given that crime tends to be geographically concentrated, the low proportions who think they live in a high-crime area is not surprising and is another pointer to suggest that public perceptions of crime, at least as it relates to their local area, might not be so out of alignment with reality.
The headline findings were compared with an independent indicator of crime. Police recorded crime is used because BCS crime data are not available below police force area level. Since the analysis required a very low level geography, information was used from the Crime Domain of the Index of Multiple Deprivation which is based on police data for 2004/05 (see Box 1.4).
Box 1.3 Question on perception of crime in local area compared with the country as a whole in the 2008/09 BCS I’d now like to ask you some questions about the level of crime. Not all areas of the country experience the same levels of crime. What happens in your local area may, or may not, reflect the national picture. There are no right or wrong answers to these questions, it is just what you think. Compared to the country as a whole do you think the level of crime in your local area is…. 1. higher than average 2. lower than average 3. or about average?
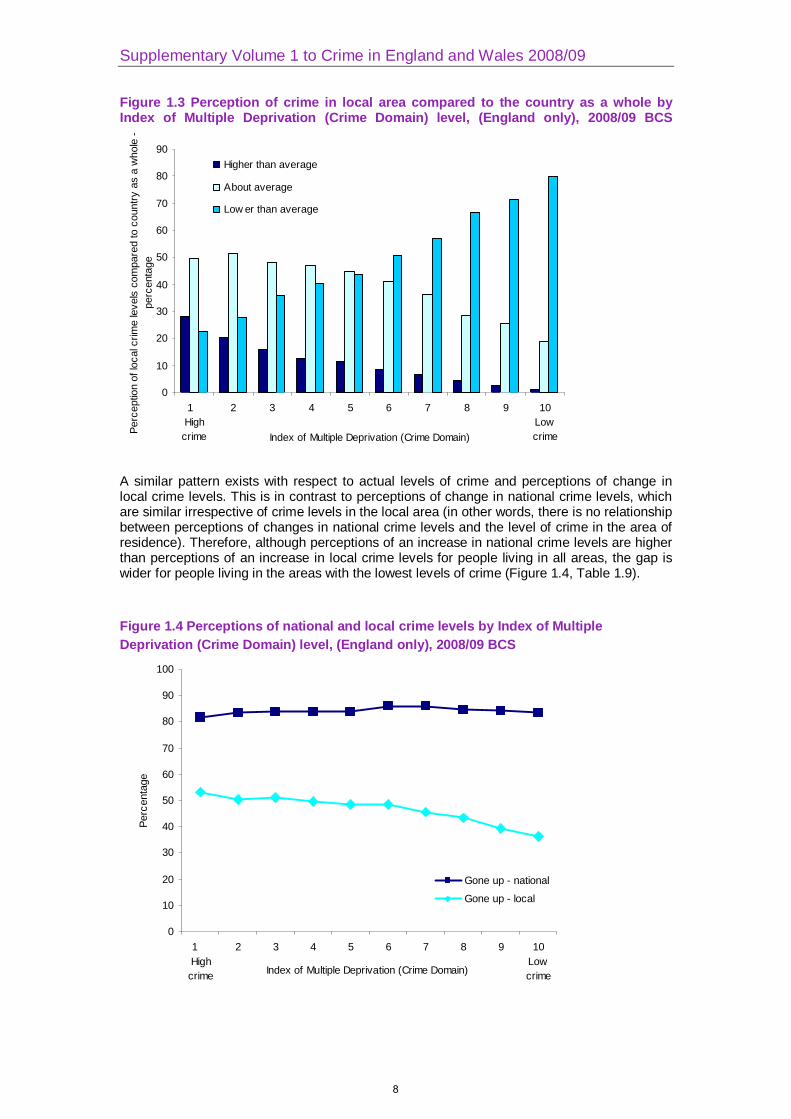
Figure 1.3 shows a clear linear relationship between actual levels of crime, as indicated by the Crime Domain of the Index of Multiple Deprivation, and perceptions of the comparative level of crime in an area. The proportion of people thinking they live in a higher than average crime area is higher in areas with higher levels of police recorded crime. The reverse is also true in relation to those who perceive themselves to live in lower than average crime areas. For example, 28 per cent of those living in areas with the highest crime rates perceived they lived in a higher than average crime area compared with just one per cent of those living in areas with the lowest crime rates. In comparison, 80 per cent of people living in the areas with the lowest crime rates perceive that they live in a lower than average crime area compared with 22 per cent of those resident in areas with the highest crime rates (Figure 1.3, Table 1.8).
Percentages 2008/09 BCS
Overall crime
Gun crimes
Knife crimes
Muggings/ street
robberies
People getting
beaten up
Bank / credit card
fraud
Vandalism Cars being stolen
Homes being
broken into
Cars being broken
into
Local level 46 16 29 29 34 52 37 27 33 33
National level 84 86 93 79 84 91 73 62 65 64
Net perception gap 38 71 64 50 50 39 36 35 32 31
Crime type perceived to have gone up
7
Supplementary Volume 1 to Crime in England and Wales 2008/09
Figure 1.3 Perception of crime in local area compared to the country as a whole by Index of Multiple Deprivation (Crime Domain) level, (England only), 2008/09 BCS
0
10
20
30
40
50
60
70
80
90
1 Highcrime
2 3 4 5 6 7 8 9 10LowcrimeIndex of Multiple Deprivation (Crime Domain)
Perc
eptio
n of
loca
l crim
e le
vels
com
pare
d to
cou
ntry
as
a w
hole
- pe
rcen
tage
Higher than average
About average
Low er than average
A similar pattern exists with respect to actual levels of crime and perceptions of change in local crime levels. This is in contrast to perceptions of change in national crime levels, which are similar irrespective of crime levels in the local area (in other words, there is no relationship between perceptions of changes in national crime levels and the level of crime in the area of residence). Therefore, although perceptions of an increase in national crime levels are higher than perceptions of an increase in local crime levels for people living in all areas, the gap is wider for people living in the areas with the lowest levels of crime (Figure 1.4, Table 1.9).
Figure 1.4 Perceptions of national and local crime levels by Index of Multiple Deprivation (Crime Domain) level, (England only), 2008/09 BCS
0
10
20
30
40
50
60
70
80
90
100
1 Highcrime
2 3 4 5 6 7 8 9 10LowcrimeIndex of Multiple Deprivation (Crime Domain)
Perc
enta
ge
Gone up - national
Gone up - local
8
Perceptions of crime and anti-social behaviour
Perceptions of changes in crime by type of area
It is also possible to explore how the perceived level of crime in an area, compared to the country as a whole, affects people’s perceptions of the change in crime levels in the local area.
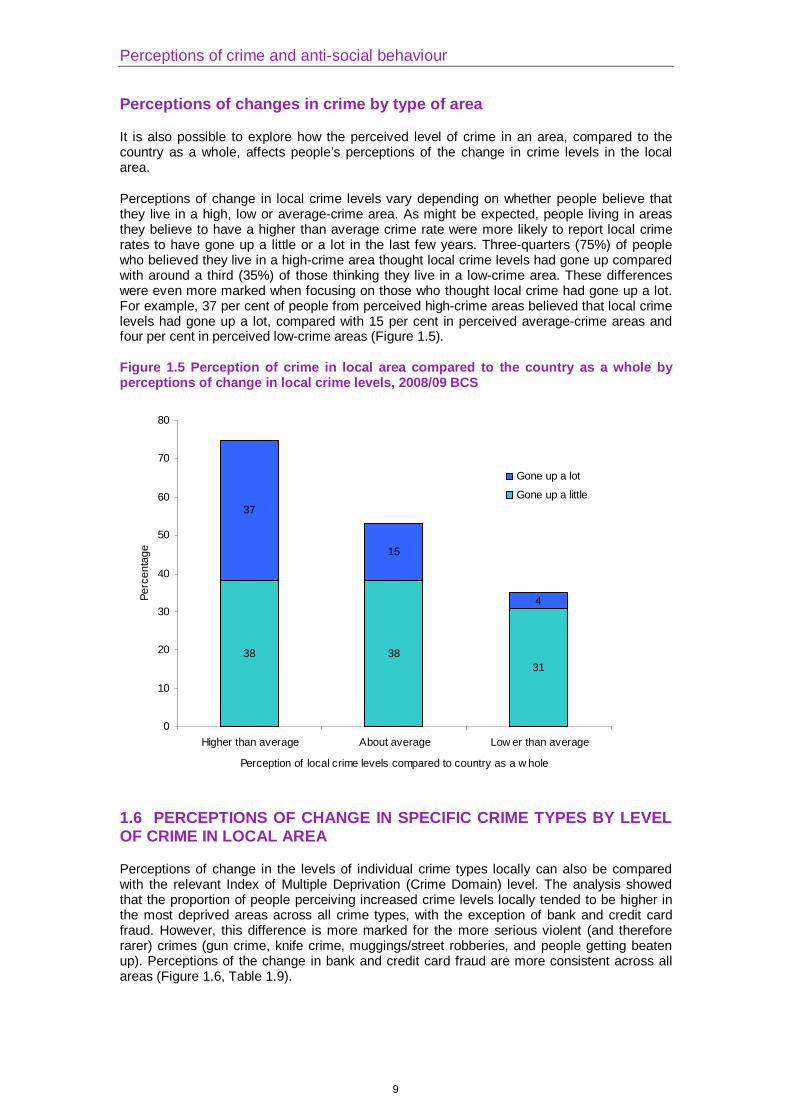
Perceptions of change in local crime levels vary depending on whether people believe that they live in a high, low or average-crime area. As might be expected, people living in areas they believe to have a higher than average crime rate were more likely to report local crime rates to have gone up a little or a lot in the last few years. Three-quarters (75%) of people who believed they live in a high-crime area thought local crime levels had gone up compared with around a third (35%) of those thinking they live in a low-crime area. These differences were even more marked when focusing on those who thought local crime had gone up a lot. For example, 37 per cent of people from perceived high-crime areas believed that local crime levels had gone up a lot, compared with 15 per cent in perceived average-crime areas and four per cent in perceived low-crime areas (Figure 1.5).
Figure 1.5 Perception of crime in local area compared to the country as a whole by perceptions of change in local crime levels, 2008/09 BCS
38 3831
37
15
4
0
10
20
30
40
50
60
70
80
Higher than average About average Low er than average
Perception of local crime levels compared to country as a w hole
Perc
enta
ge
Gone up a lot
Gone up a little
1.6 PERCEPTIONS OF CHANGE IN SPECIFIC CRIME TYPES BY LEVEL OF CRIME IN LOCAL AREA
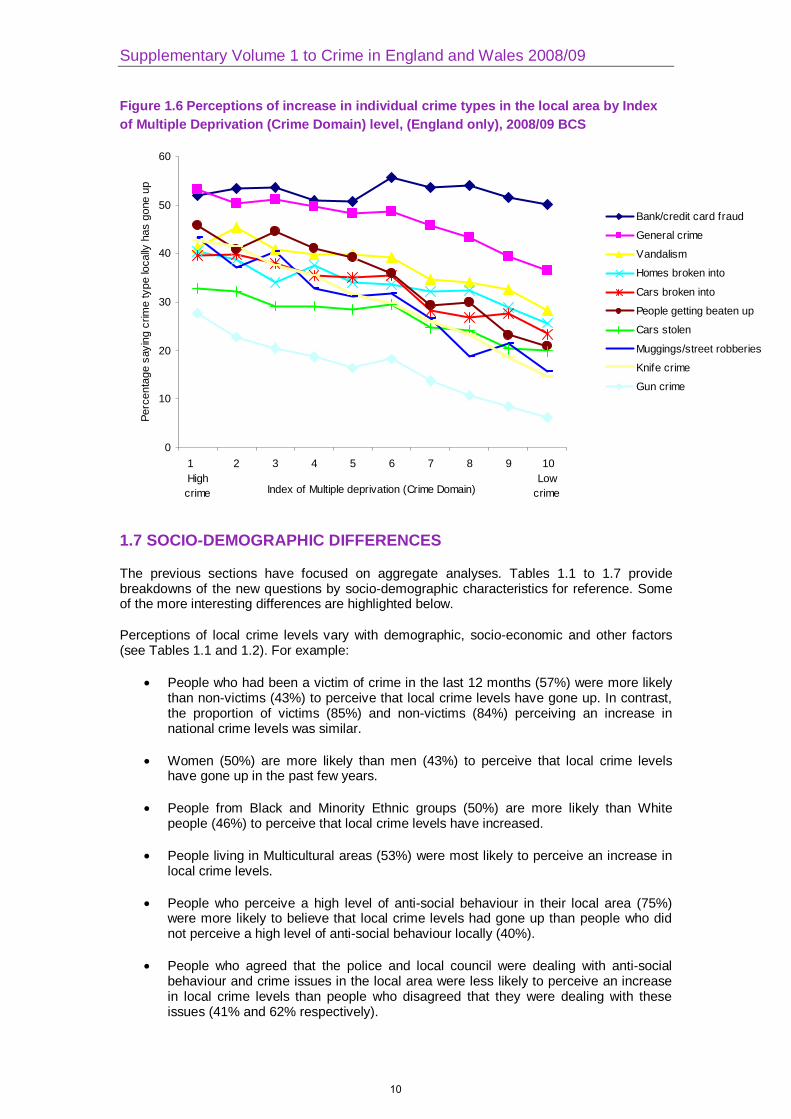
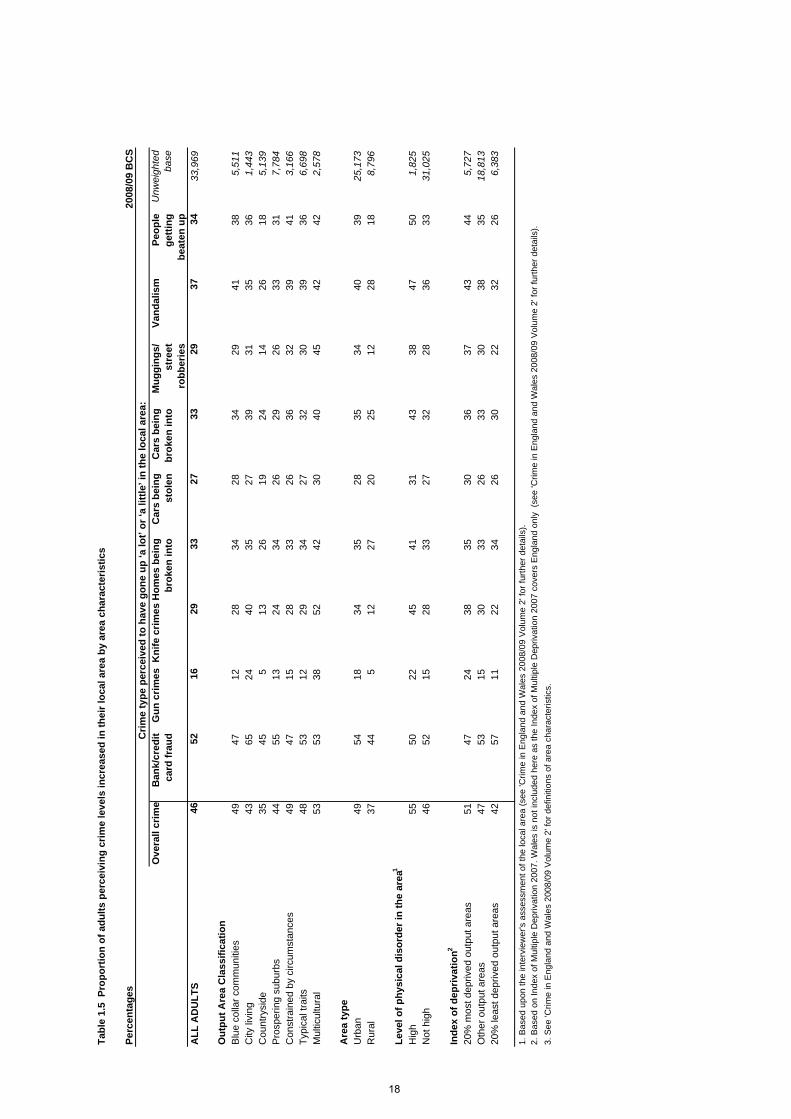
Perceptions of change in the levels of individual crime types locally can also be compared with the relevant Index of Multiple Deprivation (Crime Domain) level. The analysis showed that the proportion of people perceiving increased crime levels locally tended to be higher in the most deprived areas across all crime types, with the exception of bank and credit card fraud. However, this difference is more marked for the more serious violent (and therefore rarer) crimes (gun crime, knife crime, muggings/street robberies, and people getting beaten up). Perceptions of the change in bank and credit card fraud are more consistent across all areas (Figure 1.6, Table 1.9).
9
Supplementary Volume 1 to Crime in England and Wales 2008/09
Figure 1.6 Perceptions of increase in individual crime types in the local area by Index of Multiple Deprivation (Crime Domain) level, (England only), 2008/09 BCS
0
10
20
30
40
50
60
1 Highcrime
2 3 4 5 6 7 8 9 10Low
crime Index of Multiple deprivation (Crime Domain)
Perc
enta
ge s
ayin
g cr
ime
type
loca
lly h
as g
one
up
Bank/credit card fraud
General crime
Vandalism
Homes broken into
Cars broken into
People getting beaten up
Cars stolen
Muggings/street robberies
Knife crime
Gun crime
1.7 SOCIO-DEMOGRAPHIC DIFFERENCES
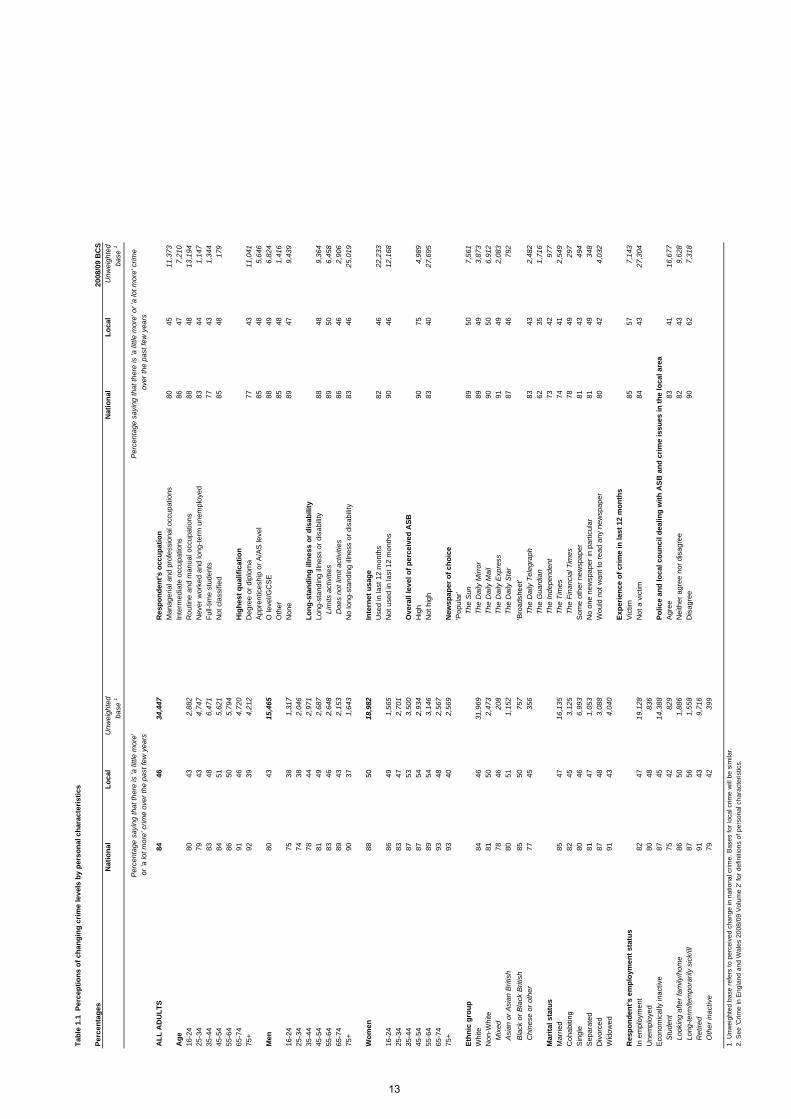
The previous sections have focused on aggregate analyses. Tables 1.1 to 1.7 provide breakdowns of the new questions by socio-demographic characteristics for reference. Some of the more interesting differences are highlighted below.
Perceptions of local crime levels vary with demographic, socio-economic and other factors (see Tables 1.1 and 1.2). For example:
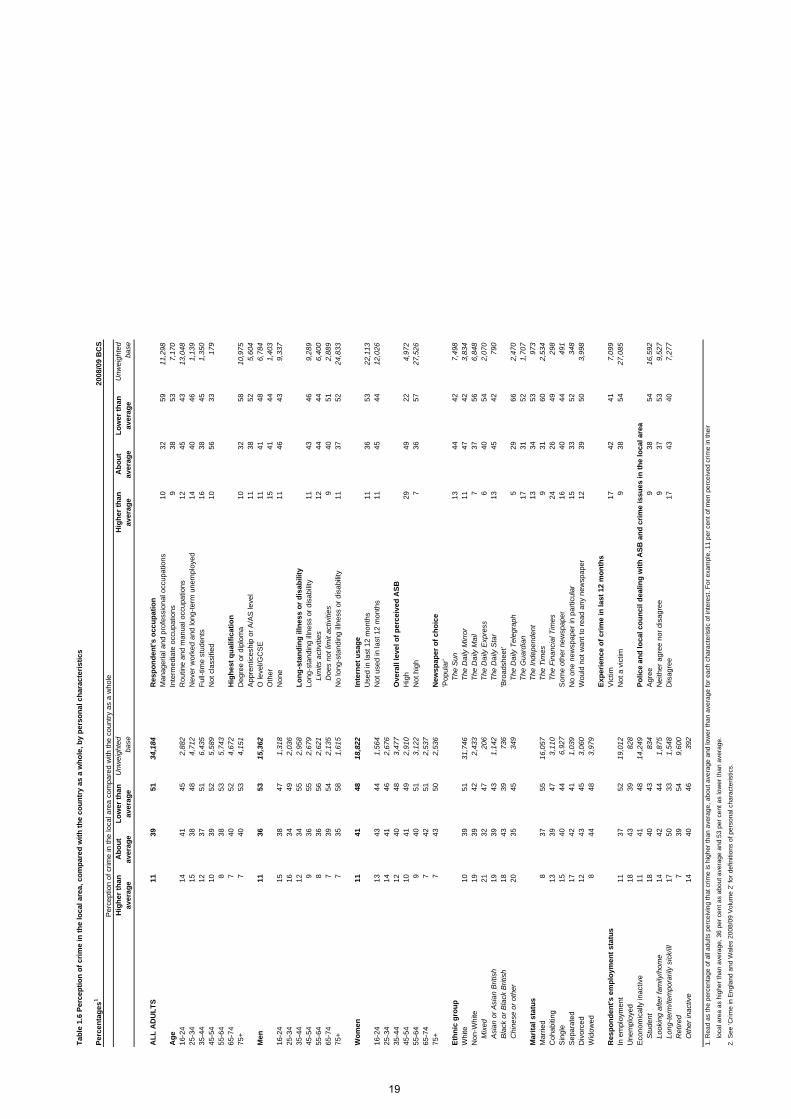
• People who had been a victim of crime in the last 12 months (57%) were more likely than non-victims (43%) to perceive that local crime levels have gone up. In contrast, the proportion of victims (85%) and non-victims (84%) perceiving an increase in national crime levels was similar.
• Women (50%) are more likely than men (43%) to perceive that local crime levels have gone up in the past few years.
• People from Black and Minority Ethnic groups (50%) are more likely than White people (46%) to perceive that local crime levels have increased.
• People living in Multicultural areas (53%) were most likely to perceive an increase in local crime levels.
• People who perceive a high level of anti-social behaviour in their local area (75%) were more likely to believe that local crime levels had gone up than people who did not perceive a high level of anti-social behaviour locally (40%).
• People who agreed that the police and local council were dealing with anti-social behaviour and crime issues in the local area were less likely to perceive an increase in local crime levels than people who disagreed that they were dealing with these issues (41% and 62% respectively).
10
Perceptions of crime and anti-social behaviour
Readers of ‘popular’ newspapers were more likely to perceive an increase in national crime levels than readers of national ‘broadsheets’ (for example, The Daily Mail, 90%, compared with The Guardian, 62%).
There is also some variation in perceptions of the levels of individual crime types locally by demographic, socio-demographic and other characteristics. For example:
• The difference in perceptions between men and women tends to be more marked for acquisitive crimes than for violent crimes. For example, 36 per cent of women perceive that homes broken into had gone up compared to 30 per cent of men. The difference is smaller for more violent crimes such as gun crime (16% of women and 15% of men perceiving an increase) and knife crime (both 29%).
• The difference in perceptions between White people and people from Black and Minority Ethnic groups is more marked for the most violent crimes. For example 29 per cent of people from Black and Minority Ethnic groups perceive that gun crime locally has gone up compared to 14 per cent of White people. There is less difference for acquisitive crimes such as cars being stolen (both 27%).
• The difference in perceptions between people living in the most deprived and the least deprived areas is also greatest for the most violent offences. For example, 38 per cent of people living in the 20 per cent most deprived areas thought that knife crime had gone up compared to 22 per cent of those living in the 20 per cent least deprived areas. There is less difference for acquisitive crimes such as cars being stolen (30% of those in the most deprived areas and 26% of those in the least deprived areas perceiving an increase). This may in part explain the differences between people from different ethnic backgrounds.
These factors are likely to be interrelated. Further analysis to explore this will be published in subsequent bulletins.
For a full breakdown of the findings on the proportion of adults perceiving that levels of specific crime types had increased in their local area by demographic, socio-economic characteristics and other factors, see Tables 1.3, 1.4 and 1.5.
Perceptions of crime in the local area compared to the country as a whole also vary by demographic, socio-economic and other factors (see Tables 1.6 and 1.7).
11
Supplementary Volume 1 to Crime in England and Wales 2008/09
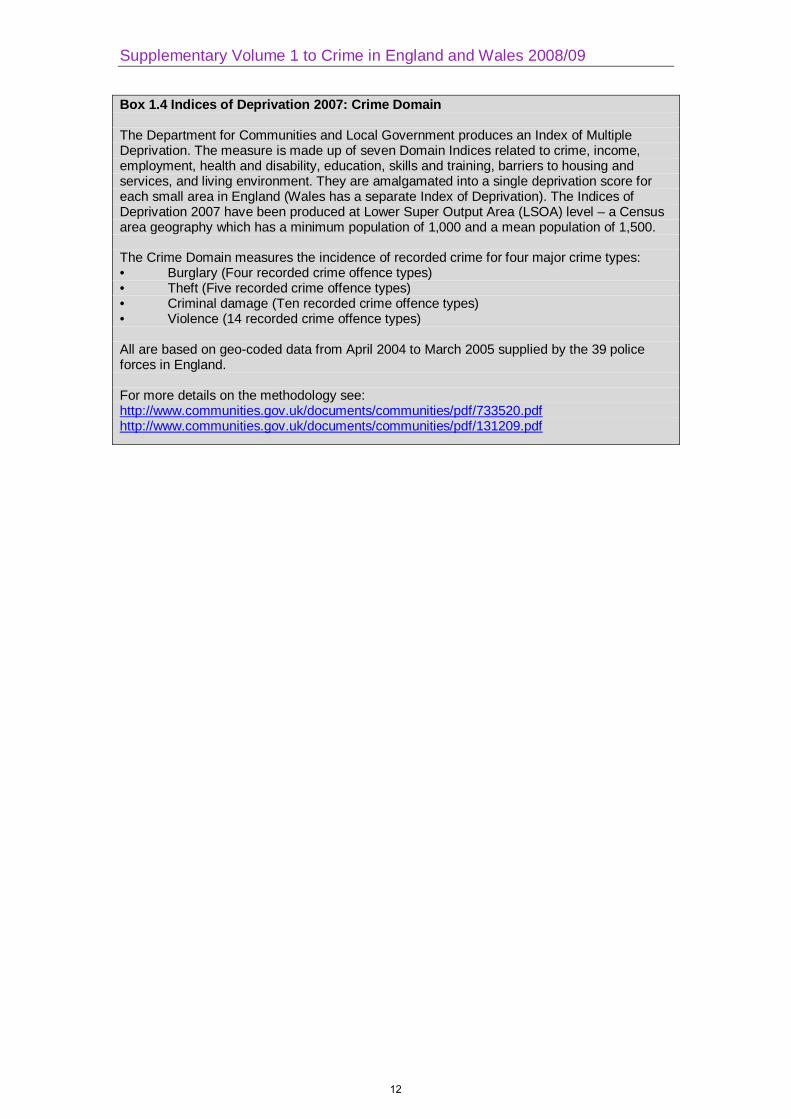
Box 1.4 Indices of Deprivation 2007: Crime Domain The Department for Communities and Local Government produces an Index of Multiple Deprivation. The measure is made up of seven Domain Indices related to crime, income, employment, health and disability, education, skills and training, barriers to housing and services, and living environment. They are amalgamated into a single deprivation score for each small area in England (Wales has a separate Index of Deprivation). The Indices of Deprivation 2007 have been produced at Lower Super Output Area (LSOA) level – a Census area geography which has a minimum population of 1,000 and a mean population of 1,500. The Crime Domain measures the incidence of recorded crime for four major crime types: • Burglary (Four recorded crime offence types) • Theft (Five recorded crime offence types) • Criminal damage (Ten recorded crime offence types) • Violence (14 recorded crime offence types) All are based on geo-coded data from April 2004 to March 2005 supplied by the 39 police forces in England. For more details on the methodology see: http://www.communities.gov.uk/documents/communities/pdf/733520.pdf http://www.communities.gov.uk/documents/communities/pdf/131209.pdf
12
Perc
enta
ges
2008
/09
BC
SN
atio
nal
Loca
lU
nwei
ghte
d ba
se1
Nat
iona
lLo
cal
Unw
eigh
ted
base
1
ALL
AD
ULT
S84
4634
,447
Res
pond
ent's
occ
upat
ion
Man
ager
ial a
nd p
rofe
ssio
nal o
ccup
atio
ns80
4511
,373
Age
Inte
rmed
iate
occ
upat
ions
8647
7,21
016
-24
8043
2,88
2R
outin
e an
d m
anua
l occ
upat
ions
8848
13,1
9425
-34
7943
4,74
7N
ever
wor
ked
and
long
-term
une
mpl
oyed
8344
1,14
735
-44
8348
6,47
1Fu
ll-tim
e st
uden
ts77
431,
344
45-5
484
515,
621
Not
cla
ssifi
ed85
4817
955
-64
8650
5,79
465
-74
9146
4,72
0H
ighe
st q
ualif
icat
ion
75+
9239
4,21
2D
egre
e or
dip
lom
a77
4311
,041
App
rent
ices
hip
or A
/AS
leve
l85
485,
646
Men
8043
15,4
65O
leve
l/GC
SE
8849
6,82
4O
ther
8548
1,41
616
-24
7538
1,31
7N
one
8947
9,43
925
-34
7438
2,04
635
-44
7844
2,97
1Lo
ng-s
tand
ing
illne
ss o
r dis
abili
ty
45-5
481
492,
687
Long
-sta
ndin
g ill
ness
or d
isab
ility
88
489,
364
55-6
483
462,
648
Lim
its a
ctiv
ities
8950
6,45
865
-74
8943
2,15
3D
oes
not l
imit
activ
ities
8646
2,90
675
+90
371,
643
No
long
-sta
ndin
g ill
ness
or d
isab
ility
83
4625
,019
Wom
en88
5018
,982
Inte
rnet
usa
geU
sed
in la
st 1
2 m
onth
s82
4622
,233
16-2
486
491,
565
Not
use
d in
last
12
mon
ths
9046
12,1
6825
-34
8347
2,70
135
-44
8753
3,50
0O
vera
ll le
vel o
f per
ceiv
ed A
SB45
-54
8754
2,93
4H
igh
9075
4,98
955
-64
8954
3,14
6N
ot h
igh
8340
27,6
9565
-74
9348
2,56
775
+93
402,
569
New
spap
er o
f cho
ice
'Pop
ular
'Et
hnic
gro
upTh
e S
un89
507,
561
Whi
te
8446
31,9
69Th
e D
aily
Mirr
or89
493,
873
Non
-Whi
te81
502,
473
The
Dai
ly M
ail
9050
6,91
2M
ixed
7846
208
The
Dai
ly E
xpre
ss91
492,
083
Asi
an o
r Asi
an B
ritis
h80
511,
152
The
Dai
ly S
tar
8746
792
Bla
ck o
r Bla
ck B
ritis
h85
5075
7'B
road
shee
t'C
hine
se o
r oth
er77
4535
6Th
e D
aily
Tel
egra
ph83
432,
482
The
Gua
rdia
n62
351,
716
Mar
ital s
tatu
sTh
e In
depe
nden
t73
4297
7M
arrie
d85
4716
,135
The
Tim
es74
412,
549
Coh
abiti
ng82
453,
125
The
Fina
ncia
l Tim
es78
4929
7S
ingl
e80
466,
993
Som
e ot
her n
ewsp
aper
8143
494
Sep
arat
ed81
471,
053
No
one
new
spap
er in
par
ticul
ar81
4934
8D
ivor
ced
8748
3,08
8W
ould
not
wan
t to
read
any
new
spap
er80
424,
032
Wid
owed
9143
4,04
0Ex
perie
nce
of c
rime
in la
st 1
2 m
onth
sR
espo
nden
t's e
mpl
oym
ent s
tatu
sV
ictim
8557
7,14
3In
em
ploy
men
t82
4719
,128
Not
a v
ictim
8443
27,3
04U
nem
ploy
ed80
4883
6E
cono
mic
ally
inac
tive
8745
14,3
88Po
lice
and
loca
l cou
ncil
deal
ing
with
ASB
and
crim
e is
sues
in th
e lo
cal a
rea
Stu
dent
7542
829
Agr
ee83
4116
,677
Look
ing
afte
r fam
ily/h
ome
8650
1,88
6N
eith
er a
gree
nor
dis
agre
e82
439,
628
Long
-term
/tem
pora
rily
sick
/ill
8756
1,55
8D
isag
ree
9062
7,31
8R
etire
d91
439,
716
Oth
er in
activ
e79
4239
9
1. U
nwei
ghte
d ba
se re
fers
to p
erce
ived
cha
nge
in n
atio
nal c
rime.
Bas
es fo
r loc
al c
rime
will
be
sim
ilar.
2. S
ee 'C
rime
in E
ngla
nd a
nd W
ales
200
8/09
Vol
ume
2' fo
r def
initi
ons
of p
erso
nal c
hara
cter
istic
s.
Tabl
e 1.
1 P
erce
ptio
ns o
f cha
ngin
g cr
ime
leve
ls b
y pe
rson
al c
hara
cter
istic
s
Per
cent
age
sayi
ng th
at th
ere
is 'a
littl
e m
ore'
or
'a lo
t mor
e' c
rime
over
the
past
few
yea
rsP
erce
ntag
e sa
ying
that
ther
e is
'a li
ttle
mor
e' o
r 'a
lot m
ore'
crim
e ov
er th
e pa
st fe
w y
ears
13
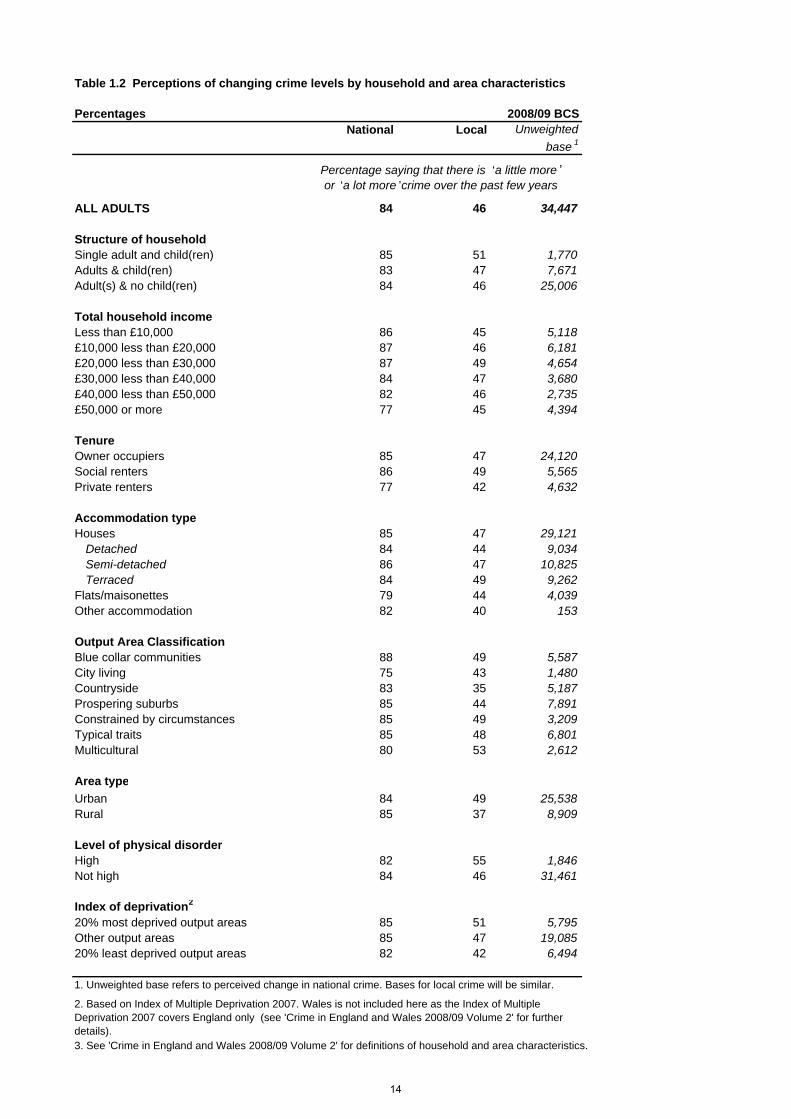
Table 1.2 Perceptions of changing crime levels by household and area characteristics
Percentages 2008/09 BCSNational Local Unweighted
base 1
ALL ADULTS 84 46 34,447
Structure of householdSingle adult and child(ren) 85 51 1,770Adults & child(ren) 83 47 7,671Adult(s) & no child(ren) 84 46 25,006
Total household incomeLess than £10,000 86 45 5,118£10,000 less than £20,000 87 46 6,181£20,000 less than £30,000 87 49 4,654£30,000 less than £40,000 84 47 3,680£40,000 less than £50,000 82 46 2,735£50,000 or more 77 45 4,394
TenureOwner occupiers 85 47 24,120Social renters 86 49 5,565Private renters 77 42 4,632
Accommodation type Houses 85 47 29,121
Detached 84 44 9,034Semi-detached 86 47 10,825Terraced 84 49 9,262
Flats/maisonettes 79 44 4,039Other accommodation 82 40 153
Output Area ClassificationBlue collar communities 88 49 5,587City living 75 43 1,480Countryside 83 35 5,187Prospering suburbs 85 44 7,891Constrained by circumstances 85 49 3,209Typical traits 85 48 6,801Multicultural 80 53 2,612
Area typeUrban 84 49 25,538Rural 85 37 8,909
Level of physical disorderHigh 82 55 1,846Not high 84 46 31,461
Index of deprivation2
20% most deprived output areas 85 51 5,795Other output areas 85 47 19,08520% least deprived output areas 82 42 6,494
1. Unweighted base refers to perceived change in national crime. Bases for local crime will be similar.
Percentage saying that there is ‘a little more ’ or ‘a lot more ’crime over the past few years
3. See 'Crime in England and Wales 2008/09 Volume 2' for definitions of household and area characteristics.
2. Based on Index of Multiple Deprivation 2007. Wales is not included here as the Index of Multiple Deprivation 2007 covers England only (see 'Crime in England and Wales 2008/09 Volume 2' for further details).
14
Percentages
Overall crime
Bank/credit card fraud
Gun crimes
Knife crimes
Homes being
broken into
Cars being
stolen
Cars being
broken into
Muggings/ street
robberies
Vandalism People getting
beaten up
Unweighted base
ALL ADULTS 46 52 16 29 33 27 33 29 37 34 33,969
Age16-24 43 43 14 33 30 23 32 30 36 43 2,82525-34 43 57 19 32 30 26 31 32 33 35 4,64635-44 48 58 18 31 35 28 35 31 39 38 6,38645-54 51 57 19 33 38 30 36 32 39 37 5,56255-64 50 56 15 29 37 30 36 28 42 33 5,71865-74 46 47 11 22 34 28 31 27 39 27 4,66875+ 39 36 10 17 26 21 23 21 30 19 4,164
Men 43 51 15 29 30 24 30 27 37 32 15,28516-24 38 42 11 32 23 20 30 26 34 38 1,30025-34 38 56 19 30 26 22 28 28 29 33 2,00335-44 44 58 17 30 32 27 30 29 39 35 2,94145-54 49 56 19 33 38 25 33 31 40 34 2,66655-64 46 54 14 29 34 26 32 27 43 33 2,61165-74 43 46 11 25 31 27 31 26 41 25 2,12875+ 37 36 9 18 25 21 24 20 33 19 1,636
Women 50 53 16 29 36 29 35 31 37 36 18,68416-24 49 43 16 33 36 25 35 34 38 47 1,52525-34 47 57 20 34 33 29 34 35 36 38 2,64335-44 53 58 18 32 39 28 39 33 39 40 3,44545-54 54 58 18 33 39 34 38 32 38 39 2,89655-64 54 58 16 28 40 33 39 28 40 34 3,10765-74 48 49 10 19 36 28 31 27 37 28 2,54075+ 40 36 11 17 26 21 21 22 29 19 2,528
Ethnic groupWhite 46 52 14 28 33 27 32 28 37 34 31,531Non-White 50 51 29 39 39 27 34 41 38 35 2,433
Mixed 46 51 31 39 35 30 30 46 35 41 204Asian or Asian British 51 53 27 39 42 29 36 41 39 35 1,143Black or Black British 50 50 38 40 35 28 37 42 36 36 743Chinese or other 45 43 16 36 39 20 22 37 38 30 343
Marital statusMarried 47 55 15 28 35 28 33 29 38 32 15,955Cohabiting 45 56 16 32 32 28 33 29 36 38 3,064Single 46 47 16 32 31 24 32 31 36 41 6,870Separated 47 53 18 29 34 29 32 35 38 38 1,026Divorced 48 50 17 31 33 31 37 31 39 35 3,047Widowed 43 41 12 21 29 25 27 25 34 24 3,996
Respondent's employment statusIn employment 47 57 17 31 34 28 34 30 38 36 18,850Unemployed 48 42 18 26 39 21 28 33 33 44 818Economically inactive 45 43 13 26 32 25 31 28 36 30 14,208
Student 4 42 37 14 36 27 20 32 31 37 40 824Looking after family/home 50 44 18 32 39 31 37 34 34 38 1,856Long-term/temporarily sick/ill 56 46 21 36 41 29 38 38 45 42 1,543Retired 43 44 10 21 30 24 27 24 35 24 9,600Other inactive 42 40 13 27 28 18 28 26 32 28 385
Respondent's occupationManagerial and professional occupations 45 61 16 30 34 26 31 29 36 34 11,212Intermediate occupations 47 54 16 29 37 28 35 30 37 33 7,103Routine and manual occupations 48 46 14 28 33 28 34 29 38 34 13,006Never worked and long-term unemployed 44 34 16 21 32 24 23 28 32 32 1,139Full-time students 4 43 43 15 34 27 22 32 30 40 42 1,330Not classified 48 61 20 27 35 37 21 51 41 39 179
Highest qualificationDegree or diploma 43 60 18 30 32 26 32 29 35 32 10,867Apprenticeship or A/AS level 48 54 16 31 32 26 34 30 39 37 5,563O level/GCSE 49 51 14 31 35 29 35 31 40 41 6,727Other 48 47 16 30 34 29 35 31 43 34 1,390None 47 42 13 25 35 26 30 27 35 30 9,340
Table continued overleaf
Table 1.3 Proportion of adults perceiving crime levels increased in their local area by personal characteristics
Crime type perceived to have gone up ‘a lot’ or ‘a little’ in the local area:
15
Percentages
Overall crime
Bank/credit card fraud
Gun crimes
Knife crimes
Homes being
broken into
Cars being
stolen
Cars being
broken into
Muggings/ street
robberies
Vandalism People getting
beaten up
Unweighted base
Long-standing illness or disability Long-standing illness or disability 48 50 16 27 35 28 34 31 39 33 9,250
Limits activities 50 49 16 28 36 27 34 32 40 33 6,384Does not limit activities 46 52 16 26 34 31 35 29 39 31 2,866
No long-standing illness or disability 46 53 15 30 33 26 32 29 36 35 24,655
Internet usageUsed in last 12 months 46 56 17 31 34 27 33 30 37 36 21,885Not used in last 12 months 46 43 13 24 33 27 31 27 36 30 12,039
Overall level of perceived ASBHigh 75 66 32 53 56 48 57 55 70 66 4,970Not high 40 49 12 24 28 22 28 24 30 28 27,345
Newspaper of choice'Popular'
The Sun 50 49 16 32 35 30 36 31 40 39 7,457The Daily Mirror 49 49 17 28 35 29 33 32 39 37 3,818The Daily Mail 50 53 14 29 36 28 36 29 40 33 6,805The Daily Express 49 53 15 29 31 30 36 30 34 33 2,057The Daily Star 46 43 11 33 31 33 34 28 41 37 776
'Broadsheet'The Daily Telegraph 43 54 12 24 33 26 28 23 32 26 2,445The Guardian 35 60 20 28 26 20 25 31 32 31 1,688The Independent 42 60 21 32 35 26 33 36 36 36 965The Times 41 62 18 32 32 24 32 27 36 32 2,509The Financial Times 49 69 20 36 38 26 24 45 42 45 294
Some other newspaper 43 46 16 33 37 23 35 23 39 34 489No one newspaper in particular 49 62 17 22 39 18 33 26 44 26 339Would not want to read any newspaper 42 45 16 25 29 22 27 27 32 30 4,000
Experience of crime in past 12 monthsVictim 57 59 22 40 42 34 45 39 49 46 7,044Non-victim 43 50 13 26 31 24 29 26 33 31 26,925
Police and local council dealing with ASB and crime issues in the local areaAgree 41 49 14 27 30 23 29 25 32 29 16,488Neither agree nor disagree 43 52 13 26 30 25 29 26 34 31 9,477Disagree 62 59 22 39 44 36 46 42 53 50 7,263
1.See 'Crime in England and Wales 2008/09 Volume 2' for definitions of personal characteristics.
Table 1.3 (continued) Proportion of adults perceiving crime levels increased in their local area by personal characteristics
Crime type perceived to have gone up ‘a lot’ or ‘a little’ in the local area:
16
Perc
enta
ges
2008
/09
BC
S
Ove
rall
crim
e B
ank/
cred
it ca
rd fr
aud
Gun
cr
imes
Kni
fe
crim
esH
omes
be
ing
brok
en
into
Car
s be
ing
stol
enC
ars
bein
g br
oken
in
to
Mug
ging
s/
stre
et
robb
erie
s
Vand
alis
mPe
ople
ge
tting
be
aten
up
Unw
eigh
ted
base
ALL
AD
ULT
S46
5216
2933
2733
2937
3433
,969
Stru
ctur
e of
hou
seho
ldS
ingl
e ad
ult &
chi
ld(r
en)
5150
2036
3828
3736
4045
1,73
6A
dults
& c
hild
(ren
)47
5417
3235
2735
3139
387,
585
Adu
lt(s)
and
no
child
ren
4652
1528
3326
3228
3632
24,6
48
Tota
l hou
seho
ld in
com
eLe
ss th
an £
10,0
0045
4117
2833
2732
3039
355,
057
£10,
000
less
than
£20
,000
4646
1427
3428
3328
3933
6,11
1£2
0,00
0 le
ss th
an £
30,0
0049
5618
3237
2934
3237
384,
582
£30,
000
less
than
£40
,000
4757
1530
3529
3631
3737
3,62
7£4
0,00
0 le
ss th
an £
50,0
0046
6116
3031
2734
2840
362,
718
£50,
000
or m
ore
4563
1833
3427
3230
3433
4,32
0 Te
nure
O
wne
r occ
upie
rs47
5415
2834
2732
2837
3323
,874
Soc
ial r
ente
rs49
4620
3035
2738
3339
395,
492
Priv
ate
rent
ers
4251
1532
2923
2929
3336
4,47
6
Acc
omm
odat
ion
type
Hou
ses
4752
1528
3427
3229
3734
28,7
74D
etac
hed
4452
1022
3226
2923
3428
8,92
9S
emi-d
etac
hed
4753
1529
3526
3328
3836
10,6
97Te
rrac
ed49
5118
3334
2835
3440
389,
148
Flat
s/m
aiso
nette
s44
5521
3631
2734
3235
353,
932
Oth
er a
ccom
mod
atio
n40
465
2121
1222
2218
915
0
Leng
th o
f res
iden
ce in
are
aLe
ss th
an 1
2 m
onth
s31
4811
3124
1726
2227
301,
600
12 m
onth
s bu
t les
s th
an 2
yea
rs34
4915
2829
2224
2526
321,
686
2 ye
ars
but l
ess
than
3 y
ears
3549
1828
2723
2730
2929
1,85
63
year
s bu
t les
s th
an 5
yea
rs40
5016
2631
2431
2533
332,
588
5 ye
ars
but l
ess
than
10
year
s45
5517
2933
2532
2937
334,
838
10 y
ears
but
less
than
20
year
s50
5215
3033
2934
3139
396,
424
20 o
r mor
e ye
ars
5253
1630
3729
3531
4135
14,9
76
1. S
ee 'C
rime
in E
ngla
nd a
nd W
ales
200
8/09
Vol
ume
2' fo
r def
initi
ons
of h
ouse
hold
cha
ract
eris
tics.
Tabl
e 1.
4 Pr
opor
tion
of a
dults
per
ceiv
ing
crim
e le
vels
incr
ease
d in
thei
r loc
al a
rea
by h
ouse
hold
cha
ract
eris
tics
Crim
e ty
pe p
erce
ived
to h
ave
gone
up
‘a lo
t’ or
‘a li
ttle’
in th
e lo
cal a
rea:
17
Perc
enta
ges
2008
/09
BC
S
Ove
rall
crim
eB
ank/
cred
it ca
rd fr
aud
Gun
crim
esK
nife
crim
esH
omes
bei
ng
brok
en in
toC
ars
bein
g st
olen
Car
s be
ing
brok
en in
toM
uggi
ngs/
st
reet
ro
bber
ies
Vand
alis
mPe
ople
ge
tting
be
aten
up
Unw
eigh
ted
base
ALL
AD
ULT
S46
5216
2933
2733
2937
3433
,969
Out
put A
rea
Cla
ssifi
catio
nB
lue
colla
r com
mun
ities
4947
1228
3428
3429
4138
5,51
1C
ity li
ving
4365
2440
3527
3931
3536
1,44
3C
ount
rysi
de35
455
1326
1924
1426
185,
139
Pro
sper
ing
subu
rbs
4455
1324
3426
2926
3331
7,78
4C
onst
rain
ed b
y ci
rcum
stan
ces
4947
1528
3326
3632
3941
3,16
6Ty
pica
l tra
its48
5312
2934
2732
3039
366,
698
Mul
ticul
tura
l53
5338
5242
3040
4542
422,
578
Are
a ty
peU
rban
4954
1834
3528
3534
4039
25,1
73R
ural
37
445
1227
2025
1228
188,
796
Leve
l of p
hysi
cal d
isor
der i
n th
e ar
ea1
Hig
h 55
5022
4541
3143
3847
501,
825
Not
hig
h46
5215
2833
2732
2836
3331
,025
Inde
x of
dep
rivat
ion2
20%
mos
t dep
rived
out
put a
reas
5147
2438
3530
3637
4344
5,72
7O
ther
out
put a
reas
4753
1530
3326
3330
3835
18,8
1320
% le
ast d
epriv
ed o
utpu
t are
as42
5711
2234
2630
2232
266,
383
1. B
ased
upo
n th
e in
terv
iew
er's
ass
essm
ent o
f the
loca
l are
a (s
ee 'C
rime
in E
ngla
nd a
nd W
ales
200
8/09
Vol
ume
2' fo
r fur
ther
det
ails
).
3. S
ee 'C
rime
in E
ngla
nd a
nd W
ales
200
8/09
Vol
ume
2' fo
r def
initi
ons
of a
rea
char
acte
ristic
s.
Tabl
e 1.
5 P
ropo
rtio
n of
adu
lts p
erce
ivin
g cr
ime
leve
ls in
crea
sed
in th
eir l
ocal
are
a by
are
a ch
arac
teris
tics
Crim
e ty
pe p
erce
ived
to h
ave
gone
up
‘a lo
t’ or
‘a li
ttle’
in th
e lo
cal a
rea:
2. B
ased
on
Inde
x of
Mul
tiple
Dep
rivat
ion
2007
. Wal
es is
not
incl
uded
her
e as
the
Inde
x of
Mul
tiple
Dep
rivat
ion
2007
cov
ers
Eng
land
onl
y (s
ee 'C
rime
in E
ngla
nd a
nd W
ales
200
8/09
Vol
ume
2' fo
r fur
ther
det
ails
).
18
Perc
enta
ges1
2008
/09
BC
SP
erce
ptio
n of
crim
e in
the
loca
l are
a co
mpa
red
with
the
coun
try a
s a
who
le
Hig
her t
han
aver
age
Abo
ut
aver
age
Low
er th
an
aver
age
Unw
eigh
ted
base
Hig
her t
han
aver
age
Abo
ut
aver
age
Low
er th
an
aver
age
Unw
eigh
ted
base
ALL
AD
ULT
S11
3951
34,1
84R
espo
nden
t's o
ccup
atio
nM
anag
eria
l and
pro
fess
iona
l occ
upat
ions
1032
5911
,298
Age
Inte
rmed
iate
occ
upat
ions
938
537,
170
16-2
414
4145
2,88
2R
outin
e an
d m
anua
l occ
upat
ions
1245
4313
,048
25-3
415
3848
4,71
2N
ever
wor
ked
and
long
-term
une
mpl
oyed
1440
461,
139
35-4
412
3751
6,43
5Fu
ll-tim
e st
uden
ts16
3845
1,35
045
-54
1039
525,
589
Not
cla
ssifi
ed10
5633
179
55-6
48
3853
5,74
365
-74
740
524,
672
Hig
hest
qua
lific
atio
n75
+7
4053
4,15
1D
egre
e or
dip
lom
a10
3258
10,9
75A
ppre
ntic
eshi
p or
A/A
S le
vel
1138
525,
604
Men
1136
5315
,362
O le
vel/G
CS
E11
4148
6,78
4O
ther
1541
441,
403
16-2
415
3847
1,31
8N
one
1146
439,
337
25-3
416
3449
2,03
635
-44
1234
552,
958
Long
-sta
ndin
g ill
ness
or d
isab
ility
45
-54
936
552,
679
Long
-sta
ndin
g ill
ness
or d
isab
ility
11
4346
9,28
955
-64
836
562,
621
Lim
its a
ctiv
ities
1244
446,
400
65-7
47
3954
2,13
5D
oes
not l
imit
activ
ities
940
512,
889
75+
735
581,
615
No
long
-sta
ndin
g ill
ness
or d
isab
ility
11
3752
24,8
33
Wom
en11
4148
18,8
22In
tern
et u
sage
Use
d in
last
12
mon
ths
1136
5322
,113
16-2
413
4344
1,56
4N
ot u
sed
in la
st 1
2 m
onth
s11
4544
12,0
2625
-34
1441
462,
676
35-4
412
4048
3,47
7O
vera
ll le
vel o
f per
ceiv
ed A
SB45
-54
1041
492,
910
Hig
h29
4922
4,97
255
-64
940
513,
122
Not
hig
h7
3657
27,5
2665
-74
742
512,
537
75+
743
502,
536
New
spap
er o
f cho
ice
'Pop
ular
'Et
hnic
gro
upTh
e S
un13
4442
7,49
8W
hite
10
3951
31,7
46Th
e D
aily
Mirr
or11
4742
3,83
4N
on-W
hite
1939
422,
433
The
Dai
ly M
ail
737
566,
848
Mix
ed21
3247
206
The
Dai
ly E
xpre
ss6
4054
2,07
0A
sian
or A
sian
Brit
ish
1939
431,
142
The
Dai
ly S
tar
1345
4279
0B
lack
or B
lack
Brit
ish
1843
3973
6'B
road
shee
t'C
hine
se o
r oth
er20
3545
349
The
Dai
ly T
eleg
raph
529
662,
470
The
Gua
rdia
n17
3152
1,70
7M
arita
l sta
tus
The
Inde
pend
ent
1334
5397
3M
arrie
d8
3755
16,0
57Th
e Ti
mes
931
602,
534
Coh
abiti
ng13
3947
3,11
0Th
e Fi
nanc
ial T
imes
2426
4929
8S
ingl
e15
4044
6,92
7S
ome
othe
r new
spap
er16
4044
491
Sep
arat
ed17
4241
1,03
9N
o on
e ne
wsp
aper
in p
artic
ular
1533
5234
8D
ivor
ced
1243
453,
060
Wou
ld n
ot w
ant t
o re
ad a
ny n
ewsp
aper
1239
503,
998
Wid
owed
844
483,
979
Expe
rienc
e of
crim
e in
last
12
mon
ths
Res
pond
ent's
em
ploy
men
t sta
tus
Vic
tim17
4241
7,09
9In
em
ploy
men
t11
3752
19,0
12N
ot a
vic
tim9
3854
27,0
85U
nem
ploy
ed18
4339
828
Eco
nom
ical
ly in
activ
e11
4148
14,2
49Po
lice
and
loca
l cou
ncil
deal
ing
with
ASB
and
crim
e is
sues
in th
e lo
cal a
rea
Stu
dent
1840
4383
4A
gree
938
5416
,592
Look
ing
afte
r fam
ily/h
ome
1442
441,
875
Nei
ther
agr
ee n
or d
isag
ree
937
539,
527
Long
-term
/tem
pora
rily
sick
/ill
1750
331,
548
Dis
agre
e17
4340
7,27
7R
etire
d7
3954
9,60
0O
ther
inac
tive
1440
4639
2
1. R
ead
as th
e pe
rcen
tage
of a
ll ad
ults
per
ceiv
ing
that
crim
e is
hig
her t
han
aver
age,
abo
ut a
vera
ge a
nd lo
wer
than
ave
rage
for e
ach
char
acte
ristic
of i
nter
est.
For e
xam
ple,
11
per c
ent o
f men
per
ceiv
ed c
rime
in th
eir
lo
cal a
rea
as h
ighe
r tha
n av
erag
e, 3
6 pe
r cen
t as
abou
t ave
rage
and
53
per c
ent a
s lo
wer
than
ave
rage
.
Tabl
e 1.
6 Pe
rcep
tion
of c
rime
in th
e lo
cal a
rea,
com
pare
d w
ith th
e co
untr
y as
a w
hole
, by
pers
onal
cha
ract
eris
tics
2. S
ee 'C
rime
in E
ngla
nd a
nd W
ales
200
8/09
Vol
ume
2' fo
r def
initi
ons
of p
erso
nal c
hara
cter
istic
s.
19

Percentages1 2008/09 BCS
Higher than average
About average Lower than average
Unweighted base
ALL ADULTS 11 39 51 34,184
Structure of householdSingle adult and child(ren) 20 47 34 1,745Adults & child(ren) 11 37 52 7,649Adult(s) & no child(ren) 11 39 50 24,790
Total household incomeLess than £10,000 14 47 39 5,055£10,000 less than £20,000 11 43 46 6,125£20,000 less than £30,000 12 42 46 4,631£30,000 less than £40,000 9 37 53 3,666£40,000 less than £50,000 9 35 56 2,730£50,000 or more 9 29 62 4,373
TenureOwner occupiers 8 37 55 23,939Social renters 18 49 32 5,509Private renters 14 37 48 4,607
Accommodation type Houses 10 38 53 28,925
Detached 4 27 69 8,983Semi-detached 10 40 50 10,736Terraced 14 44 41 9,206
Flats/maisonettes 18 44 38 3,982Other accommodation 7 38 56 153
Output Area ClassificationBlue collar communities 13 50 37 5,546City living 17 37 45 1,463Countryside 2 19 79 5,175Prospering suburbs 5 32 63 7,834Constrained by circumstances 15 51 34 3,183Typical traits 7 41 51 6,744Multicultural 29 45 26 2,565
Area typeUrban 13 44 43 25,296Rural 3 20 77 8,888
Level of physical disorderHigh 25 51 24 1,820Not high 10 38 53 31,235
Index of deprivation2
20% most deprived output areas 22 52 26 5,747Other output areas 10 39 51 18,91620% least deprived output areas 4 26 70 6,463
1. Read as the percentage of all adults perceiving that crime is higher than average, about average and lower than
average for each characteristic of interest. For example, eight per cent of owner occupiers perceived crime in their
local area as higher than average, 37 per cent as about average and 55 per cent as lower than average.
covers England only (see 'Crime in England and Wales 2008/09 Volume 2' for further details).
2. Based on Index of Multiple Deprivation 2007. Wales is not included here as the Index of Multiple Deprivation 2007
3. See 'Crime in England and Wales 2008/09 Volume 2' for definitions of household and area characteristics.
Table 1.7 Perception of crime in the local area, compared with the country as a whole, by household and area characteristics
Perception of crime in the local area compared with the country as a whole
20
Percentages
High crime
Low crime
1 2 3 4 5 6 7 8 9 10
Higher than average 28 20 16 13 12 8 7 5 3 1About average 49 52 48 47 45 41 37 29 26 19Lower than average 22 28 36 40 44 51 57 67 71 80
Unweighted base 2,781 2,623 2,607 2,912 3,110 3,219 3,184 3,358 3,463 3,8691. The ten per cent of areas with the highest deprivation (Crime Domain) scores are identified as the highest crime areas and the ten per cent of areas with the lowest deprivation (Crime Domain) scores are identified as the lowest crime areas. See box 1.4 for moreinformation.
Table 1.8 Perception of crime in the local area, compared with the country as a whole, by Index of Multiple Deprivation (Crime Domain) level, (England only)
2008/09 BCS
Index of Multiple Deprivation (Crime Domain)1
Percentage perceiving that they live in a 'higher than average', 'about average' or 'lower than average' crime area
21
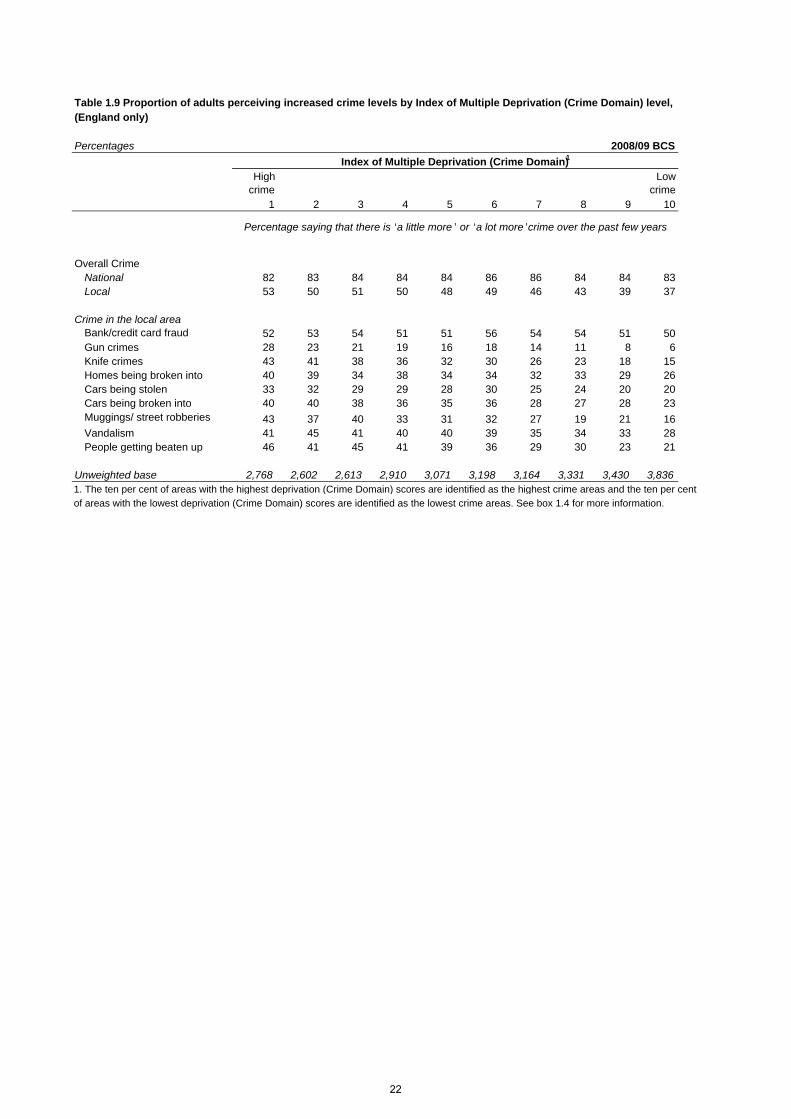
Percentages
High crime
Low crime
1 2 3 4 5 6 7 8 9 10
Overall CrimeNational 82 83 84 84 84 86 86 84 84 83Local 53 50 51 50 48 49 46 43 39 37
Crime in the local areaBank/credit card fraud 52 53 54 51 51 56 54 54 51 50Gun crimes 28 23 21 19 16 18 14 11 8 6Knife crimes 43 41 38 36 32 30 26 23 18 15Homes being broken into 40 39 34 38 34 34 32 33 29 26Cars being stolen 33 32 29 29 28 30 25 24 20 20Cars being broken into 40 40 38 36 35 36 28 27 28 23Muggings/ street robberies 43 37 40 33 31 32 27 19 21 16Vandalism 41 45 41 40 40 39 35 34 33 28People getting beaten up 46 41 45 41 39 36 29 30 23 21
Unweighted base 2,768 2,602 2,613 2,910 3,071 3,198 3,164 3,331 3,430 3,8361. The ten per cent of areas with the highest deprivation (Crime Domain) scores are identified as the highest crime areas and the ten per centof areas with the lowest deprivation (Crime Domain) scores are identified as the lowest crime areas. See box 1.4 for more information.
Percentage saying that there is ‘a little more ’ or ‘a lot more ’crime over the past few years
Index of Multiple Deprivation (Crime Domain)12008/09 BCS
Table 1.9 Proportion of adults perceiving increased crime levels by Index of Multiple Deprivation (Crime Domain) level, (England only)
22
2. Perceptions of anti-social behaviour
Jenny Parfrement-Hopkins and Philip Hall
2.1 SUMMARY
This chapter presents further analysis of the 2008/09 British Crime Survey (BCS), focusing on perceptions of anti-social behaviour (ASB).
The BCS includes questions about how much of a problem a range of different types (or strands) of ASB are in the local area. Seven of these questions are used to create an overall index to provide a measure of those with a high level of perceived ASB. ‘Crime in England and Wales, 2008/09’ shows that the proportion of people with a high level of perceived ASB has remained stable (at 17%) compared with the 2007/08 BCS.
The current analysis shows that, when considering their local area, two-thirds of people either did not perceive a problem with any of the seven types of ASB or perceived a problem with only one of them (43% and 18% respectively). When three types of ASB were perceived together, the most common combinations were:
• teenagers hanging around, litter and vandalism or graffiti (mentioned by 2% of people who perceived at least one strand of ASB as a problem); and
• teenagers hanging around, people using or dealing drugs and people being drunk or rowdy (2%).
These strands also featured in the most commonly reported combinations of four or five types of ASB. Very few people perceived a problem with more than five strands of ASB (4%).
Thirty per cent of people perceived teenagers hanging around to be a problem and 81 per cent of these people also perceived the teenagers’ behaviour to be anti-social (representing 22% of people overall). Within this group, problem behaviours perceived included drinking alcohol, taking drugs and carrying knives (mentioned by 77%, 37% and 12% of those perceiving teenagers’ behaviour to be anti-social).
Two-thirds (65%) of people who perceived a problem with people using or dealing drugs in the local area perceived a problem with both behaviours, 12 per cent with drug use only and eight per cent with drug dealing only. Sixty-one per cent of people who perceived a problem with drug use had formed their impressions through personal experience compared with 54 per cent of those who perceived a problem with drug dealing. This is considerably lower than the equivalent figure for people who perceived a problem with people being drunk or rowdy (86%).
Eighty per cent of people who perceived a problem with people being drunk or rowdy in the local area perceived a problem with both behaviours, nine per cent with people being drunk only and ten per cent with people being rowdy only. The majority (70%) of people who perceived a problem with people being drunk thought that the people who were drunk were behaving in an anti-social manner. The most common problem behaviour associated with people being drunk or rowdy was noise (mentioned by 76% of people who perceived a problem).
23
Supplementary Volume 1 to Crime in England and Wales 2008/09
2.2 INTRODUCTION
The term anti-social behaviour (ASB) as used in the British Crime Survey (BCS) covers a range of behaviours and outcomes from criminal behaviour (such as damage to property) to general nuisance, all of which may impinge on the quality of people’s lives. ASB cannot be measured in the same way as experience of crime; it is often not possible to specify who is the ‘victim’ or what is an ‘incident’. As a result, the BCS has included questions on perceptions of ASB for a number of years, including questions about how much of a problem a range of different types of ASB are in the local area. Seven of these questions are used to create an overall index to provide a measure of those with a high level of perceived ASB1 (see box 2.1).
The 2008/09 BCS shows that the proportion of people with a high level of perceived ASB has remained stable (at 17%) compared with the 2007/08 BCS and down from a high of 21 per
1 This overall measure forms one of the indicators for a Government Public Service Agreement (PSA) on ‘Making Communities Safer’ (PSA 23). Additionally, two of the individual strands (perceiving problems with people being drunk and rowdy and perceiving problems with people using or dealing drugs) are performance indicators for PSA 25 ‘Reduce the harm caused by alcohol or drugs’. (Further information about Public Service Agreements can be found in ‘Crime in England and Wales 2008/09’ (Walker et al. 2009)).
Box 2.1 Questions on perceptions of anti-social behaviour
The BCS asks respondents how much of a problem a range of different types of anti-social behaviour (ASB) are in their local area. The questions provide a snapshot of the respondent’s perceptions of problems in their area at the time of interview. The BCS asks:
For the following things I read out, can you tell me how much of a problem they are in your area. By your area I mean within 15 minutes walk from here.
…..Teenagers hanging around on the streets?
…..Vandalism, graffiti and other deliberate damage to property or vehicles?
…..People using or dealing drugs?
…..People being drunk or rowdy in public places?
…..Rubbish or litter lying around?
….Noisy neighbours or loud parties?
….Abandoned or burnt-out cars?
Respondents are asked to select their answers from the following response list:
• Very big problem
• Fairly big problem
• Not a very big problem
• Not a problem at all.
The BCS uses the responses to these seven individual ASB questions to construct a scale to measure ‘high’ levels of overall perceived ASB. The scale scores the responses to the questions as follows: ‘very big problem’ = 3, ‘fairly big problem’ = 2, ‘not a very big problem’ = 1 and ‘not a problem at all’ = 0. The maximum score for the seven questions is 21. Those respondents with a score of 11 or more on this scale were classified as having high levels of perceived ASB.
24
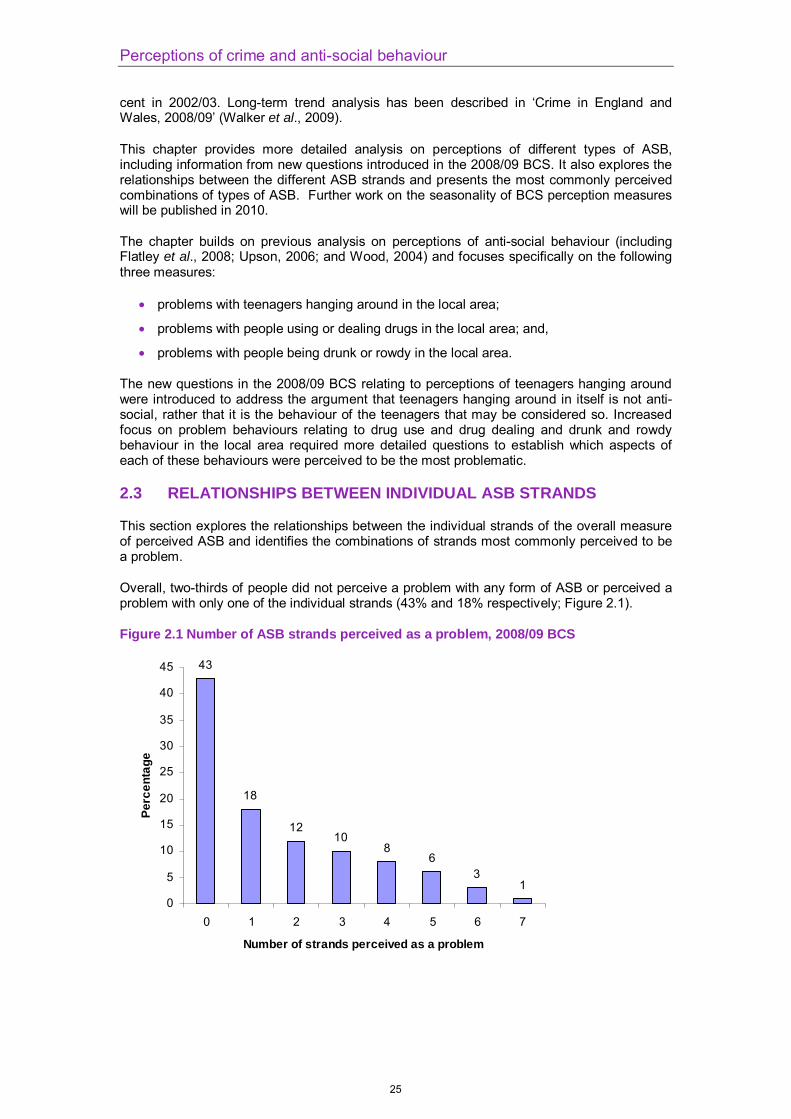
Perceptions of crime and anti-social behaviour
cent in 2002/03. Long-term trend analysis has been described in ‘Crime in England and Wales, 2008/09’ (Walker et al., 2009).
This chapter provides more detailed analysis on perceptions of different types of ASB, including information from new questions introduced in the 2008/09 BCS. It also explores the relationships between the different ASB strands and presents the most commonly perceived combinations of types of ASB. Further work on the seasonality of BCS perception measures will be published in 2010.
The chapter builds on previous analysis on perceptions of anti-social behaviour (including Flatley et al., 2008; Upson, 2006; and Wood, 2004) and focuses specifically on the following three measures:
• problems with teenagers hanging around in the local area;
• problems with people using or dealing drugs in the local area; and,
• problems with people being drunk or rowdy in the local area.
The new questions in the 2008/09 BCS relating to perceptions of teenagers hanging around were introduced to address the argument that teenagers hanging around in itself is not anti-social, rather that it is the behaviour of the teenagers that may be considered so. Increased focus on problem behaviours relating to drug use and drug dealing and drunk and rowdy behaviour in the local area required more detailed questions to establish which aspects of each of these behaviours were perceived to be the most problematic.
2.3 RELATIONSHIPS BETWEEN INDIVIDUAL ASB STRANDS
This section explores the relationships between the individual strands of the overall measure of perceived ASB and identifies the combinations of strands most commonly perceived to be a problem.
Overall, two-thirds of people did not perceive a problem with any form of ASB or perceived a problem with only one of the individual strands (43% and 18% respectively; Figure 2.1).
Figure 2.1 Number of ASB strands perceived as a problem, 2008/09 BCS
43
18
1210
86
31
0
5
10
15
20
25
30
35
40
45
0 1 2 3 4 5 6 7
Number of strands perceived as a problem
Perc
enta
ge
25
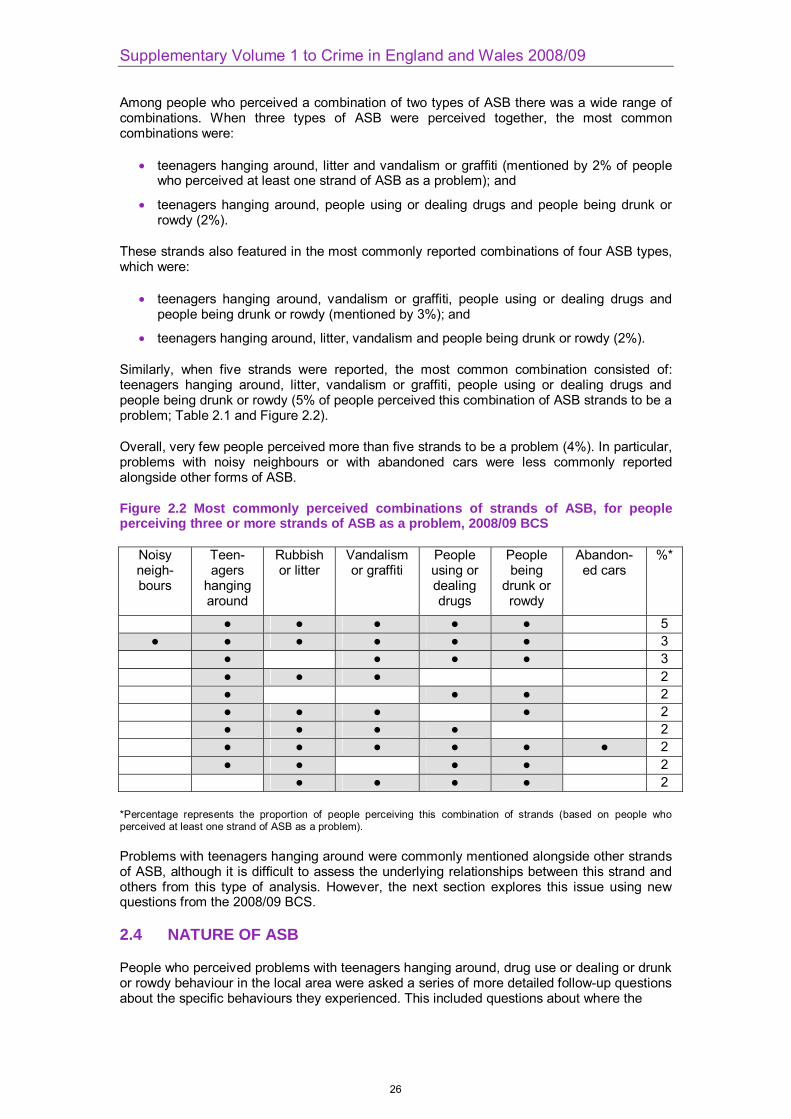
Supplementary Volume 1 to Crime in England and Wales 2008/09
Among people who perceived a combination of two types of ASB there was a wide range of combinations. When three types of ASB were perceived together, the most common combinations were:
• teenagers hanging around, litter and vandalism or graffiti (mentioned by 2% of people who perceived at least one strand of ASB as a problem); and
• teenagers hanging around, people using or dealing drugs and people being drunk or rowdy (2%).
These strands also featured in the most commonly reported combinations of four ASB types, which were:
• teenagers hanging around, vandalism or graffiti, people using or dealing drugs and people being drunk or rowdy (mentioned by 3%); and
• teenagers hanging around, litter, vandalism and people being drunk or rowdy (2%).
Similarly, when five strands were reported, the most common combination consisted of: teenagers hanging around, litter, vandalism or graffiti, people using or dealing drugs and people being drunk or rowdy (5% of people perceived this combination of ASB strands to be a problem; Table 2.1 and Figure 2.2).
Overall, very few people perceived more than five strands to be a problem (4%). In particular, problems with noisy neighbours or with abandoned cars were less commonly reported alongside other forms of ASB.
Figure 2.2 Most commonly perceived combinations of strands of ASB, for people perceiving three or more strands of ASB as a problem, 2008/09 BCS
Noisy neigh-bours
Teen-agers
hanging around
Rubbish or litter
Vandalism or graffiti
People using or dealing drugs
People being
drunk or rowdy
Abandon-ed cars
%*
● ● ● ● ● 5 ● ● ● ● ● ● 3 ● ● ● ● 3 ● ● ● 2 ● ● ● 2 ● ● ● ● 2 ● ● ● ● 2 ● ● ● ● ● ● 2 ● ● ● ● 2 ● ● ● ● 2
*Percentage represents the proportion of people perceiving this combination of strands (based on people who perceived at least one strand of ASB as a problem).
Problems with teenagers hanging around were commonly mentioned alongside other strands of ASB, although it is difficult to assess the underlying relationships between this strand and others from this type of analysis. However, the next section explores this issue using new questions from the 2008/09 BCS.
2.4 NATURE OF ASB
People who perceived problems with teenagers hanging around, drug use or dealing or drunk or rowdy behaviour in the local area were asked a series of more detailed follow-up questions about the specific behaviours they experienced. This included questions about where the
26
Perceptions of crime and anti-social behaviour
incidents took place, how regularly the behaviours were experienced and details about the exact nature of the problem.
Young people and ASB
Of the seven strands that make up the overall ASB measure, teenagers hanging around has remained one of the most widely perceived problems for a number of years. The 2008/09 figures showed that 30 per cent of people perceived teenagers hanging around to be a problem in their local area. This was stable compared with 2007/08.
However, this measure has come under some criticism2 since teenagers hanging around (in itself) is not an anti-social behaviour. In order to address this argument, in 2008/09 people who thought teenagers hanging around were a problem were asked if they believed the young people were behaving in an anti-social manner; the majority, 81 per cent of those perceiving a problem, believed that they were (suggesting that most people were interpreting the initial question in the way it was intended). Thus, while 30 per cent of people overall perceived teenagers hanging around to be a problem, 22 per cent perceived teenagers hanging around to be a problem and identified specific acts of ASB associated with teenagers3.
A range of different behaviours associated with this problem were reported. Some of the most commonly reported problems included: swearing or using bad language; being loud, noisy or rowdy; just being a general nuisance; or littering (mentioned by 80%, 78%, 72% and 63% respectively of those perceiving the teenagers’ behaviour to be anti-social; Table 2.2). However, some of the behaviours reported may be considered more serious, including:
• drinking alcohol (77% of those perceiving teenagers’ behaviour to be anti-social);
• being abusive or harassing people (50%);
• fighting with each other (38%);
• taking drugs (37%);
• intimidating or threatening people (36%);
• physically assaulting people (11%); and
• carrying knives (12%).
In comparison, people who perceived teenagers hanging around to be a problem, but their behaviour not to be anti-social, tended to report fewer and less serious problems (Table 2.3). However, these findings should be treated with some caution as questions relating to the types of problems perceived were not directly comparable between people who perceived teenagers’ behaviour to be anti-social and those who did not4. Problems reported by people who did not perceive teenagers’ behaviour to be anti-social included:
• threatening or intimidating behaviour (30% of those not perceiving teenagers’ behaviour to be anti-social);
• boredom/having nothing to do (30%);
• hanging around (23%);
• being noisy, loud or rowdy (13%); and
• littering (3%).
2 For example: http://www.bbc.co.uk/blogs/thereporters/markeaston/2008/11/ 3 Estimate based on the quarter sample asked this question. 4 People who perceived teenagers’ behaviour to be anti-social were asked to select any behaviours they perceived from a list presented to them (they were also able to specify any additional behaviours they perceived that were not on the list). People who did not perceive teenagers’ behaviour to be anti-social were asked to specify what problems they perceived with teenagers hanging around, without reference to a list of options.
27
Supplementary Volume 1 to Crime in England and Wales 2008/09
It is interesting to note that perceptions of whether behaviour is anti-social differ from person to person. For example, teenagers being loud, noisy or rowdy was identified as a problem with teenagers hanging around both by those perceiving their behaviour to be anti-social and those who did not.
The characteristics of people who perceived teenagers hanging around to be a problem and their behaviour to be anti-social were similar to those who had a high level of perceived ASB. Details of the characteristics associated with having a high level of perceived ASB are summarised in ‘Crime in England and Wales, 2008/09’ and described in more detail in ‘Supplementary Volume 1 to Crime in England and Wales 2007/08’.
People using or dealing drugs
The 2008/09 BCS showed that 28 per cent of people perceived people using or dealing drugs to be a problem in their local area. This represents an increase (from 26%) compared with the 2007/08 figures, but an overall decrease compared with the 2001/02 figures (31% perceived a problem in 2001/02).
The initial question measuring perceptions of how much of a problem drug use and dealing is in the local area does not differentiate between problems with drug use and with drug dealing as separate behaviours. In 2008/09 those who perceived people using or dealing drugs to be a problem in their local area were asked to specify whether there was a problem with people using drugs, with people dealing drugs, or whether both behaviours were a problem. Two-thirds (65%) said both drug use and drug dealing were a problem, whilst 12 per cent and eight per cent respectively said that drug use or drug dealing alone was a problem. A further 16 per cent were not sure whether drug use or dealing separately, or both, were a problem.
People perceiving problems with drug use and/or drug dealing in their local area were asked how they formed their impression of the problem(s). Previous analysis5 has shown that of all of the individual strands of ASB, impressions of problem drug use and drug dealing were least commonly formed through the respondent’s personal experience and this is supported by findings on drunk and rowdy behaviour reported in the next section. Impressions of both drug use and drug dealing were formed on a similar basis, most commonly through personal experience (61% for drug use and 54% for drug dealing; Table 2.4). However, people who perceived drug use to be a problem were slightly more likely to say that the problem occurred close to where they lived than people who perceived drug dealing to be a problem (54% compared with 49%; Table 2.5).
Other common ways of forming an impression of drug use and/or dealing as a problem included:
• it being just generally known in the area (39% for drug use and 38% for dealing);
• experiences of others (e.g. neighbours, friends; 37% for drug use and 36% for dealing); and
• through the local media (22% for drug use and 21% for dealing).
As might be expected, those who were not sure whether there was a problem with drug use, drug dealing or with both in their local area were less likely to have personally experienced either behaviour (only 22% of this group formed their impressions through personal experience), were less likely to say the problem occurred close to where they lived (13%) and were more likely to say that they didn’t know.
5 See ‘Perceptions and experience of anti-social behaviour: findings from the 2003/2004 British Crime Survey’ (Wood, 2004)
28
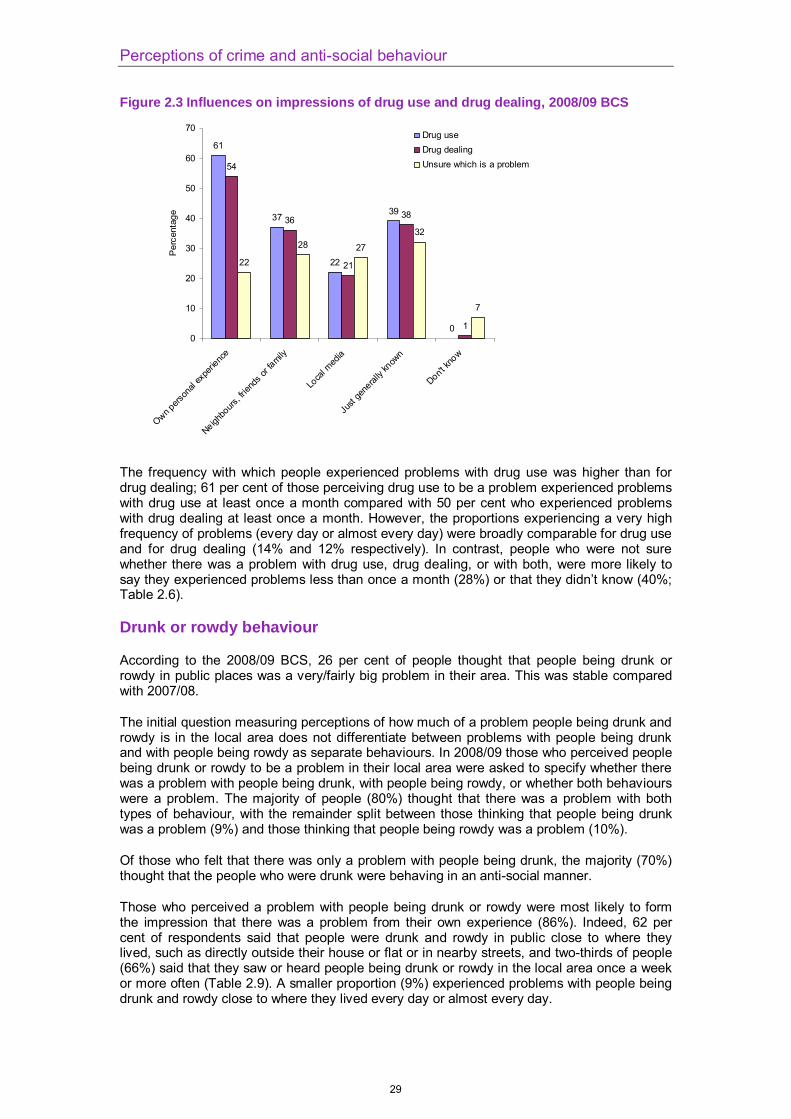
Perceptions of crime and anti-social behaviour
Figure 2.3 Influences on impressions of drug use and drug dealing, 2008/09 BCS
61
37
22
39
0
54
36
21
38
1
22
28 27
32
7
0
10
20
30
40
50
60
70
Own pers
onal
expe
rienc
e
Neighbo
urs, fr
iends
or fa
mily
Loca
l med
ia
Just
gene
rally
know
n
Don't kn
ow
Per
cent
age
Drug useDrug dealingUnsure which is a problem
The frequency with which people experienced problems with drug use was higher than for drug dealing; 61 per cent of those perceiving drug use to be a problem experienced problems with drug use at least once a month compared with 50 per cent who experienced problems with drug dealing at least once a month. However, the proportions experiencing a very high frequency of problems (every day or almost every day) were broadly comparable for drug use and for drug dealing (14% and 12% respectively). In contrast, people who were not sure whether there was a problem with drug use, drug dealing, or with both, were more likely to say they experienced problems less than once a month (28%) or that they didn’t know (40%; Table 2.6).
Drunk or rowdy behaviour
According to the 2008/09 BCS, 26 per cent of people thought that people being drunk or rowdy in public places was a very/fairly big problem in their area. This was stable compared with 2007/08.
The initial question measuring perceptions of how much of a problem people being drunk and rowdy is in the local area does not differentiate between problems with people being drunk and with people being rowdy as separate behaviours. In 2008/09 those who perceived people being drunk or rowdy to be a problem in their local area were asked to specify whether there was a problem with people being drunk, with people being rowdy, or whether both behaviours were a problem. The majority of people (80%) thought that there was a problem with both types of behaviour, with the remainder split between those thinking that people being drunk was a problem (9%) and those thinking that people being rowdy was a problem (10%).
Of those who felt that there was only a problem with people being drunk, the majority (70%) thought that the people who were drunk were behaving in an anti-social manner.
Those who perceived a problem with people being drunk or rowdy were most likely to form the impression that there was a problem from their own experience (86%). Indeed, 62 per cent of respondents said that people were drunk and rowdy in public close to where they lived, such as directly outside their house or flat or in nearby streets, and two-thirds of people (66%) said that they saw or heard people being drunk or rowdy in the local area once a week or more often (Table 2.9). A smaller proportion (9%) experienced problems with people being drunk and rowdy close to where they lived every day or almost every day.
29
Supplementary Volume 1 to Crime in England and Wales 2008/09
Thirty per cent of people said their impressions of drunk and rowdy behaviour were influenced by what they had been told by neighbours, friends and family and 20 per cent said that they were influenced by local newspapers, radio or television. Twenty-five per cent of people reported that the presence of drunk and rowdy behaviour was something that was just generally known (Table 2.8).
Those who perceived drunk and rowdy behaviour in public places to be a problem in their local area also reported a range of different behaviours (Table 2.7).
• In line with previous findings, the most common behaviour, mentioned by three-quarters of those perceiving a problem (76%), was that noise from people in the streets when they had been drinking caused a problem.
• The next most common problem was cans and bottles being left on the streets or thrown into gardens (69%). In addition, 55 per cent of people reported fast food-wrapping being left on the streets or thrown into gardens as a problem, 37 per cent reported people urinating in public places to be a problem and 34 per cent reported vomit on the pavements to be a problem. In total, 80 per cent of people who perceived a problem with drunk or rowdy behaviour reported one or more of these environmental factors to be a problem.
• Young people drinking in public places was mentioned by 57 per cent of those perceiving a problem, while homeless people and alcoholics drinking in public places was mentioned by 16 per cent.
• Fifty-six per cent of those perceiving a problem said that people being abusive when they had been drinking was a problem, and 49 per cent said that people being intimidating when they had been drinking was a problem. In total, 66 per cent of those perceiving a problem reported people being abusive or intimidating when they had been drinking to be a problem.
• Alcohol-related violence was reported by 43 per cent of people who perceived a problem, with 37 per cent reporting fighting within or between groups to be a problem and 23 per cent reporting violence/people being assaulted by drunks.
30
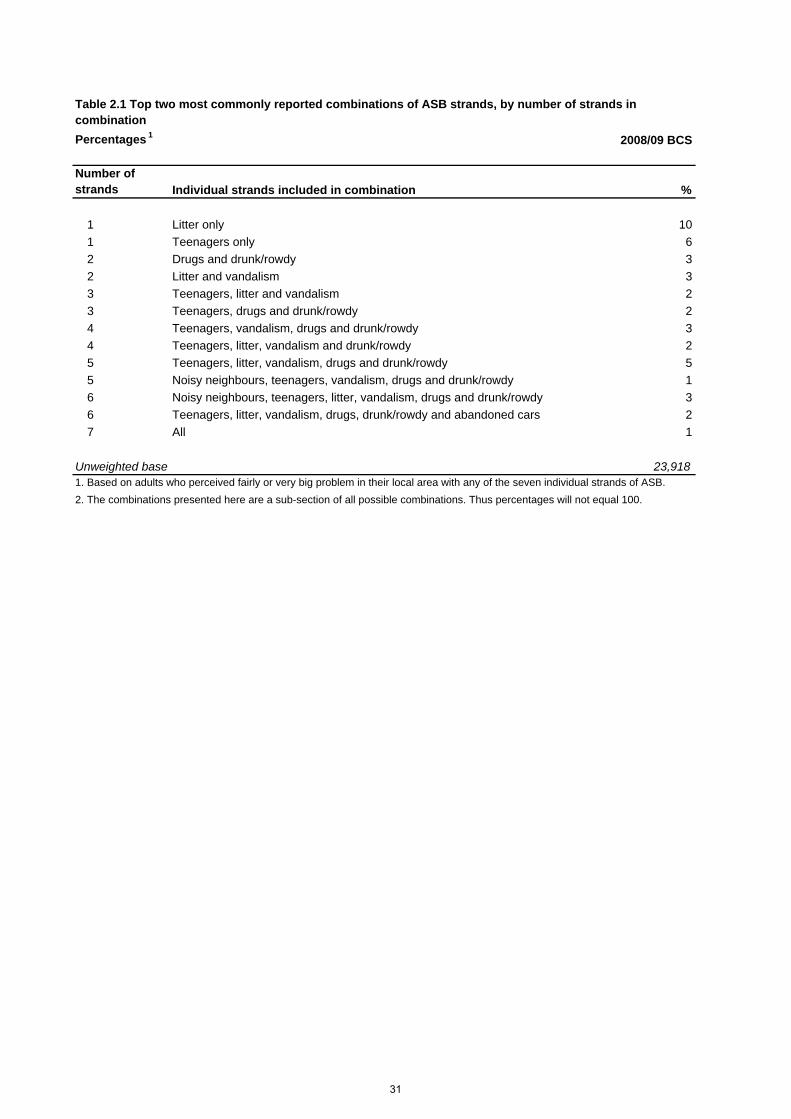
Percentages 1 2008/09 BCS
Number of strands Individual strands included in combination %
1 Litter only 101 Teenagers only 62 Drugs and drunk/rowdy 32 Litter and vandalism 33 Teenagers, litter and vandalism 23 Teenagers, drugs and drunk/rowdy 24 Teenagers, vandalism, drugs and drunk/rowdy 34 Teenagers, litter, vandalism and drunk/rowdy 25 Teenagers, litter, vandalism, drugs and drunk/rowdy 55 Noisy neighbours, teenagers, vandalism, drugs and drunk/rowdy 16 Noisy neighbours, teenagers, litter, vandalism, drugs and drunk/rowdy 36 Teenagers, litter, vandalism, drugs, drunk/rowdy and abandoned cars 27 All 1
Unweighted base 23,918
Table 2.1 Top two most commonly reported combinations of ASB strands, by number of strands in combination
1. Based on adults who perceived fairly or very big problem in their local area with any of the seven individual strands of ASB.2. The combinations presented here are a sub-section of all possible combinations. Thus percentages will not equal 100.
31
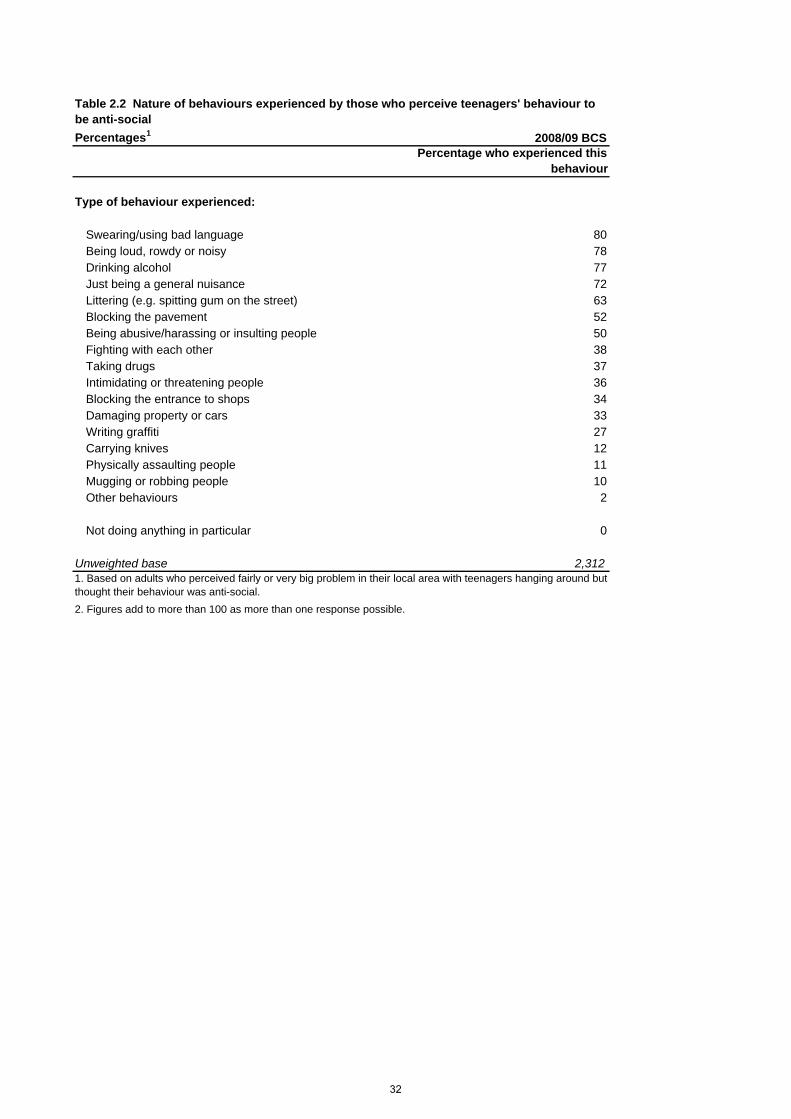
Percentages1 2008/09 BCSPercentage who experienced this
behaviour
Type of behaviour experienced:
Swearing/using bad language 80Being loud, rowdy or noisy 78Drinking alcohol 77Just being a general nuisance 72Littering (e.g. spitting gum on the street) 63Blocking the pavement 52Being abusive/harassing or insulting people 50Fighting with each other 38Taking drugs 37Intimidating or threatening people 36Blocking the entrance to shops 34Damaging property or cars 33Writing graffiti 27Carrying knives 12Physically assaulting people 11Mugging or robbing people 10Other behaviours 2
Not doing anything in particular 0
Unweighted base 2,3121. Based on adults who perceived fairly or very big problem in their local area with teenagers hanging around but thought their behaviour was anti-social.2. Figures add to more than 100 as more than one response possible.
Table 2.2 Nature of behaviours experienced by those who perceive teenagers' behaviour to be anti-social
32
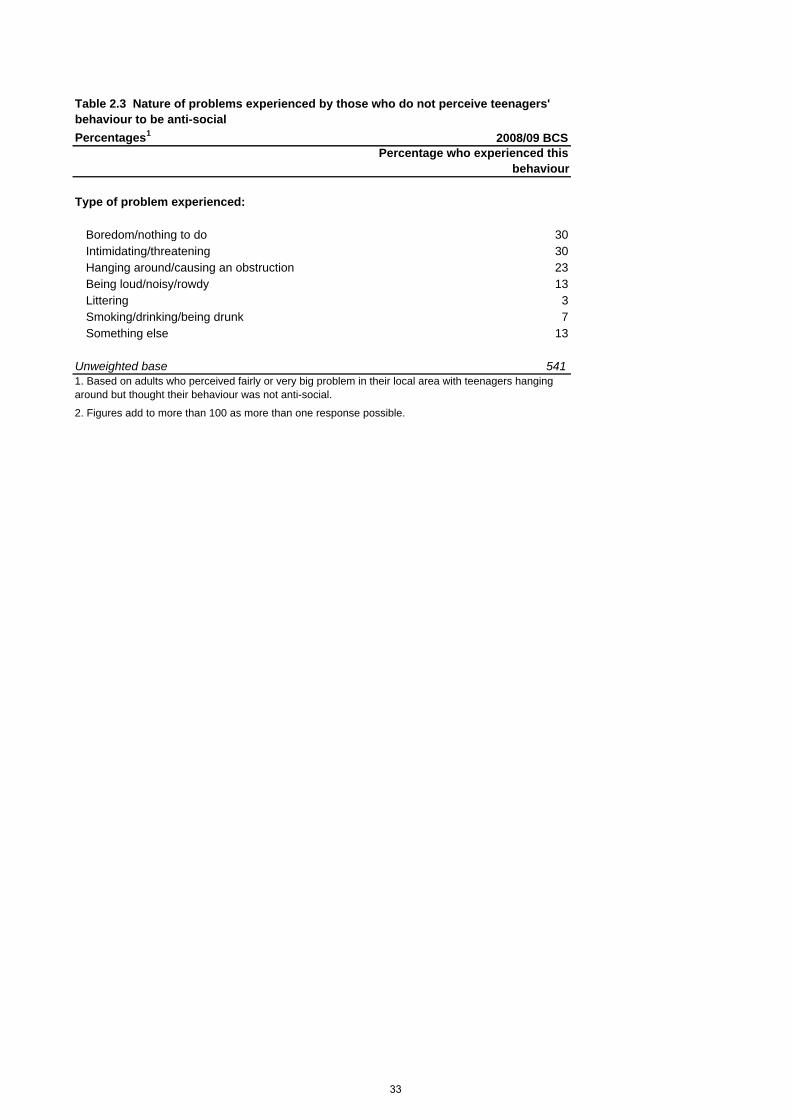
Percentages1 2008/09 BCSPercentage who experienced this
behaviour
Type of problem experienced:
Boredom/nothing to do 30Intimidating/threatening 30Hanging around/causing an obstruction 23Being loud/noisy/rowdy 13Littering 3Smoking/drinking/being drunk 7Something else 13
Unweighted base 5411. Based on adults who perceived fairly or very big problem in their local area with teenagers hanging around but thought their behaviour was not anti-social.
2. Figures add to more than 100 as more than one response possible.
Table 2.3 Nature of problems experienced by those who do not perceive teenagers' behaviour to be anti-social
33
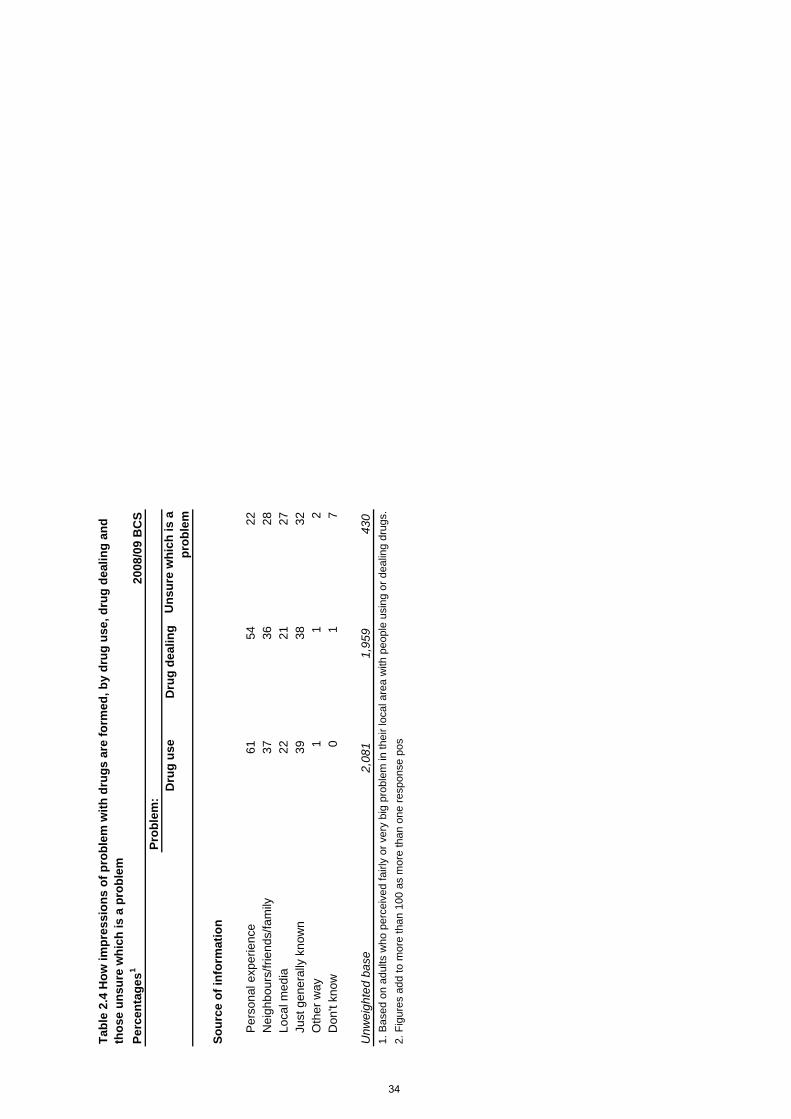
Perc
enta
ges1
2008
/09
BC
S
Dru
g us
eD
rug
deal
ing
Uns
ure
whi
ch is
a
prob
lem
Sour
ce o
f inf
orm
atio
n
Per
sona
l exp
erie
nce
6154
22N
eigh
bour
s/fri
ends
/fam
ily37
3628
Loca
l med
ia22
2127
Just
gen
eral
ly k
now
n39
3832
Oth
er w
ay1
12
Don
't kn
ow0
17
Unw
eigh
ted
base
2,08
11,
959
430
1. B
ased
on
adul
ts w
ho p
erce
ived
fairl
y or
ver
y bi
g pr
oble
m in
thei
r loc
al a
rea
with
peo
ple
usin
g or
dea
ling
drug
s.
Prob
lem
:
2. F
igur
es a
dd to
mor
e th
an 1
00 a
s m
ore
than
one
resp
onse
pos
s
Tabl
e 2.
4 H
ow im
pres
sion
s of
pro
blem
with
dru
gs a
re fo
rmed
, by
drug
use
, dru
g de
alin
g an
d th
ose
unsu
re w
hich
is a
pro
blem
34
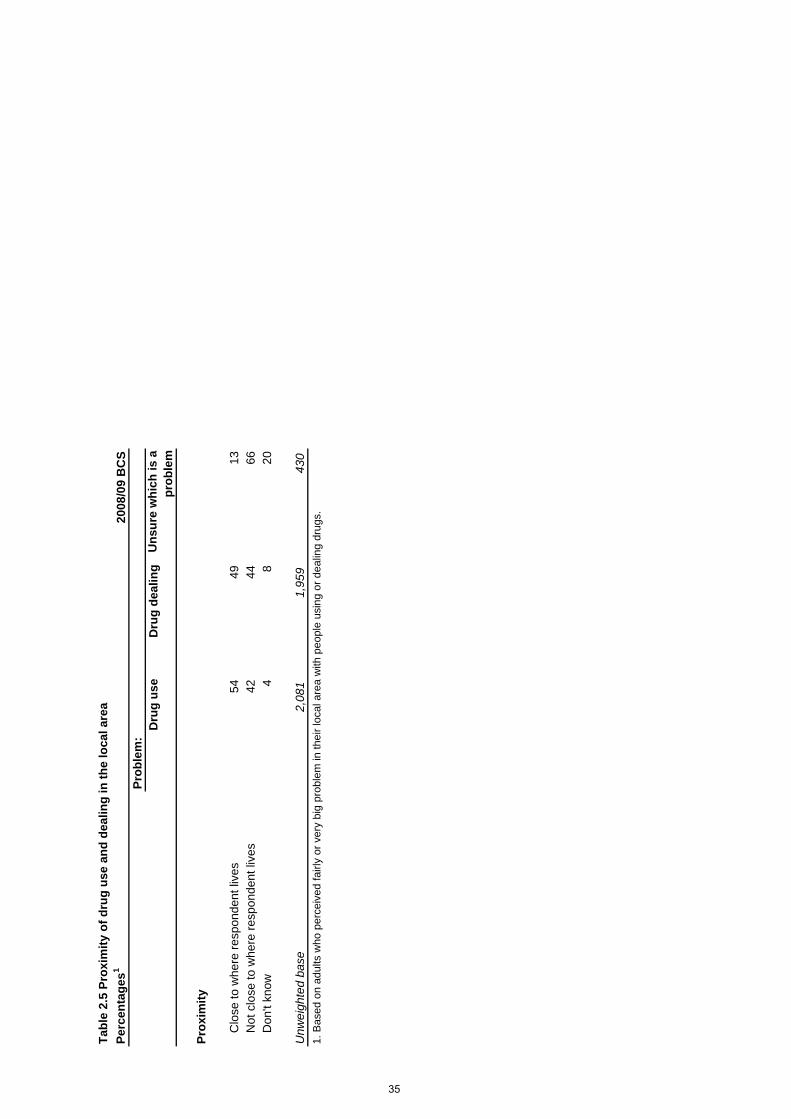
Perc
enta
ges1
2008
/09
BC
S
Dru
g us
eD
rug
deal
ing
Uns
ure
whi
ch is
a
prob
lem
Prox
imity
Clo
se to
whe
re re
spon
dent
live
s54
4913
Not
clo
se to
whe
re re
spon
dent
live
s42
4466
Don
't kn
ow4
820
Unw
eigh
ted
base
2,08
11,
959
430
1. B
ased
on
adul
ts w
ho p
erce
ived
fairl
y or
ver
y bi
g pr
oble
m in
thei
r loc
al a
rea
with
peo
ple
usin
g or
dea
ling
drug
s.
Tabl
e 2.
5 Pr
oxim
ity o
f dru
g us
e an
d de
alin
g in
the
loca
l are
a
Prob
lem
:
35
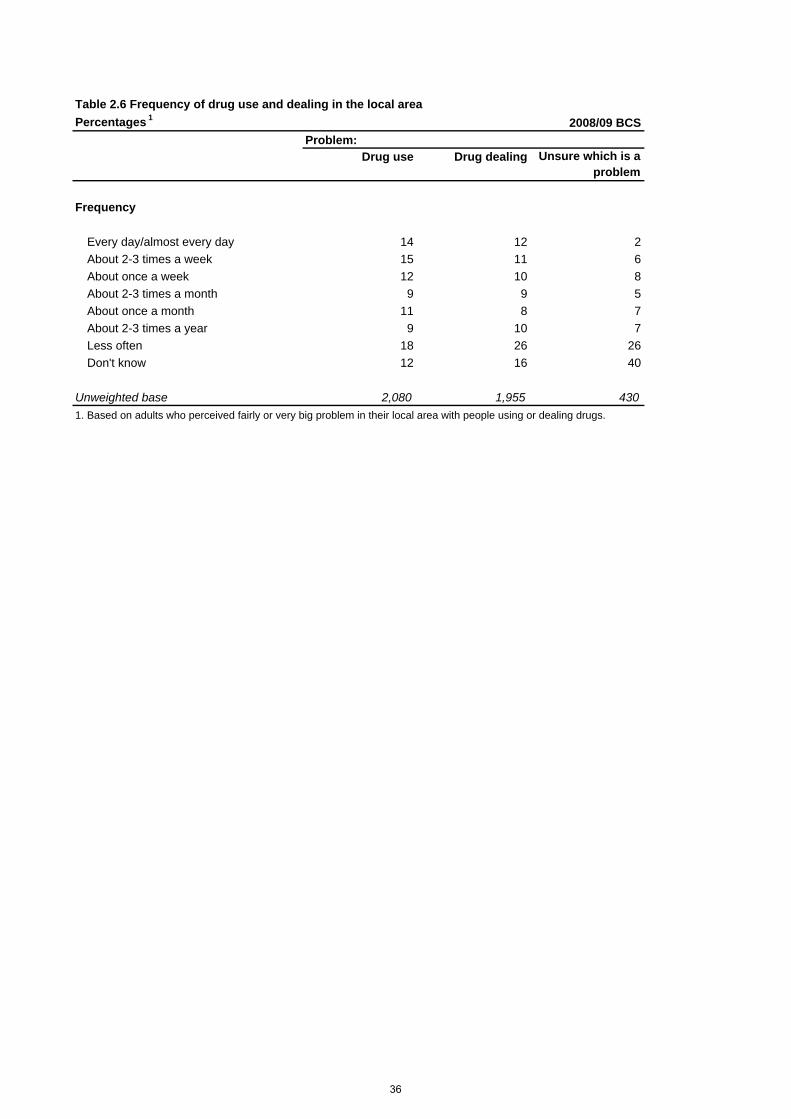
Percentages 1 2008/09 BCS
Drug use Drug dealing Unsure which is a problem
Frequency
Every day/almost every day 14 12 2About 2-3 times a week 15 11 6About once a week 12 10 8About 2-3 times a month 9 9 5About once a month 11 8 7About 2-3 times a year 9 10 7Less often 18 26 26Don't know 12 16 40
Unweighted base 2,080 1,955 4301. Based on adults who perceived fairly or very big problem in their local area with people using or dealing drugs.
Table 2.6 Frequency of drug use and dealing in the local area
Problem:
36
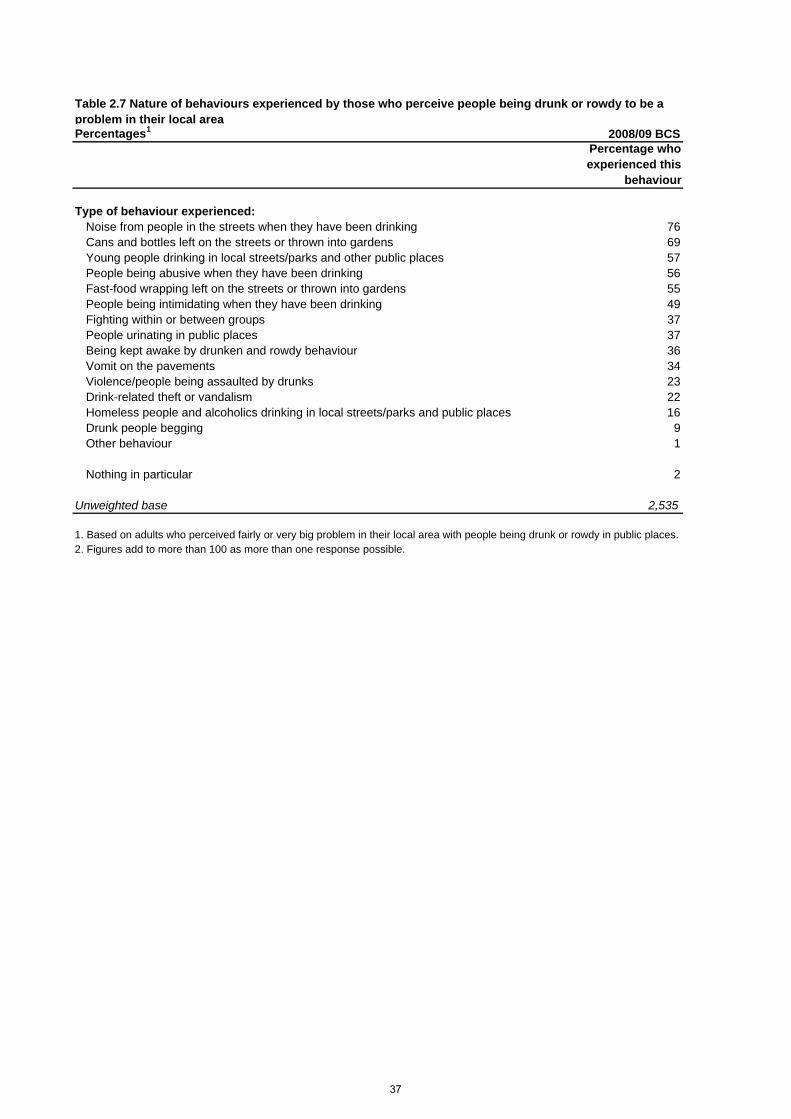
Percentages1 2008/09 BCSPercentage who experienced this
behaviour
Type of behaviour experienced:Noise from people in the streets when they have been drinking 76Cans and bottles left on the streets or thrown into gardens 69Young people drinking in local streets/parks and other public places 57People being abusive when they have been drinking 56Fast-food wrapping left on the streets or thrown into gardens 55People being intimidating when they have been drinking 49Fighting within or between groups 37People urinating in public places 37Being kept awake by drunken and rowdy behaviour 36Vomit on the pavements 34Violence/people being assaulted by drunks 23Drink-related theft or vandalism 22Homeless people and alcoholics drinking in local streets/parks and public places 16Drunk people begging 9Other behaviour 1
Nothing in particular 2
Unweighted base 2,535
Table 2.7 Nature of behaviours experienced by those who perceive people being drunk or rowdy to be a problem in their local area
1. Based on adults who perceived fairly or very big problem in their local area with people being drunk or rowdy in public places.2. Figures add to more than 100 as more than one response possible.
37
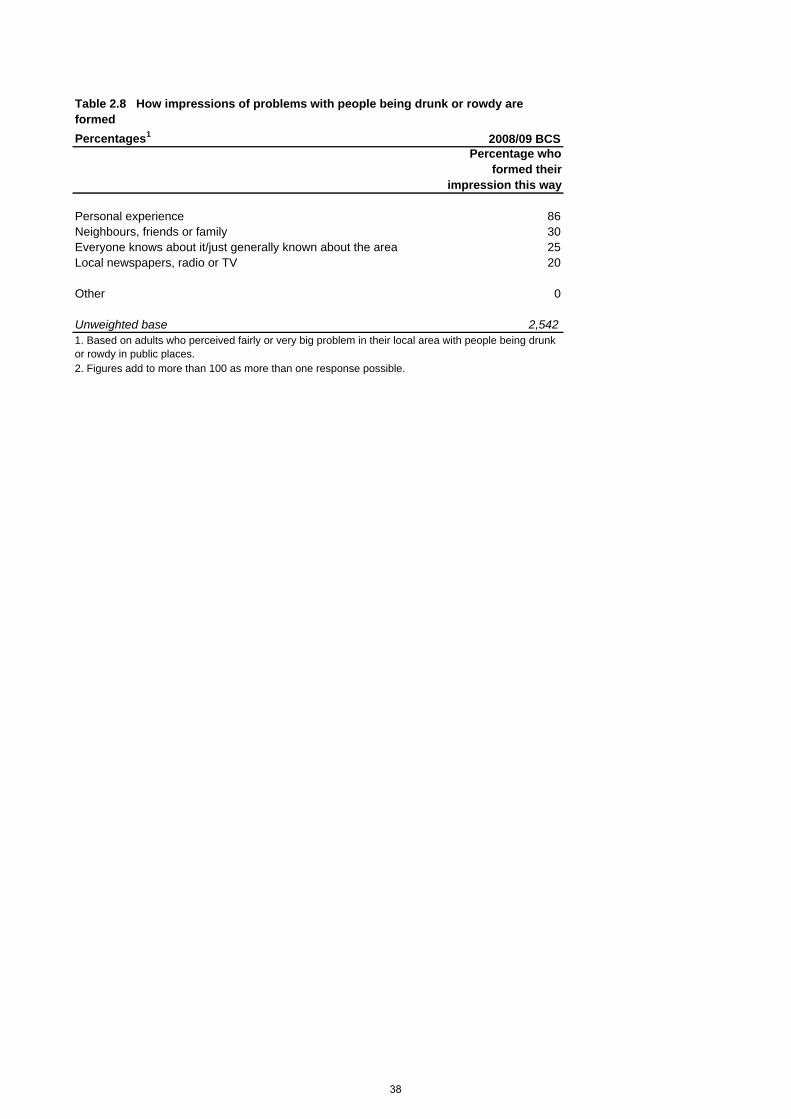
Percentages1 2008/09 BCSPercentage who
formed their impression this way
Personal experience 86Neighbours, friends or family 30Everyone knows about it/just generally known about the area 25Local newspapers, radio or TV 20
Other 0
Unweighted base 2,542
Table 2.8 How impressions of problems with people being drunk or rowdy are formed
1. Based on adults who perceived fairly or very big problem in their local area with people being drunk or rowdy in public places.2. Figures add to more than 100 as more than one response possible.
38
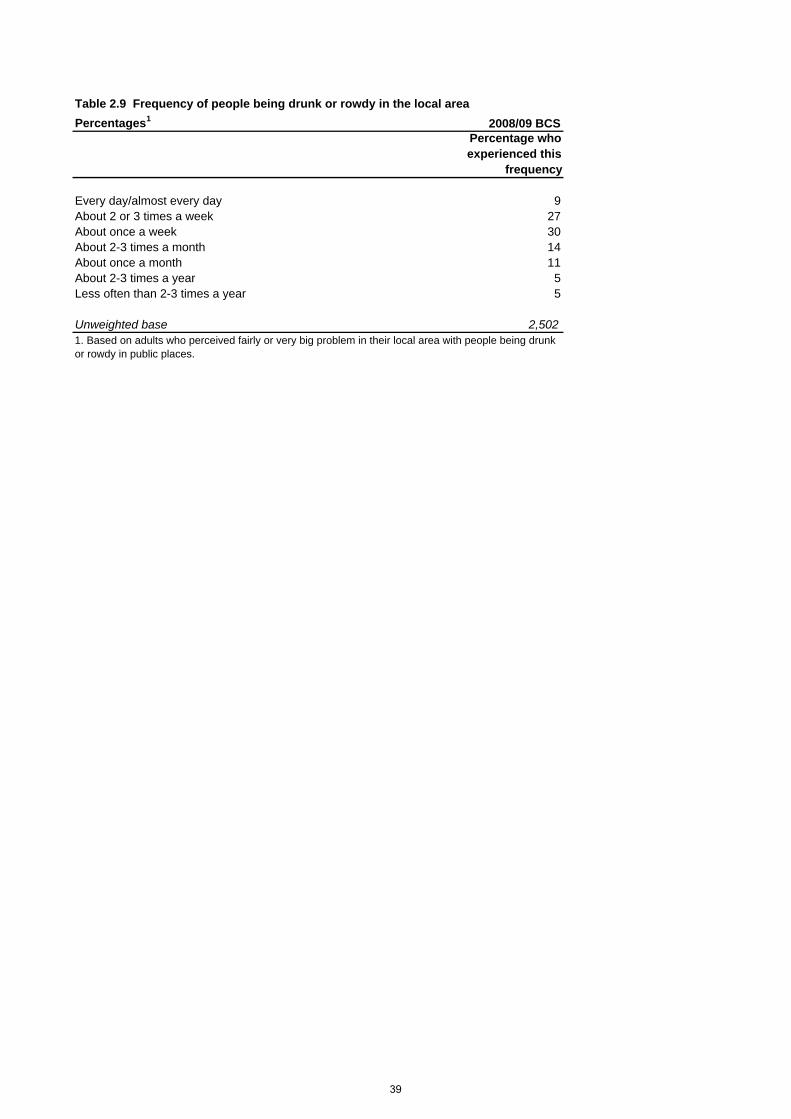
Percentages1 2008/09 BCSPercentage who experienced this
frequency
Every day/almost every day 9About 2 or 3 times a week 27About once a week 30About 2-3 times a month 14About once a month 11About 2-3 times a year 5Less often than 2-3 times a year 5
Unweighted base 2,502
Table 2.9 Frequency of people being drunk or rowdy in the local area
1. Based on adults who perceived fairly or very big problem in their local area with people being drunk or rowdy in public places.
39

40
Appendix 1 Bibliography
Duffy, B., Wake, R., Burrows, T. and Bremner P. (2008) Closing the Gaps: Crime and Public Perceptions. London:Ipsos Mori.
Flatley, J., Moley, S. and Hoare, J. (2008) Perceptions of anti-social behaviour: Findings from the 2007/08 British Crime Survey. Home Office Statistical Bulletin 15/08. London: Home Office. http://www.homeoffice.gov.uk/rds/pdfs08/hosb1508.pdf Kershaw, C., Nicholas, S. and Walker, A. (Eds.) (2008) Crime in England and Wales 2007/08. Home Office Statistical Bulletin 07/08. London: Home Office. http://www.homeoffice.gov.uk/rds/pdfs08/hosb0708.pdf
Laycock, S. (2005) Experience versus perceptions. Accounting for the NHS ‘perception gap’ and assessing its impact on voting in the 2005 British general election. London: University College.
Povey, D. (Ed.), Coleman, K., Kaiza, P. and Roe, S. (2009). Homicide, Firearm Offences and Intimate Violence 2007/08: Supplementary Volume 2 to Crime in England and Wales 2007/08. Home Office Statistical Bulletin 02/09. London: Home Office. http://www.homeoffice.gov.uk/rds/pdfs09/hosb0209.pdf Upson, A. (2006) Perceptions and experience of anti-social behaviour: Findings from the 2004/05 British Crime Survey. Home Office Online Report 21/06. London: Home Office. http://www.homeoffice.gov.uk/rds/pdfs06/rdsolr2106.pdf
Walker, A., Flatley, J., Kershaw, C. and Moon, D. (Eds.) (2009) Crime in England and Wales 2008/09. Home Office Statistical Bulletin 11/09 Volume 1. London: Home Office. http://www.homeoffice.gov.uk/rds/pdfs09/hosb1109vol1.pdf Wood, M. (2004) Perceptions and experience of anti-social behaviour: findings from the 2003/2004 British Crime Survey. Online Report 49/04. London: Home Office. http://www.homeoffice.gov.uk/rds/pdfs06/rdsolr2106.pdf
Copies of recent Home Office publications based on the British Crime Survey, including reports that report jointly on the BCS and police recorded crime, can be downloaded from:
http://www.homeoffice.gov.uk/rds/bcs1.html
ISBN: 978 1 84987 110 5
41