homestake mining company (hmc): work plan
TRANSCRIPT

WORK PLAN CHARACTERIZATION OF THE SAN ANDRES-GLORETA AQUIFER AT HOMESTAKE MINING COMPANY SUPERFUND SITE
Near Grants, New Mexico
November 11, 2020

Homestake Mining Company Superfund Site i November 2020 SAG Characterization Work Plan
WORK PLAN FOR THE
CHARACTERIZATION OF THE SAN ANDRES-GLORETA AQUIFER AT HOMESTAKE MINING COMPANY SUPERFUND SITE
MILAN, NEW MEXICO
NOVEMBER 2020
REVISION 1

Homestake Mining Company Superfund Site ii November 2020 SAG Characterization Work Plan
TABLE OF CONTENTS
SECTION 1 - INTRODUCTION .................................................................................................1
1.1 General Information ..........................................................................................................1
1.2 Purpose................................................................................................................................1
SECTION 2 - PROJECT MANAGEMENT APPROACH ........................................................2
2.1 Project Organization .........................................................................................................2
2.2 Key Personnel .....................................................................................................................2
2.3 Project Schedule .................................................................................................................2
SECTION 3 - SITE BACKGROUND INFORMATION ...........................................................3
3.1 Site Location and Ownership ............................................................................................3
3.2 Site Regulatory History .....................................................................................................3
3.3 Groundwater Remediation Program ...............................................................................3
SECTION 4 - SITE CHARACTERISTICS ................................................................................6
4.1 Geology................................................................................................................................6
4.1.1 Bedrock ........................................................................................................................6 4.1.2 Alluvium .......................................................................................................................6 4.1.3 Quaternary Volcanics ...................................................................................................7
4.2 Hydrogeology......................................................................................................................7
4.2.1 Alluvial Aquifer System ...............................................................................................7 4.2.2 Chinle Aquifer System .................................................................................................8 4.2.3 San Andres-Glorieta Regional Aquifer ......................................................................10 4.2.4 Summary ....................................................................................................................10
SECTION 5 - SCOPE OF WORK .............................................................................................12
5.1 Summary of Field Investigation .....................................................................................12
5.2 Mobilization and Demobilization ...................................................................................13
5.3 Surface Geophysical Evaluation .....................................................................................13
5.4 Exploratory Bedrock Drilling and Coring ....................................................................15
5.4.1 Bedrock Coring ..........................................................................................................15 5.4.2 FLUTe™ Hydraulic Profiling ....................................................................................16 5.4.3 Borehole Geophysics ..................................................................................................16 5.4.4 Multi-Port Well Installation .......................................................................................17
5.5 Alluvial Aquifer Borings .................................................................................................17
5.5.1 Alluvial Aquifer Drilling and Lithologic Sampling ...................................................17 5.5.2 Alluvial Aquifer Piezometer Installation ...................................................................18
5.6 Groundwater Sampling ...................................................................................................18
5.7 Water Level Measurements ............................................................................................18
5.8 Investigation Derived Waste Characterization and Disposal ......................................19
SECTION 6 - SAG CHARACTERIZATION REPORT .........................................................20

Homestake Mining Company Superfund Site iii November 2020 SAG Characterization Work Plan
Tables
5-1 Sampling and Analysis Summary for Aquifer Materials Characterization
Figures
2-1 Project Organizational Structure 2-2 SAG Investigation Project Schedule 3-1 Site Location Map 3-2 Alluvial Uranium Concentrations - 2019 4-1 3-Dimensional Hydrogeologic Model – Overview Map 4-2 Water Level Elevations for the Alluvial Aquifer – Fall 2019 4-3 Well Locations and Water Level Elevations for the San Andres-Glorieta Aquifer –
Fall 2019 4-4 Geologic Cross Section of the Study Area 5-1 ERT Array Locations – Overview Map

Homestake Mining Company Superfund Site iv November 2020 SAG Characterization Work Plan
ACRONYMS
ACM asbestos-containing materials CERCLA Comprehensive Environmental Response, Compensation, and Liability Act CFR Code of Federal Regulations COPC Chemical of Potential Concern EDP Electronic Data Processor EP Evaporation Pond EPA United States Environmental Protection Agency ER electrical resistivity ERT Electrical Resistivity Tomography gpd/ft gallons per day per foot gpm gallons per minute HASP Health and Safety Plan HDR HDR Engineering, Inc. HMC Homestake Mining Company of California IDW Investigation Derived Waste LTP Large Tailing Pile msl mean sea level NRC Nuclear Regulatory Commission pCi/g picocuries per gram QAPP Quality Assurance Project Plan RQD Rock Quality Designation RO reverse osmosis SAG San Andres-Glorieta STP Small Tailing Pile TI Technical Impracticability WME Worthington Miller Environmental, LLC

Homestake Mining Company Superfund Site 1 November 2020 SAG Characterization Work Plan
SECTION 1 - INTRODUCTION
1.1 General Information
This Work Plan for Characterization of the San Andres-Glorieta Aquifer at the Homestake Mining Company Superfund Site (Site), Near Milan, New Mexico was prepared for Homestake Mining Company of California (HMC) by HDR Engineering, Inc. (HDR).
Site is a former uranium mill located in the San Mateo Creek Basin in Cibola County, New Mexico. The mill operated from 1958 to 1990. Milling residue produced two on-Site tailing piles; the Small Tailing Pile (STP) and the Large Tailing Pile (LTP). Both tailing piles have influenced groundwater quality in the alluvial aquifer and shallow bedrock aquifer units immediately below and downgradient from the Site. The Site was placed on the United States Environmental Protection Agency’s (EPA’s) Superfund National Priorities List in September 1983 at the request of the State of New Mexico due to elevated selenium concentrations in the alluvial aquifer near the Site. HMC has been conducting active groundwater remediation at the Site since 1977.
Groundwater potentially impacted by milling operations at the Site has migrated to the west through the San Mateo alluvial aquifer. The San Mateo aquifer merges with the Rio San Jose alluvial aquifer which flows south. Regional geologic mapping shows the San Andres-Glorieta (SAG) aquifer directly underlies the Rio San Jose alluvial aquifer roughly 3 miles west of the Site. The area where the SAG is in direct contact with the alluvial aquifer (i.e. subcrop) is hydraulically downgradient of areas currently impacted by the Site. Therefore, the potential exists for groundwater potentially impacted by milling operations at the Site to migrate to the SAG aquifer. The goal of this field investigation is to characterize the physical and geochemical properties of the SAG aquifer near the subcrop and to further evaluate the hydraulic connection with the alluvial aquifer.
1.2 Purpose
The purpose of this work is to characterize the physical and geochemical properties of the SAG aquifer and to further evaluate the hydraulic connection with the alluvial aquifer. This information will be used to evaluate the fate and transport of groundwater that may potentially be impacted by milling operations at the Site in the future.

Homestake Mining Company Superfund Site 2 November 2020 SAG Characterization Work Plan
SECTION 2 - PROJECT MANAGEMENT APPROACH
2.1 Project Organization
The project organizational structure is provided in Figure 2-1.
2.2 Key Personnel
The HMC Project Manager is Adam Arguello Mr., Arguello has overall responsibility for day-to-day operations at the Homestake Mining Facility. Dan St. Germain is the HDR Project Manager responsible for the characterization investigation of the SAG aquifer. As HDR Project Manager, Mr. St. Germain is responsible for the development of the Work Plan; acquisition of scientific, engineering, or additional specialized technical support; and other aspects of the day-to-day activities associated with the project. The Project Manager identifies staff requirements, directs and monitors progress, ensures implementation of quality procedures and adherence to applicable codes and regulations, and is responsible for performance within the established budget and schedule.
Project team members include project task leads and key technical support personnel including:
• Joe Cattafe - Senior Hydrogeologist and Task Leader
• Mathew Keaveney - Field Team Leader for Drilling and Well Installation
• Glen Adams – Lead Geophysicist
• Dave Levy (Worthington Miller, LLC) – Lead Geochemist.
Additional support in the area of geology and hydrogeology will be provided by Morgan Violette and John Ifkovits. The project health and safety officer will be John Guzewich and the project Quality Control/Quality assurance officer will be Melissa LaMacchia.
2.3 Project Schedule
Figure 2-2 is the project schedule.

Homestake Mining Company Superfund Site 3 November 2020 SAG Characterization Work Plan
SECTION 3 - SITE BACKGROUND INFORMATION
3.1 Site Location and Ownership
The Site is located approximately 5.5 miles north of Milan, in Cibola County, New Mexico (Figure 3-1). HMC opened and began operating the mill facility in 1958 under two partnerships. Beginning in 1981, HMC became the sole owner and operator. In 2001, HMC merged with Barrick Gold Corporation. Currently, HMC is a wholly owned, indirect subsidiary of Barrick Gold Corporation and owns the Homestake Facility. The proposed characterization work will be performed on property owned by HMC, the Atlantic Richfield Company and the City of Milan.
3.2 Site Regulatory History
The Homestake Facility is regulated by the NRC under license SUA-1471. The Site was added to EPA’s Superfund National Priorities List in 1983, and as a result, cleanup activities are also subject to regulation under EPA’s Superfund Program, in accordance with the CERCLA. Pursuant to a 1993 memorandum of understanding between EPA and NRC, NRC is designated as the lead regulatory agency for reclamation and closure activities, while EPA has responsibility to monitor reclamation activities to assure attainment of Applicable or Relevant and Appropriate Requirement under CERCLA.
3.3 Groundwater Remediation Program
Groundwater remedial activities have been performed since 1977 and have been successful in reducing the plume footprint and range of concentrations. The most recent data for the most extensive constituent, uranium in the alluvial aquifer, is shown on Figure 3-2. Groundwater remediation is ongoing, and the current system includes multiple components that are frequently adjusted based on evaluation of monitoring data. The following provides a brief description of the components:
• Source Control: Water is pumped from the alluvium, Upper Chinle, and Middle Chinle beneath and down-gradient of the LTP/STP and conveyed to the RO or zeolite plants depending on whether the groundwater contains selenium and/or molybdenum above the groundwater standards. Groundwater that contains just uranium is conveyed to the zeolite plant and groundwater with uranium and selenium and/or molybdenum is conveyed to the RO plant for treatment. In 2018, 279 gallons per minute (gpm) from the Alluvium, 130 gpm from the Upper Chinle, and 34 gpm from the Middle Chinle was conveyed to the RO plant. The Zeolite plant received 240 gpm from the alluvium and 56 gpm from the Middle Chinle in 2018.
• Plume Control: Water is injected into the alluvial, Upper Chinle, and Middle Chinle aquifers to create a hydraulic barrier to limit the movement of contaminated groundwater. The hydraulic barrier in the alluvial aquifer is created and maintained downgradient of

Homestake Mining Company Superfund Site 4 November 2020 SAG Characterization Work Plan
the LTP with dozens of wells used to introduce the water into the alluvium and more than 6,000 linear feet of infiltration lines. Water added to the alluvial aquifer to create a hydraulic gradient is derived from several sources, including the RO plant product water, less contaminated areas of the alluvial aquifer, the Middle Chinle aquifer, and the SAG aquifer. In 2018, an average of 678 gpm was introduced into the alluvial aquifer to maintain the hydraulic barriers. In addition, an average of 21 gpm and 46 gpm was introduced into the Upper Chinle and Middle Chinle aquifers, respectively.
• RO Treatment: The RO treatment has been used since 1999 to remove contaminant mass from on-Site groundwater extracted upgradient of the hydraulic barrier. Plant influent is composed of groundwater from the alluvial aquifer, the Upper and Middle Chinle aquifers, and the collection ponds, which receives water from the RO plant. The RO plant treatment process includes a lime/caustic pre-treatment and clarification unit and microfiltration as pre-treatment to the three RO treatment units. Accounting for scheduled and unscheduled maintenance, the functional capacity of RO treatment based on the last four years of operations is about 500 gallons per minute (gpm).
• Zeolite Treatment: Zeolite beds have been used since 2016 to remove the uranium from off-Site collection water because uranium is the only Site constituent that exceeds the Site standards in this collected water. There are two zeolite treatment plants that have a combined functional capacity of approximately 250 gpm based on the last four years of operation.
• Evaporation: There are three lined evaporation ponds (EP-1, EP-2, and EP-3) in use at the Homestake Facility to concentrate uranium and other contaminants. The evaporation system receives water from the extraction wells in the alluvial and Upper Chinle aquifers and brine from the RO plant. Prior to the construction of the evaporation ponds, two small lined collection ponds constructed west of the STP in 1986 were used to store and evaporate collected groundwater. In 2019, average evaporation from the ponds was approximately 174 gpm, while receiving an average of 27 gpm from the collection ponds, 57 gpm of brine from the RO plant, 31 gpm from the zeolite treatment plant, and 38 gpm from precipitation.
• Land Treatment: Irrigation and land treatment ended in 2012.
Pursuant to the 1983 Agreement between HMC and the EPA, HMC financed the extension of the Village of Milan’s municipal water supply to the residences of the subdivisions and made payments to the Village of Milan for the residents’ water usage over a period of ten years. The extension of the water supply was completed in 1985. The New Mexico Environment Department and HMC entered into a Memorandum of Agreement pursuant to which HMC voluntarily agreed to connect residents within a designated area near the Site to the Village of Milan’s water system on January 21, 2009. This work has been completed. In late 2018, HMC restarted the water

Homestake Mining Company Superfund Site 5 November 2020 SAG Characterization Work Plan
supply payment program for the subdivisions downgradient of the Site.

Homestake Mining Company Superfund Site 6 November 2020 SAG Characterization Work Plan
SECTION 4 - SITE CHARACTERISTICS
This section describes the geology and hydrogeology of the area.
4.1 Geology
The Site is located in the southeastern portion of the Colorado Plateau physiographic province, on the south flank of the San Juan Basin. The region experienced structural deformation (regional folding and block uplift) associated with formation of the Zuni Uplift from the Late Cretaceous through the Eocene during the Laramide Orogeny. This uplift formed the Zuni Mountains, which consist of a northwest-trending monoclinal fold approximately 75 miles long and 30 miles wide to the southwest of Grants composed of Precambrian crystalline basement rocks overlain by Permian to Jurassic sedimentary rocks. The Site geology is illustrated in a three-dimensional hydrogeologic model on Figure 4-1.
4.1.1 Bedrock
Bedrock units at the Site consist of the Glorieta Sandstone (Early Permian), San Andres Limestone (Early Permian), and the Chinle Formation (Late Triassic). The Chinle Formation is composed of laterally continuous sandstone units separated by thick sections of low permeability shale. The Site is located on the eastern flank of a fold, where bedrock dips approximately 3 to 10 degrees to the north-northeast into the San Juan Basin.
More recent faulting associated with the Rio Grande Rift resulted in the large northeast-striking San Mateo normal fault located northeast of the Site and two small-scale normal faults near the Site referred to as the West Fault and the East Fault. The dip of these two faults is nearly vertical and offset in the Chinle Formation results in the juxtaposition of permeable sandstones with impermeable mudstones and siltstones across the two faults near the Site. Displacement along the East Fault is minimal immediately south of the Felice Acres subdivision and sandstone units are not vertically offset. The magnitude of structural offset of the underlying SAG regional aquifer is much lower than the vertical thickness of the unit and does not appear to significantly affect groundwater flow.
During the Tertiary (Neogene) volcanic activity associated with the Mount Taylor volcanic field resulted in widely scattered andesite and basalt flows. An erosional period followed the volcanism and created the valley forms observed in the SMC Basin, eroding the surface up to 150 to 200 feet below the current land surface. This erosional period exposed Cretaceous and Permian bedrock formations, which outcrop in progressively older (northeast to southwest) trending bands to the west of the Site. Erosion of the dipping formations produced a pronounced angular unconformity between bedrock strata and Quaternary valley fill, resulting in sandstone units within the underlying Chinle Formation abruptly truncating at the base of the alluvium.
4.1.2 Alluvium
Quaternary deposits consist of localized andesite and basalt flows and widespread alluvium composed of locally eroded bedrock materials; some of which were ore-bearing rock. As a result, the alluvium contains significant concentrations of naturally occurring uranium, as well as
Homestake Mining Company Superfund Site 7 November 2020 SAG Characterization Work Plan
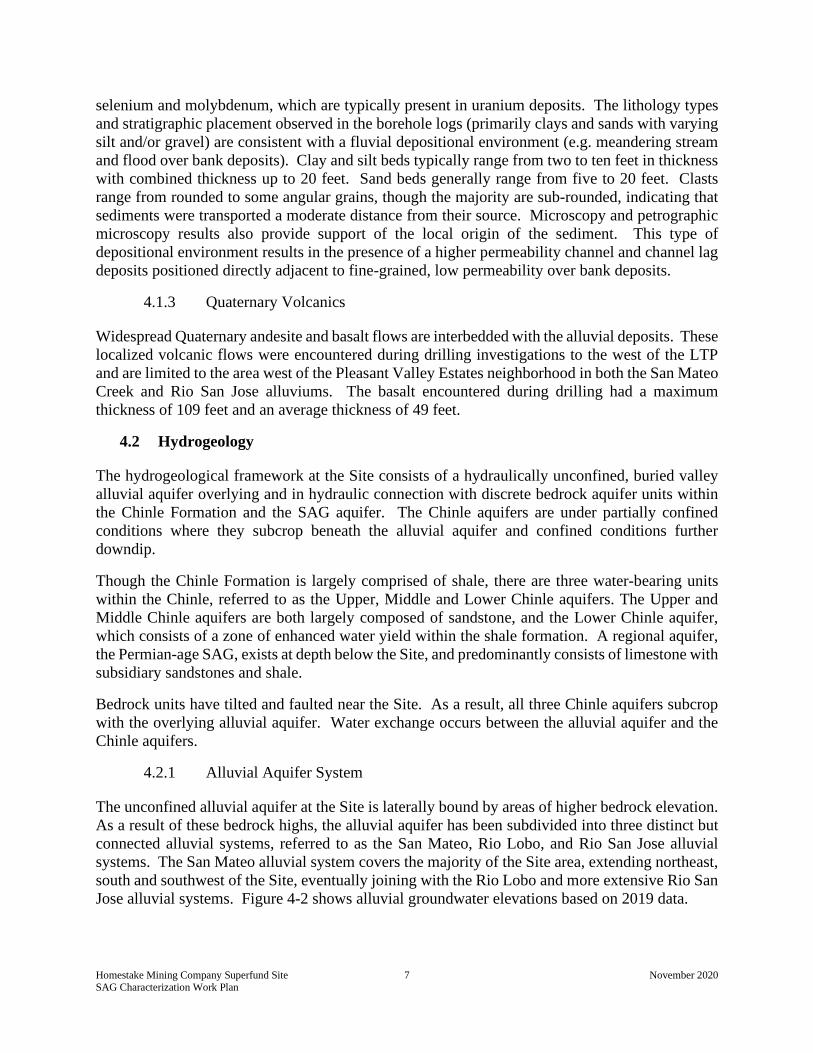
selenium and molybdenum, which are typically present in uranium deposits. The lithology types and stratigraphic placement observed in the borehole logs (primarily clays and sands with varying silt and/or gravel) are consistent with a fluvial depositional environment (e.g. meandering stream and flood over bank deposits). Clay and silt beds typically range from two to ten feet in thickness with combined thickness up to 20 feet. Sand beds generally range from five to 20 feet. Clasts range from rounded to some angular grains, though the majority are sub-rounded, indicating that sediments were transported a moderate distance from their source. Microscopy and petrographic microscopy results also provide support of the local origin of the sediment. This type of depositional environment results in the presence of a higher permeability channel and channel lag deposits positioned directly adjacent to fine-grained, low permeability over bank deposits.
4.1.3 Quaternary Volcanics
Widespread Quaternary andesite and basalt flows are interbedded with the alluvial deposits. These localized volcanic flows were encountered during drilling investigations to the west of the LTP and are limited to the area west of the Pleasant Valley Estates neighborhood in both the San Mateo Creek and Rio San Jose alluviums. The basalt encountered during drilling had a maximum thickness of 109 feet and an average thickness of 49 feet.
4.2 Hydrogeology
The hydrogeological framework at the Site consists of a hydraulically unconfined, buried valley alluvial aquifer overlying and in hydraulic connection with discrete bedrock aquifer units within the Chinle Formation and the SAG aquifer. The Chinle aquifers are under partially confined conditions where they subcrop beneath the alluvial aquifer and confined conditions further downdip.
Though the Chinle Formation is largely comprised of shale, there are three water-bearing units within the Chinle, referred to as the Upper, Middle and Lower Chinle aquifers. The Upper and Middle Chinle aquifers are both largely composed of sandstone, and the Lower Chinle aquifer, which consists of a zone of enhanced water yield within the shale formation. A regional aquifer, the Permian-age SAG, exists at depth below the Site, and predominantly consists of limestone with subsidiary sandstones and shale.
Bedrock units have tilted and faulted near the Site. As a result, all three Chinle aquifers subcrop with the overlying alluvial aquifer. Water exchange occurs between the alluvial aquifer and the Chinle aquifers.
4.2.1 Alluvial Aquifer System
The unconfined alluvial aquifer at the Site is laterally bound by areas of higher bedrock elevation. As a result of these bedrock highs, the alluvial aquifer has been subdivided into three distinct but connected alluvial systems, referred to as the San Mateo, Rio Lobo, and Rio San Jose alluvial systems. The San Mateo alluvial system covers the majority of the Site area, extending northeast, south and southwest of the Site, eventually joining with the Rio Lobo and more extensive Rio San Jose alluvial systems. Figure 4-2 shows alluvial groundwater elevations based on 2019 data.

Homestake Mining Company Superfund Site 8 November 2020 SAG Characterization Work Plan
San Mateo Aquifer
The San Mateo alluvial aquifer occurs as a north-south trending buried valley aquifer extending through the Site. Groundwater flow in the San Mateo alluvial aquifer is generally north to the south, upgradient of the LTP, and to the southwest in the area of the LTP. An artificial hydraulic barrier that is part of the current remediation system creates a zone on the southern and western sides of the LTP area where the natural gradient is artificially interrupted by a combination of collection and injection operations.
The San Mateo alluvial aquifer generally behaves as an unconfined aquifer with specific yields ranging from 0.038 to 0.28. A specific yield of 0.1 is assumed to best represent the alluvial aquifer at the Site. Hydraulic conductivity values are relatively high, ranging from approximately 10 to more than 200 ft/day. The water table ranges between from 40 to 60 feet below the ground surface, with elevations ranging from 6,428 to 6,550 feet above mean sea level (msl) during the fall 2019 monitoring event.
Rio Lobo Aquifer
The Rio Lobo aquifer is typically a sandy material with minor clay and silt layers of limited continuity. Based on a 1995 investigation, it was determined that saturated portions of the Rio Lobo aquifer were likely confined to narrow sections where the alluvium was deposited within incised channels, or that a subcrop of pervious bedrock drained the alluvial aquifer upgradient of the confluence with the San Mateo system. Water quality differences between well ND and borehole BK3 and other background wells indicated that the confluence of the Lobo Creek and San Mateo Creek alluvial systems may be in the vicinity of well ND.
Rio San Jose Aquifer
Rio San Jose aquifer is generally composed of sand and gravel with a wide range of transmissivity. Groundwater in the Rio San Jose system flows southeast from the Bluewater site and merges with San Mateo Creek alluvial system. The combined flow continues southeast toward Milan.
4.2.2 Chinle Aquifer System
The Chinle aquifer system is made up of three hydraulically conductive zones within the Chinle Formation, referred to as the Upper, Middle and Lower aquifers. The aquifers subcrop beneath the alluvial aquifer providing hydraulic connection between the units.
Upper Chinle Aquifer
The Upper Chinle aquifer is a northeast-dipping, confined aquifer composed of a laterally continuous sandstone unit. Structural elevation contours of the top of the Upper Chinle aquifer indicate minor variations in the steepness of the northeasterly dip, particularly in the area immediately south of the LTP. The aquifer unit is hydraulically bounded from other Chinle Formation aquifer units by competent overlying and underlying shale that has been structurally offset by the West and East Faults at the Site. The average thickness of the sandstone is approximately 35 feet.
Homestake Mining Company Superfund Site 9 November 2020 SAG Characterization Work Plan
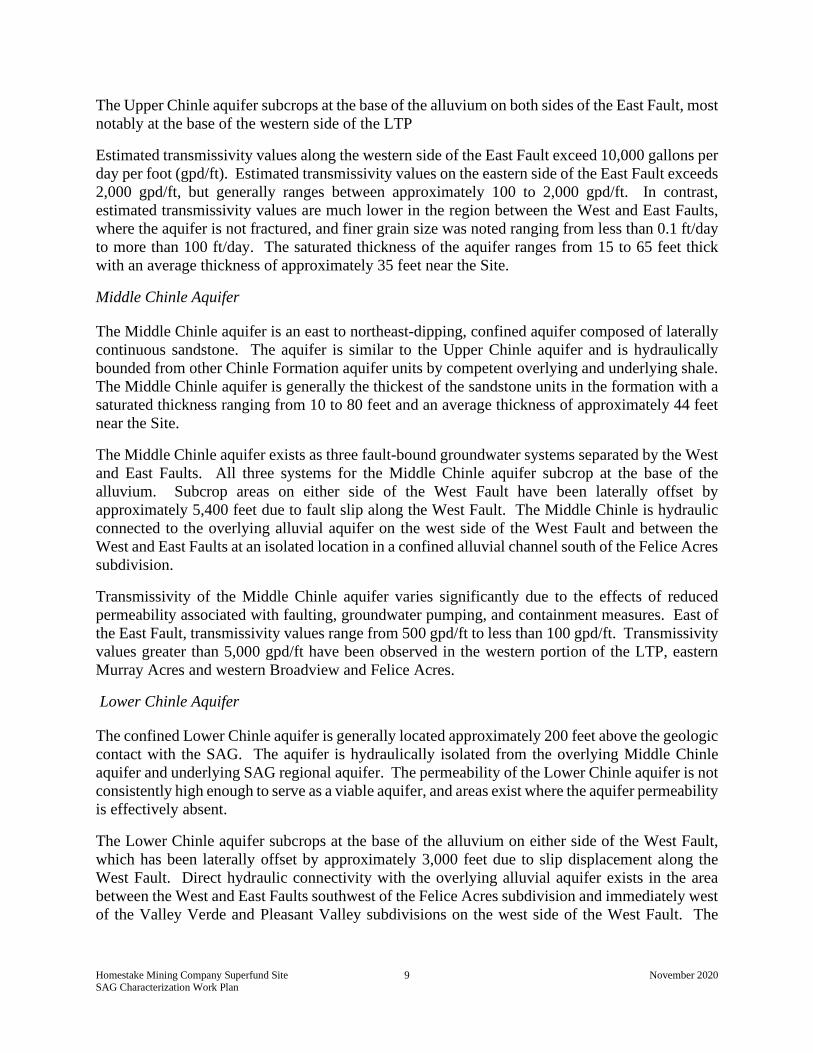
The Upper Chinle aquifer subcrops at the base of the alluvium on both sides of the East Fault, most notably at the base of the western side of the LTP
Estimated transmissivity values along the western side of the East Fault exceed 10,000 gallons per day per foot (gpd/ft). Estimated transmissivity values on the eastern side of the East Fault exceeds 2,000 gpd/ft, but generally ranges between approximately 100 to 2,000 gpd/ft. In contrast, estimated transmissivity values are much lower in the region between the West and East Faults, where the aquifer is not fractured, and finer grain size was noted ranging from less than 0.1 ft/day to more than 100 ft/day. The saturated thickness of the aquifer ranges from 15 to 65 feet thick with an average thickness of approximately 35 feet near the Site.
Middle Chinle Aquifer
The Middle Chinle aquifer is an east to northeast-dipping, confined aquifer composed of laterally continuous sandstone. The aquifer is similar to the Upper Chinle aquifer and is hydraulically bounded from other Chinle Formation aquifer units by competent overlying and underlying shale. The Middle Chinle aquifer is generally the thickest of the sandstone units in the formation with a saturated thickness ranging from 10 to 80 feet and an average thickness of approximately 44 feet near the Site.
The Middle Chinle aquifer exists as three fault-bound groundwater systems separated by the West and East Faults. All three systems for the Middle Chinle aquifer subcrop at the base of the alluvium. Subcrop areas on either side of the West Fault have been laterally offset by approximately 5,400 feet due to fault slip along the West Fault. The Middle Chinle is hydraulic connected to the overlying alluvial aquifer on the west side of the West Fault and between the West and East Faults at an isolated location in a confined alluvial channel south of the Felice Acres subdivision.
Transmissivity of the Middle Chinle aquifer varies significantly due to the effects of reduced permeability associated with faulting, groundwater pumping, and containment measures. East of the East Fault, transmissivity values range from 500 gpd/ft to less than 100 gpd/ft. Transmissivity values greater than 5,000 gpd/ft have been observed in the western portion of the LTP, eastern Murray Acres and western Broadview and Felice Acres.
Lower Chinle Aquifer
The confined Lower Chinle aquifer is generally located approximately 200 feet above the geologic contact with the SAG. The aquifer is hydraulically isolated from the overlying Middle Chinle aquifer and underlying SAG regional aquifer. The permeability of the Lower Chinle aquifer is not consistently high enough to serve as a viable aquifer, and areas exist where the aquifer permeability is effectively absent.
The Lower Chinle aquifer subcrops at the base of the alluvium on either side of the West Fault, which has been laterally offset by approximately 3,000 feet due to slip displacement along the West Fault. Direct hydraulic connectivity with the overlying alluvial aquifer exists in the area between the West and East Faults southwest of the Felice Acres subdivision and immediately west of the Valley Verde and Pleasant Valley subdivisions on the west side of the West Fault. The

Homestake Mining Company Superfund Site 10 November 2020 SAG Characterization Work Plan
Lower Chinle aquifer is presumed to be laterally continuous immediately south of the terminus of the East Fault, where the aquifer functions as a single hydrologic unit.
The hydraulic properties of the Lower Chinle aquifer are highly variable and largely depend on secondary permeability within the shale. The ability of the Lower Chinle aquifer to produce water is much lower and less consistent than overlying Chinle sandstone aquifers. Hydraulic conductivity ranges from 0.1 to more than 50 ft/day. Estimated transmissivity values for the aquifer are generally higher than 100 gpd/ft (750 ft2/day) near subcrop locations. However, selected areas near subcrop locations exceed 1,000 gpd/ft (7,500 ft2/day
4.2.3 San Andres-Glorieta Regional Aquifer
The SAG aquifer is a regional aquifer in the Site area, consisting of the San Andres Limestone and Glorieta Sandstone with a total thickness that exceeds 200 feet. Similar to the Chinle Formation aquifers, the regional aquifer is mildly folded and dips to the east and northeast as a result of regional tectonic deformation. A plan view map of the Site showing well locations, measured ground water elevations and inferred contours from 2019 measurements is provided as Figure 4-3. A geologic cross section is shown on Figure 4-4 .
Solution channels, cavernous zones and fractures have been reported in San Andres Limestone in the Grants-Bluewater area near the Zuni uplift, which explain the high transmissivity values reported in the literature. United States Geological Survey documents have reported average transmissivities on the order of 374,000 gpd/ft. An average groundwater velocity of 4 ft/day estimated based on a hydraulic conductivity of 615 ft/day, a hydraulic gradient of 0.00086 foot per foot (ft/ft), and an effective porosity of 0.1 (dimensionless). The groundwater velocity is likely to vary greatly in this type of aquifer due to a very wide variation of hydraulic conductivity and effective porosity
The SAG aquifer is reported to be in hydraulic connection with the alluvial aquifer through its subcrop area (refer to Figure 4-3). Groundwater elevations near the Site ranged from 6,417 to 6,420 feet above msl during 2019. Flow direction is to the east-southeast.
4.2.4 Summary
Groundwater flows in three distinct hydrogeologic units; alluvium, Chinle (including the Upper, Middle, and Lower subunits), and the SAG. The unconfined alluvial aquifer is composed of 50 to 100-foot thick heterogeneous mixture of layers of gravel, sand and gravel, fine to coarse sand, and silt and clay. The water table ranges between 40 and 60 feet below the ground surface. Groundwater flow in the alluvial aquifer primarily occurs through the high hydraulic conductivity sand and gravel lenses (mobile aquifer fractions). The hydraulic conductivity of the sand and gravel ranges from 10 to more than 200 ft/day. Water levels collected as part of the active groundwater remediation show groundwater flows from the Site to the west in the San Mateo portion of the alluvial aquifer where it combined with the San Jose portion of the alluvial aquifer. Silt and clay lenses in the alluvium create an anisotropy that restricts vertical groundwater movement (immobile aquifer fractions).
Similarly, the solute transport of groundwater potentially impacted by milling operations at the Site in this anisotropic aquifer mainly occurs in the high hydraulic conductivity coarse grained

Homestake Mining Company Superfund Site 11 November 2020 SAG Characterization Work Plan
sand and gravel (mobile aquifer fraction). As the groundwater potentially impacted by milling operations migrate in the sand and gravel portions of the alluvial aquifer, the contaminants diffuse into the silt and clay lenses. Diffusion is a concentration gradient driven process where high concentrations of contaminants in groundwater migrating through the sand and gravel will diffuse into the porewater in the silt and clay that contains less contaminants. These silt and clay lenses can store significant amounts of contaminants especially beneath the LTP/STP allowing it to act as a temporary storage zone or a secondary contaminant source within the aquifer. Once the contaminants have diffused into the silt and clay, they are left nearly immobile because of the low hydraulic conductivity of the silt and clay. The contaminants in the silt and clay lenses will eventually diffuse out of the silt and clay back into the sand and gravel when the concentration of contaminants in the sand and gravel becomes lower than the concentration in the silt and clay typically after the implementation of a source remedy like the HMC groundwater remediation system. In this case, the slits and clay lenses can be a long-term low concentration source of contaminants to the sand and gravel often lasting for decades to centuries.
Contaminants have also migrated from the alluvial aquifer into the Upper and Middle Chinle bedrock aquifer. Groundwater flow direction in the Upper Chinle aquifer is greatly influenced by injection of fresh-water and collection of groundwater. To date, data indicate that contaminants have not migrated into the SAG aquifer.

Homestake Mining Company Superfund Site 12 November 2020 SAG Characterization Work Plan
SECTION 5 - SCOPE OF WORK
5.1 Summary of Field Investigation
The goal of this field investigation is to characterize the physical and geochemical properties of the SAG aquifer. This information is needed to more fully characterize the fate and transport of contaminants down-gradient of HMC, identify potential human health receptors, and establish a TI zone. The scope of work will include:
• Mobilization/Demobilization; • Surface Geophysical Survey (confirm the alluvial aquifer is in direct contact with the
SAG aquifer); • Geologic Investigation;
o Drill two borings to the bottom of the SAG; • Drill and install surface casing 10-feet into the top of bedrock
using rotary drilling techniques; • Drill and collect bedrock cores from the top of bedrock to the
bottom of the SAG; o Collect and analyze bedrock core samples to characterize
the matrix porosity, organic carbon, wet and dry bulk density, specific gravity, and percent moisture of the SAG aquifer;
o Collect and analyze bedrock core samples to characterize the geochemical characteristics of the SAG;
Conduct borehole geophysics (including Fluid Temperature, Fluid Resistivity, Caliper, Heat Pulse Flow Meter, under ambient and pumping conditions, and Acoustic Televiewer) in each borehole;
Complete FLUTe™ hydraulic conductivity profiling to characterize the secondary porosity (including the location, frequency, and transmissivity) of the bedrock fractures of the SAG aquifer in each borehole; and
Install a FLUTe™ Multi-Port Well in each borehole. o Drill one boring to the bottom of the alluvial aquifer (confirm the SAG directly
underlies the alluvial aquifer); drill two additional borings to the bottom of the alluvial aquifer, at locations agreed upon by the EPA, if an access agreement can be completed with the property owner within one mobilization to complete the SAG investigation.
Collect continuous sonic core samples from the ground surface to the bottom of the alluvial aquifer;
collect five feet of sonic or wireline core of the bedrock at the base of the alluvial aquifer;
install piezometers in the primary boring and the two additional locations if the alluvium is saturated, to evaluate the horizontal and vertical direction of groundwater movement in the area of the SAG subcrop.
• Measure water levels in the overburden and multi-port wells to characterize the vertical heads between the alluvial and SAG aquifers;

Homestake Mining Company Superfund Site 13 November 2020 SAG Characterization Work Plan
• Collect groundwater samples to characterize the groundwater chemistry of the SAG aquifer; and
• Characterize and Dispose of Investigation Derived Waste. HDR will complete the following field activities in accordance with the Quality Assurance Project Plan (QAPP).
5.2 Mobilization and Demobilization
HDR will provide the necessary personnel, equipment, and materials for mobilization and demobilization to and from the Site. One mobilization and one demobilization are anticipated. During mobilization, the equipment and materials necessary for the field program will be procured and transferred to the Site. Details of the work area, including health and safety zones and investigation derived waste (IDW) staging areas will be presented in the Site-specific QAPP and Health and Safety Plan (HASP). Mobilization will include the following activities:
• Prepare a list of required field equipment; • Identify staging area for contractor equipment; • Prepare requisitions to purchase expendable field supplies, as necessary; • Set-up of health and safety field files; • Arrange delivery, storage and setup of all equipment, as necessary; • Receive field activity and health and safety equipment; • Perform general Site preparation/organization; and • Conduct initial health and safety briefing for Site personnel.
Demobilization will occur upon completion of the field activities. The following activities will be performed:
• Complete Site restoration activities and cleanup; • Arrange for the transportation and disposal of wastes, including IDW, from the Site; • Return rental equipment; • Demobilize field equipment.
5.3 Surface Geophysical Evaluation
A Surface Geophysical Evaluation will be completed to evaluate lithology in the alluvium and underlying bedrock, determine the depth and slope of the bedrock surface and assess whether the SAG directly underlies the alluvial aquifer near the location of the exploratory borings. The geophysical method selected for the evaluation is Electrical Resistivity Tomography (ERT). ERT is a method that uses an induced current generated by one or more electrodes that in combination with a series of receiving or recording electrodes. Variations in the electric resistivity between the electrodes corresponds to variations in lithology, fracture zones, level of saturation and water quality. ERT is a particularly good option for identifying solution features in Karst formations, such as portions of the San Andres Limestone. The ERT survey will produce cross-section profiles of resistivity values that can be correlated to borings located along or near the lines. Additionally,

Homestake Mining Company Superfund Site 14 November 2020 SAG Characterization Work Plan
the geophysical borehole logging results will help further guide the interpretation and correlation of the resistivity values to Site geology.
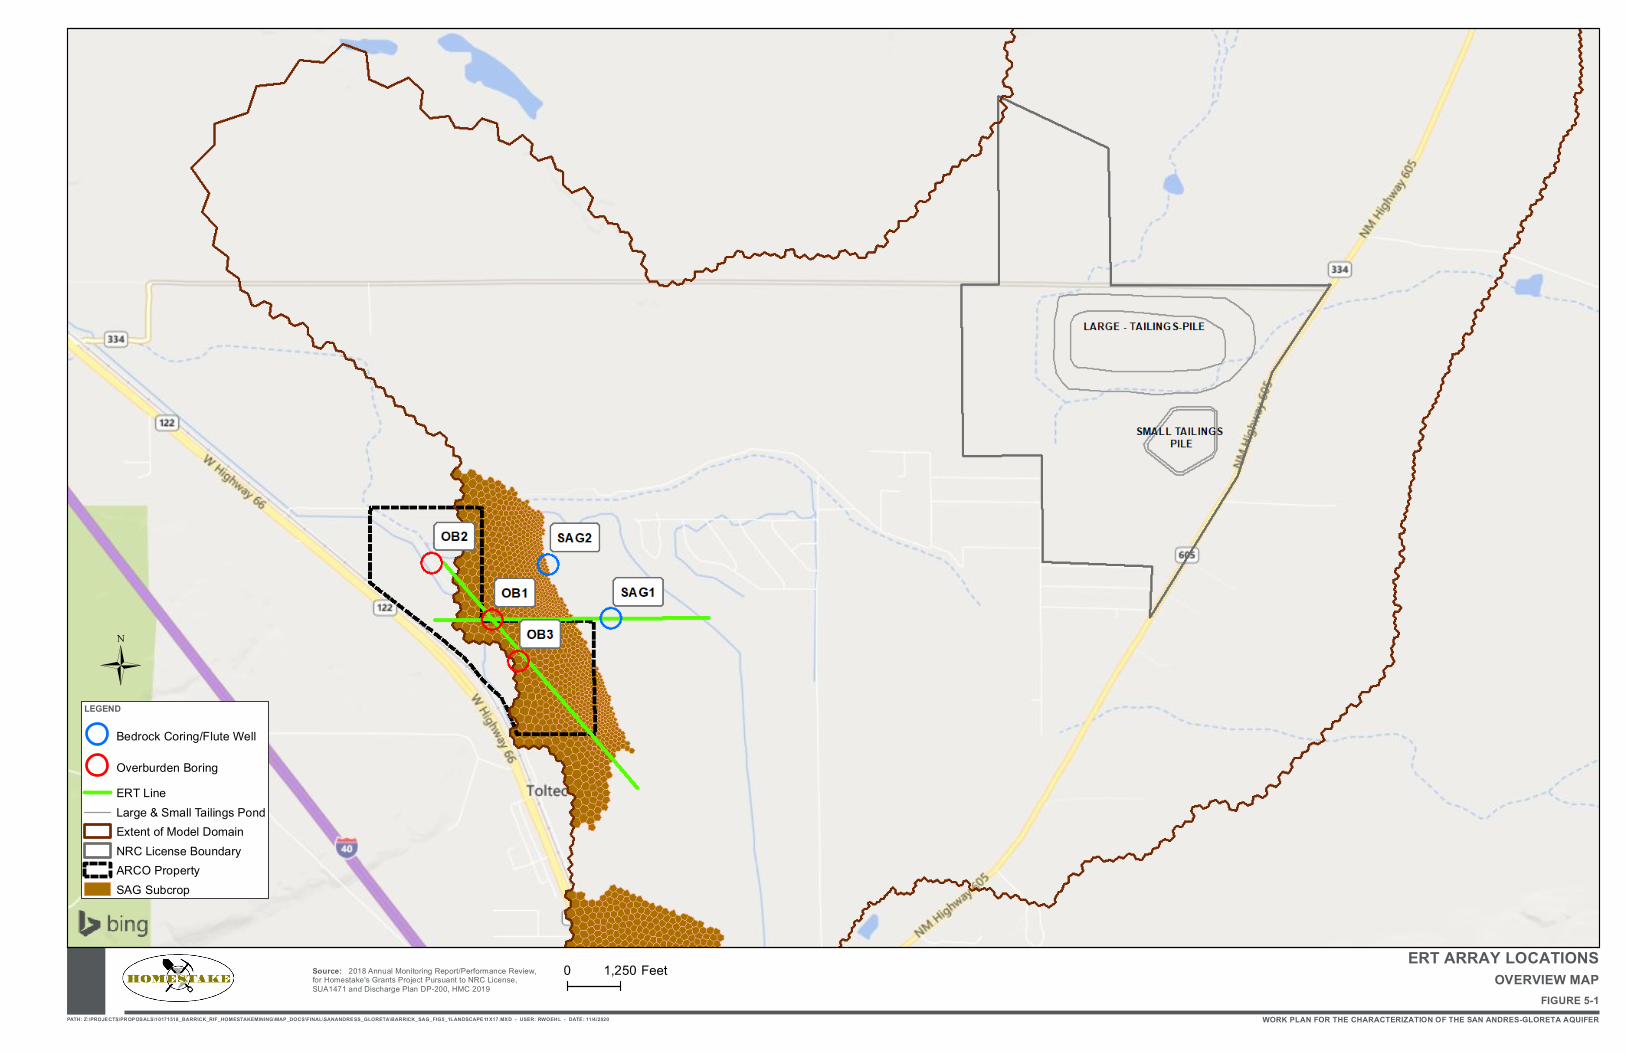
The ERT survey will be completed along two geophysical lines; one parallel to the strike of bedrock formations (northwest to southeast) and the other sub parallel to the formation’s dip azimuth and along the primary west to east groundwater flow direction in the SAG (Figure 5-1). In addition to identifying the presence of the formation, the ERT survey lines are oriented to verify the limits of the SAG subcrop. The extent shown on Figure 5-1 was developed from a combination of available well logs and regional-scale geologic mapping produced by the USGS and the New Mexico Bureau of Geology & Mineral Resources. The geophysical survey will provide information on the limits of the subcrop at a more local scale.
The lines will be positioned to coincide with the location of the exploratory borings, and existing borings associated with alluvial aquifer monitoring wells. This will allow that lithologic data collected from the borings to be used to interpret the ERT data and confirm lithology and depth to bedrock. It may also provide an indication of the variability in soil and rock saturation levels, fracture density and the presence of solution features that may not have been directly observed at the exploratory boring locations.
The survey lines are anticipated to be approximately 7,000 feet in length for a total of 14,000 feet of data collection. Electrode spacing is expected to be 10 to 20 feet. The electrode spacing is directly related to the survey depth and 10- to 20-foot spacing is expected to provide a survey depth of approximately 150 to 200 feet.
Surface Geophysical survey will include the following activities:
• Mobilize ERT survey equipment, SuperSting R8 (or similar) electrical resistivity (ER) system with 112 electrodes with an electrode spacing of 10 to 20 feet. The ER measurements are collected by injecting current into, and determining the voltage difference between, varying electrodes which have been hammered into the ground at the designated spacing along the survey line. This will require good coupling between the electrode and the soil or rock as determined through connection testing by the instrument. Some areas may require lines to be offset, segmented, or due to rough surface conditions may not be surveyed.
• Collect data over approximately 14,000 feet between two ER survey lines. Each resistivity line length (as straight as possible segment) of approximately 1,110 feet is required to achieve a depth of investigation of approximately 100 to 150 feet. Overlapping line segments will be required to collect the approximate 7,000 feet planned for each ER survey line. Unknown buried utility lines, surface obstruction or shallow highly conductive or resistive soil layers may affect the final depth of investigation.
• Data collected will be processed and interpreted using specialized electrical resistivity software (AGI’s Earth Imager). 2D data profiles/cross-sections will be produced for interpretation.

Homestake Mining Company Superfund Site 15 November 2020 SAG Characterization Work Plan
5.4 Exploratory Bedrock Drilling and Coring
Two exploratory borings will be drilled to the base of the SAG aquifer, as shown on Figure 5-1. The base of the SAG is anticipated to be between 300 and 500 feet in depth as shown on Figure 4-4. Borehole depths will be adjusted based on the actual thickness of SAG encountered at each location. Lithologic soil samples will not be collected in the alluvium as these borings will be adjacent to existing alluvial aquifer monitoring wells and stratigraphy has already been established. The alluvial aquifer will be sealed with surface casing before drilling to total depth in the bedrock aquifer(s). A 10-inch borehole will be drilled approximately ten feet into competent bedrock using sonic drilling methods and a 6-inch, steel surface casing will be securely grouted in place to seal the remainder of the borehole from potential hydraulic connection between the alluvial aquifer and the underlying bedrock aquifer. After waiting 24-hours for the grout to cure, the bedrock will be cored to the bottom of the SAG. A geologist will oversee the drilling and data collection activities. The geologist will record depth to bedrock, changes in lithology, fracture spacing, and other rock features.
5.4.1 Bedrock Coring
Bedrock strata will be continuously cored from the top of bedrock to the bottom of the SAG aquifer at the two boring locations. Up to 10 samples of bedrock will be collected from each boring and analyzed for the following list of physical and geochemical properties:
• matrix porosity,
• wet and dry bulk density,
• specific gravity,
• percent moisture,
• bulk and clay mineralogy by x-ray diffraction,
• precise mineralogy and porosity by petrographic analysis,
• total metals,
• sulfur forms,
• total organic carbon,
• cation exchange capacity, and
• soluble & extractable ions
Rock coring will be conducted using rotary drilling methods. A double or triple tube PQ core barrel will be used, resulting in a nominal 5 to 6-inch borehole that is sufficiently large to accept a FLUTe liner without the need for reaming. After coring is complete, temporary FLUTe liners will be installed to limit the movement of groundwater between conductive zones encountered by the borings. Drilling and rock coring will be performed by Cascade Drilling of Peralta, New Mexico.

Homestake Mining Company Superfund Site 16 November 2020 SAG Characterization Work Plan
The recovered core will be photographed, the length of intact core will be measured, and the lithology, presence, orientation and aperture of joints and fractures, bedding plane partings, and evidence for groundwater fluid flow will be recorded in a core log by the onsite geologist or hydrogeologist. In addition, the Rock Quality Designation (RQD) will be calculated. The RQD is a measure of quality of rock core taken from a borehole. RQD signifies the degree of jointing or fracture in a rock mass measured in percentage, where RQD of 75% or more shows good quality hard rock and less than 50% show low quality weathered rocks. After field description is complete, samples will be collected for laboratory analysis and the remainder of the core will be transferred into core boxes. Rock core samplings undergoing samples will be shipped to the respective laboratories for analysis.
Physical property analyses for matrix porosity, organic carbon, wet and dry bulk density, specific gravity, and percent moisture will be completed on bedrock core samples by Golder Associates of Ontario, Canada. Physical property analysis will be performed on all ten samples from each boring. Geochemical testing will be performed by ACZ Laboratories, Inc. of Steamboat Springs, Colorado. Mineralogical testing will be performed by DCM Science Laboratory, Inc. of Wheat Ridge, Colorado. A breakdown of the number of geochemical analyses is provided in Table 5-1.
Table 5-1: Sampling and Analysis Summary for Aquifer Materials Characterization.
Formation XRD Optical Total Metals
Sulfur Forms
CO3 & Organic Carbon
CEC1 % Moisture
Soluble & Extractable
Ions Chinle Shale 2 ------- 2 2 2 2 2 2
San Andres LS 4 2 4 4 4 4 4 ------- Glorieta SS 4 2 4 4 4 4 4 -------
Total 10 4 10 10 10 10 10 2 1CEC is not normally conducted on limestone but is included in case significant sandstone is encountered in the SALS.
Samples of the Chinle will be collected and analyzed as per Table 5-1 if encountered during bedrock coring.
5.4.2 FLUTe™ Hydraulic Profiling
FLUTe™ hydraulic profiling of the boreholes will be conducted, during the installation of the temporary liners, to evaluate the location of transmissive groundwater flow zones. FLUTe™ profiling will be performed by Flexible Liner Underground Technologies (FLUTe), LLC of Alcalde, New Mexico. The test involves installation of a blank liner and measuring the corresponding rate of fluid loss into the borehole wall. The “liner drop” test provides a continuous record of transmissivity with depth. Results of the liner drop test will be used in combination with direct observations of fracture depth, orientation, size from core logs, and borehole geophysical logs to identify major pathways for groundwater movement and to select intervals for FLUTe™ multiport well installation.
5.4.3 Borehole Geophysics
Homestake Mining Company Superfund Site 17 November 2020 SAG Characterization Work Plan
Borehole geophysical logging will be completed to help determine the depth of discrete water-bearing fractures in the bedrock, the strike and dip of joints, fractures and bedding features, the flow within, and in and out of the fractures, and to provide information for the installation of multi-port wells.
The following suite of borehole geophysical logging will be completed in each bedrock borehole by a geophysical subcontractor:
1. Fluid Temperature; 2. Fluid Resistivity; 3. Caliper; 4, Neutron Density; 5. Natural Gamma Ray; 6. Heat Pulse Flowmeter, under ambient and pumping conditions; and 7. Acoustic Televiewer.
Data will be recorded in digital form in the field using a portable computer and will be processed in the office using commercially licensed software. Borehole logging will be performed by Jet West Geophysical Services of Farmington, New Mexico. A natural gamma ray log will be completed in the alluvial aquifer borehole.
5.4.4 Multi-Port Well Installation
A multi-port well will be installed to characterize groundwater quality in the SAG in each borehole. Data collected from the direct field observations of rock core, borehole geophysics and FLUTe™ hydraulic profiling will be used to select the multi-port sampling intervals. Once selected, the proposed multi-port sampling intervals will be presented in tabular format to the HMC and EPA for their review and approval.
The advantage of a multi-port FLUTe™ system is that it protects groundwater integrity while isolating sections of a well. More specifically, a multi-port FLUTe™ system allows for direct sampling of fractures or groundwater flow zones within the well by isolating specific depths. The number and depth of each port in the multi-port well will be determined using the borehole geophysical data. FLUTe™ multi-port wells will be developed according to FLUTe™ protocols included in QAPP. The location and elevation of the multi-port wells will be surveyed using the same datum as the other Site monitoring wells.
5.5 Alluvial Aquifer Borings
5.5.1 Alluvial Aquifer Drilling and Lithologic Sampling

Homestake Mining Company Superfund Site 18 November 2020 SAG Characterization Work Plan
One boring will be drilled, along the geophysical line and located within the footprint of the SAG subcrop, to the bedrock surface to characterize the variability of alluvial deposits and to confirm the presence of the SAG (Figure 5-1). Two additional borings will be drilled, at locations to the northwest and southeast of OB1, if an access agreement can be completed with the property owner within one mobilization to complete the SAG investigation. HMC will make its best effort to secure access to these properties during this mobilization.
Soil samples will be collected continuously from the ground surface to bedrock using sonic coring methods. A sample of the bedrock will also be collected to confirm the presence of the San Andres Limestone. A geologist will oversee the drilling and data collection activities. The geologist will visually describe grain size distribution, changes in lithology and geologic structural features, moisture content and depth to bedrock. Field descriptions will be noted on a geologic log. Data collected from this borehole will be used to evaluate the vertical anisotropy of alluvial aquifer in the area of the SAG subcrop, the presence of saturated soil conditions and to confirm the presence of the subcrop. If the alluvium is not saturated, the borings will be sealed and abandoned with grout after lithologic sampling activities have been completed. The cement bentonite grout will consist of a 90% type 1 or type 2 Portland cement to 10% pure sodium bentonite ratio and will be tremied from the bottom of the borehole to ground surface and allowed to harden.
5.5.2 Alluvial Aquifer Piezometer Installation
HMC will install a piezometer in OB1 and the two additional locations (OB2 and OB3) if the alluvium is saturated, to evaluate the horizontal and vertical direction of groundwater movement in the area of the SAG subcrop. The piezometers will be constructed with 4-inch PVC casing and screen. The screen will extend the full thickness of the saturated portion of the alluvial aquifer to a point five to 10 feet above the water table to account for seasonal variations in water levels. The location and elevation of the piezometers will be surveyed using the same datum as the new SAG monitoring wells and the other Site alluvial aquifer monitoring wells.
5.6 Groundwater Sampling
Two rounds of groundwater samples will be collected from the two new FLUTe™ multi-port wells to characterize the native groundwater quality in the SAG. Groundwater will be purged and sampled in accordance with Flexible Liner Underground Technologies, Ltd. L.C. sampling guidelines. Sample collection will be performed by HMC. All samples will be analyzed for the primary metals of concern at the Site (uranium, molybdenum and selenium), minor constituents (vanadium, radium, thorium and nitrate), and the indicator constituents (sulfate, chloride and total dissolved solids (TDS)). Sample analysis will be performed by ACZ Laboratories, Inc. of Steamboat Springs, Colorado. A detailed description of well purging and groundwater sampling procedures is provided in the QAPP. The two rounds of groundwater sampling will be conducted approximately two months apart to capture seasonal variations in groundwater quality. Groundwater sampling will be completed by local HMC staff.
5.7 Water Level Measurements
Water levels will be measured in the new multi-port monitoring wells, the new piezometers if installed and a selected group of alluvial aquifer wells located in the immediate area of the SAG

Homestake Mining Company Superfund Site 19 November 2020 SAG Characterization Work Plan
subcrop. The purpose of the water level measurements is to evaluate the horizontal and vertical direction of groundwater movement in the area of the SAG subcrop. Water levels will be measured twice during the field investigation to evaluate seasonal variations in hydraulic head, and horizontal and vertical groundwater flow. Hydraulic heads will be measured in multi-port monitoring wells with manual water level meters according to FLUTe protocols. Water levels at the FLUTe wells will be measured to the nearest 0.01 feet. Detailed procedures for conducting water level measurements are provided in the QAPP. Water level measurements will be completed by local HMC staff.
5.8 Investigation Derived Waste Characterization and Disposal
HDR will manage and dispose of all IDW in accordance with local and Federal regulations as specified in the QAPP. HDR will arrange for a secure location to stage the IDW. The Waste Management procedures in the HASP will describe how the IDW generated during the field investigation will be handled and managed (staging pad, fencing, tarping, marking, inspection requirements, etc.). IDW will include the following waste streams:
1. Monitoring well development and purge water; 2. Soil cuttings; 3. Residual drilling fluids; 4. Decontamination fluids containing wash/rinse water and decontamination chemicals; and 5. Contaminated debris, including but not limited to contaminated personal protective
clothing, plastic sheeting, and consumable sampling equipment. If field screening or other information indicates that the IDW from a certain location (soil cuttings, groundwater) is likely highly contaminated, this material will be segregated from the other IDW in order to minimize the volume of IDW that will require management as hazardous. IDW determined to be hazardous will be transported by an approved, licensed transporter to an approved treatment, storage, and disposal facility for disposal. HDR will verify whether facilities to be used are currently approved by EPA Region 6. Only an approved disposal facility will be used for disposal of hazardous IDW. HDR will review the profiles and manifests from the IDW contractor and will recommend a classification and a facility. This recommendation will then be forwarded to EPA for concurrence and approval. If the field screening indicates the IDW is likely not contaminated, it will be transported to HMC’s field office for disposal.

Homestake Mining Company Superfund Site 20 November 2020 SAG Characterization Work Plan
SECTION 6 - SAG CHARACTERIZATION REPORT
HDR will develop and deliver a summary report that describes the physical and geochemical characteristics SAG aquifer in the area where it subcrops at the base of the alluvial aquifer hydraulically downgradient of the former Homestake Milling facility. The Draft SAG Characterization Report will be submitted to HMC for review. After HMC review of the Draft SAG Characterization Report, HDR will address HMC comments and submit a Draft Final SAG Characterization Report for submittal to EPA. HDR will address EPA comments to HMC’s satisfaction and submit a Final SAG Characterization Report.

FIGURES

PATH: Z:\PROJECTS\PROPOSALS\10171518_BARRICK_RIF_HOMESTAKEMINING\MAP_DOCS\FINAL\SANANDRESS_GLORETA\BARRICK_SAG_FIG2_1_LANDSCAPE8X11.MXD - USER: RWOEHL - DATE: 10/15/2020
Source: 2018 Annual Monitoring Report/Performance Review,for Homestake's Grants Project Pursuant to NRC License,SUA1471 and Discharge Plan DP-200, HMC 2019 FIGURE 2-1
WORK PLAN FOR THE CHARACTERIZATION OF THE SAN ANDRES-GLORETA AQUIFER

PATH: Z:\PROJECTS\PROPOSALS\10171518_BARRICK_RIF_HOMESTAKEMINING\MAP_DOCS\FINAL\SANANDRESS_GLORETA\BARRICK_SAG_FIG2_2_LANDSCAPE11X17.MXD - USER: RWOEHL - DATE: 10/15/2020
SAG INVESTIGATION PROJECT SCHEDULE
FIGURE 2-2WORK PLAN FOR THE CHARACTERIZATION OF THE SAN ANDRES-GLORETA AQUIFER
Source: 2018 Annual Monitoring Report/Performance Review,for Homestake's Grants Project Pursuant to NRC License,SUA1471 and Discharge Plan DP-200, HMC 2019


PATH: Z:\PROJECTS\PROPOSALS\10171518_BARRICK_RIF_HOMESTAKEMINING\MAP_DOCS\FINAL\SANANDRESS_GLORETA\BARRICK_SAG_FIG5_1LANDSCAPE11X17.MXD - USER: RWOEHL - DATE: 11/4/2020
ERT ARRAY LOCATIONSOVERVIEW MAP
WORK PLAN FOR THE CHARACTERIZATION OF THE SAN ANDRES-GLORETA AQUIFER
Source: 2018 Annual Monitoring Report/Performance Review,for Homestake's Grants Project Pursuant to NRC License,SUA1471 and Discharge Plan DP-200, HMC 2019
LEGEND
Bedrock Coring/Flute Well
Overburden BoringERT LineLarge & Small Tailings PondExtent of Model DomainNRC License BoundaryARCO PropertySAG Subcrop
Ü
0 1,250 FeetFIGURE 5-1