horizontal merger investigation data · 1 federal trade commission introduction to promote...
TRANSCRIPT
Horizontal Merger Investigation Data
Federal Trade Commission | January 2013
FISCAL YEARS 1996 - 2011
This report is available online at
CONTENTS
INTRODUCTION . . . . . . . . . . . . . . . . . . . . . . . . . . . . . . . . . . . . . . . . . .1
MARKET STRUCTURE VARIABLES . . . . . . . . . . . . . . . . . . . . . . . . . .2
Herfindahl-Hirschman Index & Change in the HHI . . . . . . . . . . . . . . . . . . . . . . .2
Significant Competitors . . . . . . . . . . . . . . . . . . . . . . . . . . . . . . . . . . . . . . . . . . .3
HOT DOCUMENTS & CUSTOMER COMPLAINT DATA . . . . . . . . . . . .4
Hot Documents . . . . . . . . . . . . . . . . . . . . . . . . . . . . . . . . . . . . . . . . . . . . . . . . . .4
Customer Complaints . . . . . . . . . . . . . . . . . . . . . . . . . . . . . . . . . . . . . . . . . . . . .4
ENTRY . . . . . . . . . . . . . . . . . . . . . . . . . . . . . . . . . . . . . . . . . . . . . . . . .5
TABLES . . . . . . . . . . . . . . . . . . . . . . . . . . . . . . . . . . . . . . . . . . . . . . . .7
Post Merger HHI & Change in HHI . . . . . . . . . . . . . . . . . . . . . . . . . . . . . . . . . . .8
Significant Competitors . . . . . . . . . . . . . . . . . . . . . . . . . . . . . . . . . . . . . . . . . .12
Hot Documents . . . . . . . . . . . . . . . . . . . . . . . . . . . . . . . . . . . . . . . . . . . . . . . . .17
Customer Complaints . . . . . . . . . . . . . . . . . . . . . . . . . . . . . . . . . . . . . . . . . . . .19
Entry . . . . . . . . . . . . . . . . . . . . . . . . . . . . . . . . . . . . . . . . . . . . . . . . . . . . . . . . .21
FIGURES . . . . . . . . . . . . . . . . . . . . . . . . . . . . . . . . . . . . . . . . . . . . . .23
www.ftc.gov/os/2013/01/130104horizontalmergerreport.pdf
The online version of this report contains live hyperlinks.
1
FEDERAL TRADE COMMISSION
INTRODUCTION
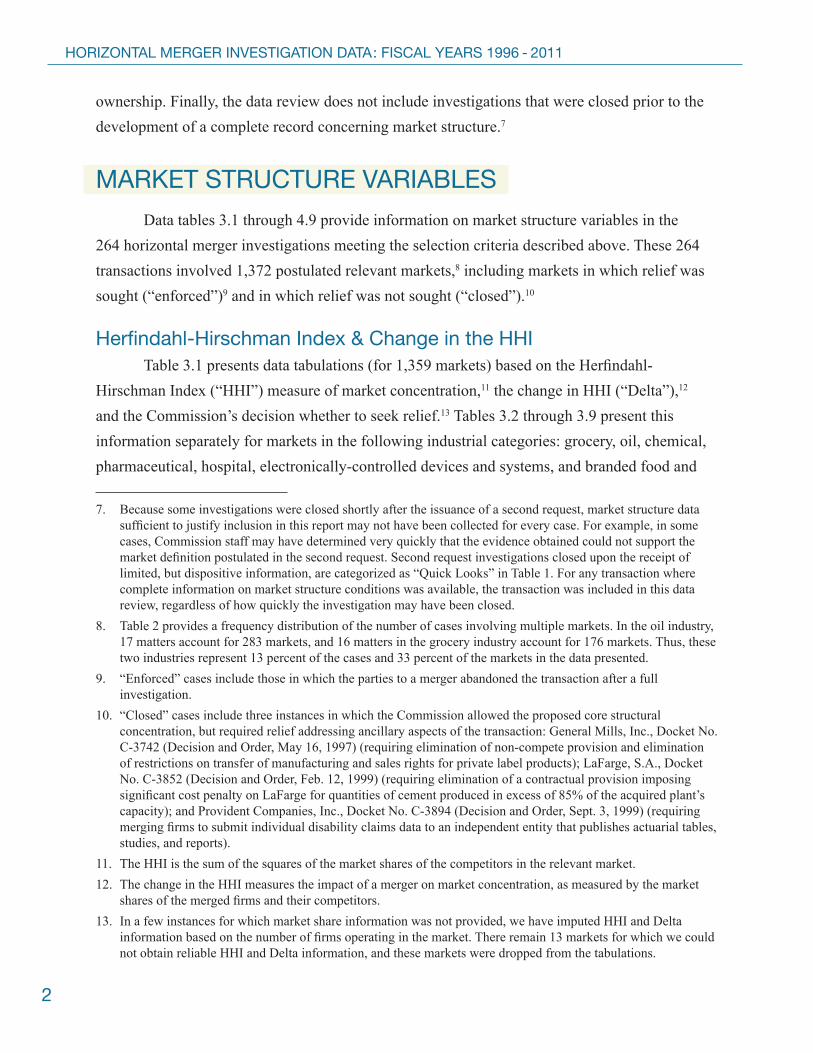
To promote transparency in merger enforcement, Federal Trade Commission staff1 reviewed the horizontal merger investigations that the agency conducted during fiscal years 1996 through 2011 and compiled relevant data for public release.2 The information presented in the attached tables has been extracted from staff memoranda written at the time of each investigation to advise the Commission regarding its enforcement decisions.3 The staff has tabulated certain market structure information along with the Commission’s decision whether or not to seek relief in the specific markets investigated.4 In addition, for a subset of these investigations (those with three or fewer markets), the staff also tabulated the Commission’s enforcement decisions based on the presence or absence of “hot documents,” “strong customer complaints,” and “entry conditions” as they were identified during the investigation.
The FTC issued HSR second requests in 464 merger investigations from fiscal years 1996 through 2011.5 Market shares and concentration are most relevant when evaluating horizontal competitive effects, so staff has omitted from the data any transactions (or any individual markets) in which a challenge was based on non-horizontal theories of competitive concern such as vertical control or monopsony power.6 Staff also excluded transactions where the concern was elimination of potential, rather than actual, competition, as well as those transactions where the competitive concern stemmed from influence obtained through partial, rather than majority,
1. This report was prepared principally by economist Malcolm Coate. A large number of research assistants in the Bureau of Economics coded the data over the past decade with Anne Miles, Jennifer Flansburg, Jeremy Montgomery, Tamma Carletan, Amanda Kalamar, and Thomas Knight preparing the current update of the report. Elizabeth Callison also contributed to the effort. The redesign of the report was accomplished by Carrie Gelula in the Bureau of Consumer Protection’s Division of Consumer and Business Education.
2. This document updates the previous Commission data release of December 2, 2008 to reflect information from second requests issued prior to the end of fiscal year 2011 (September 30, 2011).
3. The memos were reviewed independently by two staff reviewers, and any discrepancies in the information recorded by these reviewers were reconciled by a third staff reviewer.
4. Because this review of horizontal merger investigations was limited to those matters in which a Request for Additional Information (“second request”) was issued, this information does not reflect a random sample of merger transactions.
5. This number differs slightly from that reported in the Federal Trade Commission and deparTmenT oF JusTiCe annual reporT To Congress (“HSR Report”) because, for a few transactions, multiple second requests were issued.
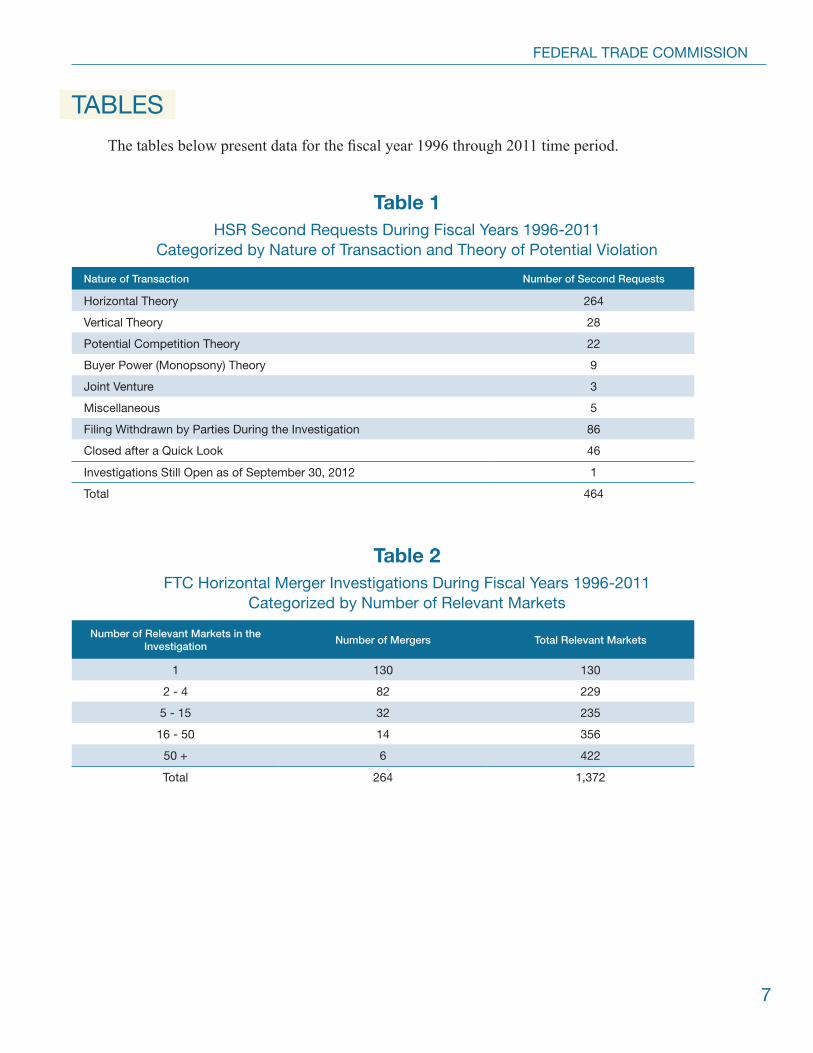
6. Table 1 provides information on the categorization of the 464 transactions. This classification scheme focuses on the most important anticompetitive theory evaluated by staff in the investigation. Because a few matters involve multiple theories of concern (i.e., both horizontal and vertical), different reviews might generate slightly different results. Moreover, all matters withdrawn from HSR review prior to the completion of the investigation are coded as withdrawn. One matter from the fiscal year 2008-2011 period is not coded, because the file was not complete as of September 30, 2012.
2
HORIZONTAL MERGER INVESTIGATION DATA: FISCAL YEARS 1996 - 2011
ownership. Finally, the data review does not include investigations that were closed prior to the development of a complete record concerning market structure.7
MARKET STRUCTURE VARIABLES
Data tables 3.1 through 4.9 provide information on market structure variables in the 264 horizontal merger investigations meeting the selection criteria described above. These 264 transactions involved 1,372 postulated relevant markets,8 including markets in which relief was sought (“enforced”)9 and in which relief was not sought (“closed”).10
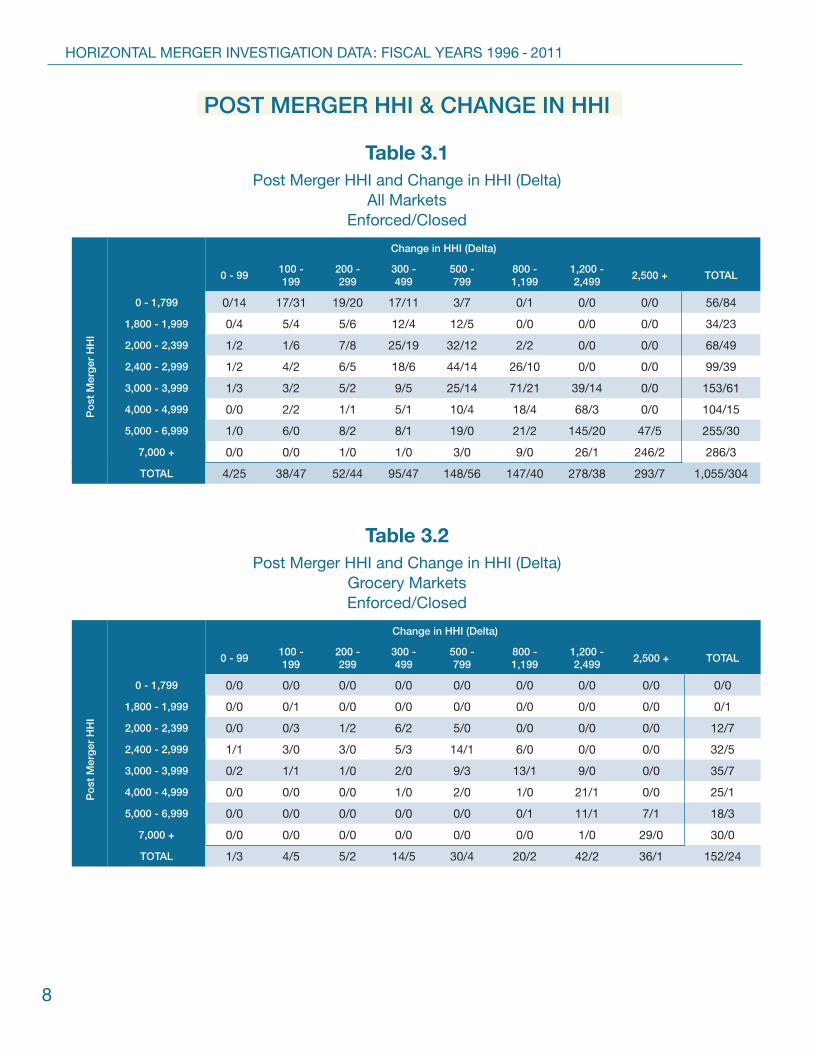
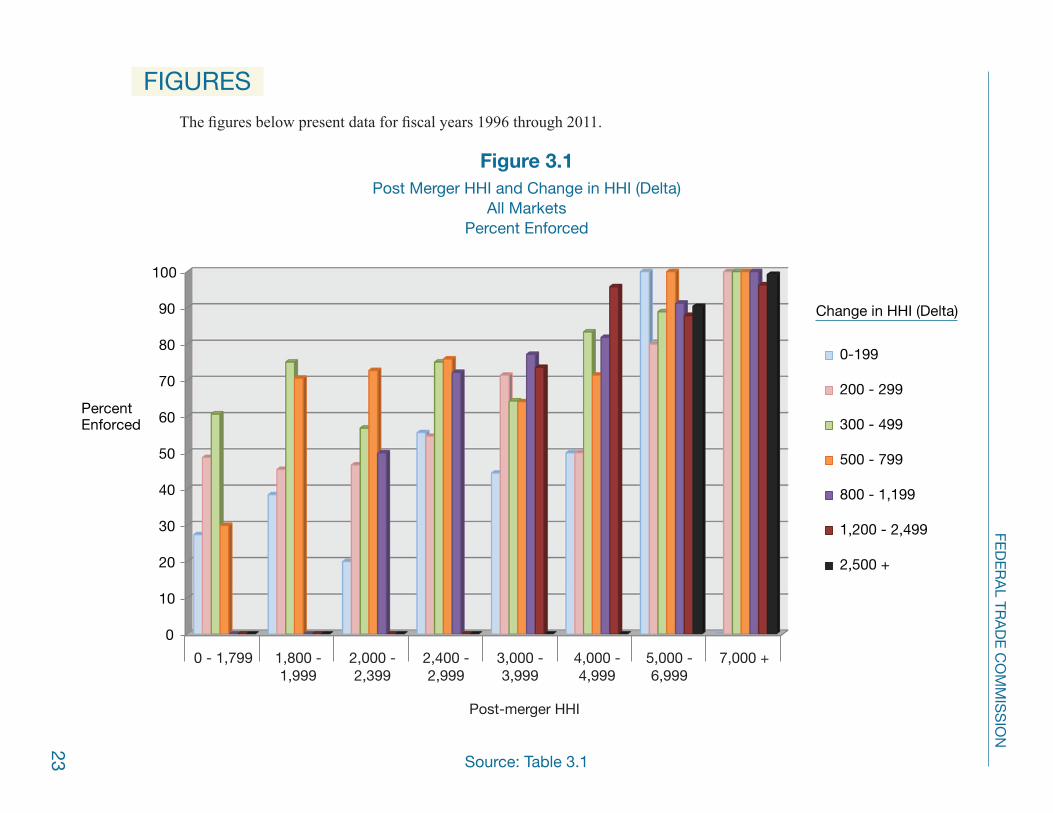
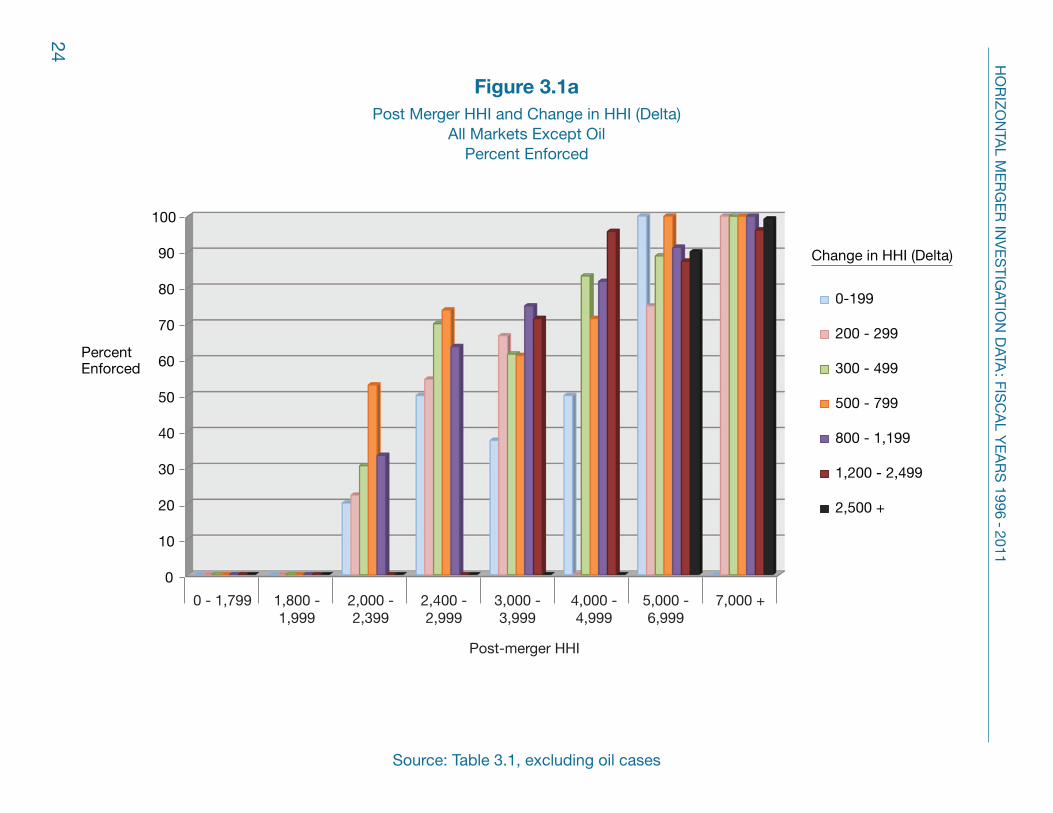
Herfindahl-Hirschman Index & Change in the HHI Table 3.1 presents data tabulations (for 1,359 markets) based on the Herfindahl-
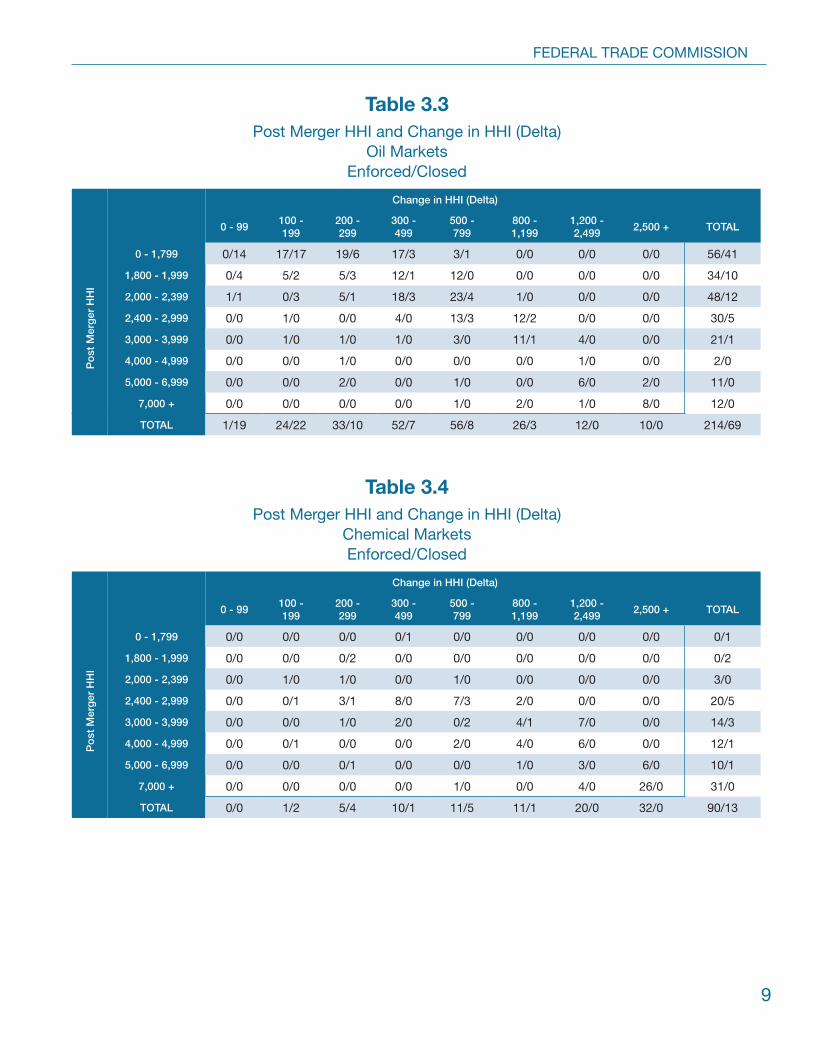
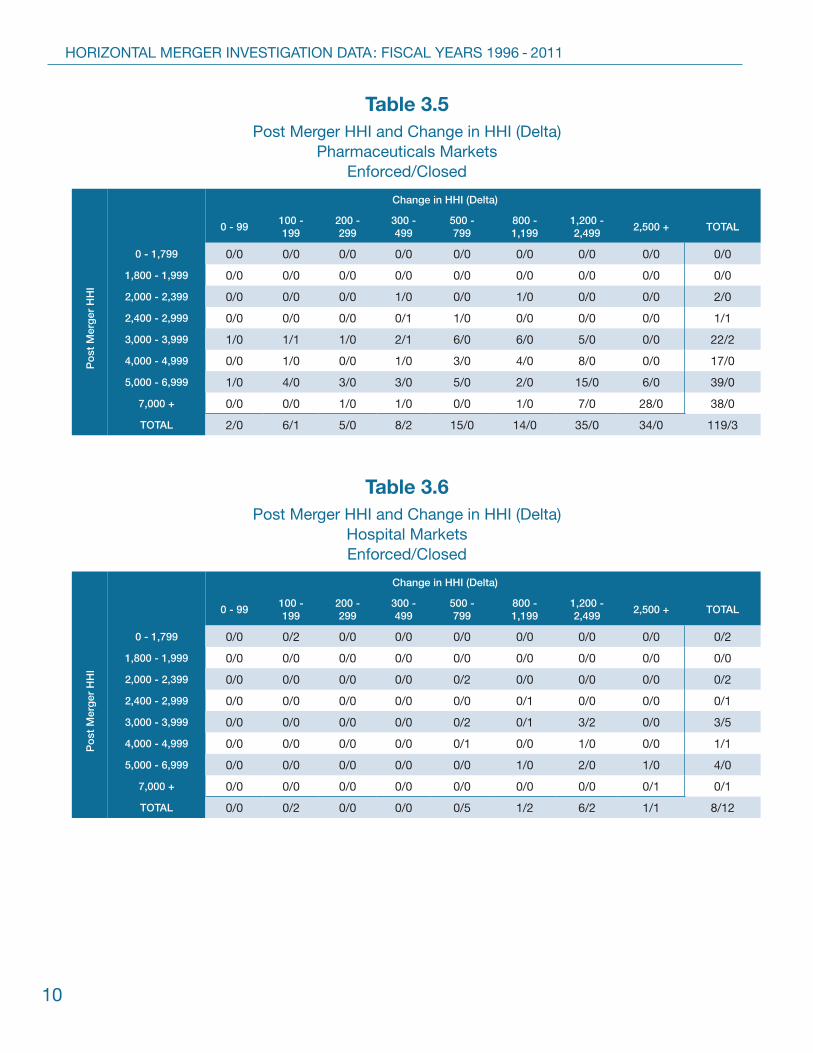
Hirschman Index (“HHI”) measure of market concentration,11 the change in HHI (“Delta”),12 and the Commission’s decision whether to seek relief.13 Tables 3.2 through 3.9 present this information separately for markets in the following industrial categories: grocery, oil, chemical, pharmaceutical, hospital, electronically-controlled devices and systems, and branded food and
7. Because some investigations were closed shortly after the issuance of a second request, market structure data sufficient to justify inclusion in this report may not have been collected for every case. For example, in some cases, Commission staff may have determined very quickly that the evidence obtained could not support the market definition postulated in the second request. Second request investigations closed upon the receipt of limited, but dispositive information, are categorized as “Quick Looks” in Table 1. For any transaction where complete information on market structure conditions was available, the transaction was included in this data review, regardless of how quickly the investigation may have been closed.
8. Table 2 provides a frequency distribution of the number of cases involving multiple markets. In the oil industry, 17 matters account for 283 markets, and 16 matters in the grocery industry account for 176 markets. Thus, these two industries represent 13 percent of the cases and 33 percent of the markets in the data presented.
9. “Enforced” cases include those in which the parties to a merger abandoned the transaction after a full investigation.
10. “Closed” cases include three instances in which the Commission allowed the proposed core structural concentration, but required relief addressing ancillary aspects of the transaction: General Mills, Inc., Docket No. C-3742 (Decision and Order, May 16, 1997) (requiring elimination of non-compete provision and elimination of restrictions on transfer of manufacturing and sales rights for private label products); LaFarge, S.A., Docket No. C-3852 (Decision and Order, Feb. 12, 1999) (requiring elimination of a contractual provision imposing significant cost penalty on LaFarge for quantities of cement produced in excess of 85% of the acquired plant’s capacity); and Provident Companies, Inc., Docket No. C-3894 (Decision and Order, Sept. 3, 1999) (requiring merging firms to submit individual disability claims data to an independent entity that publishes actuarial tables, studies, and reports).
11. The HHI is the sum of the squares of the market shares of the competitors in the relevant market.12. The change in the HHI measures the impact of a merger on market concentration, as measured by the market
shares of the merged firms and their competitors.13. In a few instances for which market share information was not provided, we have imputed HHI and Delta
information based on the number of firms operating in the market. There remain 13 markets for which we could not obtain reliable HHI and Delta information, and these markets were dropped from the tabulations.
3
FEDERAL TRADE COMMISSION
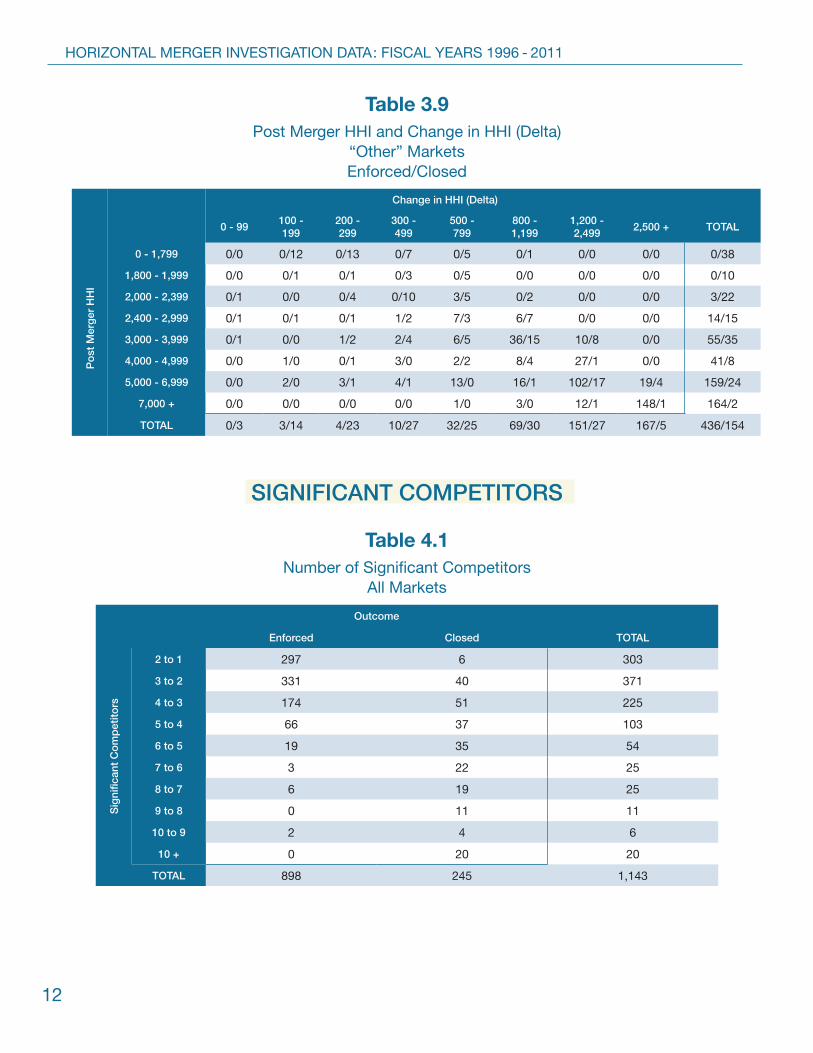
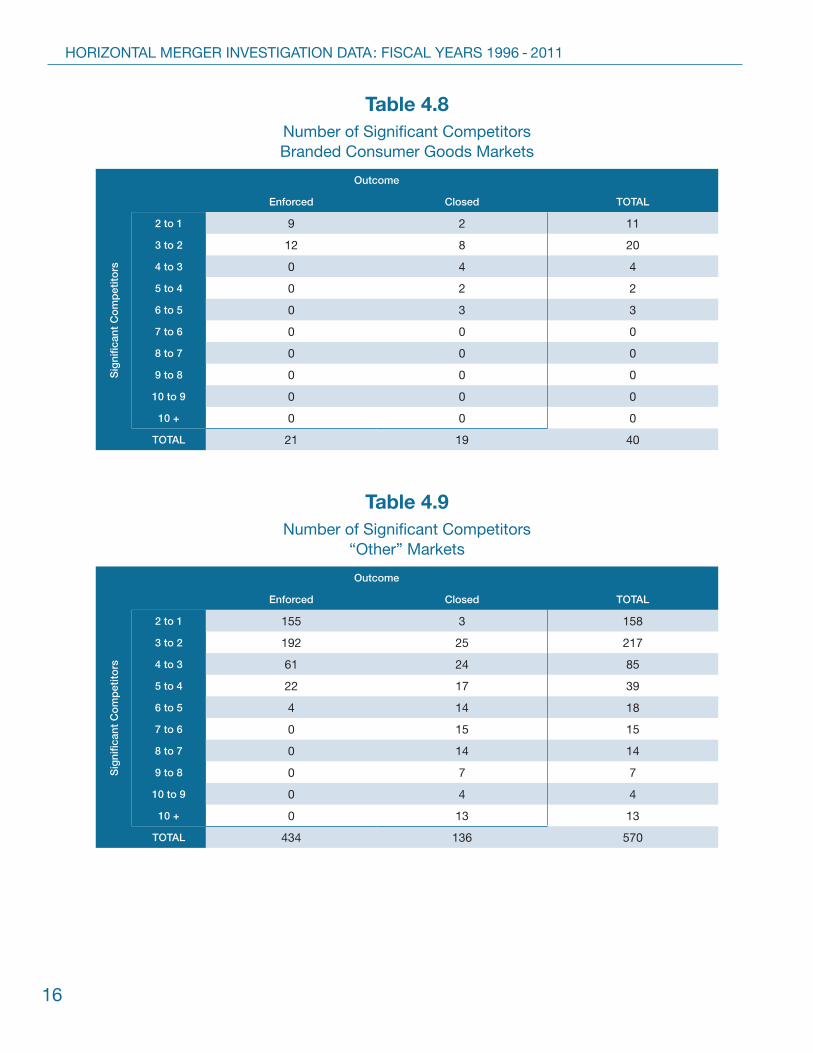
beverage. Information for the remaining markets is summarized as “other” markets.14 Figures 3.1 and 3.1a provide graphical depictions of the relevant information, first for the overall sample and then for a subsample that excludes oil markets.
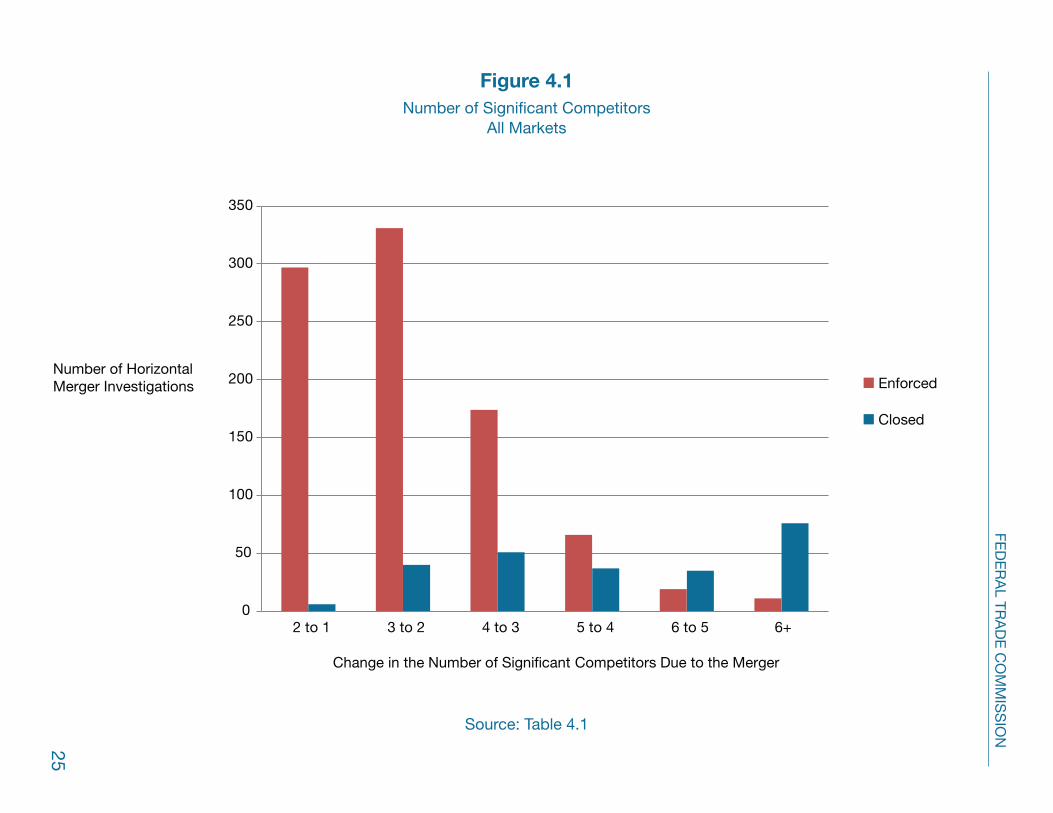
Significant Competitors A “significant competitor” is a firm whose independence could affect the ability of
the merged firms to achieve an anticompetitive outcome.15 For purposes of this data review, “significant competitor” has been defined in relation to the competitive effects theory that was the most plausible basis for the investigation.16 When the primary concern was that the transaction would allow the remaining firms to coordinate their conduct, significant competitors have been defined as “required participants in the collusive group.” When the primary concern was that the transaction would result in the exercise of unilateral market power, significant competitors include those firms identified as “close rivals” (even if they may not be close enough to constrain a price increase),17 as well as those that might reposition or otherwise affect the likelihood of an anticompetitive price increase. Data are available for 1,143 relevant markets.18
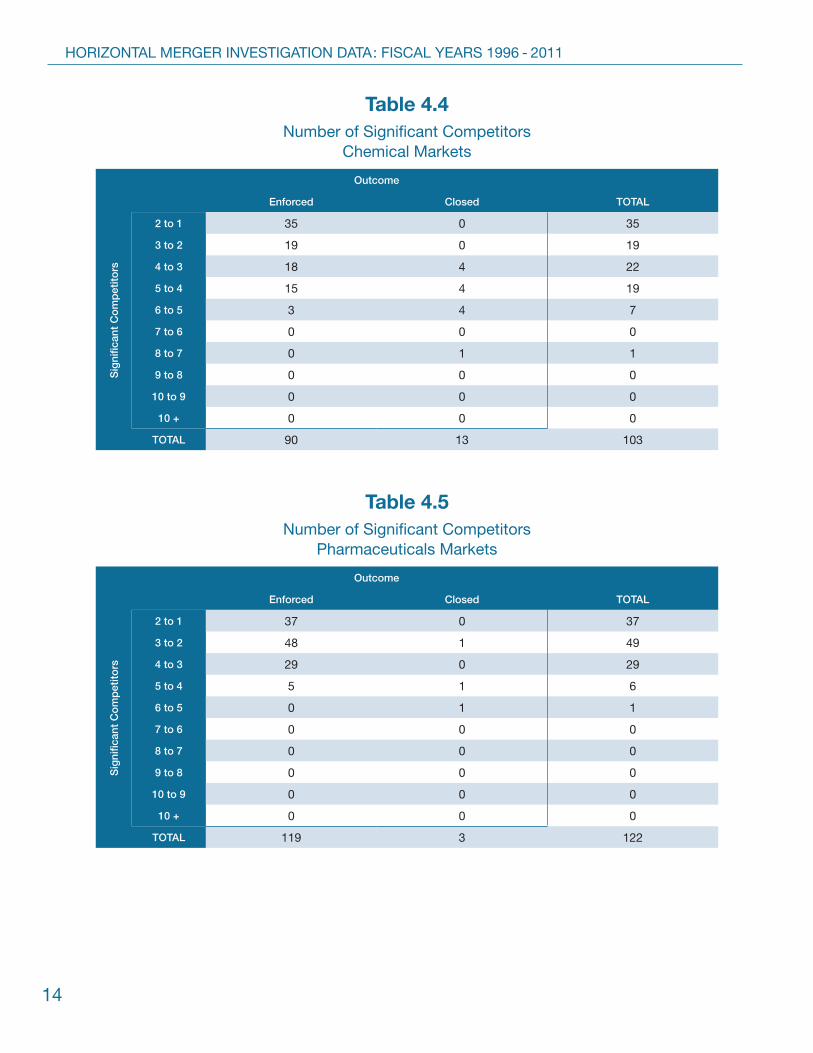
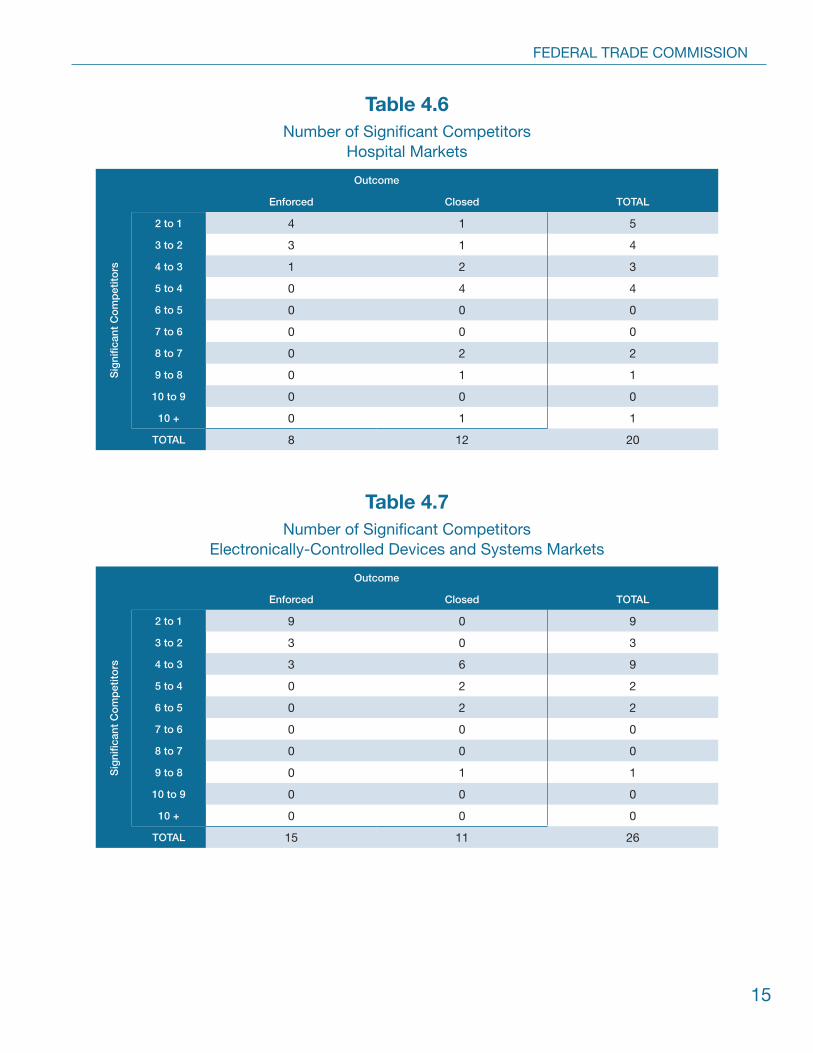
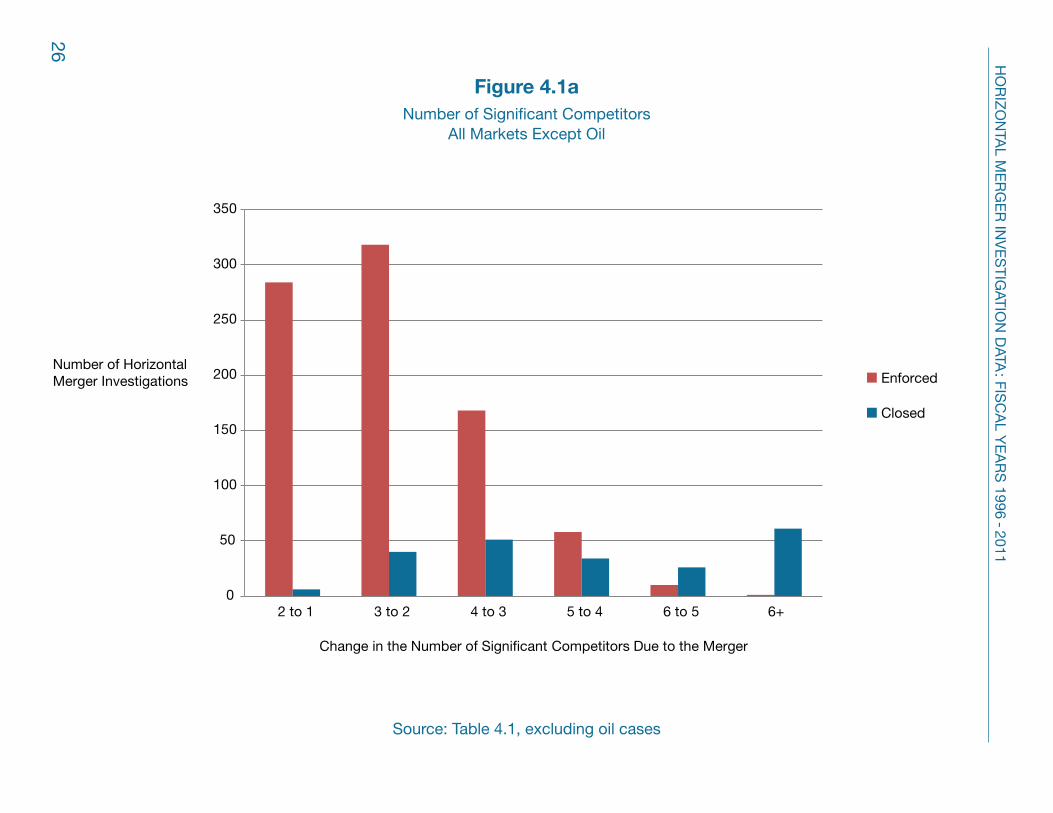
Table 4.1 presents information regarding the Commission’s decision to seek relief along with information on the number of significant competitors in the market, both pre- and post-merger, assuming consummation of the transaction. Tables 4.2 through 4.9 present similar information, but separately by industrial category. Figures 4.1 and 4.1a provide a graphical
14. Compared to prior data releases, this release adds information for markets in three additional industry categories (hospital, food and beverage, and electronically-controlled devices and systems). The definitions of the first two industries are self-explanatory, while the third contains products based on semiconductors (e.g., hard drives) and various manufactured products in which a semiconductor controls the functioning of the product (e.g., testing devices).
15. The merging firms are always considered significant competitors. Matters that close due to the insignificance of one of the merging parties are coded as “Quick Looks.”
16. For a discussion of the main theories used in horizontal merger cases, see U. S. Department of Justice and Federal Trade Commission, Horizontal Merger Guidelines, August 19, 2010, available at http://www.ftc.gov/os/2010/08/100819hmg.pdf.
17. These firms usually have market shares in excess of 10%, but market shares alone are not determinative of significance. For example, in a particular market, a firm may have a low market share, having just entered the market with an innovative product. Nevertheless, that firm would be considered a significant competitor if it had the ability to constrain the merged firm’s behavior. In other situations, the definition of a significant competitor may rely on a firm’s ability to expand output to defeat a price increase; existing market shares may be a poor predictor of that ability.
18. Significant competitor information is not available for 229 markets; 198 of these markets are in the oil industry. The computation of the number of significant rivals is not always possible when the merger investigation covers a very large number of overlaps.
4
HORIZONTAL MERGER INVESTIGATION DATA: FISCAL YEARS 1996 - 2011
illustration of the information. Figure 4.1 provides the data for the entire sample, while Figure 4.1a presents the data for a subsample that excludes oil markets.
HOT DOCUMENTS & CUSTOMER COMPLAINT DATA
Tables 5.1 through 8.2 provide information on the Commission’s decision to seek relief in cases where the staff identified one or more party documents clearly predicting merger-related anticompetitive effects (“hot documents”) or where staff received “strongly credible” customer complaints about the likely anticompetitive effects of the transaction in one or more markets. For these two variables, a subset of the original sample of transactions was reviewed.
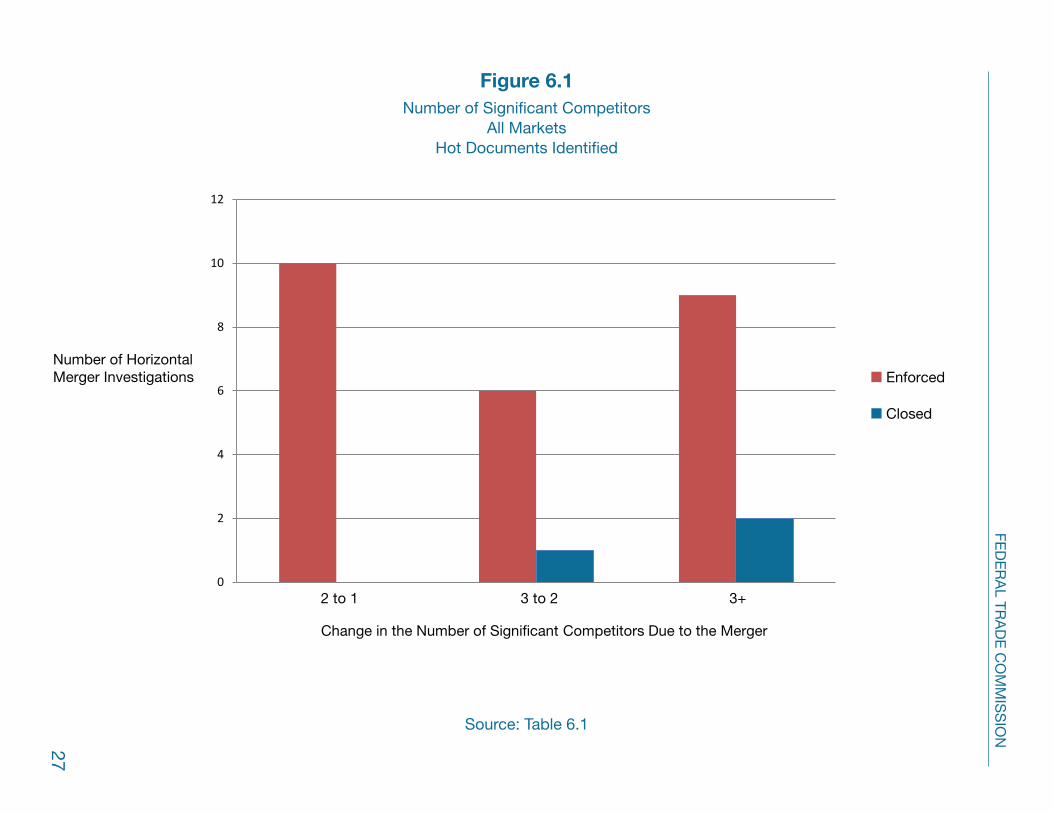
Hot Documents Data on “hot documents”19 were collected for all fully-investigated transactions involving
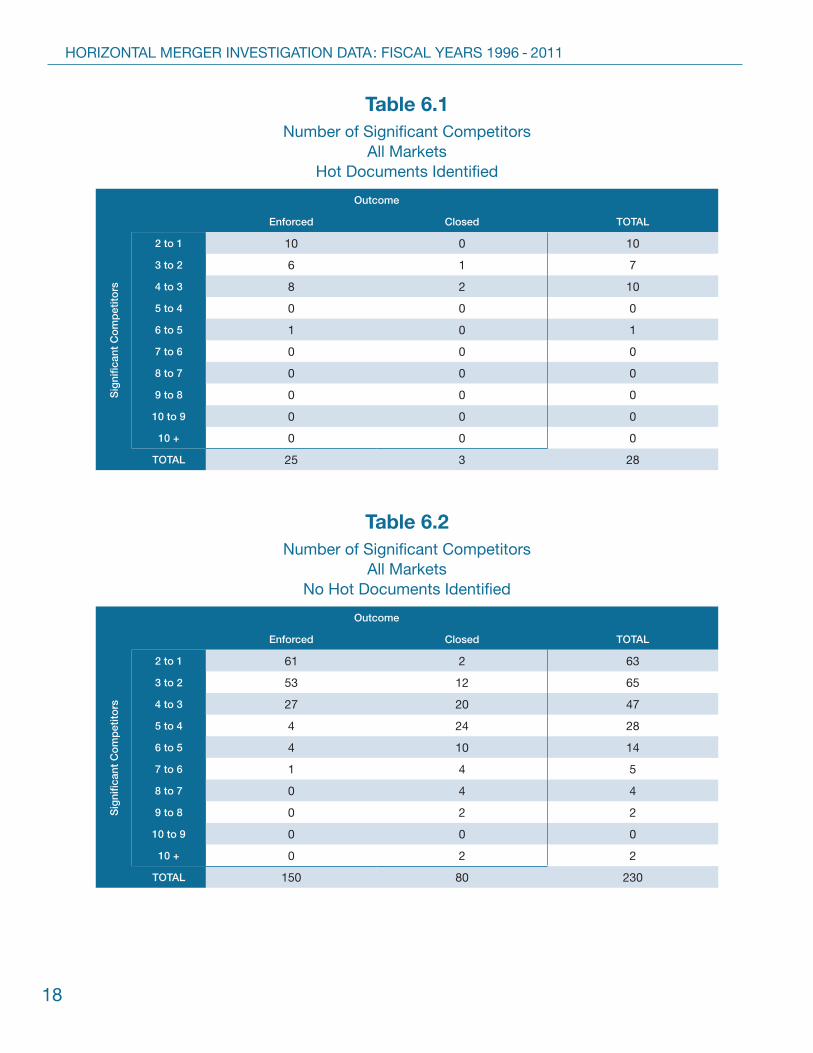
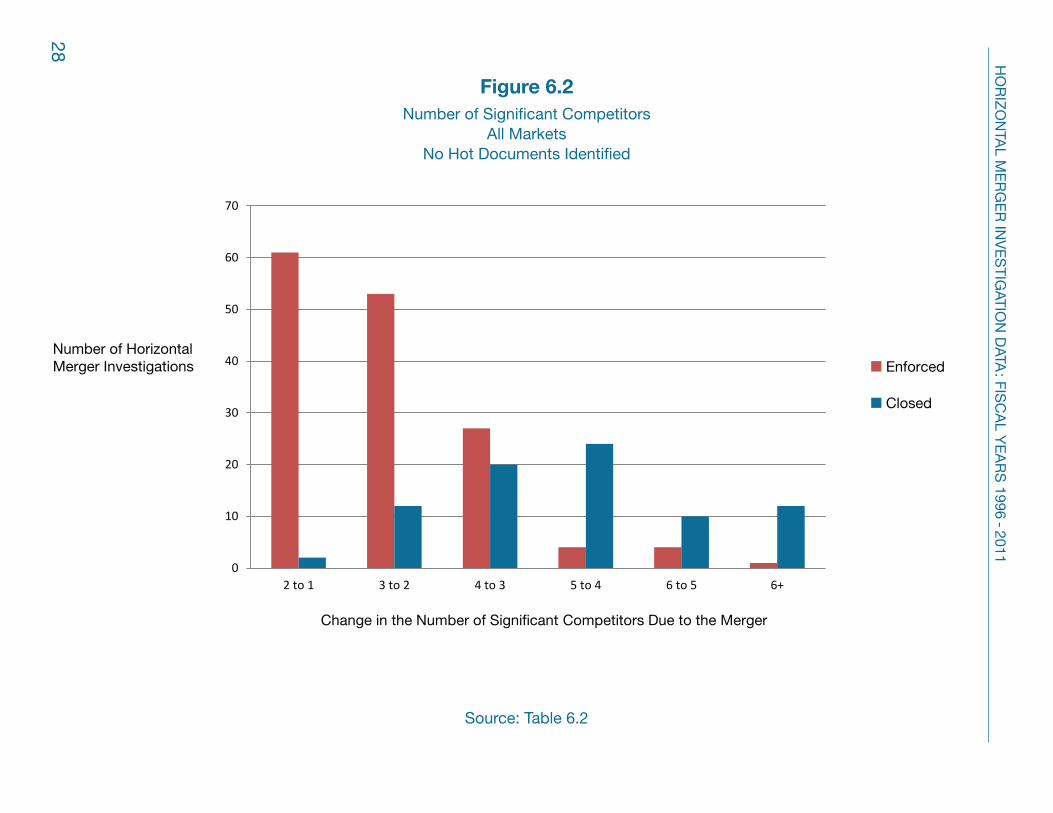
three or fewer relevant markets. This subset consists of 186 cases, involving 258 markets.20 Table 5.1 presents the HHI and the Delta, together with the Commission’s decision whether or not to seek relief, for markets in which staff identified hot documents. Table 5.2 presents the same information for markets where no hot documents were identified. Tables 6.1 and 6.2 provide information on the number of significant competitors and the decision to seek relief for markets in which staff had or had not identified hot documents, respectively. Figures 6.1 and 6.2 depict challenge rates grouped by significant rivals for matters with and without findings of hot documents.
Customer Complaints Data on the strength of customer reaction to the merger are presented in Tables 7.1
through 8.2. Customer reaction has been recorded as a “strong customer complaint” where customers expressed a credible concern that a significant anticompetitive effect would result if the transaction were allowed to proceed. All other customer reactions (i.e., weak or non-
19. A document is “hot” if it predicts that the merger will produce an adverse price or non-price effect on competition. The most obvious situation involves acquiring party documents that predict a price effect stemming from the merger. The price effect is not necessarily quantified and may be qualified by the use of words such as “likely” or “possible.” Alternatively, a document might indicate that the recent entry of the acquired party blocked the incumbent’s plans to raise price, instead forcing a small but significant price reduction. On occasion, the evidence relates to non-price competition, for example, when the documents indicate a merger might delay the acquiring firm’s need to add capacity. Documentary recognition of close competition between the merging parties is not sufficient to qualify for “hot document” status, because a range of other factors could preclude a price effect.
20. The number of transactions in this subset represents 70% of the transactions reviewed.
5
FEDERAL TRADE COMMISSION
credible complaints, no reaction, or support for the transaction) have been recorded as “no strong customer complaint.”21
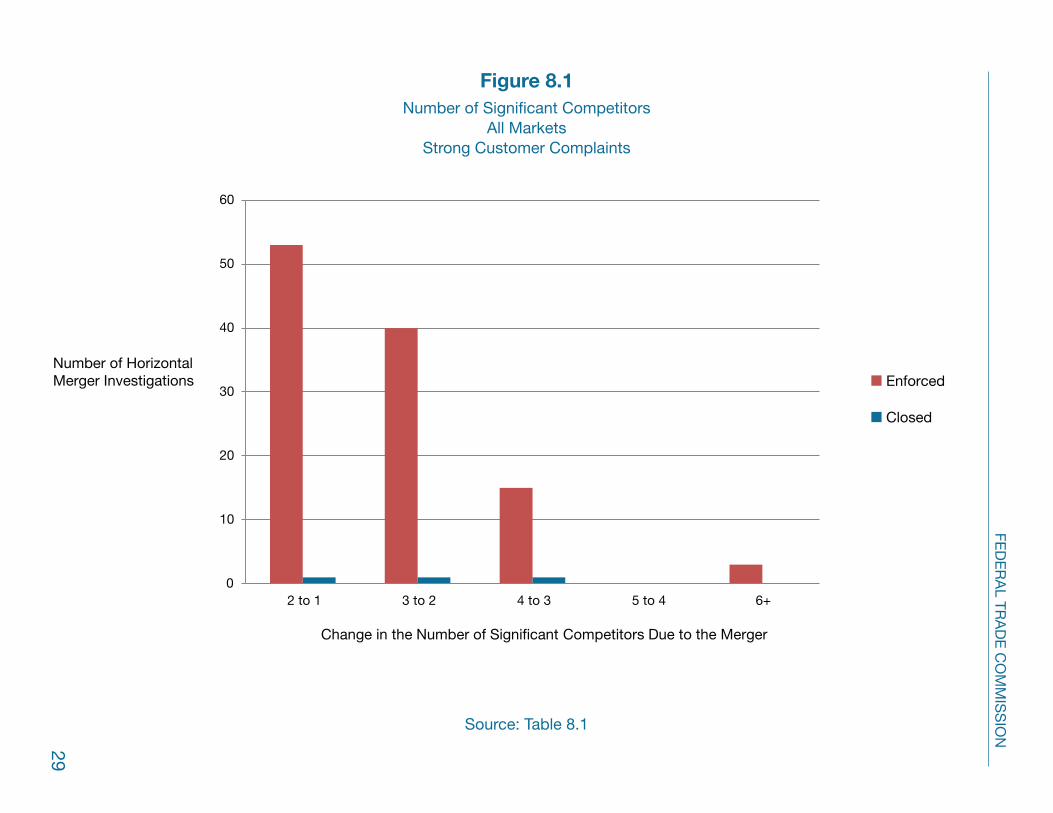
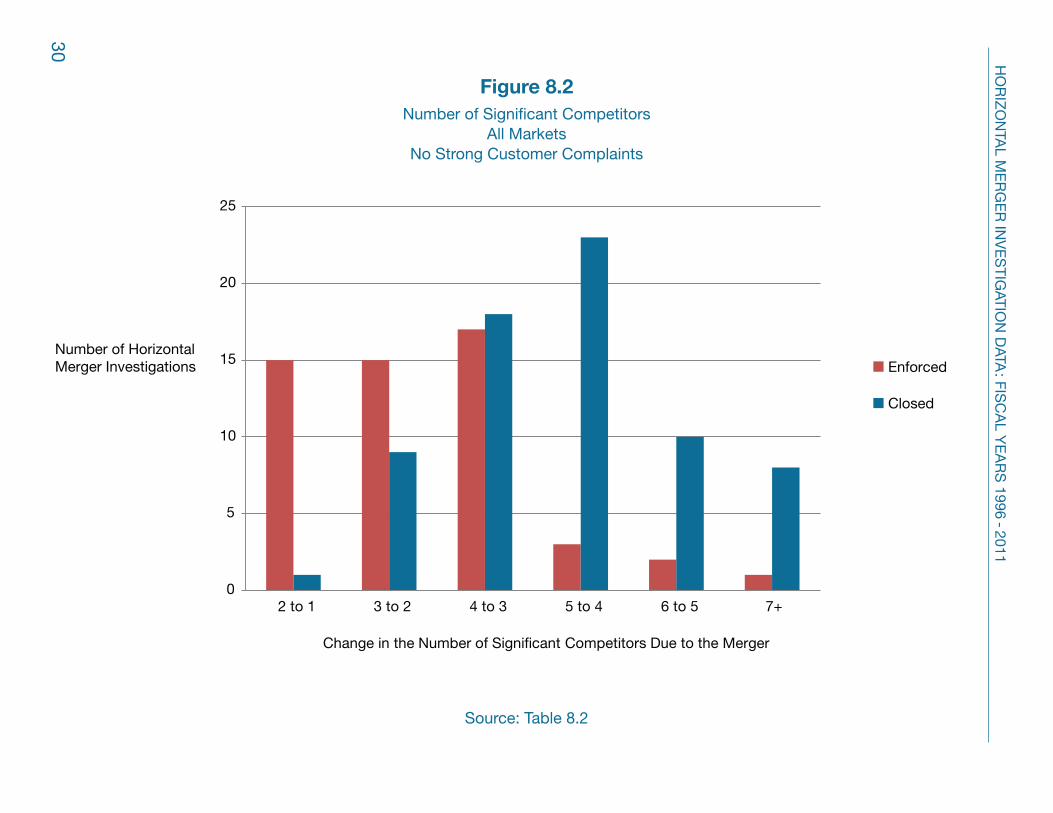
Data on whether or not there were “strong customer complaints” were collected for all transactions involving the investigation of three or fewer markets, provided that these markets were not purely retail.22 This subset consisted of 174 cases, involving 236 markets.23 Table 7.1 presents HHI and Delta information, together with the decision whether or not to seek relief, for cases where “strong customer complaints” were received. Table 7.2 presents the same information for cases where no “strong customer complaints” were received. Tables 8.1 and 8.2 are the corresponding tables reflecting the number of significant competitors, the Commission’s decision whether or not to seek relief, and whether any “strong customer complaints” were received, respectively. Figures 8.1 and 8.2 illustrate the challenge rate for various counts of significant rivals using data for matters with and without customer complaints.
ENTRY
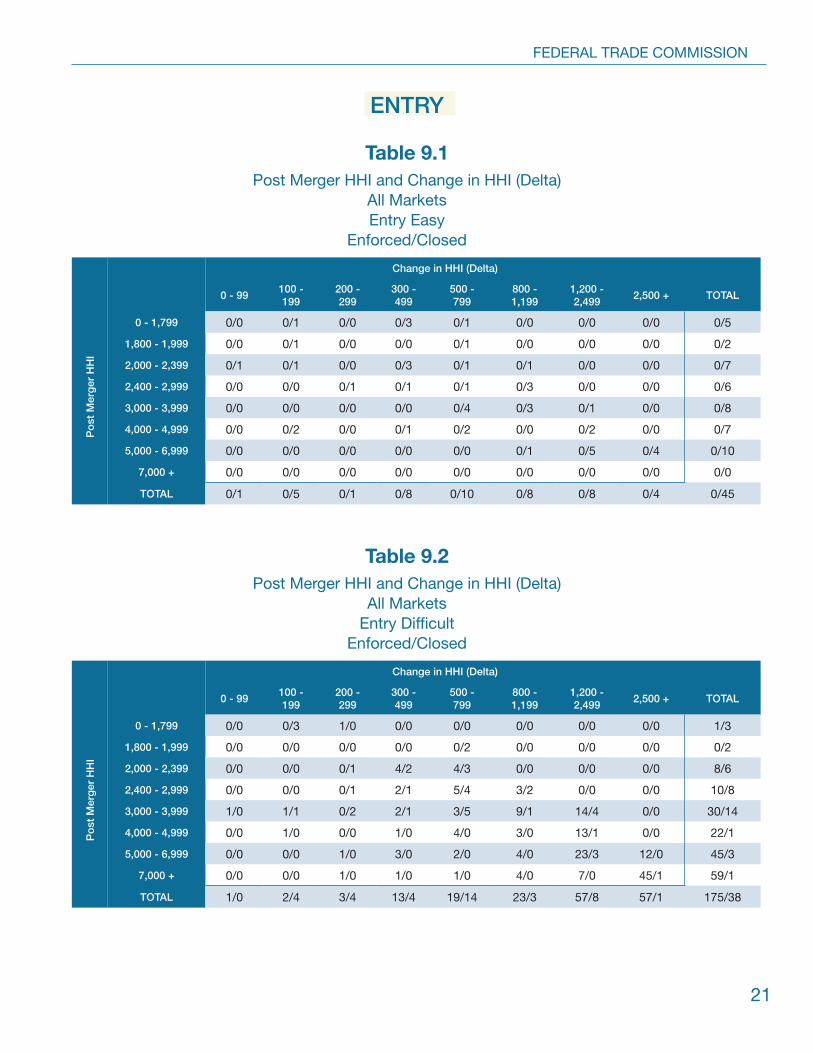
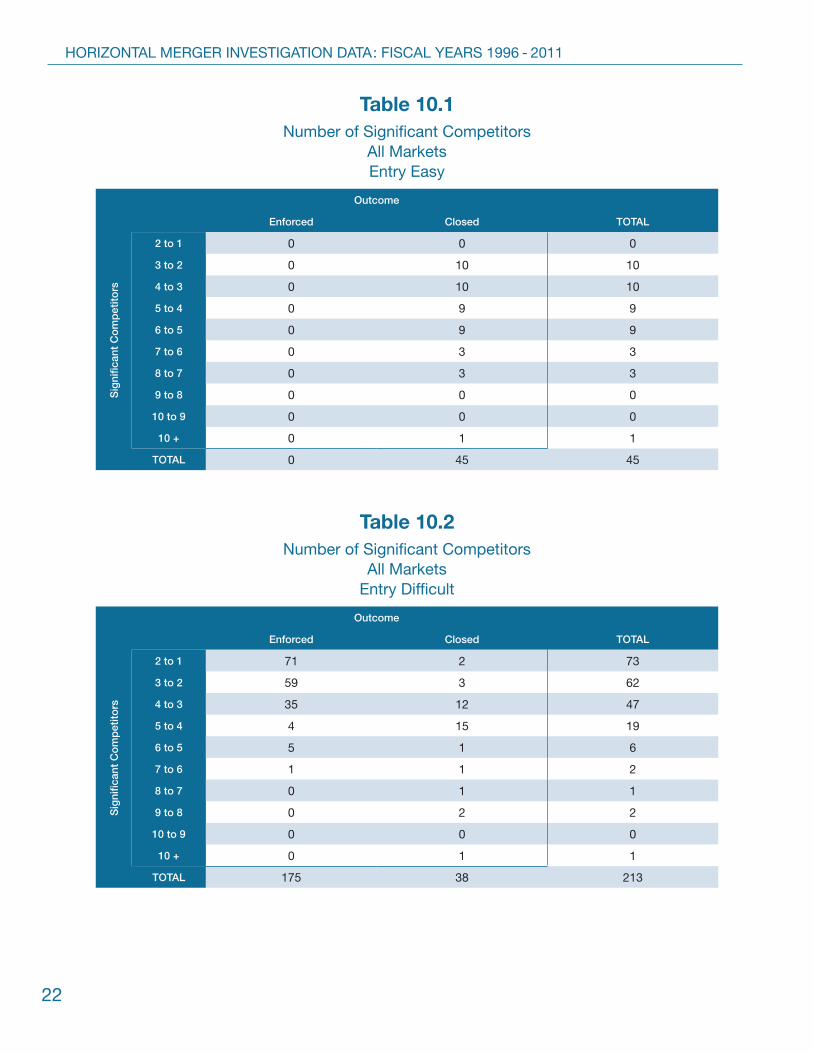
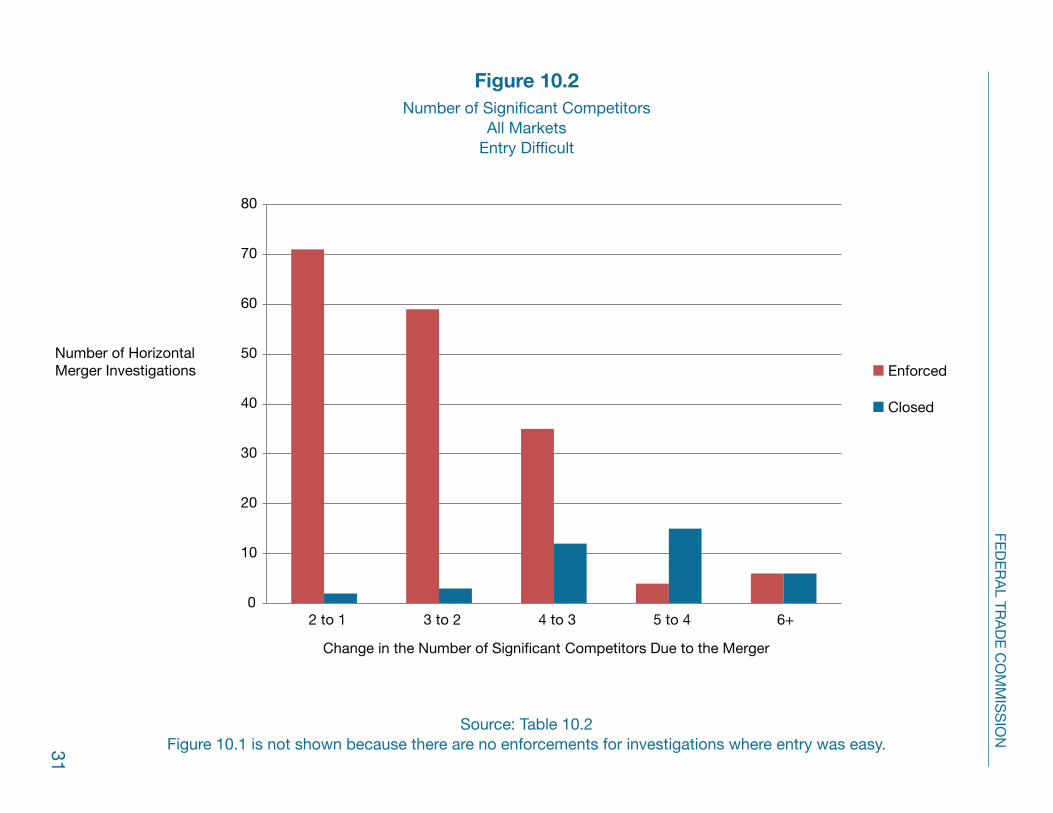
Tables 9.1 through 10.2 present the Commission’s decisions to seek relief based on the staff’s evaluation of entry conditions. Data on entry conditions were collected for all fully-investigated transactions involving three or fewer markets. This subset, which is the same as that for “hot documents,” consists of 186 cases involving 258 markets. Entry is defined as easy where the staff determined that entry meets the timeliness, likelihood, and sufficiency criteria discussed in the Horizontal Merger Guidelines. If entry does not meet any one of these criteria, then entry is determined to be difficult.24 Figure 10.2 defines the challenge rate for various numbers of
21. This variable is influenced, but not controlled, by information on customer neutrality toward or support for the transaction. Multiple customers are contacted during an investigation. To the extent that neutral or favorable feedback by some customers caused the staff to question the credibility of the concerns of other customers, the customer opinion variable has not been coded as “strong.” However, mere differences of opinion among customers generally are not sufficient to undermine a clear complaint.
22. These data do not include mergers involving a combination at the purely retail level of distribution, i.e., grocery stores, funeral homes, cable television providers, and casino operators. Retail mergers are not expected to produce strong customer complaints because customers typically are individual consumers. However, other retailing-related markets have been retained in the sample where a market intermediary existed to advance consumer interests. For example, in the acute-care hospital business, where health insurance providers effectively shop for hospital services on behalf of their individual enrollees, the opinions of insurers often are viewed as a reasonable proxy for consumer opinions.
23. The number of transactions in this subset represents 66% of the transactions reviewed.24. The Commission chooses not to challenge some transactions in which entry impediments are alleged to exist
due to the level of direct competition in the market, weak proof for market definition, problematic evidence on entry impediments, or any other condition that precludes the finding of a likely competitive concern.
6
HORIZONTAL MERGER INVESTIGATION DATA: FISCAL YEARS 1996 - 2011
significant rivals when entry is difficult. No chart is presented for table 10.1, because all the investigations with affirmative conclusions on ease of entry closed; no enforcement actions were taken.
7
FEDERAL TRADE COMMISSION
TABLES
The tables below present data for the fiscal year 1996 through 2011 time period.
Table 1HSR Second Requests During Fiscal Years 1996-2011
Categorized by Nature of Transaction and Theory of Potential Violation
Nature of Transaction Number of Second Requests
Horizontal Theory 264
Vertical Theory 28
Potential Competition Theory 22
Buyer Power (Monopsony) Theory 9
Joint Venture 3
Miscellaneous 5
Filing Withdrawn by Parties During the Investigation 86
Closed after a Quick Look 46
Investigations Still Open as of September 30, 2012 1
Total 464
Table 2FTC Horizontal Merger Investigations During Fiscal Years 1996-2011
Categorized by Number of Relevant Markets
Number of Relevant Markets in the Investigation
Number of Mergers Total Relevant Markets
1 130 130
2 - 4 82 229
5 - 15 32 235
16 - 50 14 356
50 + 6 422
Total 264 1,372
8
HORIZONTAL MERGER INVESTIGATION DATA: FISCAL YEARS 1996 - 2011
POST MERGER HHI & CHANGE IN HHI
Table 3.1Post Merger HHI and Change in HHI (Delta)
All MarketsEnforced/Closed
Change in HHI (Delta)
0 - 99100 - 199
200 - 299
300 - 499
500 - 799
800 - 1,199
1,200 - 2,499
2,500 + TOTAL
Po
st M
erg
er H
HI
0 - 1,799 0/14 17/31 19/20 17/11 3/7 0/1 0/0 0/0 56/84
1,800 - 1,999 0/4 5/4 5/6 12/4 12/5 0/0 0/0 0/0 34/23
2,000 - 2,399 1/2 1/6 7/8 25/19 32/12 2/2 0/0 0/0 68/49
2,400 - 2,999 1/2 4/2 6/5 18/6 44/14 26/10 0/0 0/0 99/39
3,000 - 3,999 1/3 3/2 5/2 9/5 25/14 71/21 39/14 0/0 153/61
4,000 - 4,999 0/0 2/2 1/1 5/1 10/4 18/4 68/3 0/0 104/15
5,000 - 6,999 1/0 6/0 8/2 8/1 19/0 21/2 145/20 47/5 255/30
7,000 + 0/0 0/0 1/0 1/0 3/0 9/0 26/1 246/2 286/3
TOTAL 4/25 38/47 52/44 95/47 148/56 147/40 278/38 293/7 1,055/304
Table 3.2Post Merger HHI and Change in HHI (Delta)
Grocery MarketsEnforced/Closed
Change in HHI (Delta)
0 - 99100 - 199
200 - 299
300 - 499
500 - 799
800 - 1,199
1,200 - 2,499
2,500 + TOTAL
Po
st M
erg
er H
HI
0 - 1,799 0/0 0/0 0/0 0/0 0/0 0/0 0/0 0/0 0/0
1,800 - 1,999 0/0 0/1 0/0 0/0 0/0 0/0 0/0 0/0 0/1
2,000 - 2,399 0/0 0/3 1/2 6/2 5/0 0/0 0/0 0/0 12/7
2,400 - 2,999 1/1 3/0 3/0 5/3 14/1 6/0 0/0 0/0 32/5
3,000 - 3,999 0/2 1/1 1/0 2/0 9/3 13/1 9/0 0/0 35/7
4,000 - 4,999 0/0 0/0 0/0 1/0 2/0 1/0 21/1 0/0 25/1
5,000 - 6,999 0/0 0/0 0/0 0/0 0/0 0/1 11/1 7/1 18/3
7,000 + 0/0 0/0 0/0 0/0 0/0 0/0 1/0 29/0 30/0
TOTAL 1/3 4/5 5/2 14/5 30/4 20/2 42/2 36/1 152/24
9
FEDERAL TRADE COMMISSION
Table 3.3Post Merger HHI and Change in HHI (Delta)
Oil MarketsEnforced/Closed
Change in HHI (Delta)
0 - 99100 - 199
200 - 299
300 - 499
500 - 799
800 - 1,199
1,200 - 2,499
2,500 + TOTAL
Po
st M
erg
er H
HI
0 - 1,799 0/14 17/17 19/6 17/3 3/1 0/0 0/0 0/0 56/41
1,800 - 1,999 0/4 5/2 5/3 12/1 12/0 0/0 0/0 0/0 34/10
2,000 - 2,399 1/1 0/3 5/1 18/3 23/4 1/0 0/0 0/0 48/12
2,400 - 2,999 0/0 1/0 0/0 4/0 13/3 12/2 0/0 0/0 30/5
3,000 - 3,999 0/0 1/0 1/0 1/0 3/0 11/1 4/0 0/0 21/1
4,000 - 4,999 0/0 0/0 1/0 0/0 0/0 0/0 1/0 0/0 2/0
5,000 - 6,999 0/0 0/0 2/0 0/0 1/0 0/0 6/0 2/0 11/0
7,000 + 0/0 0/0 0/0 0/0 1/0 2/0 1/0 8/0 12/0
TOTAL 1/19 24/22 33/10 52/7 56/8 26/3 12/0 10/0 214/69
Table 3.4Post Merger HHI and Change in HHI (Delta)
Chemical MarketsEnforced/Closed
Change in HHI (Delta)
0 - 99100 - 199
200 - 299
300 - 499
500 - 799
800 - 1,199
1,200 - 2,499
2,500 + TOTAL
Po
st M
erg
er H
HI
0 - 1,799 0/0 0/0 0/0 0/1 0/0 0/0 0/0 0/0 0/1
1,800 - 1,999 0/0 0/0 0/2 0/0 0/0 0/0 0/0 0/0 0/2
2,000 - 2,399 0/0 1/0 1/0 0/0 1/0 0/0 0/0 0/0 3/0
2,400 - 2,999 0/0 0/1 3/1 8/0 7/3 2/0 0/0 0/0 20/5
3,000 - 3,999 0/0 0/0 1/0 2/0 0/2 4/1 7/0 0/0 14/3
4,000 - 4,999 0/0 0/1 0/0 0/0 2/0 4/0 6/0 0/0 12/1
5,000 - 6,999 0/0 0/0 0/1 0/0 0/0 1/0 3/0 6/0 10/1
7,000 + 0/0 0/0 0/0 0/0 1/0 0/0 4/0 26/0 31/0
TOTAL 0/0 1/2 5/4 10/1 11/5 11/1 20/0 32/0 90/13
10
HORIZONTAL MERGER INVESTIGATION DATA: FISCAL YEARS 1996 - 2011
Table 3.5Post Merger HHI and Change in HHI (Delta)
Pharmaceuticals MarketsEnforced/Closed
Change in HHI (Delta)
0 - 99100 - 199
200 - 299
300 - 499
500 - 799
800 - 1,199
1,200 - 2,499
2,500 + TOTAL
Po
st M
erg
er H
HI
0 - 1,799 0/0 0/0 0/0 0/0 0/0 0/0 0/0 0/0 0/0
1,800 - 1,999 0/0 0/0 0/0 0/0 0/0 0/0 0/0 0/0 0/0
2,000 - 2,399 0/0 0/0 0/0 1/0 0/0 1/0 0/0 0/0 2/0
2,400 - 2,999 0/0 0/0 0/0 0/1 1/0 0/0 0/0 0/0 1/1
3,000 - 3,999 1/0 1/1 1/0 2/1 6/0 6/0 5/0 0/0 22/2
4,000 - 4,999 0/0 1/0 0/0 1/0 3/0 4/0 8/0 0/0 17/0
5,000 - 6,999 1/0 4/0 3/0 3/0 5/0 2/0 15/0 6/0 39/0
7,000 + 0/0 0/0 1/0 1/0 0/0 1/0 7/0 28/0 38/0
TOTAL 2/0 6/1 5/0 8/2 15/0 14/0 35/0 34/0 119/3
Table 3.6Post Merger HHI and Change in HHI (Delta)
Hospital MarketsEnforced/Closed
Change in HHI (Delta)
0 - 99100 - 199
200 - 299
300 - 499
500 - 799
800 - 1,199
1,200 - 2,499
2,500 + TOTAL
Po
st M
erg
er H
HI
0 - 1,799 0/0 0/2 0/0 0/0 0/0 0/0 0/0 0/0 0/2
1,800 - 1,999 0/0 0/0 0/0 0/0 0/0 0/0 0/0 0/0 0/0
2,000 - 2,399 0/0 0/0 0/0 0/0 0/2 0/0 0/0 0/0 0/2
2,400 - 2,999 0/0 0/0 0/0 0/0 0/0 0/1 0/0 0/0 0/1
3,000 - 3,999 0/0 0/0 0/0 0/0 0/2 0/1 3/2 0/0 3/5
4,000 - 4,999 0/0 0/0 0/0 0/0 0/1 0/0 1/0 0/0 1/1
5,000 - 6,999 0/0 0/0 0/0 0/0 0/0 1/0 2/0 1/0 4/0
7,000 + 0/0 0/0 0/0 0/0 0/0 0/0 0/0 0/1 0/1
TOTAL 0/0 0/2 0/0 0/0 0/5 1/2 6/2 1/1 8/12

11
FEDERAL TRADE COMMISSION
Table 3.7Post Merger HHI and Change in HHI (Delta)
Electronically-Controlled Devices and Systems MarketsEnforced/Closed
Change in HHI (Delta)
0 - 99100 - 199
200 - 299
300 - 499
500 - 799
800 - 1,199
1,200 - 2,499
2,500 + TOTAL
Po
st M
erg
er H
HI
0 - 1,799 0/0 0/0 0/1 0/0 0/1 0/0 0/0 0/0 0/2
1,800 - 1,999 0/0 0/0 0/0 0/0 0/0 0/0 0/0 0/0 0/0
2,000 - 2,399 0/0 0/0 0/0 0/1 0/1 0/0 0/0 0/0 0/2
2,400 - 2,999 0/0 0/0 0/1 0/0 0/0 0/0 0/0 0/0 0/1
3,000 - 3,999 0/0 0/0 0/0 0/0 1/1 1/0 0/0 0/0 2/1
4,000 - 4,999 0/0 0/1 0/0 0/0 0/0 0/0 3/1 0/0 3/2
5,000 - 6,999 0/0 0/0 0/0 0/0 0/0 1/0 1/2 3/0 5/2
7,000 + 0/0 0/0 0/0 0/0 0/0 0/0 0/0 5/0 5/0
TOTAL 0/0 0/1 0/2 0/1 1/3 2/0 4/3 8/0 15/10
Table 3.8Post Merger HHI and Change in HHI (Delta)
Branded Consumer Goods MarketsEnforced/Closed
Change in HHI (Delta)
0 - 99100 - 199
200 - 299
300 - 499
500 - 799
800 - 1,199
1,200 - 2,499
2,500 + TOTAL
Po
st M
erg
er H
HI
0 - 1,799 0/0 0/0 0/0 0/0 0/0 0/0 0/0 0/0 0/0
1,800 - 1,999 0/0 0/0 0/0 0/0 0/0 0/0 0/0 0/0 0/0
2,000 - 2,399 0/0 0/0 0/1 0/3 0/0 0/0 0/0 0/0 0/4
2,400 - 2,999 0/0 0/0 0/2 0/0 2/4 0/0 0/0 0/0 2/6
3,000 - 3,999 0/0 0/0 0/0 0/0 0/1 0/2 1/4 0/0 1/7
4,000 - 4,999 0/0 0/0 0/0 0/1 1/1 1/0 1/0 0/0 3/2
5,000 - 6,999 0/0 0/0 0/0 1/0 0/0 0/0 5/0 3/0 9/0
7,000 + 0/0 0/0 0/0 0/0 0/0 3/0 1/0 2/0 6/0
TOTAL 0/0 0/0 0/3 1/4 3/6 4/2 8/4 5/0 21/19
12
HORIZONTAL MERGER INVESTIGATION DATA: FISCAL YEARS 1996 - 2011
Table 3.9Post Merger HHI and Change in HHI (Delta)
“Other” MarketsEnforced/Closed
Change in HHI (Delta)
0 - 99100 - 199
200 - 299
300 - 499
500 - 799
800 - 1,199
1,200 - 2,499
2,500 + TOTAL
Po
st M
erg
er H
HI
0 - 1,799 0/0 0/12 0/13 0/7 0/5 0/1 0/0 0/0 0/38
1,800 - 1,999 0/0 0/1 0/1 0/3 0/5 0/0 0/0 0/0 0/10
2,000 - 2,399 0/1 0/0 0/4 0/10 3/5 0/2 0/0 0/0 3/22
2,400 - 2,999 0/1 0/1 0/1 1/2 7/3 6/7 0/0 0/0 14/15
3,000 - 3,999 0/1 0/0 1/2 2/4 6/5 36/15 10/8 0/0 55/35
4,000 - 4,999 0/0 1/0 0/1 3/0 2/2 8/4 27/1 0/0 41/8
5,000 - 6,999 0/0 2/0 3/1 4/1 13/0 16/1 102/17 19/4 159/24
7,000 + 0/0 0/0 0/0 0/0 1/0 3/0 12/1 148/1 164/2
TOTAL 0/3 3/14 4/23 10/27 32/25 69/30 151/27 167/5 436/154
SIGNIFICANT COMPETITORS
Table 4.1Number of Significant Competitors
All Markets
Outcome
Enforced Closed TOTAL
Sig
nific
ant
Co
mp
etito
rs
2 to 1 297 6 303
3 to 2 331 40 371
4 to 3 174 51 225
5 to 4 66 37 103
6 to 5 19 35 54
7 to 6 3 22 25
8 to 7 6 19 25
9 to 8 0 11 11
10 to 9 2 4 6
10 + 0 20 20
TOTAL 898 245 1,143

13
FEDERAL TRADE COMMISSION
Table 4.2Number of Significant Competitors
Grocery Markets
Outcome
Enforced Closed TOTAL
Sig
nific
ant
Co
mp
etito
rs
2 to 1 35 0 35
3 to 2 41 5 46
4 to 3 56 11 67
5 to 4 16 4 20
6 to 5 3 2 5
7 to 6 1 1 2
8 to 7 0 1 1
9 to 8 0 0 0
10 to 9 0 0 0
10 + 0 0 0
TOTAL 152 24 176
Table 4.3Number of Significant Competitors
Oil Markets
Outcome
Enforced Closed TOTAL
Sig
nific
ant
Co
mp
etito
rs
2 to 1 13 0 13
3 to 2 13 0 13
4 to 3 6 0 6
5 to 4 8 3 11
6 to 5 9 9 18
7 to 6 2 6 8
8 to 7 6 1 7
9 to 8 0 2 2
10 to 9 2 0 2
10 + 0 6 6
TOTAL 59 27 86
14
HORIZONTAL MERGER INVESTIGATION DATA: FISCAL YEARS 1996 - 2011
Table 4.4Number of Significant Competitors
Chemical Markets
Outcome
Enforced Closed TOTAL
Sig
nific
ant
Co
mp
etito
rs
2 to 1 35 0 35
3 to 2 19 0 19
4 to 3 18 4 22
5 to 4 15 4 19
6 to 5 3 4 7
7 to 6 0 0 0
8 to 7 0 1 1
9 to 8 0 0 0
10 to 9 0 0 0
10 + 0 0 0
TOTAL 90 13 103
Table 4.5Number of Significant Competitors
Pharmaceuticals Markets
Outcome
Enforced Closed TOTAL
Sig
nific
ant
Co
mp
etito
rs
2 to 1 37 0 37
3 to 2 48 1 49
4 to 3 29 0 29
5 to 4 5 1 6
6 to 5 0 1 1
7 to 6 0 0 0
8 to 7 0 0 0
9 to 8 0 0 0
10 to 9 0 0 0
10 + 0 0 0
TOTAL 119 3 122
15
FEDERAL TRADE COMMISSION
Table 4.6Number of Significant Competitors
Hospital Markets
Outcome
Enforced Closed TOTAL
Sig
nific
ant
Co
mp
etito
rs
2 to 1 4 1 5
3 to 2 3 1 4
4 to 3 1 2 3
5 to 4 0 4 4
6 to 5 0 0 0
7 to 6 0 0 0
8 to 7 0 2 2
9 to 8 0 1 1
10 to 9 0 0 0
10 + 0 1 1
TOTAL 8 12 20
Table 4.7Number of Significant Competitors
Electronically-Controlled Devices and Systems Markets
Outcome
Enforced Closed TOTAL
Sig
nific
ant
Co
mp
etito
rs
2 to 1 9 0 9
3 to 2 3 0 3
4 to 3 3 6 9
5 to 4 0 2 2
6 to 5 0 2 2
7 to 6 0 0 0
8 to 7 0 0 0
9 to 8 0 1 1
10 to 9 0 0 0
10 + 0 0 0
TOTAL 15 11 26
16
HORIZONTAL MERGER INVESTIGATION DATA: FISCAL YEARS 1996 - 2011
Table 4.8Number of Significant CompetitorsBranded Consumer Goods Markets
Outcome
Enforced Closed TOTAL
Sig
nific
ant
Co
mp
etito
rs
2 to 1 9 2 11
3 to 2 12 8 20
4 to 3 0 4 4
5 to 4 0 2 2
6 to 5 0 3 3
7 to 6 0 0 0
8 to 7 0 0 0
9 to 8 0 0 0
10 to 9 0 0 0
10 + 0 0 0
TOTAL 21 19 40
Table 4.9Number of Significant Competitors
“Other” Markets
Outcome
Enforced Closed TOTAL
Sig
nific
ant
Co
mp
etito
rs
2 to 1 155 3 158
3 to 2 192 25 217
4 to 3 61 24 85
5 to 4 22 17 39
6 to 5 4 14 18
7 to 6 0 15 15
8 to 7 0 14 14
9 to 8 0 7 7
10 to 9 0 4 4
10 + 0 13 13
TOTAL 434 136 570

17
FEDERAL TRADE COMMISSION
HOT DOCUMENTS
Table 5.1Post Merger HHI and Change in HHI (Delta)
All MarketsHot Documents Identified
Enforced/Closed
Change in HHI (Delta)
0 - 99100 - 199
200 - 299
300 - 499
500 - 799
800 - 1,199
1,200 - 2,499
2,500 + TOTAL
Po
st M
erg
er H
HI
0 - 1,799 0/0 0/0 0/0 0/0 0/0 0/0 0/0 0/0 0/0
1,800 - 1,999 0/0 0/0 0/0 0/0 0/1 0/0 0/0 0/0 0/1
2,000 - 2,399 0/0 0/0 0/0 0/0 0/0 0/0 0/0 0/0 0/0
2,400 - 2,999 0/0 0/0 0/0 2/0 1/0 0/0 0/0 0/0 3/0
3,000 - 3,999 0/0 0/0 0/0 0/0 1/1 1/0 2/0 0/0 4/1
4,000 - 4,999 0/0 0/0 0/0 0/0 1/0 1/0 0/0 0/0 2/0
5,000 - 6,999 0/0 0/0 0/0 1/0 0/0 0/1 5/0 1/0 7/1
7,000 + 0/0 0/0 0/0 0/0 0/0 0/0 1/0 8/0 9/0
TOTAL 0/0 0/0 0/0 3/0 3/2 2/1 8/0 9/0 25/3
Table 5.2Post Merger HHI and Change in HHI (Delta)
All MarketsNo Hot Documents Identified
Enforced/Closed
Change in HHI (Delta)
0 - 99100 - 199
200 - 299
300 - 499
500 - 799
800 - 1,199
1,200 - 2,499
2,500 + TOTAL
Po
st M
erg
er H
HI
0 - 1,799 0/0 0/4 1/0 0/3 0/1 0/0 0/0 0/0 1/8
1,800 - 1,999 0/0 0/1 0/0 0/0 0/2 0/0 0/0 0/0 0/3
2,000 - 2,399 0/1 0/1 0/1 4/5 4/4 0/1 0/0 0/0 8/13
2,400 - 2,999 0/0 0/0 0/2 0/2 4/5 3/5 0/0 0/0 7/14
3,000 - 3,999 1/0 1/1 0/2 2/1 2/8 8/4 12/5 0/0 26/21
4,000 - 4,999 0/0 1/2 0/0 1/1 3/2 2/0 13/3 0/0 20/8
5,000 - 6,999 0/0 0/0 1/0 2/0 2/0 4/0 18/8 11/4 38/12
7,000 + 0/0 0/0 1/0 1/0 1/0 4/0 6/0 37/1 50/1
TOTAL 1/1 2/9 3/5 10/12 16/22 21/10 49/16 48/5 150/80
18
HORIZONTAL MERGER INVESTIGATION DATA: FISCAL YEARS 1996 - 2011
Table 6.1Number of Significant Competitors
All MarketsHot Documents Identified
Outcome
Enforced Closed TOTAL
Sig
nific
ant
Co
mp
etito
rs
2 to 1 10 0 10
3 to 2 6 1 7
4 to 3 8 2 10
5 to 4 0 0 0
6 to 5 1 0 1
7 to 6 0 0 0
8 to 7 0 0 0
9 to 8 0 0 0
10 to 9 0 0 0
10 + 0 0 0
TOTAL 25 3 28
Table 6.2Number of Significant Competitors
All MarketsNo Hot Documents Identified
Outcome
Enforced Closed TOTAL
Sig
nific
ant
Co
mp
etito
rs
2 to 1 61 2 63
3 to 2 53 12 65
4 to 3 27 20 47
5 to 4 4 24 28
6 to 5 4 10 14
7 to 6 1 4 5
8 to 7 0 4 4
9 to 8 0 2 2
10 to 9 0 0 0
10 + 0 2 2
TOTAL 150 80 230

19
FEDERAL TRADE COMMISSION
CUSTOMER COMPLAINTS
Table 7.1Post Merger HHI and Change in HHI (Delta)
All MarketsStrong Customer Complaints
Enforced/Closed
Change in HHI (Delta)
0 - 99100 - 199
200 - 299
300 - 499
500 - 799
800 - 1,199
1,200 - 2,499
2,500 + TOTAL
Po
st M
erg
er H
HI
0 - 1,799 0/0 0/0 0/0 0/0 0/0 0/0 0/0 0/0 0/0
1,800 - 1,999 0/0 0/0 0/0 0/0 0/0 0/0 0/0 0/0 0/0
2,000 - 2,399 0/0 0/0 0/0 0/0 3/1 0/0 0/0 0/0 3/1
2,400 - 2,999 0/0 0/0 0/0 2/0 1/0 1/0 0/0 0/0 4/0
3,000 - 3,999 0/0 0/0 0/0 0/0 3/1 5/0 11/0 0/0 19/1
4,000 - 4,999 0/0 0/0 0/0 0/0 3/0 0/0 6/0 0/0 9/0
5,000 - 6,999 0/0 0/0 1/0 1/0 2/0 2/0 16/1 9/0 31/1
7,000 + 0/0 0/0 0/0 0/0 0/0 3/0 7/0 35/0 45/0
TOTAL 0/0 0/0 1/0 3/0 12/2 11/0 40/1 44/0 111/3
Table 7.2Post Merger HHI and Change in HHI (Delta)
All MarketsNo Strong Customer Complaints
Enforced/Closed
Change in HHI (Delta)
0 - 99100 - 199
200 - 299
300 - 499
500 - 799
800 - 1,199
1,200 - 2,499
2,500 + TOTAL
Po
st M
erg
er H
HI
0 - 1,799 0/0 0/4 1/0 0/3 0/1 0/0 0/0 0/0 1/8
1,800 - 1,999 0/0 0/1 0/0 0/0 0/3 0/0 0/0 0/0 0/4
2,000 - 2,399 0/0 0/1 0/1 4/5 1/3 0/1 0/0 0/0 5/11
2,400 - 2,999 0/0 0/0 0/2 0/2 3/5 1/3 0/0 0/0 4/12
3,000 - 3,999 1/0 1/1 0/2 2/1 0/5 3/2 2/5 0/0 9/16
4,000 - 4,999 0/0 1/2 0/0 1/1 1/2 3/0 6/1 0/0 12/6
5,000 - 6,999 0/0 0/0 0/0 2/0 0/0 2/1 4/6 3/4 11/11
7,000 + 0/0 0/0 1/0 1/0 1/0 1/0 0/0 7/1 11/1
TOTAL 1/0 2/9 2/5 10/12 6/19 10/7 12/12 10/5 53/69

20
HORIZONTAL MERGER INVESTIGATION DATA: FISCAL YEARS 1996 - 2011
Table 8.1Number of Significant Competitors
All MarketsStrong Customer Complaints
Outcome
Enforced Closed TOTAL
Sig
nific
ant
Co
mp
etito
rs
2 to 1 53 1 54
3 to 2 40 1 41
4 to 3 15 1 16
5 to 4 0 0 0
6 to 5 3 0 3
7 to 6 0 0 0
8 to 7 0 0 0
9 to 8 0 0 0
10 to 9 0 0 0
10 + 0 0 0
TOTAL 111 3 114
Table 8.2Number of Significant Competitors
All MarketsNo Strong Customer Complaints
Outcome
Enforced Closed TOTAL
Sig
nific
ant
Co
mp
etito
rs
2 to 1 15 1 16
3 to 2 15 9 24
4 to 3 17 18 35
5 to 4 3 23 26
6 to 5 2 10 12
7 to 6 1 1 2
8 to 7 0 3 3
9 to 8 0 2 2
10 to 9 0 0 0
10 + 0 2 2
TOTAL 53 69 122
21
FEDERAL TRADE COMMISSION
ENTRY
Table 9.1Post Merger HHI and Change in HHI (Delta)
All MarketsEntry Easy
Enforced/Closed
Change in HHI (Delta)
0 - 99100 - 199
200 - 299
300 - 499
500 - 799
800 - 1,199
1,200 - 2,499
2,500 + TOTAL
Po
st M
erg
er H
HI
0 - 1,799 0/0 0/1 0/0 0/3 0/1 0/0 0/0 0/0 0/5
1,800 - 1,999 0/0 0/1 0/0 0/0 0/1 0/0 0/0 0/0 0/2
2,000 - 2,399 0/1 0/1 0/0 0/3 0/1 0/1 0/0 0/0 0/7
2,400 - 2,999 0/0 0/0 0/1 0/1 0/1 0/3 0/0 0/0 0/6
3,000 - 3,999 0/0 0/0 0/0 0/0 0/4 0/3 0/1 0/0 0/8
4,000 - 4,999 0/0 0/2 0/0 0/1 0/2 0/0 0/2 0/0 0/7
5,000 - 6,999 0/0 0/0 0/0 0/0 0/0 0/1 0/5 0/4 0/10
7,000 + 0/0 0/0 0/0 0/0 0/0 0/0 0/0 0/0 0/0
TOTAL 0/1 0/5 0/1 0/8 0/10 0/8 0/8 0/4 0/45
Table 9.2Post Merger HHI and Change in HHI (Delta)
All MarketsEntry Difficult
Enforced/Closed
Change in HHI (Delta)
0 - 99100 - 199
200 - 299
300 - 499
500 - 799
800 - 1,199
1,200 - 2,499
2,500 + TOTAL
Po
st M
erg
er H
HI
0 - 1,799 0/0 0/3 1/0 0/0 0/0 0/0 0/0 0/0 1/3
1,800 - 1,999 0/0 0/0 0/0 0/0 0/2 0/0 0/0 0/0 0/2
2,000 - 2,399 0/0 0/0 0/1 4/2 4/3 0/0 0/0 0/0 8/6
2,400 - 2,999 0/0 0/0 0/1 2/1 5/4 3/2 0/0 0/0 10/8
3,000 - 3,999 1/0 1/1 0/2 2/1 3/5 9/1 14/4 0/0 30/14
4,000 - 4,999 0/0 1/0 0/0 1/0 4/0 3/0 13/1 0/0 22/1
5,000 - 6,999 0/0 0/0 1/0 3/0 2/0 4/0 23/3 12/0 45/3
7,000 + 0/0 0/0 1/0 1/0 1/0 4/0 7/0 45/1 59/1
TOTAL 1/0 2/4 3/4 13/4 19/14 23/3 57/8 57/1 175/38
22
HORIZONTAL MERGER INVESTIGATION DATA: FISCAL YEARS 1996 - 2011
Table 10.1Number of Significant Competitors
All MarketsEntry Easy
Outcome
Enforced Closed TOTAL
Sig
nific
ant
Co
mp
etito
rs
2 to 1 0 0 0
3 to 2 0 10 10
4 to 3 0 10 10
5 to 4 0 9 9
6 to 5 0 9 9
7 to 6 0 3 3
8 to 7 0 3 3
9 to 8 0 0 0
10 to 9 0 0 0
10 + 0 1 1
TOTAL 0 45 45
Table 10.2Number of Significant Competitors
All MarketsEntry Difficult
Outcome
Enforced Closed TOTAL
Sig
nific
ant
Co
mp
etito
rs
2 to 1 71 2 73
3 to 2 59 3 62
4 to 3 35 12 47
5 to 4 4 15 19
6 to 5 5 1 6
7 to 6 1 1 2
8 to 7 0 1 1
9 to 8 0 2 2
10 to 9 0 0 0
10 + 0 1 1
TOTAL 175 38 213
23
FED
ER
AL TR
AD
E C
OM
MIS
SIO
N
0
10
20
30
40
50
60
70
80
90
100
Percent Enforced
0 - 1,799 1,800 - 1,999
2,000 - 2,399
2,400 - 2,999
3,000 - 3,999
4,000 - 4,999
5,000 - 6,999
7,000 +
0-199
200 - 299
300 - 499
500 - 799
800 - 1,199
1,200 - 2,499
2,500 +
Change in HHI (Delta)
FIGURES
The figures below present data for fiscal years 1996 through 2011.
Figure 3.1Post Merger HHI and Change in HHI (Delta)
All MarketsPercent Enforced
Source: Table 3 .1
Post-merger HHI
24
HO
RIZ
ON
TAL M
ER
GE
R IN
VE
STIG
ATION
DATA
: FISC
AL Y
EA
RS
1996-
2011
0
10
20
30
40
50
60
70
80
90
100
Percent Enforced
0 - 1,799 1,800 - 1,999
2,000 - 2,399
2,400 - 2,999
3,000 - 3,999
4,000 - 4,999
5,000 - 6,999
7,000 +
0-199
200 - 299
300 - 499
500 - 799
800 - 1,199
1,200 - 2,499
2,500 +
Change in HHI (Delta)
Source: Table 3 .1, excluding oil cases
Figure 3.1aPost Merger HHI and Change in HHI (Delta)
All Markets Except OilPercent Enforced
Post-merger HHI
25
FED
ER
AL TR
AD
E C
OM
MIS
SIO
NSource: Table 4 .1
Figure 4.1Number of Significant Competitors
All Markets
0
50
100
150
200
250
300
350
2 to 1 3 to 2 4 to 3 5 to 4 6 to 5 6+
Number of Horizontal Merger Investigations
Change in the Number of Signi�cant Competitors Due to the Merger
Enforced
Closed
26
HO
RIZ
ON
TAL M
ER
GE
R IN
VE
STIG
ATION
DATA
: FISC
AL Y
EA
RS
1996-
2011
Source: Table 4 .1, excluding oil cases
Figure 4.1aNumber of Significant Competitors
All Markets Except Oil
Number of Horizontal Merger Investigations
Change in the Number of Signi�cant Competitors Due to the Merger
Enforced
Closed
0
50
100
150
200
250
300
350
2 to 1 3 to 2 4 to 3 5 to 4 6 to 5 6+
27
FED
ER
AL TR
AD
E C
OM
MIS
SIO
N
Number of Horizontal Merger Investigations
Change in the Number of Signi�cant Competitors Due to the Merger
Enforced
Closed
0
2
4
6
8
10
12
2 to 1 3 to 2 3+
Source: Table 6 .1
Figure 6.1Number of Significant Competitors
All MarketsHot Documents Identified
28
HO
RIZ
ON
TAL M
ER
GE
R IN
VE
STIG
ATION
DATA
: FISC
AL Y
EA
RS
1996-
2011
Source: Table 6 .2
0
10
20
30
40
50
60
70
2 to 1 3 to 2 4 to 3 5 to 4 6 to 5 6+
Number of Horizontal Merger Investigations
Change in the Number of Signi�cant Competitors Due to the Merger
Enforced
Closed
Figure 6.2Number of Significant Competitors
All MarketsNo Hot Documents Identified
29
FED
ER
AL TR
AD
E C
OM
MIS
SIO
NSource: Table 8 .1
Figure 8.1Number of Significant Competitors
All MarketsStrong Customer Complaints
0
10
20
30
40
50
60
2 to 1 3 to 2 4 to 3 5 to 4 6+
Number of Horizontal Merger Investigations
Change in the Number of Signi�cant Competitors Due to the Merger
Enforced
Closed
30
HO
RIZ
ON
TAL M
ER
GE
R IN
VE
STIG
ATION
DATA
: FISC
AL Y
EA
RS
1996-
2011
Source: Table 8 .2
Number of Horizontal Merger Investigations
Change in the Number of Signi�cant Competitors Due to the Merger
Enforced
Closed
0
5
10
15
20
25
2 to 1 3 to 2 4 to 3 5 to 4 6 to 5 7+
Figure 8.2Number of Significant Competitors
All MarketsNo Strong Customer Complaints
31
FED
ER
AL TR
AD
E C
OM
MIS
SIO
NSource: Table 10 .2Figure 10 .1 is not shown because there are no enforcements for investigations where entry was easy .
Figure 10.2Number of Significant Competitors
All MarketsEntry Difficult
Number of Horizontal Merger Investigations
Change in the Number of Signi�cant Competitors Due to the Merger
Enforced
Closed
0
10
20
30
40
50
60
70
80
2 to 1 3 to 2 4 to 3 5 to 4 6+

Federal Trade Commission | January 2013