horizontal variation in trace elements and soil
TRANSCRIPT

694
http://dx.doi.org/10.4314/wsa.v42i4.20Available on website http://www.wrc.org.zaISSN 1816-7950 (Online) = Water SA Vol. 42 No. 4 October 2016Published under a Creative Commons Attribution Licence
Horizontal variation in trace elements and soil characteristics at Siloam and Tshipise geothermal springs,
Limpopo Province, South Africa
OS Durowoju1*, JO Odiyo1 and GE Ekosse2
1University of Venda, Department of Hydrology and Water Resources, P/Bag X5050, Thohoyandou 0950, South Africa 2University of Venda, Research and Innovation, P/Bag X5050, Thohoyandou 0950, South Africa
ABSTRACTThe Limpopo Province is the location of 31% of South Africa’s geothermal springs. The springs at Siloam and Tshipise are among those springs which fall into the ‘scalding category’ with average temperatures of 67.7°C and 54.6°C, respectively. The aim of this study was to determine the horizontal variation in trace element concentrations and soil indicators in surface soil associated with the geothermal springs at Siloam and Tshipise. Results show that, in general, the trace element concentrations present in the soil decrease with horizontal distance from the springs. Water and soil samples were collected from May to July 2014, with the soil sampled at 0–15 cm depth at 5 m intervals in the horizontal distance from the geothermal spring. The physicochemical parameters of the water were determined as well as the trace elements. The soil samples were digested using microwave digestion and trace elements were determined using an inductively coupled plasma-mass spectrometer (ICP-MS). Soil indicators – pH, soil organic matter (SOM) and soil water retention (SWR) – were also determined. The resulting data were subjected to both descriptive and factor analyses. Results showed only one factor determining the variation in geothermal water, attributed to the rock–water interaction in the deep aquifer (geology); two factors were obtained for variation in soil indicators and trace element concentrations, attributed to spring geology and the soil pedogenesis. There was a strong correlation between the trace elements and soil indicators at the 95% confidence level. There is generally a positive correlation between the trace elements and soil indicators if the soil pH, SOM and SWR are high; in these instances most of the trace elements in the soil will also be relatively high. A two-factors-without-replication ANOVA (p ˂ 0.05) showed that there is a significant difference in trace element concentrations at different distances.
Keywords: geothermal springs, trace metals, soil indicators, rock-water interactions, soil pedogenesis
INTRODUCTION
Siloam and Tshipise springs are scalding geothermal springs geo-logically located within the Soutpansberg Group in the Limpopo Province of South Africa. These geothermal springs are associ-ated with faults and impermeable dykes and are assumed to be of meteoric origin (Kent, 1949; Olivier et al., 2008). The optimal uses of a geothermal spring are largely dependent upon its physi-cal and chemical properties as well as the geological formation found at the depth of origin. People have used geothermal spring waters for various purposes for thousands of years. Geothermal springs have been used for bathing and for medicinal, religious, hygienic and social purposes in India, Brazil, Crete, Egypt, Ethiopia, Turkey, Japan and South Africa (Van Vuuren, 1990; Lund, 2000). At Siloam and Tshipise, the spring water is used for various domestic purposes, as a source of water for the swimming pool, and irrigation for subsistence farming, with no clear understanding of the potential health effects from mineral elements (Durowoju et al., 2015). Given the use for irrigation, it is important to establish whether the geothermal spring water contaminates the soil with trace elements. Land use in the area is predominantly rural settlement with subsistence farming, grass-land and cultivated commercial annual crop/orchards.
The determination of total extractable trace element concen-trations has frequently been used to appraise the environmental level or background concentration of these elements in soil and
water (Burt et al., 2003). Geothermal springs (also known as mineral springs) may show higher solute concentrations than non-geothermal springs owing to greater chemical dissolution of the rock as a result of the higher temperatures. Odiyo and Makungo (2012) reported that geochemical dissolution of the host rock increases with temperature. Kent (1949) and Olivier et al. (2008) reported from their findings that South African geothermal springs of meteoric origin, (that is, the underground water is heated as a result of a geothermal gradient of 2–3°C per 100 m increased depth below ground surface) results in greater mineralization of the water (Press and Siever, 1986). Assessment of the fate of trace elements, their bioavailability and their trans-port in surface water and groundwater, is required in order to predict potential contamination and possible impacts on soil and water quality (Burt et al., 2003).
Soils are important receptacles for trace elements and natu-rally contain certain levels of these elements. The presence of trace elements in soil is, however, not indicative of contamina-tion, but is primarily due to the geology of the parent material that forms the soil. Where geothermal spring water flows across the soil under natural inundation processes or through land-use activities such as irrigation, there is a possibility that higher concentrations of dissolved chemicals may accumulate in the soil through deposition and evaporation, as well as through adsorption onto the soil matrix. Some metals, such as chromium (Cr), arsenic (As), selenium (Se) and mercury (Hg), can be transformed to other oxidation states in soil, which may affect their mobility and toxicity (USEPA, 1992). Soil characteristics like organic matter, type and nature of the soil, water retention capacity and pH have a great influence on the quantity of trace
* To whom all correspondence should be addressed.e-mail: [email protected] 25 March 2015; accepted in revised form 5 October 2016

http://dx.doi.org/10.4314/wsa.v42i4.20Available on website http://www.wrc.org.zaISSN 1816-7950 (Online) = Water SA Vol. 42 No. 4 October 2016Published under a Creative Commons Attribution Licence 695
elements available for mobilisation and sorption in soil (Slagle et al., 2004).
Trace element–soil interactions occur mostly at the soil surface; downward migration does not occur to any great extent unless the element retention capacity of the soil is overloaded or the element’s interaction with the associated soil matrix enhances mobility (USEPA, 1992). Vertical contamination is largely dependent on the soil solution and surface chemistry of the soil matrix in relation to the element and soil matrix in question. High elemental retention capacity leads to absorption of the trace elements when the soil reaches saturation with regard to a particular element. For instance, Siloam and Tshipise have clay soils which are highly structured with high permeability. This could possibly result in cracks that become preferential flowpaths for rapidly moving water with dissolved minerals, regardless of the retention capacity of the soil. This study aimed to quantify the concentrations of trace elements within the upper layer of soil adjacent to the geothermal springs. This study is focused on the horizontal variation in trace element concentrations within the soil adjacent to geothermal springs at Siloam and Tshipise. The trace element concentrations were investigated at 5 m inter-vals for a horizontal distance of 20 m from the spring. Soil char-acteristics such as soil organic matter (SOM), soil pH, soil-water retention (SWR) and soil texture were also analysed. Hence, the correlation between the soil characteristics and the trace element concentrations could be assessed.
STUDY AREA
Siloam and Tshipise geothermal springs are located in the Limpopo Province of South Africa and have different surface geology but both fall within the Soutpansberg Group. Siloam village is located on the youngest formation of the Soutpansberg Group, which is the Sibasa Formation. It is dominated by basalt, which originated from the lava at the base of the formation. It is responsible for the more undulating topography to the south of the Soutpansberg range (Brandl, 1981). The geology is characterised by dark-red shale and fine, thinly-bedded sand-stones together with an interlayer of tuff, ignimbrite and chert and in places tuffaceous shale (Mundalamo, 2003). The Siloam Fault line was formed after the formation of the Soutpansberg Mountain Range some 1.7 billion years ago. It stretches from the west of Thohoyandou through the mountain to the south of Venetia Mine (which is approximately 3 km deep). Tshipise is located close to the confluence of two faults: the Tshipise Fault and the Bosbokpoort Fault (Brandl, 1981), which occurs within the Letaba Formation. The Letaba Formation immediately underlying the spring at Tshipise comprises mainly basalt. The spring also lies close to a dolerite intrusion, and to the contact between the Lebata Formation and the Gumbu Group of the Beit Bridge Complex which underlies the spring at Moreson. The Gumbu Group comprises mainly calc-silicate rock and marble (Brandl, 1981).
Siloam and Tshipise geothermal springs are located at 22° 52’ 58.800” S, 30° 10’ 59.988” E and 22° 36’ 31.320” S, 30° 10’ 20.712” E, respectively (Fig. 1). The map in Fig. 1 shows the land-use in the study areas to be rural settlements with subsistence farming. Siloam and Tshipise springs are approximately 60 km apart and the Soutpansberg Mountain Range separates the two springs. The Siloam spring is found in Nzhelele Valley and Tshipise spring is found on the leeward side of Soutpansberg Mountain Range. Major land uses include informal and formal settlements, subsistence and commercial agriculture, grassland and open bush (Fig. 1). This region is characterised by a warm wet season
associated with high temperatures (up to 40°C) from October to March, with peak precipitation in January and February. The cool dry season has a temperature range between 12°C and 22°C and extends from April to September (Kabanda, 2003).
MATERIALS AND METHODS
Sampling
Geothermal spring water was collected with the aid of a pre-washed white plastic cup into 1 L plastic containers on a monthly basis from May to July 2014 at Siloam and Tshipise (Yahaya et al., 2009). The collected samples were transported and stored (in a refrigerator) at 4°C until sample testing time. The water sample was split into two: 2 mL concentrated nitric acid was added to each sample for trace elements assay and samples for ionic deter-mination were left in the refrigerator awaiting analysis.
A multi-increment sampling procedure adopted by Walsh (2005) was followed to avoid sampling errors due to composi-tional and distributional heterogeneity within a known param-eter. Soil samples were taken at 5 m intervals for a distance of 20 m linearly and perpendicular to the direction of flow from the geothermal springs at Siloam and Tshipise. Multiple samples were collected within the measured perimeter (5 m increment) and mixed together to represent each measured perimeter (Fig. 2). Representative samples from the top soil at a depth 0–15cm were augered and placed inside a plastic sampling bag. The soil samples were oven-dried at 50°C for 8 h. The dried soil samples were then ground and sieved through a 100 µm sieve.
Experimental procedure
Geothermal spring water analyses
Water samples were analysed using standard methods (APHA, 1989). Temperature of the spring water was measured in-situ using a mercury-in-glass thermometer; pH, EC and TDS of the spring water were measured in-situ electronically with a combined pH/EC/TDS meter (Combo HI 98130, Hanna, USA). The instrument were calibrated according to the manufacturer’s guidelines. Sodium (Na), potassium (K), calcium (Ca), magne-sium (Mg), fluoride (F), chloride (Cl), sulphate (SO4), bicarbo-nate (HCO3) and nitrate (NO3) in spring water were determined using ion chromatography (Dionex Model DX 500) and elemen-tal analysis by ICP-MS (7700 AGILENT). The measurements were carried out in triplicate for every sample to obtain a repre-sentative mean value.
Soil analyses
The saturated soil paste analysis was carried out according to Garltey (2011) and the water extracts were analysed for pH and SWR. SOM was estimated using an ignition method (Magdoff et al., 1996). The soil samples were analysed for trace element concentrations by digesting them using a microwave digestion system (SR ISO 11466: 1999). 1.0 g of pretreated sample was mixed with 9 mL HNO3 and 1 mL H2O2 and the mixture shaken end-to-end at 100 r/min for a period of 60 min. The mixture was allowed to stand for 16 h and placed in the microwave digester for a period of 30 min for reflux boiling. After cooling, the solu-tion was made up to 50 mL with distilled water and filtered. The extractant was analysed for trace elements using ICP-MS (7700 AGILENT). All of the chemical analyses were carried out at the

696
http://dx.doi.org/10.4314/wsa.v42i4.20Available on website http://www.wrc.org.zaISSN 1816-7950 (Online) = Water SA Vol. 42 No. 4 October 2016Published under a Creative Commons Attribution Licence
Agricultural Research Council: Institute for Soil, Climate and Water, Pretoria, South Africa. All measurements were carried out in triplicate and the mean value calculated.
Statistical analyses
All values from chemical analyses were presented as mean values. Data obtained from the experiment were subjected to factor analysis, correlation analysis and two-way ANOVA, using the Statistical Package for Social Science (SPSS version 22), to validate any significant differences between the two seasons. The data were also subjected to descriptive statistics to evaluate the mean, standard deviation and coefficient of variation. In all cases, p < 0.05 was the accepted significance level.
RESULTS AND DISCUSSION
Results of the study revealed that the geothermal water at the Siloam spring is hotter than that of the Tshipise spring; this could be attributed to the geothermal gradient. Siloam geo-thermal spring emanates from a deeper source than Tshipise spring (Press and Siever, 1986), the major controlling factor is the geothermal gradient of the spring. A study by Odiyo and Makungo (2012) found that high temperatures aid dissolution of rock. This could be a contributing factor acting in addition to the geochemistry of the associated geology, contributing to higher levels of dissolved trace elements in the geothermal water and the surrounding soil. Siloam and Tshipise springs are of a differ-ent geology and 60 km apart, resulting in differing geochemistry
(Table 1). A study by Durowoju et al. (2016) showed that the water types are Na-Cl and Na-HCO3 in Siloam and Tshipise springs, respectively. The geothermal spring at Siloam is under-lain by basaltic lava of the Sibasa Formation (Olivier et al., 2011). Mg2+ and Ca2+ may be associated with basaltic intrusions. Tshipise is underlain by volcanic rocks of the Letaba Formation (Johnson et al., 2006). The Letaba Formation immediately underlying the spring at Tshipise comprises mainly basalt with minor andesite and sandstone. The spring also lies close to a dolerite intrusion. However, Tshipise is near the Gumbu Group (CaSiCO3 rich), with higher concentrations of Ca2+ and HCO3
- at Tshipise compared to Siloam (Table 1). Na-HCO3 water type is the most evolved of the waters and derives from dissolution of rock minerals (plagioclase) (Lipfert et al., 2004). Also, Na-Cl levels, derived from Na-Cl brines, are higher at Tshipise, possibly due to the marine depositional environment that prevailed when Gumbu sediments were laid down. Salinity levels at Tshipise spring (47.09 mg/L) are higher compared to Siloam spring (21.06 mg/L), which is as a result of the differences in the geochemistry due to the underlying geology.
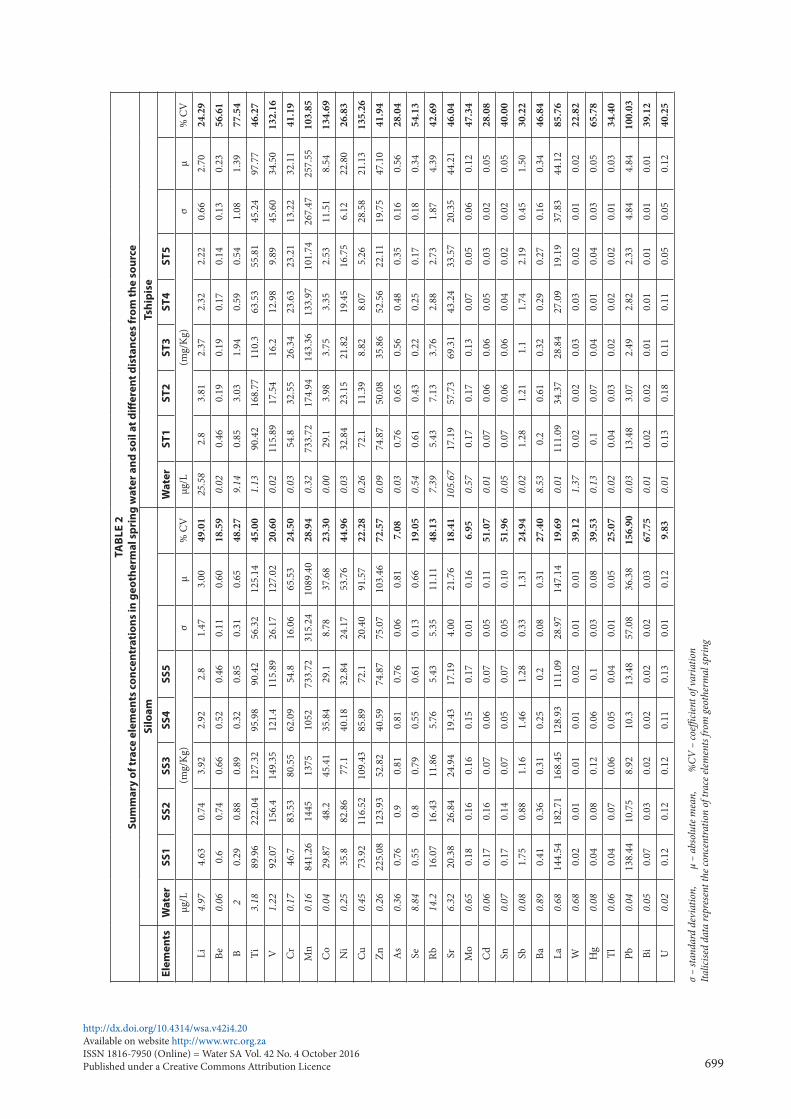
SS1, SS2, SS3, SS4 and SS5 are locations of the soil sam-ples at 0 m, 5 m, 10 m, 15 m and 20 m away from the source, respectively, at Siloam, whereas ST1, ST2, ST3, ST4 and ST5 represent the locations of the soil samples at 0 m, 5 m, 10 m, 15 m and 20 m away from the source, respectively, at Tshipise. The trace element concentrations in geothermal spring water and the surrounding soil at different distances from the source are summarised in Table 2. Most of the trace element concentra-tions at Siloam are higher at SS1–SS3 compared to SS4–SS5 and decreased in concentration from SS1 to SS5. However, some
Figure 1Map of Vhembe District showing Siloam and Tshipise geothermal springs, Limpopo Province, South Africa

http://dx.doi.org/10.4314/wsa.v42i4.20Available on website http://www.wrc.org.zaISSN 1816-7950 (Online) = Water SA Vol. 42 No. 4 October 2016Published under a Creative Commons Attribution Licence 697
trace elements showed no change (As, W, Tl, Bi and U). Most of the trace elements at Tshipise decreased from SS1 to SS5, with no change in W and Bi, and increases in Ba, Sb and Sr.
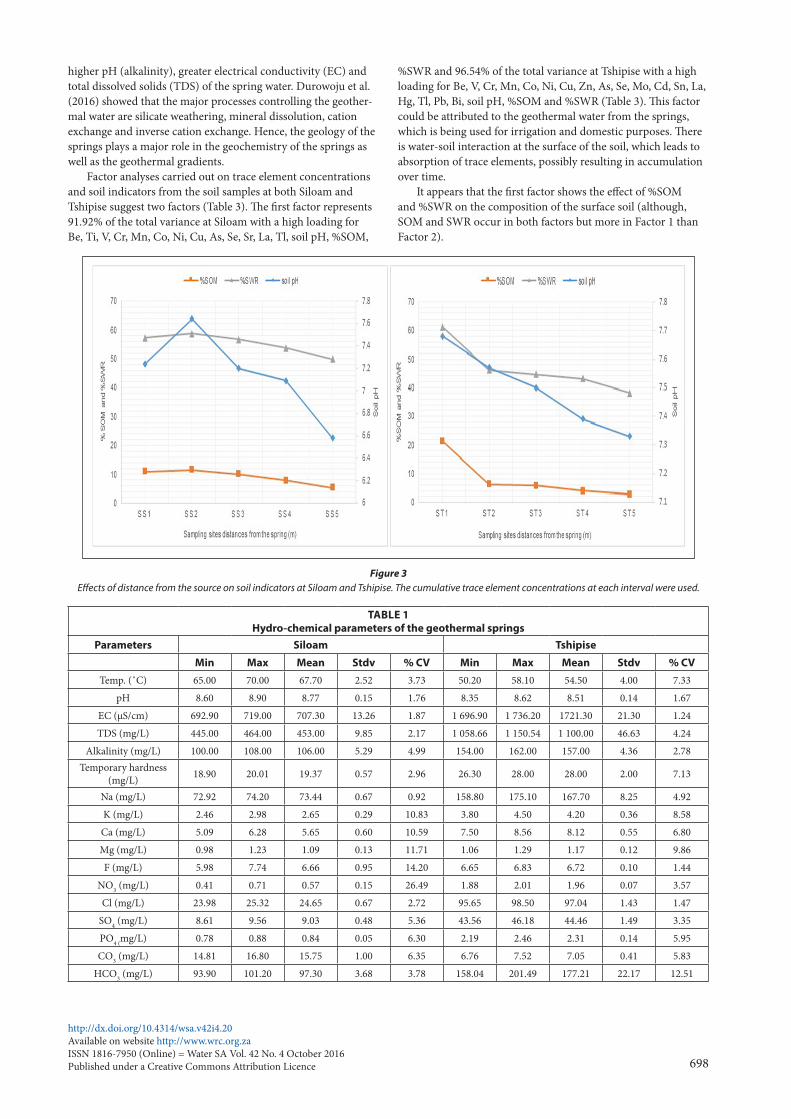
Trace element concentrations follow a similar trend to the soil indicators, soil pH, SOM and SWR. The soil pH represents the H+ concentration in the solution of the soil pores, which is in a dynamic equilibrium with the predominantly negatively-charged surface of the soil. The number of negatively-charged binding sites for cations is therefore dependent on the soil pH, which implies that an increase in pH promotes the sorption of trace elements (Vangheluwe et al., 2005). The SOM serves as a reservoir of nutrients, trace elements and water in the soil, aids in reducing compaction and surface crusting, and increases water infiltration into the soil. Organic matter has many negative charges due to the dissociation of organic acids, which have a high affinity to adsorb metal cations and reduce their availability (Basta et al., 2005; Vangheluwe et al., 2005).
There is a positive correlation between the trace elements and the indicators in general: if the soil pH is low and SOM and SWR are high then most of the trace elements in the soil will also be relatively high. The correlation between trace elements and pH is negative. Increasing pH (more alkaline conditions) is associated with lower concentrations of elements (Burt et al., 2003). At both sites (Siloam and Tshipise), most of the trace ele-ment concentrations and the soil indicators reduce with distance from the geothermal springs (from the source to 20 m away). Studies by Ma et al. (1997); Burt et al. (2003); Chen et al. (1999) and Tack et al. (1997) show that there is little correlation between total trace element concentrations and indicators. But the present study, as well as studies by Adriano (2001) and Kabata-Pendias and Pendias (2001), shows that trace element concentrations generally increase with decreasing pH and increasing SOM and SWR (Figs 3 and 4). There is a high coefficient of variation in each trace element concentration at different intervals and this implies a great dispersion in the trace concentrations in the soil at different intervals. The concentrations of these trace elements
is more marked within distances of 0–10 m (SS1–SS3) from the geothermal spring at Siloam. This could be attributed to human activities such as washing of the slaughtered chickens and piling of their feathers by members of the community on the geother-mal spring. This could increase the SOM and result in higher trace element concentrations in the soil.
At Tshipise, values of the indicators (SOM, soil pH and SWR) decrease with distance, following a similar trend to the decrease in trace element concentrations (Figs 3 and 4). SS2 at Siloam is the only exception, with the highest values of SOM, SWR and soil pH as well as high concentrations of most of the trace elements. This implies that there is a strong correlation between the soil indicators and the trace element concentrations in the soil. Some trace elements increase with distance from the spring. Figure 3 shows that trace elements are higher at a pH ranging from 7.64–6.58 and 7.68 – 7.33 at Siloam and Tshipise, respectively. This suggests that the pH plays a significant role in reduction of the trace element concentration in the soil (Adamu et al., 2011). Hence, there is a reduction in trace element con-centration with distance from the spring with a similar trend in increasing alkalinity with distance from the spring. The SWR, ranging from 38.22–61.28%, predicts the soil texture as clay and clay loam for Siloam and Tshipise, respectively. This also accounts for the adsorption and retention capacity for trace elements in the soil decreasing with distance away from the geothermal spring. As the SWR decreases with distance from the geothermal spring, most of the trace elements concentrations also decrease (Fig. 3).
The hydrochemical data obtained from geothermal springs (Tables 1 and 2) were subjected to factor analyses which resulted in one factor. This factor represents 100% of the total variance and is characterised by a high loading for all of the parameters analysed in both springs. This factor is due to water-rock inter-action (geology) resulting from the geothermal gradient at the deep aquifer. This factor accounts for geochemical dissolution of the rock at high temperature leading to more mineralisation,
Figure 2Locations of the sampling points for the surface soil at (a) Siloam and (b) Tshipise geothermal springs. SS1 – SS5 and ST1 – ST5 represent distances from
0–20 m away from the geothermal springs at Tshipise and Siloam, respectively.
698
http://dx.doi.org/10.4314/wsa.v42i4.20Available on website http://www.wrc.org.zaISSN 1816-7950 (Online) = Water SA Vol. 42 No. 4 October 2016Published under a Creative Commons Attribution Licence
TABLE 1Hydro-chemical parameters of the geothermal springs
Parameters Siloam Tshipise
Min Max Mean Stdv % CV Min Max Mean Stdv % CVTemp. (˚C) 65.00 70.00 67.70 2.52 3.73 50.20 58.10 54.50 4.00 7.33
pH 8.60 8.90 8.77 0.15 1.76 8.35 8.62 8.51 0.14 1.67
EC (µS/cm) 692.90 719.00 707.30 13.26 1.87 1 696.90 1 736.20 1721.30 21.30 1.24
TDS (mg/L) 445.00 464.00 453.00 9.85 2.17 1 058.66 1 150.54 1 100.00 46.63 4.24
Alkalinity (mg/L) 100.00 108.00 106.00 5.29 4.99 154.00 162.00 157.00 4.36 2.78Temporary hardness
(mg/L) 18.90 20.01 19.37 0.57 2.96 26.30 28.00 28.00 2.00 7.13
Na (mg/L) 72.92 74.20 73.44 0.67 0.92 158.80 175.10 167.70 8.25 4.92
K (mg/L) 2.46 2.98 2.65 0.29 10.83 3.80 4.50 4.20 0.36 8.58
Ca (mg/L) 5.09 6.28 5.65 0.60 10.59 7.50 8.56 8.12 0.55 6.80
Mg (mg/L) 0.98 1.23 1.09 0.13 11.71 1.06 1.29 1.17 0.12 9.86
F (mg/L) 5.98 7.74 6.66 0.95 14.20 6.65 6.83 6.72 0.10 1.44
NO3 (mg/L) 0.41 0.71 0.57 0.15 26.49 1.88 2.01 1.96 0.07 3.57
Cl (mg/L) 23.98 25.32 24.65 0.67 2.72 95.65 98.50 97.04 1.43 1.47
SO4 (mg/L) 8.61 9.56 9.03 0.48 5.36 43.56 46.18 44.46 1.49 3.35
PO4 (mg/L) 0.78 0.88 0.84 0.05 6.30 2.19 2.46 2.31 0.14 5.95
CO3 (mg/L) 14.81 16.80 15.75 1.00 6.35 6.76 7.52 7.05 0.41 5.83
HCO3 (mg/L) 93.90 101.20 97.30 3.68 3.78 158.04 201.49 177.21 22.17 12.51
higher pH (alkalinity), greater electrical conductivity (EC) and total dissolved solids (TDS) of the spring water. Durowoju et al. (2016) showed that the major processes controlling the geother-mal water are silicate weathering, mineral dissolution, cation exchange and inverse cation exchange. Hence, the geology of the springs plays a major role in the geochemistry of the springs as well as the geothermal gradients.
Factor analyses carried out on trace element concentrations and soil indicators from the soil samples at both Siloam and Tshipise suggest two factors (Table 3). The first factor represents 91.92% of the total variance at Siloam with a high loading for Be, Ti, V, Cr, Mn, Co, Ni, Cu, As, Se, Sr, La, Tl, soil pH, %SOM,
%SWR and 96.54% of the total variance at Tshipise with a high loading for Be, V, Cr, Mn, Co, Ni, Cu, Zn, As, Se, Mo, Cd, Sn, La, Hg, Tl, Pb, Bi, soil pH, %SOM and %SWR (Table 3). This factor could be attributed to the geothermal water from the springs, which is being used for irrigation and domestic purposes. There is water-soil interaction at the surface of the soil, which leads to absorption of trace elements, possibly resulting in accumulation over time.
It appears that the first factor shows the effect of %SOM and %SWR on the composition of the surface soil (although, SOM and SWR occur in both factors but more in Factor 1 than Factor 2).
Figure 3Effects of distance from the source on soil indicators at Siloam and Tshipise. The cumulative trace element concentrations at each interval were used.
http://dx.doi.org/10.4314/wsa.v42i4.20Available on website http://www.wrc.org.zaISSN 1816-7950 (Online) = Water SA Vol. 42 No. 4 October 2016Published under a Creative Commons Attribution Licence 699
TAB
LE 2
Sum
mar
y of
trac
e el
emen
ts c
once
ntra
tion
s in
geo
ther
mal
spr
ing
wat
er a
nd s
oil a
t diff
eren
t dis
tanc
es fr
om th
e so
urce
Silo
amTs
hipi
se
Elem
ents
Wat
erSS
1SS
2SS
3SS
4SS
5W
ater
ST1
ST2
ST3
ST4
ST5
µg/L
(mg/
Kg)
σµ
% C
Vµg
/L(m
g/K
g)σ
µ%
CV
Li4.
974.
630.
743.
922.
922.
81.
473.
0049
.01
25.5
82.
83.
812.
372.
322.
220.
662.
7024
.29
Be0.
060.
60.
740.
660.
520.
460.
110.
6018
.59
0.02
0.46
0.19
0.19
0.17
0.14
0.13
0.23
56.6
1
B2
0.29
0.88
0.89
0.32
0.85
0.31
0.65
48.2
79.
140.
853.
031.
940.
590.
541.
081.
3977
.54
Ti3.
1889
.96
222.
0412
7.32
95.9
890
.42
56.3
212
5.14
45.0
01.
1390
.42
168.
7711
0.3
63.5
355
.81
45.2
497
.77
46.2
7
V1.
2292
.07
156.
414
9.35
121.
411
5.89
26.1
712
7.02
20.6
00.
0211
5.89
17.5
416
.212
.98
9.89
45.6
034
.50
132.
16
Cr
0.17
46.7
83.5
380
.55
62.0
954
.816
.06
65.5
324
.50
0.03
54.8
32.5
526
.34
23.6
323
.21
13.2
232
.11
41.1
9
Mn
0.16
841.
2614
4513
7510
5273
3.72
315.
2410
89.4
028
.94
0.32
733.
7217
4.94
143.
3613
3.97
101.
7426
7.47
257.
5510
3.85
Co
0.04
29.8
748
.245
.41
35.8
429
.18.
7837
.68
23.3
00.
0029
.13.
983.
753.
352.
5311
.51
8.54
134.
69
Ni
0.25
35.8
82.8
677
.140
.18
32.8
424
.17
53.7
644
.96
0.03
32.8
423
.15
21.8
219
.45
16.7
56.
1222
.80
26.8
3
Cu0.
4573
.92
116.
5210
9.43
85.8
972
.120
.40
91.5
722
.28
0.26
72.1
11.3
98.
828.
075.
2628
.58
21.1
313
5.26
Zn0.
2622
5.08
123.
9352
.82
40.5
974
.87
75.0
710
3.46
72.5
70.
0974
.87
50.0
835
.86
52.5
622
.11
19.7
547
.10
41.9
4
As
0.36
0.76
0.9
0.81
0.81
0.76
0.06
0.81
7.08
0.03
0.76
0.65
0.56
0.48
0.35
0.16
0.56
28.0
4
Se8.
840.
550.
80.
790.
550.
610.
130.
6619
.05
0.54
0.61
0.43
0.22
0.25
0.17
0.18
0.34
54.1
3
Rb14
.216
.07
16.4
311
.86
5.76
5.43
5.35
11.1
148
.13
7.39
5.43
7.13
3.76
2.88
2.73
1.87
4.39
42.6
9
Sr6.
3220
.38
26.8
424
.94
19.4
317
.19
4.00
21.7
618
.41
105.
6717
.19
57.7
369
.31
43.2
433
.57
20.3
544
.21
46.0
4
Mo
0.65
0.18
0.16
0.16
0.15
0.17
0.01
0.16
6.95
0.57
0.17
0.17
0.13
0.07
0.05
0.06
0.12
47.3
4
Cd
0.06
0.17
0.16
0.07
0.06
0.07
0.05
0.11
51.0
70.
010.
070.
060.
060.
050.
030.
020.
0528
.08
Sn0.
070.
170.
140.
070.
050.
070.
050.
1051
.96
0.05
0.07
0.06
0.06
0.04
0.02
0.02
0.05
40.0
0
Sb0.
081.
750.
881.
161.
461.
280.
331.
3124
.94
0.02
1.28
1.21
1.1
1.74
2.19
0.45
1.50
30.2
2
Ba0.
890.
410.
360.
310.
250.
20.
080.
3127
.40
8.53
0.2
0.61
0.32
0.29
0.27
0.16
0.34
46.8
4
La0.
6814
4.54
182.
7116
8.45
128.
9311
1.09
28.9
714
7.14
19.6
90.
0111
1.09
34.3
728
.84
27.0
919
.19
37.8
344
.12
85.7
6
W0.
680.
020.
010.
010.
010.
020.
010.
0139
.12
1.37
0.02
0.02
0.03
0.03
0.02
0.01
0.02
22.8
2
Hg
0.08
0.04
0.08
0.12
0.06
0.1
0.03
0.08
39.5
30.
130.
10.
070.
040.
010.
040.
030.
0565
.78
Tl0.
060.
040.
070.
060.
050.
040.
010.
0525
.07
0.02
0.04
0.03
0.02
0.02
0.02
0.01
0.03
34.4
0
Pb0.
0413
8.44
10.7
58.
9210
.313
.48
57.0
836
.38
156.
900.
0313
.48
3.07
2.49
2.82
2.33
4.84
4.84
100.
03
Bi0.
050.
070.
030.
020.
020.
020.
020.
0367
.75
0.01
0.02
0.02
0.01
0.01
0.01
0.01
0.01
39.1
2
U0.
020.
120.
120.
120.
110.
130.
010.
129.
830.
010.
130.
180.
110.
110.
050.
050.
1240
.25
σ –
stand
ard
devi
atio
n,
µ –
abso
lute
mea
n,
%CV
– co
efficie
nt o
f var
iatio
nIta
licise
d da
ta re
pres
ent t
he co
ncen
tratio
n of
trac
e elem
ents
from
geot
herm
al sp
ring

700
http://dx.doi.org/10.4314/wsa.v42i4.20Available on website http://www.wrc.org.zaISSN 1816-7950 (Online) = Water SA Vol. 42 No. 4 October 2016Published under a Creative Commons Attribution Licence
SOM and SWR appear to be the vehicle through which trace elements are incorporated into the soil (Cox, 1995). The SWR also suggests the soil textural class as clay loam and clay at Tshipise and Siloam, respectively. SWR values infer that both soils have a high capacity for the adsorption and retention of dissolved trace elements. These factors also predict differences in geochemical variations in the trace element concentrations at the two sites, revealing differences in geology, even though both sites fall within Soutpansberg Group.
The second factor represents 6.89% of total variance at Siloam with a high loading for Be, Zn, Rb, Mo, Cd, Sn, Ba, Pb, Bi, soil pH, %SOM, %SWR and 2.79% of the total variance at Tshipise, with a high loading for Li, B, Ti, As, Rb, Mo, Cd, Sn, Ba, Bi, U, and soil pH (Table 3). This factor is as a result of soil
pedogenesis and also reflects the influence of pH on trace ele-ment mobility, since soil pH is attributed more to Factor 2 than Factor 1. Most trace elements are mobile at low pH due to dis-solution and decomposition in the soil (Cox, 1995; Adamu et al., 2011). However, soil contains unique trace element concentra-tions based on soil pedogenesis (Siegel, 2002).
Concentration of most of the trace elements show a high positive correlation (r > 0.5) with the soil indicators (Table 4). Most of the trace elements in soil (Siloam and Tshipise) are positively correlated with at least one of the indicators (soil pH, %SOM and %SWR) except for a few trace elements such as Sr, Sb and W at Tshipise and B, W, Hg and U at Siloam showing a negative correlation (Table 4). B and Ba at Tshipise and Li, V, Cr, Sb and Mo at Siloam had a low to insignificant correlation to any of the soil indicators. De Haan (1993) and Siegel (2002) reported that there is no correlation between organic matter and the levels of trace elements in the soil, which is contrary to the findings of this study. However, these positive correlations between trace
Figure 4Magnitudes of variation of each trace element concentration at different
distances from the geothermal springs at Siloam and Tshipise
TABLE 3Factors derived from Varimax R-mode factor analysis with Kaiser normalisation of the trace element concentrations
and indicators at Siloam and Tshipise
ElementSiloam soil Tshipise soil
Factor 1 Factor 2 Factor 1 Factor 2
Li −0.497 0.176 0.092 0.893
Be 0.825 0.556 0.99 0.12
B 0.491 −0.295 −0.274 0.958
Ti 0.802 0.253 −0.082 0.995
V 0.923 −0.263 0.998 0.051
Cr 0.969 −0.158 0.961 0.267
Mn 0.998 0.064 0.997 0.082
Co 0.996 0.026 0.999 0.032
Ni 0.962 0.123 0.924 0.363
Cu 0.992 0.048 0.998 0.062
Zn −0.322 0.943 0.808 0.284
As 0.866 0.091 0.725 0.654
Se 0.865 0.022 0.851 0.464
Rb 0.403 0.906 0.32 0.903
Sr 0.925 0.355 −0.736 0.496
Mo −0.606 0.637 0.529 0.841
Cd 0.056 0.949 0.608 0.636
Sn −0.045 0.974 0.573 0.707
Sb −0.76 0.267 −0.289 -0.801
Ba 0.261 0.951 −0.478 0.808
La 0.872 0.479 0.992 0.121
W −0.89 0.276 −0.39 −0.202
Hg 0.416 −0.568 0.777 0.487
Tl 0.977 0.038 0.879 0.41
Pb −0.519 0.81 0.999 0.031
Bi −0.386 0.907 0.619 0.677
U 0.178 −0.643 0.19 0.895
Soil pH 0.556 0.778 0.647 0.752
% SOM 0.742 0.647 0.986 0.157
% SWR 0.704 0.683 0.946 0.285
Total variance 91.92 6.89 96.54 2.79
Bold text indicates high positive scores (>0.50)

http://dx.doi.org/10.4314/wsa.v42i4.20Available on website http://www.wrc.org.zaISSN 1816-7950 (Online) = Water SA Vol. 42 No. 4 October 2016Published under a Creative Commons Attribution Licence 701
TABLE 5ANOVA (two-factor without replication) of the trace element concentration for soil samples at different distances from the
source at Siloam and TshipiseSource of vari-
ation SS df MS F P-value F critical
SiloamRows 5 668 081 26 218 003.1 53.23162 1.13846 x 10-48 1.6
Columns 31 469.65 4 7 867.413 1.921051Error 425 918.3 104 4 095.368Total 6 125 469 134
TshipiseRows 353 912 26 13 612 4.884353 2.91 x 10⁻⁹ 1.6
Columns 26 521.29 4 6 630.322 2.379138Error 289 833.3 104 2 786.859Total 670 266.7 134
TABLE 4Pearson correlation matrix of soil trace element concentrations and soil indicators at Siloam and Tshipise
ElementSiloam Tshipise
Soil pH % SOM % SWR Soil pH % SOM % SWRLi 0.339 −0.039 −0.098 0.597 0.204 0.307Be 0.594 0.909 0.926 0.831 0.999 0.98B −0.501 −0.059 −0.044 0.415 −0.117 0.007Ti 0.153 0.587 0.628 0.575 0.072 0.198V −0.168 0.291 0.355 0.785 0.993 0.958Cr −0.022 0.418 0.48 0.888 0.986 0.975Mn 0.27 0.644 0.701 0.803 0.995 0.966Co 0.188 0.595 0.653 0.773 0.991 0.954Ni 0.21 0.635 0.677 0.944 0.973 0.995Cu 0.191 0.605 0.66 0.79 0.994 0.961Zn 0.691 0.538 0.466 0.802 0.831 0.902As 0.139 0.533 0.598 0.989 0.822 0.906Se 0.002 0.465 0.496 0.92 0.899 0.934Rb 0.799 0.935 0.905 0.79 0.44 0.531Sr 0.44 0.81 0.842 −0.176 −0.621 −0.505
Mo 0.271 0.101 0.006 0.956 0.66 0.751Cd 0.7 0.735 0.693 0.922 0.716 0.828Sn 0.714 0.703 0.647 0.939 0.695 0.802
Sb 0.358 −0.135 −0.189 −0.801 −0.438 −0.568Ba 0.939 0.932 0.897 0.125 −0.365 −0.248La 0.559 0.884 0.907 0.827 0.998 0.977W −0.096 −0.356 −0.441 −0.32 −0.381 −0.293Hg −0.578 −0.254 −0.233 0.866 0.836 0.813Tl 0.156 0.577 0.639 0.896 0.916 0.922Pb 0.702 0.377 0.3 0.769 0.989 0.952Bi 0.77 0.516 0.444 0.856 0.693 0.74U −0.859 −0.522 −0.498 0.723 0.317 0.473
Soil pH 1 0.874 0.849 1 0.849 0.912% SOM 0.874 1 0.995 0.849 1 0.981% SWR 0.849 0.995 1 0.912 0.981 1
Bold text indicates high positive scores (>0.50) at significance level alpha = 0.05
elements and soil properties (indicators)(soil pH, %SOM and %SWR) may be an indication of the influence of these properties on trace element dispersion and concentration in soils (Adamu et al., 2011).
Statistically, there is a significant difference in the concen-tration of each trace element between locations SS1 to SS5 and ST1 to ST5 (p ˂ 0.05; Table 5), that is, there is a great dispersion among the trace element concentrations at different distances.
This implies that the trace element concentration, availability and mobility in the soils is greatly dependent on the soil indicators. Factor analyses suggested that geothermal water has the potential to enrich the soil such that the trace elements reduce with dis-tance from the geothermal spring. Table 2 shows clearly that the concentrations of several trace elements decrease with increasing horizontal distance from the geothermal spring.

702
http://dx.doi.org/10.4314/wsa.v42i4.20Available on website http://www.wrc.org.zaISSN 1816-7950 (Online) = Water SA Vol. 42 No. 4 October 2016Published under a Creative Commons Attribution Licence
CONCLUSION
Surface soils at Siloam and Tshipise have higher concentrations of trace elements closer to the springs, with a decline in concen-tration with increasing distance from the springs. The trace ele-ments were determined at 5 m incremental horizontal distances away from the springs using ICP-MS after microwave digestion. R-mode factor analysis revealed the correlation between selected soil indicators/properties and trace element concentrations. The findings support the significant role of the rock–water interac-tion within the deep aquifer (spring geology) in association with soil indicators (soil pH, SOM and SWR) and pedogenesis. Most of the trace element concentrations show strong correlations with the soil indicators, which affect the horizontal status of the trace element concentrations in soil. Further studies are needed in order to assess the impacts of trace element intake by plants and animals in the study areas.
ACKNOWLEDGMENT
The authors would like to thank the National Research Foundation, Pretoria, South Africa, for funding and University of Venda (Research and Publication Committee) for various forms of support.
REFERENCES
ADAMU CI, NGANJE TN, UKWANG EE, IBE KA and PETER N (2011) A study of the distribution pattern of heavy metals in surface soil around Arufu Pb-Zn mine, Northeastern Nigeria, using factor analysis. Res. J. Chem. Sci. 1 (2) 70–80.
ADRIANO DC (2001) Trace elements in terrestrial environments: Biochemistry, bioavailability and risks of metals (2nd edn.). Springer-Verlag, New York. http://dx.doi.org/10.1007/978-0-387-21510-5
APHA (American Public Health Association) (1989) Standard Methods for the Examination of Water and Wastewater (17th edn). APHA, Washington, DC.
BASTA NT, RYAN JA and CHANEY RL (2005) Trace element chemis-try in residual-treated soil: Key concepts in metal bioavailability. J. Environ. Qual. 34 49–63. http://dx.doi.org/10.2134/jeq2005.0049dup
BRANDL G (1981) The geology of the Messina area, Explanation of Sheet 2230, Geological Survey of South Africa (accompanied by 1, 1:250 000 geological map) 35.
BURT R, WILSON MA, MAYS MD and LEE CW (2003) Major and trace elements of selected pedons in the USA. J. Environ. Qual. 32 2109–2121. http://dx.doi.org/10.2134/jeq2003.2109
BURK R, WEBER T, PARK S, YOCHUM S and FERGUSSON R (2003) Trace element concentration and speciation in selected mining-contaminated soil and water in Willow Creek Floodplain, Colorado. Appl. Environ. Soil Science 2011 1–20.
COX PA (1995) The Elements on Earth; Inorganic Chemistry in the Environment. Oxford University Press, New York. 235 pp.
CHEN M, MA LQ and HARRIS WG (1999) Baseline concentrations of 15 trace elements in Florida Surface soils. J. Environ. Qual. 28 1173–1181. http://dx.doi.org/10.2134/jeq1999.00472425002800040018x
DE HAAN FAM (1993) Soil quality in relation to soil pollution. In: Lake JV, Willey F, Bock GR and Ackrili L (eds) Environmental Change and Human Health. Wiley, Chichester. 104–123.
DUROWOJU OS (2015) Trace element concentrations in geothermal springs and their impact on soil and vegetation in Siloam and Tshipise. Unpublished Master’s dissertation, University of Venda, South Africa.
DUROWOJU O, ODIYO J and EKOSSE G (2015) Hydrogeochemical set-ting of geothermal springs in Limpopo Province – Review, South Africa. Res. J. Chem. Environ. 19 (1) 77–88. http://dx.doi.org/10.3390/su8010060
DUROWOJU OS, ODIYO JO and EKOSSE GE (2016) Variations of Heavy Metals from Geothermal Spring to Surrounding Soil and Mangifera Indica–Siloam Village, Limpopo Province. Sustainability 8 60 doi: 10.3390/su8010060.
GARTLEY K (2011) Recommended soluble salts test. In: The North Coordinating Committee for Soil Testing, Recommended Soil Testing Procedures for the Northeastern United States. Northeastern Regional Publication 493 (3rd edn). Agricultural Experiment Stations of Connecticut, Delaware.
KABATA-PENDIAS A and PENDIAS H (2001) Trace Elements in Soils and Plants. (3rd edn). CRC Press, London.
KENT LE (1949) Thermal waters of the Union of South Africa and South West Africa. Trans. Geol. Soc. S. Afr. 52 231–264.
LIU CW, LIN KH and KUO YM (2003) Application of factor analysis in the assessment of groundwater quality in a Blackfoot disease area in Taiwan. Sci. Total Environ. 313 77–89. http://dx.doi.org/10.1016/S0048-9697(02)00683-6
LUND JW (2000) Balneological use of thermal water in the USA. GHC Bulletin September 2000 31-34.
MA LQ TAN F and HARRIS WG (1997) Concentrations and distribu-tions of eleven metals in Florida soils. J. Environ. Qual. 26 769–775. http://dx.doi.org/10.2134/jeq1997.00472425002600030025x
KABANDA TA (2003) Climate in A first synthesis of the environmental, bio-logical & cultural assets of the Soutpansberg. URL: http://www.soutpans-berg.com/workshop/synthesis/climate.htm (Accessed September 2016).
MAGDOFF FR, TABATABAI MA and HANLON EA (1996) Soil Organic Matter: Analysis and Interpretation. Soil Science Society of America Special Publication 46. Soil Science Society of America, Madison, WI. 67 pp.
MUNDALAMO HR (2003) Investigation of water quality in Nzhelele valley, Limpopo Province, South Africa. Honours mini-dissertation, University of Venda, Thohoyandou.
ODIYO JO and MAKUNGO R (2012) Fluoride concentrations in groundwater and impact on human health in Siolam Village, Limpopo Province, South Africa. Water SA 38 (5) 731–736.
OLIVIER J, VAN NIEKERK HJ and VAN DER WALT IJ (2008) Physical and chemical characteristics of thermal springs in the Waterberg area of Limpopo Province, South Africa. Water SA 34 (2) 163–174.
PLEYSIER LJ (1995) Soil sampling and sample preparation. IITA Research Guide 2. IITA, Ibadan.
PRESS F and SIEVER R (1986) Earth (4th edn). W.H. Freeman and Company, New York.
SIEGEL FR. (2002) Environmental Geochemistry of Potentially Toxic Metals., Springer-Verlag, Berlin. 218.
SLAGLE A, SKOUSEN J, BHUMBLA D, SENCINDIVER J and MCDONALD L (2004) Trace element concentrations of three soil in central Appalachia. Soil Survey Horizons 45 (3) 73–85. http://dx.doi.org/10.2136/sh2004.3.0073
SR ISO 11466 (1999) Soil quality – extraction of trace elements soluble in aqua regia. International Organization for Standardization, Geneva.
TACK FMG, VERLOO MG, VANMECHELEN L and VAN RANST E (1997) Baseline concentration levels of trace elements as a function of clay and organic carbon contents in soils in Flanders (Belgium). Sci. Total Environ. 201 113–123. http://dx.doi.org/10.1016/S0048-9697(97)00096-X
USEPA (United States Environmental Protection Agency) (1992) Ground water issue: Behaviour of metals in soil. EPA/540/S-92/018. USEPA, Washington, DC,
VAN VUUREN K (1990) Die Warmwaterbronne van Suidwes-Kaapland: HulleVerbreiding, Eienskappe en Benutting. B.A. Honours disserta-tion, University of Stellenbosch.
VANGHELUWE M, VAN SPRANG P, VERDONCK F, HEIJERICK D, VERSONNEN B, VANDENBROELE M and VAN HYFTE A (2005) Metals Environmental Risk Assessment Guidance. Government of the United Kingdom, Department for Environment Food and Rural Affairs (DEFRA).
WALSH (2005) User’s Manual for the CRREL Multi-Increment Sampling Tool. Strategic Environmental Research and Development Program, Arlington VA.
YAHAYA MI, MOHAMMAD S and ABDULLAHI BK (2009) Seasonal variations of heavy metal concentration in Abattoir dumping site soil in Nigeria. J. Appl. Sci. Environ. Manage. 13 (4) 9–13.