hospital authority antimicrobial dispensing data (2019)
TRANSCRIPT

1
Antimicrobial Usage (AMU) Surveillance in Public Hospitals and Clinics -
Hospital Authority Antimicrobial Dispensing Data (2019)
May 2021
2
Contents Outline
• Background
• Methodology
• Results 1. Total antimicrobials dispensed in public hospitals and clinics by
service type
2. Antimicrobials dispensed in HA non-inpatient service by service
3. Antimicrobials dispensed in HA inpatient service by specialty
• Remarks on interpretation of results
• Summary
• Recommendations

3
Background

4
Background
• The Hong Kong Strategy and Action Plan on Antimicrobial Resistance 2017-2022 was issued in July 2017
• Activity 3.2.1 suggests collecting antimicrobial dispensing data from Hospital Authority (HA) and monitoring antimicrobial usage in public hospitals and clinics
• This presentation briefly accounts the surveillance findings for year 2019

5
Methodology

6
Scope of Data
• Antimicrobials dispensing records from the following HA services during 2016 to 2019 were included:
• Non-inpatient service • Primary Care (GOPC)
• Specialist Out-patient (Clinical)
• Accident and Emergency (A&E)
• Inpatient service • Medicine
• Surgery
• Orthopaedics and Traumatology (O&T)
• Intensive Care Unit/ High Dependency Unit (ICU/ HDU)
• Others

7
Definitions
• Surveillance period is defined by calendar year
• Anatomical Therapeutic Chemical (ATC) classification • This system is developed by WHO • It divides drugs into different groups according to the organ or system
on which they act and their therapeutic, pharmacological and chemical properties
• Defined Daily Dose (DDD) • A standardised unit adopted by WHO to facilitate comparison of drug
usage • Defined as “the assumed average maintenance dose per day for a drug
used for its main indication in adults” • Each antimicrobial was assigned a DDD constant per route of
administration • DDD constants are updated by WHO annually • As the year 2019 version of ATC/DDD was adopted in this report, the
DDD figures of previous years have been re-calculated which would be different from the figures presented in the past reports
• For example, DDD constant for oral use of amoxicillin was changed from 1000mg in 2018 to 1500mg in 2019
8
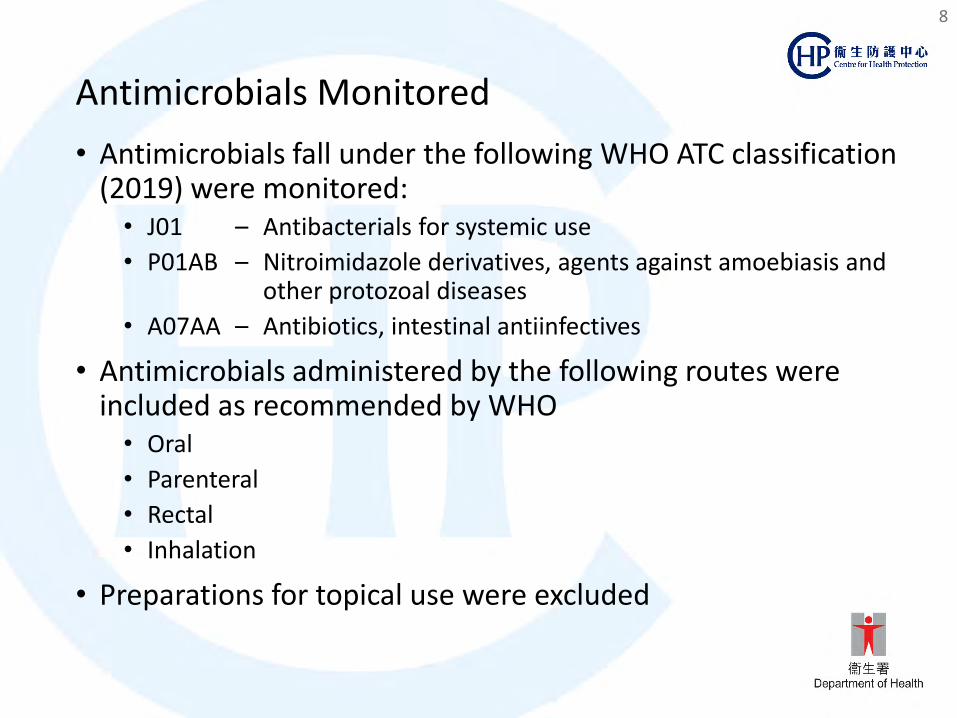
Antimicrobials Monitored
• Antimicrobials fall under the following WHO ATC classification (2019) were monitored:
• J01 – Antibacterials for systemic use
• P01AB – Nitroimidazole derivatives, agents against amoebiasis and other protozoal diseases
• A07AA – Antibiotics, intestinal antiinfectives
• Antimicrobials administered by the following routes were included as recommended by WHO
• Oral
• Parenteral
• Rectal
• Inhalation
• Preparations for topical use were excluded

9
Broad-spectrum Antimicrobials (Big Guns)
The following 15 broad-spectrum antimicrobials identified by experts in HA were examined because of their importance on treating resistant infections:
• Piperacillin/tazobactam
• Ceftazidime
• Cefoperazone/sulbactam
• Cefepime
• Ceftaroline fosamil
• Ceftolozane/tazobactam
• Ceftazidime/avibactam
• Meropenem
• Ertapenem
• Imipenem/cilastatin
• Vancomycin
• Linezolid
• Daptomycin
• Colistin
• Teicoplanin

10
Measurement
• The following units* were used:
Unit of Measurement Dispensing Quantity in HA
DDD non-inpatient + inpatient service
DDD per 1,000 attendances non-inpatient service
DDD per 1,000 patient-days inpatient service
• The following measurements were calculated: • Overall dispensing quantity from 2016 to 2019
• The five most dispensed antimicrobial groups (ATC) in 2019
• The ten most dispensed antimicrobials in 2019
• Dispensing quantity of broad-spectrum antimicrobials from 2016 to 2019
*The ATC/DDD Index (2019) published by the WHO Collaborating Centre for Drug Statistics Methodology were adopted

11
Statistical Method
• Year 2016 was chosen as the baseline for comparison as the Hong Kong Strategy and Action Plan on Antimicrobial Resistance 2017-2022 was issued in mid-2017 and such decision was endorsed by the High Level Steering Committee (HLSC)
• Following ECDC, we used compound annual growth rate (CAGR) to illustrate average annual rate of change when comparing antimicrobials dispensed in 2019 with that in 2016.
CAGR=(𝑆𝑈 1Τ3)2019/𝑆𝑈2016)
( −1
• In this equation, SU2019 is the total amount of antimicrobials dispensed in year 2019, SU2016 is the total amount of antimicrobials dispensed for year 2016
12
Results 1. Total antimicrobials dispensed in public hospitals and clinics by service type

Total Antimicrobials Dispensed in Public Hospitals and Clinics by Service Type
Non-inpatient Service Inpatient Service
Year DDD per 1,000 attendances * DDD per 1,000 patient-days *
2016 266.27 896.40
2017 256.16 905.35
2018 259.05 895.87
2019 274.41 906.10
13
*Rounded to two decimal places
• Total antimicrobials dispensed showed increases for bothnon-inpatient service (8.14 DDD/ 1,000 attendances; CAGR:1.01%) and inpatient service (9.70 DDD/ 1,000 patient-days;CAGR: 0.36%) in 2019 compared with that of 2016

14
Five Most Dispensed Antimicrobial Groups in Public Hospitals and Clinics
ATC Pharmacological Subgroup Antimicrobial dispensed in DDD Compound annual growth rate
(16 to 19)† Code Description Year 2016 * Year 2017 * Year 2018 * Year 2019 *
J01C Beta-lactam Antibacterials, Penicillins
6,128,000 6,223,000 6,236,000 6,451,000 1.72%
J01A Tetracyclines 643,000 747,000 873,000 1,060,000 18.11%
J01M Quinolone Antibacterials 1,006,000 1,022,000 1,040,000 1,019,000 0.42%
J01F Macrolides, Lincosamides and
Streptogramins 955,000 933,000 882,000 934,000 -0.72%
J01D Other Beta-lactam Antibacterials
856,000 814,000 840,000 858,000 0.10%
Others 942,000 965,000 1,000,000 1,062,000 4.08%
Total 10,531,000 10,704,000 10,873,000 11,385,000 2.63%
Note: The five most dispensed antimicrobial groups were identified from year 2019 data *Rounded to nearest thousand †Rounded to two decimal places; due to rounding, percentages may not precisely reflect the absolute figures
• The five most dispensed antimicrobial groups contain antimicrobials commonly prescribed as empirical treatment for suspected bacterial infections
• In 2019, tetracyclines group was the one with the most obvious increase (CAGR: 18.11%)
15
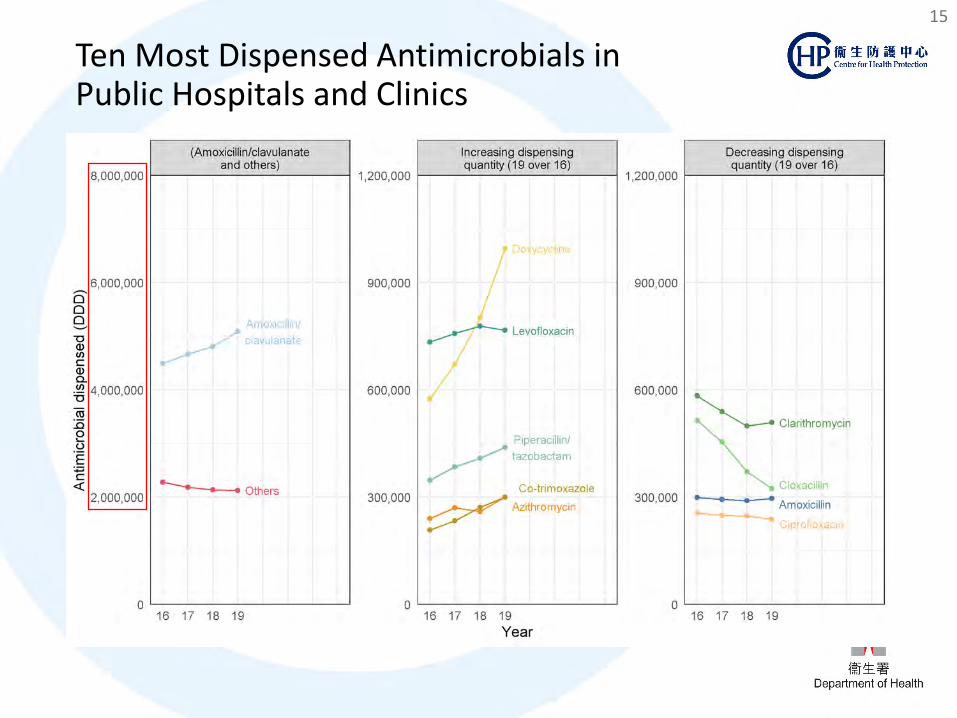
Ten Most Dispensed Antimicrobials in Public Hospitals and Clinics

16
Ten Most Dispensed Antimicrobials in Public Hospitals and Clinics
ATC Chemical Substance Antimicrobial dispensed in DDD Compound annual growth rate (16 to 19)†
Code Description Year 2016 * Year 2017* Year 2018 * Year 2019 *
J01CR02 Amoxicillin/clavulanate 4,493,000 4,664,000 4,807,000 5,087,000 4.23% J01AA02 Doxycycline 575,000 671,000 801,000 996,000 20.10% J01MA12 Levofloxacin 734,000 758,000 779,000 767,000 1.48% J01FA09 Clarithromycin 583,000 540,000 500,000 509,000 -4.42%
J01CR05 Piperacillin/tazobactam 347,000 385,000 409,000 439,000 8.15%
J01CF02 Cloxacillin 515,000 455,000 372,000 324,000 -14.27%J01EE01 Co-trimoxazole 208,000 234,000 271,000 300,000 12.97%J01FA10 Azithromycin 240,000 270,000 260,000 300,000 7.65%J01CA04 Amoxicillin 299,000 294,000 290,000 297,000 -0.28%J01MA02 Ciprofloxacin 256,000 249,000 247,000 238,000 -2.34%
Others 2,280,000 2,184,000 2,136,000 2,127,000 -2.29%Total 10,531,000 10,704,000 10,873,000 11,385,000 2.63%
Note: The ten most dispensed antimicrobials were identified from year 2019 data *Rounded to the nearest thousand†Rounded to two decimal places. Due to rounding, percentages may not precisely reflect the absolute figures
• Amoxicillin/clavulanate was the most dispensed antimicrobial from 2016 to 2019• Doxycycline showed the largest increase in dispensing quantity from 2016 to 2019
(CAGR: 20.10%), followed by co-trimoxazole (CAGR: 12.97%), piperacillin/tazobactam(CAGR: 8.15%), azithromycin (CAGR: 7.65%) and amoxicillin/clavulanate (CAGR:4.23%)
• Cloxacillin showed the largest decrease in dispensing quantity from 2016 to 2019(CAGR: -14.27%), followed by clarithromycin (CAGR: -4.42%)

17
Broad-spectrum Antimicrobials Dispensed in Public Hospitals and Clinics

18
Broad-spectrum Antimicrobials Dispensed in Public Hospitals and Clinics
Compound annual growth rate (16 to 19)†
347,000
ATC Chemical Substance Antimicrobial Dispensed in DDD
Code Description
Year 2016*
Year 2017*
Year 2018*
Year 2019*
Beta-lactam Antibacterials, Penicillins
J01CR05 Piperacillin/tazobactam 385,000 409,000 439,000 8.15%
Other Beta-lactam Antibacterials (Cephalosporins)‡
J01DD02 Ceftazidime 24,000 24,000 28,000 32,000 10.41% J01DD62 Cefoperazone/sulbactam 31,000 28,000 29,000 28,000 -4.05%J01DE01 Cefepime 12,000 13,000 18,000 20,000 20.75%J01DI02 Ceftaroline fosamil 1,000 2,000 2,000 3,000 26.03%J01DI54 Ceftolozane/tazobactam <500 <500 1,000 1,000 Not Applicable§
J01DD52 Ceftazidime/avibactam - - <500 1,000 -Other Beta-lactam Antibacterials (Carbapenems)‡
J01DH02 Meropenem 121,000 136,000 170,000 176,000 13.24% J01DH03 Ertapenem 43,000 46,000 51,000 54,000 7.95% J01DH51 Imipenem/cilastatin 9,000 8,000 7,000 7,000 -11.71%J01XA01 Vancomycin 93,000 101,000 113,000 118,000 8.16% J01XX08 Linezolid 14,000 14,000 14,000 17,000 5.26%
Other Antibacterials J01XX09 Daptomycin 6,000 8,000 9,000 10,000 19.39% J01XB01 Colistin 5,000 5,000 4,000 5,000 -1.01%J01XA02 Teicoplanin <500 <500 <500 <500 -77.88%
708,000 770,000 854,000 910,000 8.73%*Rounded to the nearest thousand†Rounded to two decimal places‡WHO ATC Pharmacological subgroup "Other Beta-lactam Antibacterials (J01D)" is further categorized into Cephalosporins and Carbapenems groups§ Ceftolozane/ tazobactam was listed in the HA drug formulary since April 2019, it was supplied on named patient basis before enlistment
• The 15 broad-spectrum antimicrobials accounted for about 7.99% of total antimicrobialsdispensed in HA in 2019
• From 2016 to 2019, dispensing quantity has shown an increase in CAGR of 8.73%• Majority of broad-spectrum antimicrobials were dispensed in inpatient services• The most dispensed broad-spectrum antimicrobial from 2016 to 2019 was piperacillin/tazobactam,
contributed to 48.31% of all broad-spectrum antimicrobials dispensed in 2019, followed bymeropenem and then vancomycin
Total

19
Results 2. Antimicrobials dispensed in HA non-inpatient service byservice

20
Total Antimicrobials Dispensed in HA Non-inpatient Service by Service

21
Non-inpatient Service by Specialty Year
Primary
Care
(GOPC)
Specialist
Out-patient
(Clinical)
Accident &
Emergency
All Non-
inpatient
Services
2016
Percentage of attendance with antimicrobials dispensed §‡ 3.48% 1.57% 9.57% 3.45% DDD per 1,000 attendances (all attendances)‡ 212.76 221.72 564.30 266.27 DDD per 1,000 attendances (attendances with antimicrobial dispensed)‡ 6108.59 14116.11 5897.26 7720.07
2017
Percentage of attendance with antimicrobials dispensed‡§ 3.33% 1.51% 9.03% 3.24% DDD per 1,000 attendances (all attendances)‡ 200.68 221.27 540.03 256.16 DDD per 1,000 attendances (attendances with antimicrobial dispensed)‡ 6032.00 14673.67 5981.24 7914.66
2018
Percentage of attendance with antimicrobials dispensed‡§ 3.21% 1.49% 9.13% 3.16% DDD per 1,000 attendances (all attendances)‡ 199.31 229.10 547.12 259.05 DDD per 1,000 attendances (attendances with antimicrobial dispensed)‡ 6218.19 15388.93 5994.59 8207.22
2019
Percentage of attendance with antimicrobials dispensed‡§ 3.26% 1.53% 9.31% 3.23% DDD per 1,000 attendances (all attendances)‡ 207.26 246.90 568.23 274.41 DDD per 1,000 attendances (attendances with antimicrobial dispensed)‡ 6367.35 16090.61 6102.49 8503.40
Compound annual
growth rate (16 to 19)
Percentage of attendance with antimicrobials dispensed‡§ -2.23% -0.77% -0.90% -2.19%DDD per 1,000 attendances (all attendances)‡ -0.87% 3.65% 0.23% 1.01%DDD per 1,000 attendances (attendances with antimicrobial dispensed)‡ 1.39% 4.46% 1.15% 3.27%
‡Rounded to two decimal places §Due to rounding, figures may not precisely reflect the absolute figures
• Total antimicrobials dispensed in all HA non-inpatient service showed an increase in CAGR of 1.01% from 2016 to 2019 when all attendances were considered. However, if only consideredthose attendances with antimicrobial dispensed, CAGR reached 3.27%
• Overall 2.19% decrease in CAGR of attendance with antimicrobials dispensed was observedfrom 2016 to 2019 and decreases were observed among all non-inpatient services
• By service, Specialist Out-patient (Clinical) showed an increase in CAGR of 4.46% while Primary Care (GOPC) and Accident & Emergency showed increase of 1.39% and 1.15% respectively from 2016 to 2019 (only considered those attendances with antimicrobial dispensed)

22
Five Most Dispensed Antimicrobial Groups in Non-inpatient Service
ATC Pharmacological Subgroup DDD per 1,000 attendances Compound annual growth rate (16 to 19)*†Code Description
Year 2016*
Year 2017*
Year 2018*
Year 2019*
J01C Beta-lactam Antibacterials,
Penicillins 151.73 144.14 144.56 151.39 -0.07%
J01F Macrolides, Lincosamides
and Streptogramins 36.63 35.00 33.95 36.20 -0.39%
J01A Tetracyclines 22.36 23.23 26.15 30.09 10.41%
J01M Quinolone Antibacterials 22.14 21.34 21.53 21.48 -1.01%
J01X Other Antibacterials 12.56 11.85 11.17 11.63 -2.53%
Others 20.86 20.60 21.70 23.62 4.22%
Total 266.27 256.16 259.05 274.41 1.01% Note: The five most dispensed antimicrobial groups were identified from year 2019 data *Rounded to two decimal places†Due to rounding, percentages may not precisely reflect the absolute figures
• Beta-lactam Antibacterials, Penicillins group was the most dispensedgroup from 2016 to 2019
• Tetracyclines group showed the largest increase in CAGR of 10.41%from 2016 to 2019

23
Ten Most Dispensed Antimicrobials in Non-inpatient Service
24
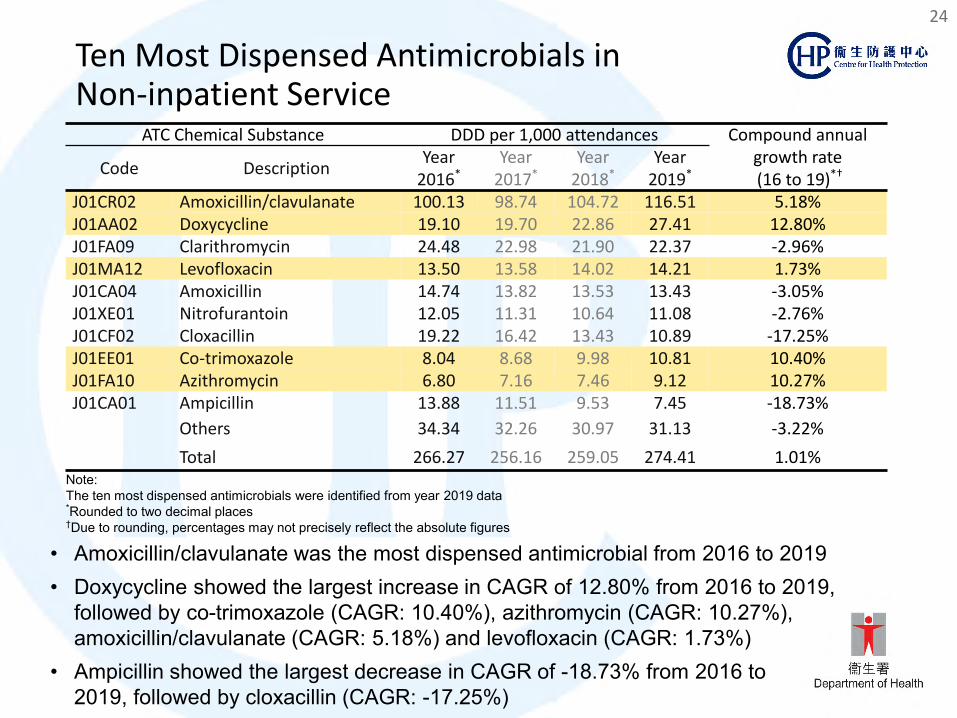
Ten Most Dispensed Antimicrobials in Non-inpatient Service
ATC Chemical Substance DDD per 1,000 attendances Compound an nual growth rate (16 to 19 )*†Code Description
Year 2016*
Year 2017*
Year 2018*
Year 2019*
J01CR02 Amoxicillin/clavulanate 100.13 116.51 5.18% J01AA02 Doxycycline 19.10 27.41 12.80% J01FA09 Clarithromycin 24.48 22.98 21.90 22.37 -2.96%J01MA12 Levofloxacin 13.50 14.21 1.73%J01CA04 Amoxicillin 14.74 13.82 13.53 13.43 -3.05%J01XE01 Nitrofurantoin 12.05 11.31 10.64 11.08 -2.76%J01CF02 Cloxacillin 19.22 16.42 13.43 10.89 -17.25%J01EE01 Co-trimoxazole 8.04 10.81 10.40%J01FA10 Azithromycin 6.80 9.12 10.27%J01CA01 Ampicillin 13.88 11.51 9.53 7.45 -18.73%
Others 34.34 32.26 30.97 31.13 -3.22%
Total 266.27 256.16 259.05 274.41 1.01%Note: The ten most dispensed antimicrobials were identified from year 2019 data *Rounded to two decimal places†Due to rounding, percentages may not precisely reflect the absolute figures
• Amoxicillin/clavulanate was the most dispensed antimicrobial from 2016 to 2019• Doxycycline showed the largest increase in CAGR of 12.80% from 2016 to 2019,
followed by co-trimoxazole (CAGR: 10.40%), azithromycin (CAGR: 10.27%),amoxicillin/clavulanate (CAGR: 5.18%) and levofloxacin (CAGR: 1.73%)
• Ampicillin showed the largest decrease in CAGR of -18.73% from 2016 to2019, followed by cloxacillin (CAGR: -17.25%)
104.72 22.86 19.70
98.74
13.58 14.02
7.46 8.68 9.98 7.16

25
Results 3. Antimicrobials dispensed in HA inpatient service by specialty

26
Total Antimicrobials Dispensed in HA Inpatient Service by Specialty

Total Antimicrobials Dispensed in HA Inpatient Service by Specialty
Year Medicine Surgery O&T ICU/HDU Others
All
Inpatient
Services
2016 DDD per 1,000 patient-days‡ 970.57 1220.10 858.00 1687.98 595.59 896.40
2017 DDD per 1,000 patient-days‡ 981.25 1225.26 845.91 1651.98 603.51 905.35
2018 DDD per 1,000 patient-days‡ 963.87 1250.22 812.59 1658.41 593.68 895.87
2019 DDD per 1,000 patient-days‡ 961.52 1261.29 800.37 1678.31 631.31 906.10 Compound
annual growth rate (16 to 19)
DDD per 1,000 patient-daysठ-0.31% 1.11% -2.29% -0.19% 1.96% 0.36%
27
‡Rounded to two decimal places §Due to rounding, percentages may not precisely reflect the absolute figures
• Total antimicrobials dispensed in HA inpatient service showed anincrease in CAGR of 0.36% from 2016 to 2019
• By specialty, ‘Others’ specialty showed the largest increase inCAGR of 1.96% from 2016 to 2019, while Orthopaedics &Traumatology showed the largest decrease in CAGR of -2.29%

28
Five Most Dispensed Antimicrobial Groups in Inpatient Service
ATC Pharmacological Subgroup DDD per 1,000 patient-days Compound annual growth rate (16 to 19)*†Code Description
Year 2016*
Year 2017*
Year 2018* Year 2019*
J01C Beta-lactam Antibacterials, Penicillins
529.12 537.11 522.80 522.34 -0.43%
J01D Other Beta-lactam Antibacterials
107.60 100.02 101.50 101.70 -1.86%
J01M Quinolone Antibacterials 93.29 93.48 92.93 87.84 -1.98%J01A Tetracyclines 40.69 51.13 60.10 74.43 22.30%
J01F Macrolides, Lincosamides and Streptogramins
52.43 50.24 43.98 44.42 -5.37%
Others 73.27 73.37 74.57 75.36 0.94%
Total 896.40 905.35 895.87 906.10 0.36%
Note: The five most dispensed antimicrobial groups were identified from year 2019 data *Rounded to two decimal places†Due to rounding, percentages may not precisely reflect the absolute figures
• Tetracyclines group was the only group among the five mostdispensed groups showed the largest increase in CAGR of 22.30%from 2016 to 2019
• Most groups showed a slight decrease (except Others), butmacrolides, lincosamides and streptogramins group showed thelargest decrease in CAGR of -5.37% from 2016 to 2019

29
Ten Most Dispensed Antimicrobials in Inpatient Service

30
Ten Most Dispensed Antimicrobials in Inpatient Service
ATC Pharmacological Subgroup DDD per 1,000 patient-days Compound annual growth rate (16 to 19)*†Code Description
Year 2016*
Year 2017*
Year 2018*
Year 2019*
J01CR02 Amoxicillin/clavulanate 413.56 423.55 417.86 418.20 0.37% J01AA02 Doxycycline 38.42 48.54 57.66 71.84 23.20% J01MA12 Levofloxacin 74.11 74.36 74.22 70.35 -1.72%J01CR05 Piperacillin/tazobactam 49.85 53.31 55.38 58.13 5.26%J01DD04 Ceftriaxone 23.98 24.01 24.84 24.86 1.21%J01DH02 Meropenem 17.36 18.77 22.99 23.21 10.16%J01DC02 Cefuroxime 35.13 28.13 23.02 21.49 -15.12%P01AB01/ J01XD01
Metronidazole 27.28 25.43 22.98 20.24 -9.47%
J01FA10 Azithromycin 18.78 21.29 18.60 19.72 1.64%J01CF02 Cloxacillin 29.51 25.98 20.45 19.11 -13.49%
Others 168.42 161.98 157.87 158.96 -1.91%
Total 896.40 905.35 895.87 906.10 0.36%Note: The ten most dispensed antimicrobials were identified from year 2019 data *Rounded to two decimal places†Due to rounding, percentages may not precisely reflect the absolute figures
• Amoxicillin/clavulanate was the most dispensed antimicrobial from 2016 to 2019• Doxycycline showed the largest increase in CAGR of 23.20% from 2016 to 2019,
followed by meropenem (CAGR: 10.16%), piperacillin/tazobactam (CAGR: 5.26%),azithromycin (CAGR: 1.64%) and then ceftriaxone (CAGR: 1.21%)
• Cefuroxime showed the largest decrease in CAGR of -15.12% from 2016 to 2019,followed by cloxacillin (CAGR: -13.49%)

31
Broad-spectrum Antimicrobials Dispensed in Inpatient Service

32
Broad-spectrum Antimicrobials Dispensed in Inpatient Service
ATC Chemical Substance DDD per 1,000 patient-days Compound annual growth rate
(16 to 19) * Code Description Year
2016 * Year
2017 * Year
2018 * Year
2019 *
Beta-lactam Antibacterials, Penicillins
J01CR05 Piperacillin/tazobactam 49.85 53.31 55.38 58.13 5.26%
Other Beta-lactam Antibacterials (Cephalosporins)†
J01DD02 Ceftazidime 3.31 3.27 3.65 4.08 7.23%
J01DD62 Cefoperazone/sulbactam 4.47 3.88 3.85 3.65 -6.57%
J01DE01 Cefepime 1.65 1.84 2.35 2.69 17.73% J01DI02 Ceftaroline fosamil 0.18 0.31 0.30 0.34 22.88%
J01DI54 Ceftolozane/tazobactam <0.005 0.03 0.11 0.14 Not applicable §
J01DD52 Ceftazidime/avibactam - - <0.005 0.10 -
J01DH02 Meropenem 17.36 18.77 22.99 23.21 10.16% J01DH03 J01DH51
Ertapenem Imipenem/cilastatin
5.97 6.26 6.74 6.98 1.29 1.07 0.92 0.86
5.38% -12.78%
J01XA01 Vancomycin 13.26 13.84 15.12 15.46 5.26% J01XX08 Linezolid 1.71 1.63 1.64 1.89 3.46%
Other Antibacterials J01XX09 Daptomycin 0.84 1.13 1.17 1.33 16.43% J01XB01 Colistin 0.69 0.60 0.54 0.62 -3.36%J01XA02 Teicoplanin 0.07 <0.005 0.01 <0.005 -78.47%
Total 100.64 105.97 114.76 119.48 5.89% *Rounded to two decimal places†WHO ATC Pharmacological subgroup "Other Beta-lactam Antibacterials (J01D)" is further categorized into Cephalosporins and Carbapenems groups§ Ceftolozane/tazobactam was listed in the HA drug formulary since April 2019, it was supplied on named patient basis before enlistment
• The increase in CAGR was 5.89% from 2016 to 2019• Piperacillin/tazobactam was the most dispensed broad-spectrum antimicrobial from 2016
to 2019, followed by meropenem and then vancomycin• Ceftaroline fosamil showed the largest increase in CAGR of 22.88% from 2016 to 2019,
followed by cefepime (17.73%), daptomycin (16.43%), meropenem (10.16%) and thenceftazidime (7.23%)
Other Beta-lactam Antibacterials (Carbapenems)†

33
Broad-spectrum Antimicrobials Dispensed in Inpatient Service by Specialty
• By specialty, all specialties of inpatient service showed asteady increase of usage of the overall selected broadspectrum antimicrobials from 2016 to 2019 except ICU/HDU

34
Broad-spectrum Antimicrobials Dispensed in Inpatient Service by Specialty
Specialty
DDD per 1,000 patient-days Compound annual growth rate (16 to 19)*†
Year 2016*
Year 2017*
Year 2018*
Year 2019*
Medicine 130.19 136.18 147.66 150.86 5.03% Surgery 103.45 110.56 123.78 130.34 8.00%
Orthopaedics & Traumatology 58.94 62.39 67.07 70.97 6.38% ICU/HDU 524.94 528.31 521.75 530.14 0.33% Others 48.94 51.72 54.84 59.82 6.92% All Inpatient Services 100.64 105.97 114.76 119.48 5.89%
*Rounded to two decimal places†Due to rounding, percentages may not precisely reflect the absolute figures
• By specialty, ICU/ HDU was the specialty with largest quantity ofbroad-spectrum antimicrobials dispensed from 2016 to 2019,followed by Medicine, Surgery, O&T and Others
• Dispensing of broad-spectrum antimicrobials in Surgery showed thelargest increase in CAGR of 8.00% from 2016 to 2019, followed byOthers (6.92%), Orthopaedics & Traumatology (6.38%) and thenMedicine (5.03%). ICU/HDU only had 0.33% increase in CAGR

35
Remarks on interpretation of results
• DDD is a technical unit of use that does not necessarily reflect the recommended or average prescribed dose
• There are no separate DDDs for children which makes the DDD estimates for paediatric formulations more difficult to interpret
• The amount of antimicrobials dispensed was used as a proxy for the amount consumed
• The surveillance results cannot be used to judge the appropriateness of usage in the absence of the relevant clinical information
* WHO ATC 2019 version was adopted for DDD calculation
36
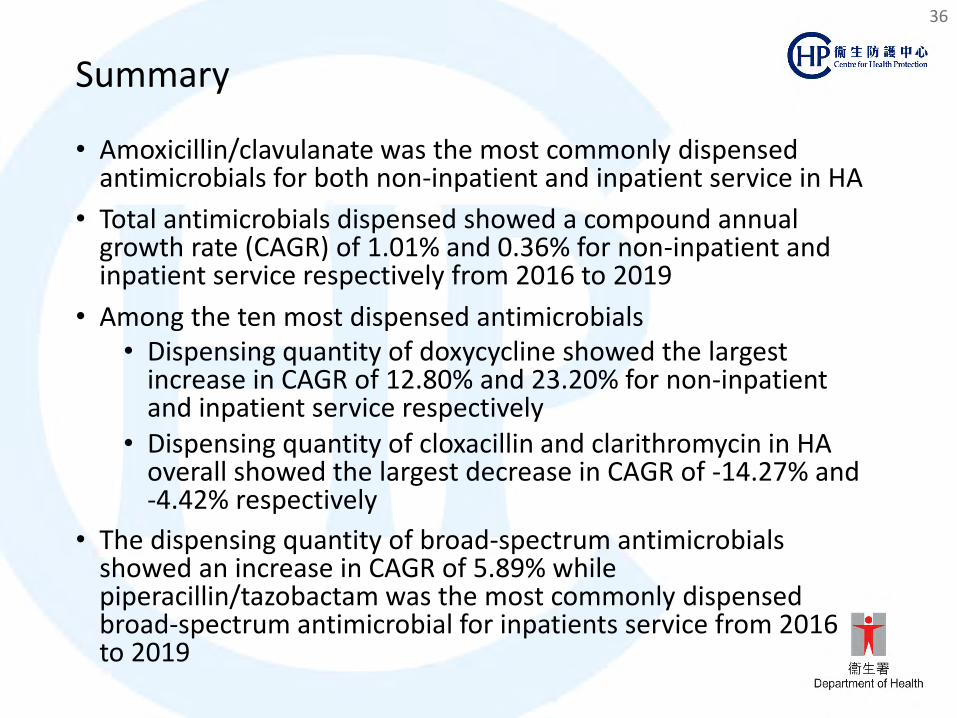
Summary
• Amoxicillin/clavulanate was the most commonly dispensed antimicrobials for both non-inpatient and inpatient service in HA
• Total antimicrobials dispensed showed a compound annual growth rate (CAGR) of 1.01% and 0.36% for non-inpatient and inpatient service respectively from 2016 to 2019
• Among the ten most dispensed antimicrobials • Dispensing quantity of doxycycline showed the largest
increase in CAGR of 12.80% and 23.20% for non-inpatient and inpatient service respectively
• Dispensing quantity of cloxacillin and clarithromycin in HA overall showed the largest decrease in CAGR of -14.27% and -4.42% respectively
• The dispensing quantity of broad-spectrum antimicrobials showed an increase in CAGR of 5.89% while piperacillin/tazobactam was the most commonly dispensed broad-spectrum antimicrobial for inpatients service from 2016 to 2019

37
Recommendations
• An increase in total antimicrobials dispensed necessitates tohave Antibiotics Stewardship Programmes (ASP) in place tomonitor and promote optimisation of antimicrobial usage atvarious levels
• Findings in relation to dispensing of doxycycline (sharpestincrease among the top 10 most commonly dispensedantibiotics) and piperacillin/tazobactam (the mostcommonly dispensed broad spectrum antimicrobial) wouldwarrant further exploration

38
THE END Thank you