host cell protein analysis by mass spectrometry and its application...
TRANSCRIPT

Host cell protein analysis by mass spectrometry and its application in a comparability exercise
Florian Wolschin, Martin Schiestl
CMC Strategy Forum, Washington, 26. Jan 2015

2 | 26 Jan 2015
Topics
Introduction
Use of mass spectrometry in HCP analysis
Application in a comparability exercise
Role of mass spectrometry versus ELISA in HCP analysis
• Comparability following a manufacturing change
• Biosimilar exercise
2

3 | 26 Jan 2015
Host Cell Proteins (HCP)
including modifications
Source: Animal cell. Wikimedia Commons, author: Mediran.
The cell
4 | 26 Jan 2015
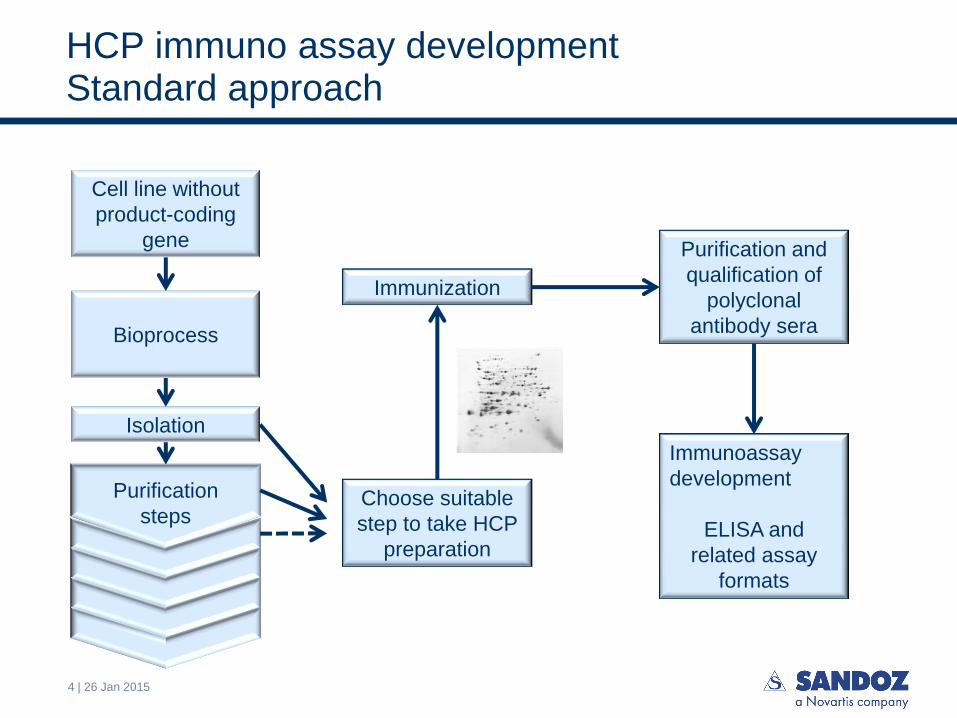
HCP immuno assay development Standard approach
Cell line without
product-coding
gene
Bioprocess
Isolation
Choose suitable
step to take HCP
preparation
Purification
steps
Immunization
Purification and
qualification of
polyclonal
antibody sera
Immunoassay
development
ELISA and
related assay
formats

5 | 26 Jan 2015
LC-MS in HCP analysis
LTQ OrbitrapTM Q-ExactiveTM
Mass spectrometry allows the identification of low abundant
proteins in complex mixtures
• Increasing use of LC-MS techniques in HCP analysis
• Ongoing progress in increasing sensitivity and mass accuracy

6 | 26 Jan 2015
Analysis of proteins in complex mixtures Database search concept
Protein
Protein Digestion
7 | 26 Jan 2015
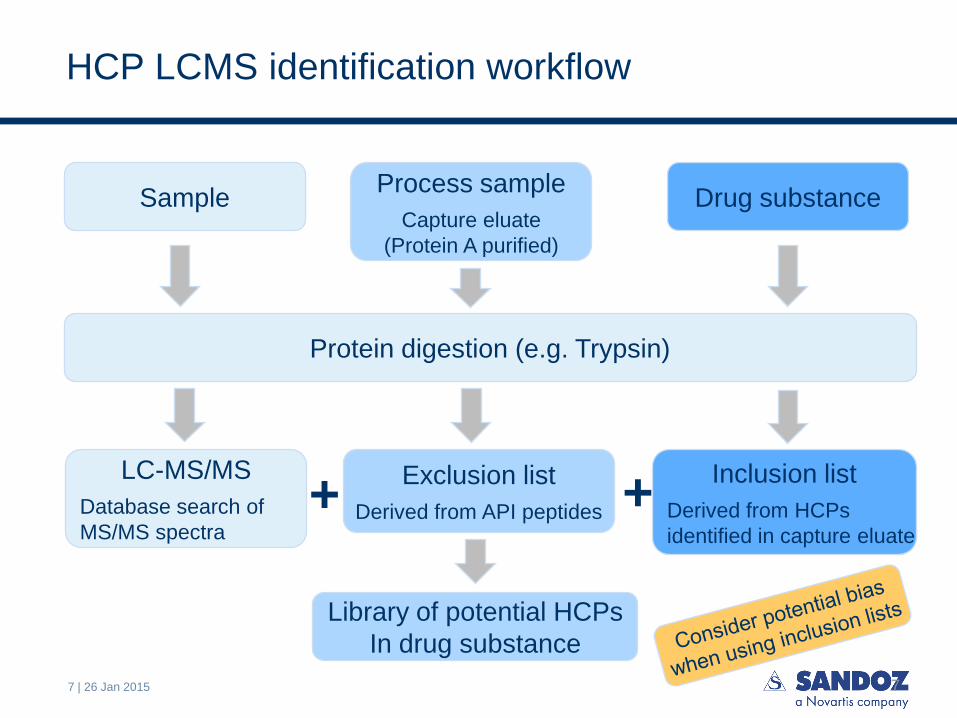
HCP LCMS identification workflow
7
Sample
Protein digestion (e.g. Trypsin)
LC-MS/MS
Database search of
MS/MS spectra
Process sample
Capture eluate
(Protein A purified)
Drug substance
Exclusion list
Derived from API peptides
Inclusion list
Derived from HCPs
identified in capture eluate
Library of potential HCPs
In drug substance
+ +

8 | 26 Jan 2015
Effect of using exclusion and inclusion lists
Increase of detectability

9 | 26 Jan 2015
How reliable are the identifications? MS/MS spectra verification with synthetic peptides
V. Reisinger, H. Toll, R.E. Mayer, J. Visser, F. Wolschin, Analytical Biochemistry 463 (2014) 1-6.

10 | 26 Jan 2015
HCP analysis in a comparability exercise
Case: Exchange of the depth filter in the manufacturing process
ELISA results showed comparable levels of HCP in the drug substance batches before and after the filter change
LC-MS/MS using inclusion and exclusion lists
• Pre- and post change batches were analyzed for HCPs using automatic identification
• In addition, all HCPs automatically identified in one of the two sample sets were manually checked for their presence in the other
10 V. Reisinger, H. Toll, R.E. Mayer, J. Visser, F. Wolschin, Analytical Biochemistry 463 (2014) 1-6.

11 | 26 Jan 2015
HCP analysis in a comparability exercise
X ... Identified by automatic analysis
(X) ... Identified by manual analysis
11
Protein Identified before
filter change
Identified after
filter change
Protein S100-A10 X X
Protein S100-A4 X X
Protein S100-A11 X (X)
Protein S100-A6 X (X)
Anionic trypsin-2 X (X)
Thioredoxin X X
Galectin-1 X (X)
V. Reisinger, H. Toll, R.E. Mayer, J. Visser, F. Wolschin, Analytical Biochemistry 463 (2014) 1-6.

12 | 26 Jan 2015
Exemplary HCP quantification results
Batches before filter change
Batches after filter change
Arb
itra
ry u
nit
s
Arb
itra
ry u
nit
s

13 | 26 Jan 2015
Quantification workflow
LC-MS/MS with accurate mass
(Q-Exactive)
Semi-automated data evaluation for identification
and quantification. De novo sequencing possible.
Manual verification of identification and integration
Quantification of peptides using targeted MS/MS

14 | 26 Jan 2015
y = 51790x - 210171R² = 0.982
0
5000000
10000000
15000000
20000000
25000000
0 100 200 300 400 500
Manual versus automated quantitative analysis Standard protein spicked into DS
Manual
Arb
itra
ry u
nit
s
y = 7110.9x + 50667R² = 0.9695
0
500000
1000000
1500000
2000000
2500000
3000000
3500000
4000000
-100 0 100 200 300 400 500
Automated
Arb
itra
ry u
nit
s
y = 61110x - 687950 R² = 0.9775
-1000000
0
1000000
2000000
3000000
4000000
5000000
6000000
7000000
0 20 40 60 80 100 120
[ng/mg] [ng/mg]
[ng/mg]

15 | 26 Jan 2015
Poor correlation of ELISA and quantitative MS
0.00
0.10
0.20
0.30
0.40
0.50
0.60
0.70
0.80
0.90
1 2 3 4 5 6 7 8 9 10 11 12 13 14 15 16 17
Co
rrela
tio
n v
alu
e E
LIS
A/M
S
HCPs
Pearson
Spearman
MS
ELISA
Exemplary graphs
HCP #13
HCP #2
Possible reasons
• Narrow HCP distribution in process samples
• Method variability
• Complementary HCP recognition

16 | 26 Jan 2015
Physicochemical HCP properties
Attribute Median CapE HCPs (n=48) Median DS HCPs (n=8) p-value
pI 5.59 5.49 0.9862
mw [Da] 50651.88 20297.51 0.0662
GRAVY -0.25 -0.37 0.2079
Attribute Median CapE HCPs (n=33) Median DS HCPs (n=7) p-value
pI 5.55 5.49 0.9931
mw [Da] 41991.88 11239.58 0.0009
GRAVY -0.25 -0.25 0.6564
Attribute Median CapE HCPs (n=24) Median DS HCPs (n=3) p-value
pI 5.49 5.23 0.9891
mw [Da] 41867.28 11239.58 0.0304
GRAVY -0.34 -0.33 0.5227
Samples after filter change
Proof of principle samples
Samples before filter change
V. Reisinger, H. Toll, R.E. Mayer, J. Visser, F. Wolschin, Analytical Biochemistry 463 (2014) 1-6.

17 | 26 Jan 2015
Role of MS versus ELISA
ELISA is the assay of choice for routine analysis
• Precise and sensitive assay format
• Provides relative but no absolute quantitative results
• Due to HCP-specific immunogenicity some HCPs may react stronger than others
• Despite some limitations, history demonstrated the appropriateness of HCP control by well developed ELISAs
MS complements ELISA
• Identification and quantification of single HCPs
• Capture more abundant HCPs in process samples and drug substance
17

18 | 26 Jan 2015
Role of MS versus ELISA
Comparability exercises following manufacturing process changes
• ELISA is the routine tool to compare HCP clearance before and after the change
• MS provides characterization data for the more abundant HCPs
– Useful addition for risk mitigation or trouble shooting
Biosimilar exercises
• HCP is a process related feature
• A biosimilar company needs to justify adequate low levels of HCPs for their own process
– Different processes may result in different HCPs
– Therefore, a direct comparison with the reference product is normally not useful
• HCP-ELISA needs to be qualified for a specific process and is not suitable to compare HCPs load of products resulting from differently developed manufacturing processes
18
19 | 26 Jan 2015
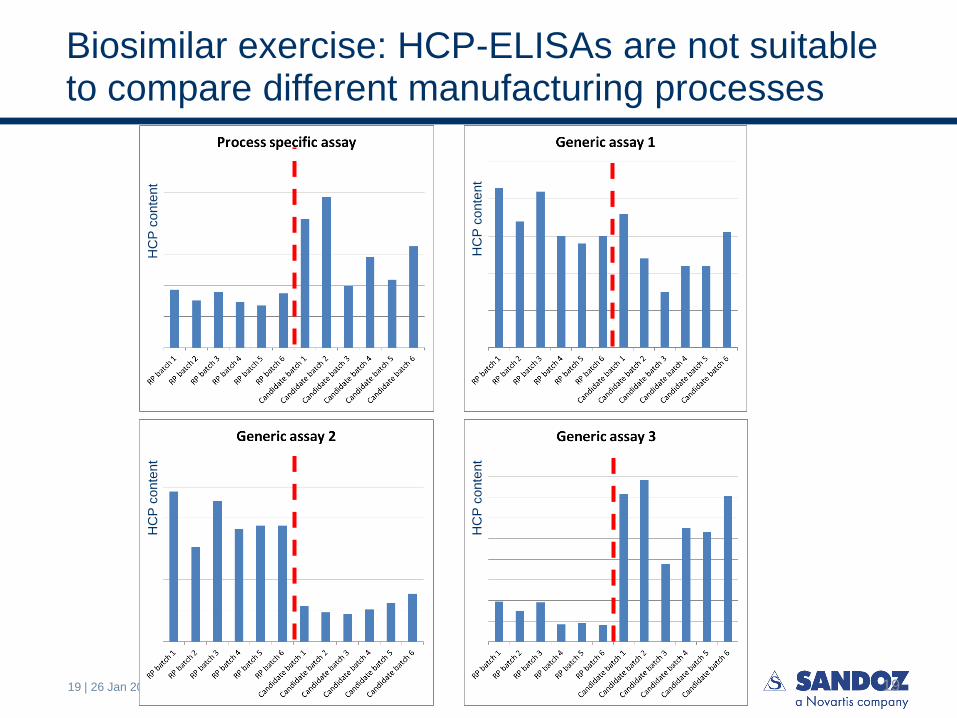
Biosimilar exercise: HCP-ELISAs are not suitable to compare different manufacturing processes
19
HC
P c
onte
nt
HC
P c
onte
nt
HC
P c
onte
nt
HC
P c
onte
nt
20 | 26 Jan 2015
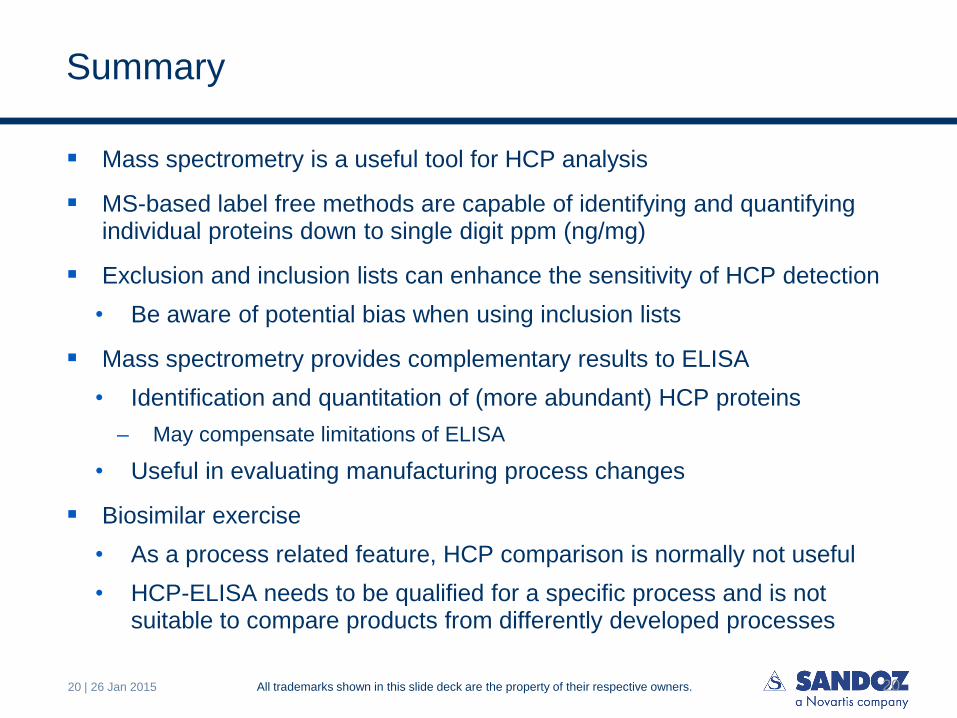
Summary
Mass spectrometry is a useful tool for HCP analysis
MS-based label free methods are capable of identifying and quantifying individual proteins down to single digit ppm (ng/mg)
Exclusion and inclusion lists can enhance the sensitivity of HCP detection
• Be aware of potential bias when using inclusion lists
Mass spectrometry provides complementary results to ELISA
• Identification and quantitation of (more abundant) HCP proteins
– May compensate limitations of ELISA
• Useful in evaluating manufacturing process changes
Biosimilar exercise
• As a process related feature, HCP comparison is normally not useful
• HCP-ELISA needs to be qualified for a specific process and is not suitable to compare products from differently developed processes
20 All trademarks shown in this slide deck are the property of their respective owners.