host-guest complexation driven dynamic …host-guest complexation driven dynamic supramolecular...
TRANSCRIPT

Host-Guest Complexation Driven Dynamic Supramolecular Self-Assembly
Huacheng Zhang,a Kim Truc Nguyen,
a Xing Ma,
b Hong Yan,
a Junfei Guo,
a Liangliang Zhu
a and
Yanli Zhao*a,b
a Division of Chemistry and Biological Chemistry, School of Physical and Mathematical Sciences,
Nanyang Technological University, 21 Nanyang Link, 637371 Singapore
b School of Materials Science and Engineering, Nanyang Technology University, 639798
Singapore
*Correspondence Address
Professor Yanli Zhao
Division of Chemistry and Biological Chemistry
School of Physical and Mathematical Sciences
Nanyang Technological University
21 Nanyang Link, 637371, Singapore
Email: [email protected]
Electronic Supplementary Material (ESI) for Organic & Biomolecular ChemistryThis journal is © The Royal Society of Chemistry 2012

S1
General Methods
Organic reagents were purchased from Aldrich and used without further purification. All the
solvents and inorganic reagents were commercially available. Me2CO was dried with anhydrous
MgSO4 before uses. 1,4-Dimethoxypillar[5]arene (Dmpillar)[S1]
and azido-pillar[5]arene (3)[S2]
were synthesized according to the literature procedures. UV-vis spectra were recorded with
Shimadzu UV-3600 UV-Vis-NIR spectrophotometer at 298 K. The emission spectra were
recorded on a Varian Cary Eclipse fluorescence spectrophotometer (Exited at 488 nm). Cyclic
voltammetry (CV) was performed on a GAMRY Reference 600 potentiostat / galvanostat / ZRA
system with a three electrode cell in a Me2CO solution containing tetrabutylammonium
hexafluorophosphate (TBAPF6, 0.01 mM) at a scan rate of 200 mV s-1
. A Pt disk (d = 2 mm) was
used as the working electrode, a Pt wire was used as the counter electrode, and a Ag / AgCl
(saturated with KCl) electrode was used as the reference electrode. The stock solutions (10-1
mol•L-1
and 10-3
mol•L-1
) of the complexes 1•2 and DMpillar•2 were prepared with anhydrous
Me2CO. All the sample solutions for the investigation of the critical assembly concentration were
freshly prepared by diluting the stock solutions according to literature procedures.[S3]
1H nuclear magnetic resonance (
1H NMR) spectra were recorded at room temperature on Bruker
Avance 300 with working frequencies of 300 MHz for 1H and 75 MHz for
13C nuclei. Variable
temperature 1H NMR, variable concentration
1H NMR and
1H NOESY NMR were recorded on a
BBFO 400 spectrometer. Chemical shifts were reported in ppm relative to the signals
corresponding to the residual non-deuterated solvent (Me2CO: 2.09 ppm), and coupling constants
were recorded in Hertz (Hz). All 13
C NMR spectra were recorded with the simultaneous
decoupling of 1H nuclei. The following abbreviations were used to explain the multiplicities: s,
Electronic Supplementary Material (ESI) for Organic & Biomolecular ChemistryThis journal is © The Royal Society of Chemistry 2012

S2
singlet; d, doublet; t, triplet; b, broad peaks; m, multiplet or overlapping peaks. The high resolution
time-of-flight mass spectrometry (TOFMS) was performed on a Waters Q-tof Premier MS
spectrometer.
Negative-stained TEM images was recorded on a JEM 1400 electron microscope (120 kV)
equipped with slow scan CCD and using cold cathode field emission as the gun. The samples for
negative-stained TEM were prepared by dropping a droplet of the orange sample solution onto a
TEM grid (copper grid, 300 meshes, coated with carbon film), immediately followed by staining
with 1% sodium phosphotungstate in H2O (about 2 L) and allowing to air-dry. SEM images were
obtained on a JSM 6340 scanning electron microscope (0.5—30 kV) equipped with Cold cathode
FEG as electron source. Fluorescent microscopy images were recorded by using Nikon confocal
microscope. DLS measurements were carried out with a Zetasizer Nano ZS instrument from
Malvern Instruments Ltd. at 298 K using a 633 nm ‘red’ laser. The mean hydrodynamic size was
calculated with Zetasizer software.
Electronic Supplementary Material (ESI) for Organic & Biomolecular ChemistryThis journal is © The Royal Society of Chemistry 2012

S3
Syntheses of Compounds 1 and 2
1: Tripropargylamine (14.0 mg, 0.11 mmol), 3 (270 mg, 0.33 mmol), tetrakis(acetonitrile)
copper(I) hexafluorophosphate (12.3 mg, 0.033 mmol), and tris[(1-benzyl-1H-1,2,3-triazol-4-
yl)methyl] amine (TBTA) were dissolved in Me2CO (20 mL). The mixture solution was stirred
under reflux for 2 d. The solution was then poured into H2O (200 mL). The aqueous phase was
extracted (3 × 200 mL) with CH2Cl2. The combined organic layers were dried (Mg2SO4) and the
solvent was removed in vacuum. The mixture was subjected to column chromatography (SiO2,
gradient elution from 2% up to 7% MeOH in CH2Cl2) to afford 1 (255.1 mg) in 91% yield. 1H
NMR (300 MHz, d-acetone): δ = 7.34 (s, 1H), 6.88-6.84 (m, 10H), 4.80 (s, 2H), 4.29 (s, 2H), 3.72
(s, 42H). 13
C NMR (75 MHz, d-acetone): δ =150.9, 150.4, 148.8, 129.2, 128.5, 128.2, 128.0, 127.9,
120.1, 113.5, 55.0, 52.2, 48.8. HR-MS (ESI): C147H163N10O30 calcd for m/z = 2549.1507, found m/z
= 2549.1497 [M + H]+.
2: The compound 2 was synthesized according to the reported method.[S4]
1H NMR (300 MHz, d-
acetone): δ = 9.38 (t, J = 6 Hz, 8H), 8.81 (d, J = 6 Hz, 8H), 4.95 (t, J = 6 Hz, 4H), 4.76 (s, 6H),
2.24 (s, 4H), 1.61 (s, 4H). 13
C NMR (75 MHz, d-acetone): δ = 152.9, 149.8, 149.0 146.6, 145.9
Electronic Supplementary Material (ESI) for Organic & Biomolecular ChemistryThis journal is © The Royal Society of Chemistry 2012

S4
126.9, 62.0, 48.5, 30.7, 25.8. HR-MS (ESI): C28H34N4F18P3 calcd for m/z = 861.1709, found m/z =
861.1724 [M]+.
Fig. S1 1H NMR spectra (400 MHz, room temperature) of (upper) DMpillar[5]arene and 2 with a
2:1 molar ratio (1 mM) and (down) pure 2 in CD2Cl2. The compound 2 has a poor solubility in
CD2Cl2.
Fig. S2 1H NMR spectra (400 MHz, room temperature) of DMpillar[5]arene and 2 with a 2:1
molar ratio (1 mM), pure 2, and pure DMpillar[5]arene in MeCN-d3. No chemical shifts can be
observed in MeCN-d3 even after 24h.
Electronic Supplementary Material (ESI) for Organic & Biomolecular ChemistryThis journal is © The Royal Society of Chemistry 2012

S5
Fig. S3 1H NMR spectra (400 MHz, room temperature) of compound 2, DMpillar[5]arene, and the
complex of DMpillar[5]arene with 2 in 1:1 or 1:2 molar ratio (1 mM) in Me2CO-d6 with full (up)
and selected area (bottom).
Electronic Supplementary Material (ESI) for Organic & Biomolecular ChemistryThis journal is © The Royal Society of Chemistry 2012
S6
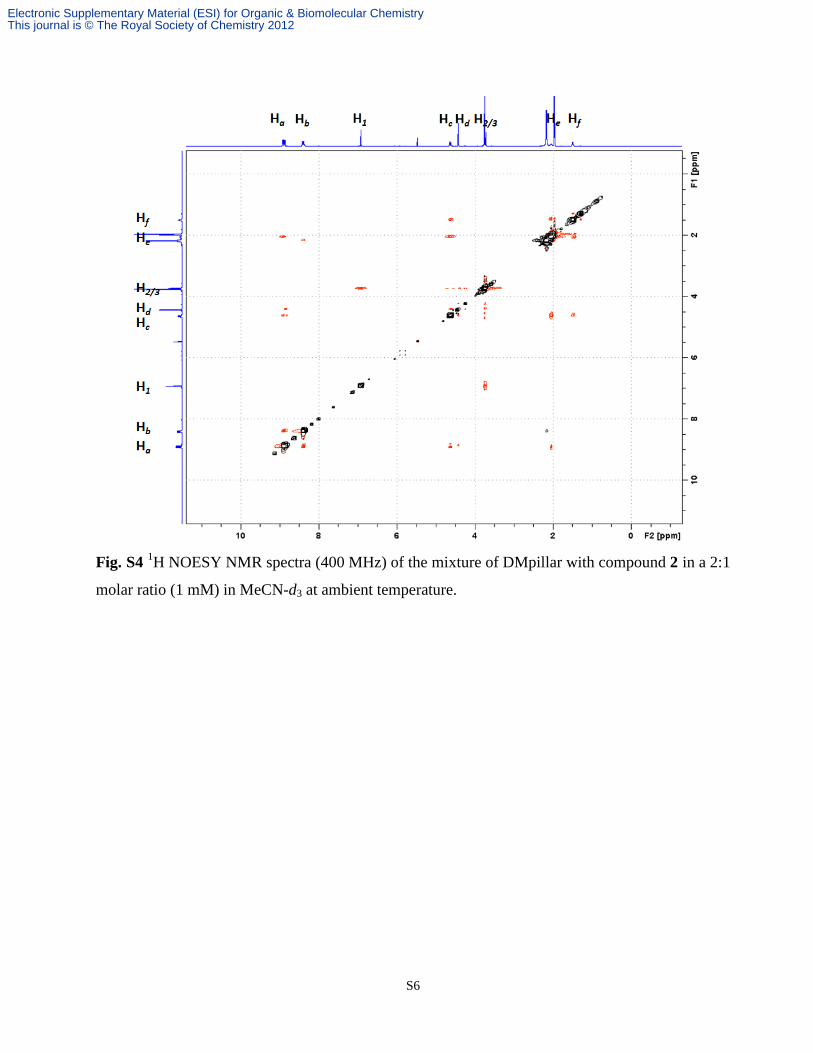
Fig. S4 1H NOESY NMR spectra (400 MHz) of the mixture of DMpillar with compound 2 in a 2:1
molar ratio (1 mM) in MeCN-d3 at ambient temperature.
Electronic Supplementary Material (ESI) for Organic & Biomolecular ChemistryThis journal is © The Royal Society of Chemistry 2012

S7
Electronic Supplementary Material (ESI) for Organic & Biomolecular ChemistryThis journal is © The Royal Society of Chemistry 2012
S8
Electronic Supplementary Material (ESI) for Organic & Biomolecular ChemistryThis journal is © The Royal Society of Chemistry 2012
S9
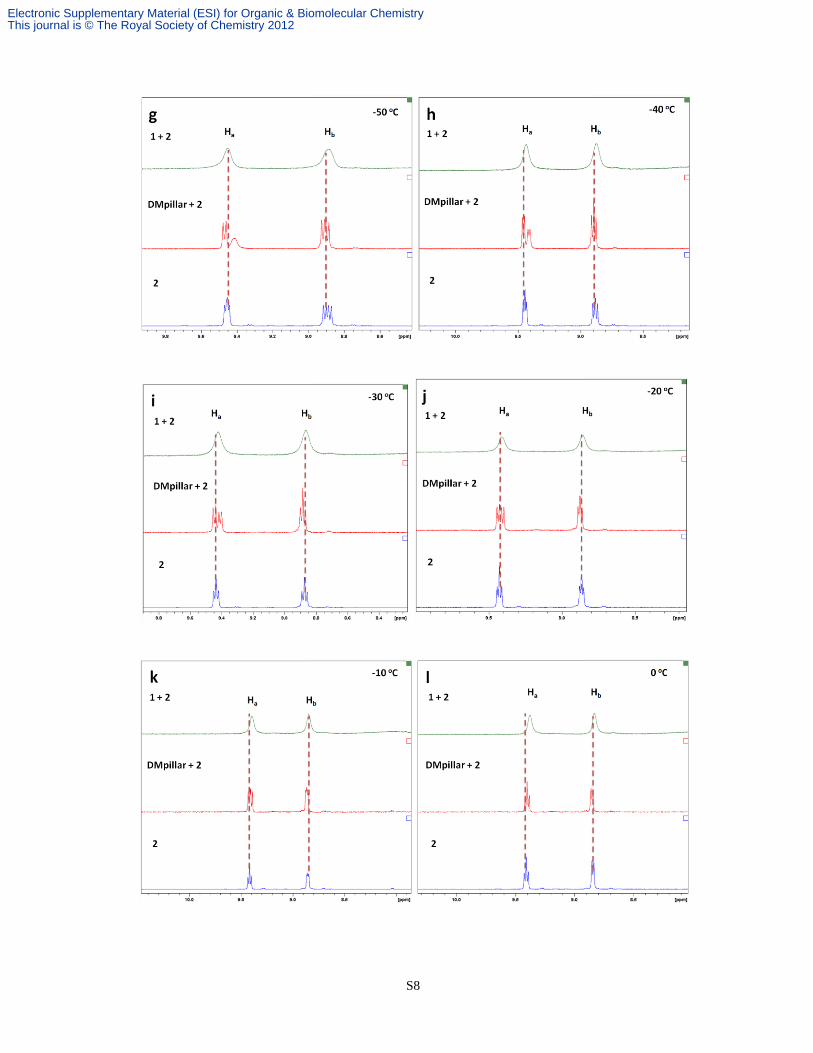
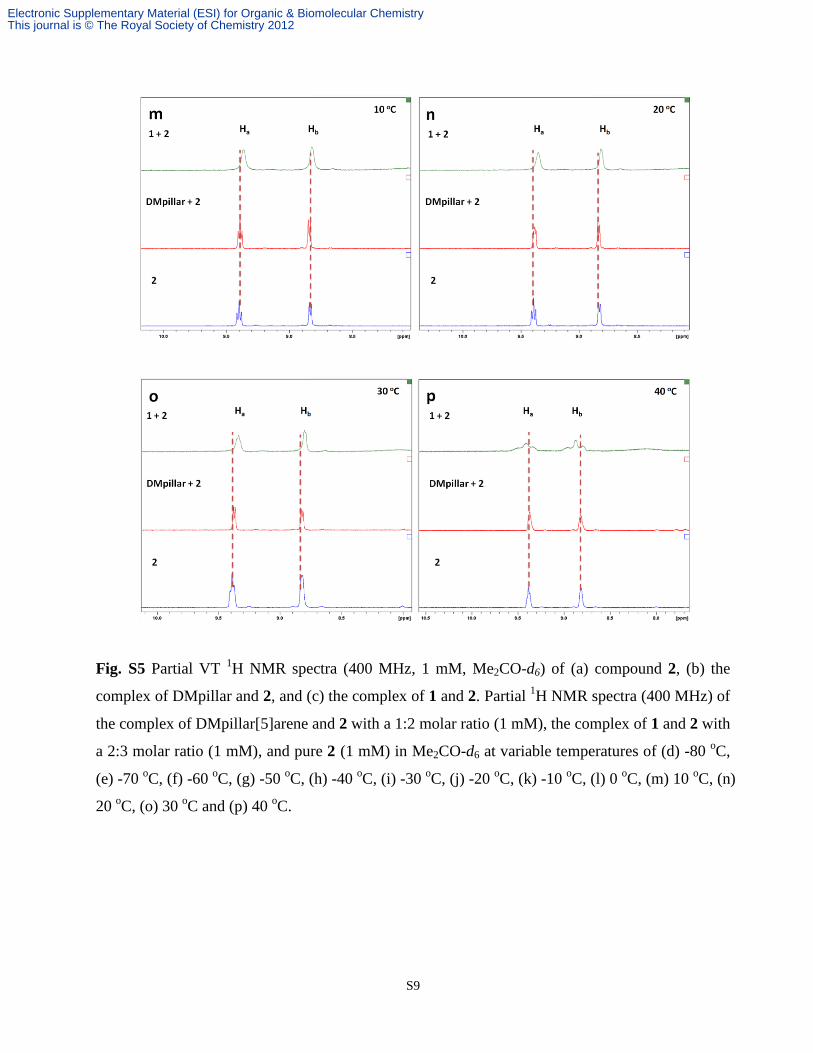
Fig. S5 Partial VT 1H NMR spectra (400 MHz, 1 mM, Me2CO-d6) of (a) compound 2, (b) the
complex of DMpillar and 2, and (c) the complex of 1 and 2. Partial 1H NMR spectra (400 MHz) of
the complex of DMpillar[5]arene and 2 with a 1:2 molar ratio (1 mM), the complex of 1 and 2 with
a 2:3 molar ratio (1 mM), and pure 2 (1 mM) in Me2CO-d6 at variable temperatures of (d) -80 oC,
(e) -70 oC, (f) -60
oC, (g) -50
oC, (h) -40
oC, (i) -30
oC, (j) -20
oC, (k) -10
oC, (l) 0
oC, (m) 10
oC, (n)
20 oC, (o) 30
oC and (p) 40
oC.
Electronic Supplementary Material (ESI) for Organic & Biomolecular ChemistryThis journal is © The Royal Society of Chemistry 2012

S10
Fig. S6 Full VT 1H NMR spectra (400 MHz) of the compound 2 (1mM) in Me2CO-d6 at variable
temperatures.
Fig. S7 Full VT 1H NMR spectra (400 MHz) of the complex of DMpillar with compound 2 (1 mM)
in a 2:1 molar ratio in Me2CO-d6 at variable temperatures.
Electronic Supplementary Material (ESI) for Organic & Biomolecular ChemistryThis journal is © The Royal Society of Chemistry 2012
S11
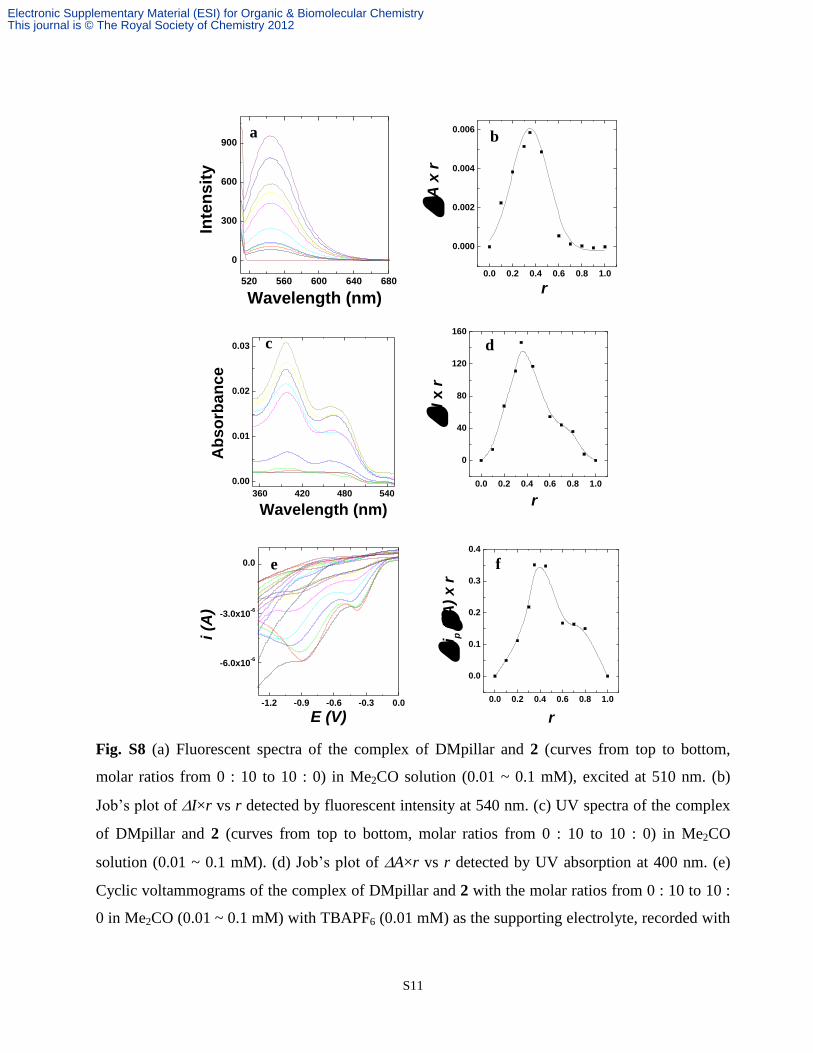
Fig. S8 (a) Fluorescent spectra of the complex of DMpillar and 2 (curves from top to bottom,
molar ratios from 0 : 10 to 10 : 0) in Me2CO solution (0.01 ~ 0.1 mM), excited at 510 nm. (b)
Job’s plot of I×r vs r detected by fluorescent intensity at 540 nm. (c) UV spectra of the complex
of DMpillar and 2 (curves from top to bottom, molar ratios from 0 : 10 to 10 : 0) in Me2CO
solution (0.01 ~ 0.1 mM). (d) Job’s plot of A×r vs r detected by UV absorption at 400 nm. (e)
Cyclic voltammograms of the complex of DMpillar and 2 with the molar ratios from 0 : 10 to 10 :
0 in Me2CO (0.01 ~ 0.1 mM) with TBAPF6 (0.01 mM) as the supporting electrolyte, recorded with
520 560 600 640 680
0
300
600
900
Inte
ns
ity
Wavelength (nm)
0.0 0.2 0.4 0.6 0.8 1.0
0.000
0.002
0.004
0.006
A
x r
r
360 420 480 540
0.00
0.01
0.02
0.03
Ab
so
rba
nce
Wavelength (nm)
0.0 0.2 0.4 0.6 0.8 1.0
0
40
80
120
160
I x
r
r
-1.2 -0.9 -0.6 -0.3 0.0
-6.0x10⁻⁶
-3.0x10⁻⁶
0.0
i (A
)
E (V)
0.0 0.2 0.4 0.6 0.8 1.0
0.0
0.1
0.2
0.3
0.4
i
p (A
) x
r
r
a b
c d
e f
Electronic Supplementary Material (ESI) for Organic & Biomolecular ChemistryThis journal is © The Royal Society of Chemistry 2012
S12
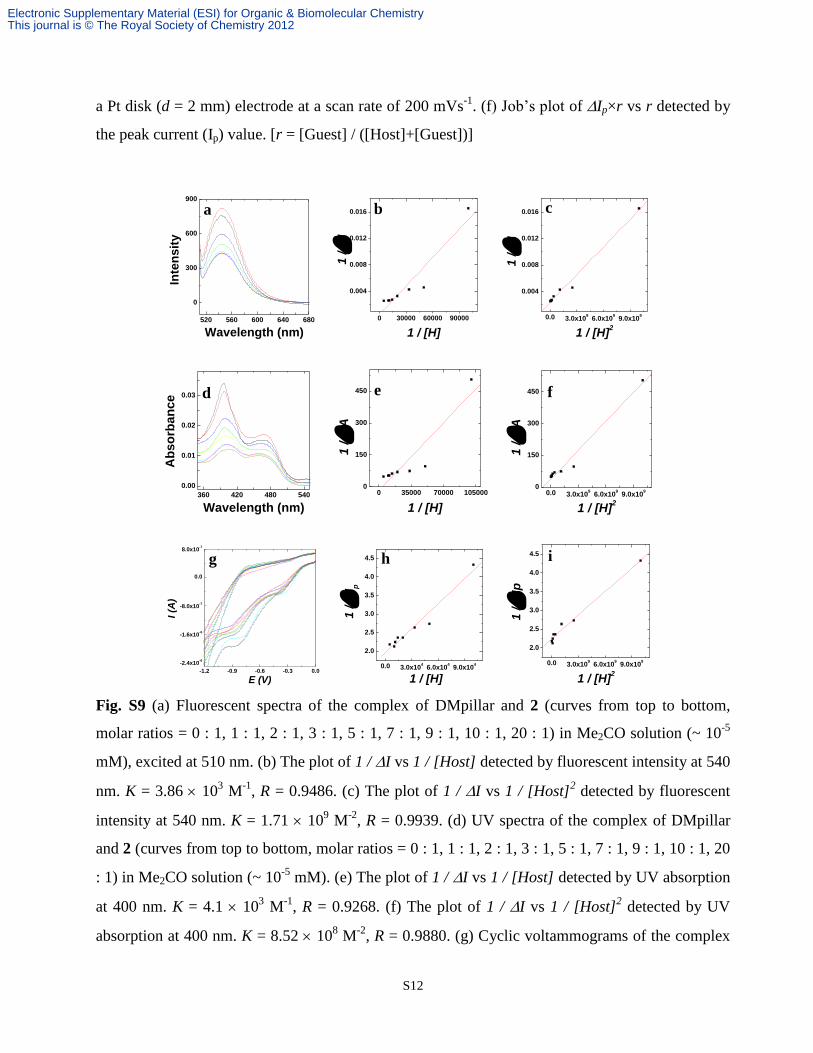
a Pt disk (d = 2 mm) electrode at a scan rate of 200 mVs-1
. (f) Job’s plot of Ip×r vs r detected by
the peak current (Ip) value. [r = [Guest] / ([Host]+[Guest])]
Fig. S9 (a) Fluorescent spectra of the complex of DMpillar and 2 (curves from top to bottom,
molar ratios = 0 : 1, 1 : 1, 2 : 1, 3 : 1, 5 : 1, 7 : 1, 9 : 1, 10 : 1, 20 : 1) in Me2CO solution (~ 10-5
mM), excited at 510 nm. (b) The plot of 1 / I vs 1 / [Host] detected by fluorescent intensity at 540
nm. K = 3.86 103 M
-1, R = 0.9486. (c) The plot of 1 / I vs 1 / [Host]
2 detected by fluorescent
intensity at 540 nm. K = 1.71 109 M
-2, R = 0.9939. (d) UV spectra of the complex of DMpillar
and 2 (curves from top to bottom, molar ratios = 0 : 1, 1 : 1, 2 : 1, 3 : 1, 5 : 1, 7 : 1, 9 : 1, 10 : 1, 20
: 1) in Me2CO solution (~ 10-5
mM). (e) The plot of 1 / I vs 1 / [Host] detected by UV absorption
at 400 nm. K = 4.1 103 M
-1, R = 0.9268. (f) The plot of 1 / I vs 1 / [Host]
2 detected by UV
absorption at 400 nm. K = 8.52 108 M
-2, R = 0.9880. (g) Cyclic voltammograms of the complex
520 560 600 640 680
0
300
600
900
Inte
ns
ity
Wavelength (nm)
0 30000 60000 90000
0.004
0.008
0.012
0.016
1 /
I
1 / [H]
0.0 3.0x10⁹
6.0x10⁹
9.0x10⁹
0.004
0.008
0.012
0.016
1 /
I
1 / [H]2
360 420 480 540
0.00
0.01
0.02
0.03
Ab
so
rba
nc
e
Wavelength (nm)
0 35000 70000 1050000
150
300
450
1 /
A
1 / [H]
0.0 3.0x10⁹
6.0x10⁹
9.0x10⁹
0
150
300
450
1 /
A
1 / [H]2
-1.2 -0.9 -0.6 -0.3 0.0
-2.4x10⁻⁶
-1.6x10⁻⁶
-8.0x10⁻⁷
0.0
8.0x10⁻⁷
I (A
)
E (V)
0.0 3.0x10⁴
6.0x10⁴
9.0x10⁴
2.0
2.5
3.0
3.5
4.0
4.5
1 /
Ip
1 / [H]
0.0 3.0x10⁹
6.0x10⁹
9.0x10⁹
2.0
2.5
3.0
3.5
4.0
4.5
1 /
Ip
1 / [H]2
a b c
d e f
g h i
Electronic Supplementary Material (ESI) for Organic & Biomolecular ChemistryThis journal is © The Royal Society of Chemistry 2012

S13
of DMpillar and 2 (~10-5
M, curves from bottom to up, molar ratios = 0 : 1, 1 : 1, 2 : 1, 3 : 1, 5 : 1,
7 : 1, 9 : 1, 10 : 1, 20 : 1) in Me2CO with TBAPF6 (10-5
M) as the supporting electrolyte, recorded
with a Pt plate (d = 2 mm) electrode at a scan rate of 200 mVs-1
. (h) The plot of 1 / Ip vs 1 /
[Host] detected by the Ip value. K = 8.7 103 M
-1, R = 0.9772. (i) The plot of 1 / Ip vs 1 / [Host]
2
detected by the Ip value. K = 1.07 109 M
-2, R = 0.9919.
Table S1 Stoichiometry (n) and apparent binding constant (K) were calculated according to
Benesi–Hildebrand equation,[S5]
1/X = 1/ + 1/K[Host]n with the plot of 1/X vs 1/[Host]
n
determined by UV, fluorescent and CV. The X stands for the changes of absorbance (A),
fluorescent emission intensity (I) and peak current (Ip) of 2 in the presence of DMpillar. As
shown in Figure S8, the plot of 1/X vs 1/[Host]2 has a good linear least-squares fit with a better
correlation coefficient than that of the plot of 1/X vs 1/[Host], indicating that the stoichiometry of
the inclusion complex between DMpillar and the compound 2 is 2 : 1. The stoichiometry was also
confirmed by the continuous Job’s variation method (Job’s plot)[S6]
as shown in Figure S7.
According to previous reports about pillararene-based inclusion complexes,[S7]
average binding
constant (K) for the 1 : 1 complexation between DMpillar and guests is around 103 M
-1. Stable
complexes can be formed and detected with both low K (~10 M-1
) and high K (~104 M
-1). The K of
the 2 : 1 inclusion complex between DMpillar and the compound 2 here is around 109 M
-2. This is
reasonable, since the compound 2 has two recognition sites for the complexation and the K of a 2
:1 inclusion complex calculated by Benesi–Hildebrand equation is exponentially higher than that
of a 1 : 1 inclusion complex.
Method H : G (n) K R
UV 1 : 1 3.86 10
3 M
-1 0.9486
2 : 1 1.71 109 M
-2 0.9939
Fluorescence 1 : 1 4.1 10
3 M
-1 0.9268
2 : 1 8.52 108 M
-2 0.9880
CV 1 : 1 8.7 10
3 M
-1 0.9772
2 : 1 1.07 109 M
-2 0.9919
Electronic Supplementary Material (ESI) for Organic & Biomolecular ChemistryThis journal is © The Royal Society of Chemistry 2012

S14
Fig. S10 Mass spectrometry (MS) is a very convenient technique for determining the
stoichiometry of the charged pillararene complexes.[S8]
Mass spectra of the 2 : 1 complex between
DMpillar and 2 in Me2CO solution is present.
[2+DMpillarPF6]+
[2+2DMpillarPF6]+
Electronic Supplementary Material (ESI) for Organic & Biomolecular ChemistryThis journal is © The Royal Society of Chemistry 2012

S15
Fig. S11 High resolution TOF mass spectra of the 1 : 1 complex of DMpillar with 2 (up)
[DMpillar+2‒PF6-]
+ Calc. 1611.5113, Found 1611.5098, and the 2 : 1 complex of DMpillar with 2
(bottom) [2DMpillar+2‒PF6-]
+ Calc. 2361.8517, Found 2361.8494.
Electronic Supplementary Material (ESI) for Organic & Biomolecular ChemistryThis journal is © The Royal Society of Chemistry 2012

S16
Fig. S12 1H NMR spectra (400 MHz, room temperature) of compound 1, compound 2, and the
complex of 1 and 2 (1 mM) with 1:1 or 2:3 molar ratio in Me2CO-d6 with full (up) and selected
area (bottom).
Electronic Supplementary Material (ESI) for Organic & Biomolecular ChemistryThis journal is © The Royal Society of Chemistry 2012

S17
Fig. S13 1H NOESY NMR spectra (400 MHz) of the mixture of trimer 1 with compound 2 in a 2:3
molar ratio (1 mM) in MeCN-d3 at ambient temperature.
Fig. S14 1H NMR spectra (400 MHz, room temperature) of compound 1, compound 2, and the
complex of 1 and 2 (1 mM) with a 2:3 molar ratio in MeCN-d3. No chemical shifts can be
observed.
Electronic Supplementary Material (ESI) for Organic & Biomolecular ChemistryThis journal is © The Royal Society of Chemistry 2012

S18
Fig. S15 Full VT 1H NMR spectra (400 MHz) of the complex of 1 with 2 (1mM) with a 2:3 molar
ratio in Me2CO-d6.
Fig. S16 DLS size distributions of the complex of DMpillar with 2 (1 mM) in a 2:1 molar ratio in
Me2CO. The mean diameter is 479.5 nm (left). The critical assembly concentration of the complex
in Me2CO was determined by (middle) UV-vis and (right) fluorescent spectra.
Electronic Supplementary Material (ESI) for Organic & Biomolecular ChemistryThis journal is © The Royal Society of Chemistry 2012

S19
Fig. S17 (a-d) DLS size distributions of the complex of 1 with 2 (1 mM) in a 2:3 molar ratio in
Me2CO under different concentrations. The variable (e) UV-vis and (f) fluorescent spectra of the
complex in Me2CO were recorded.
a b c
d e f
Electronic Supplementary Material (ESI) for Organic & Biomolecular ChemistryThis journal is © The Royal Society of Chemistry 2012

S20
Fig. S18 Fluorescent microscopy images of the complex of 1 with 2 in a 2:3 molar ratio in Me2CO.
Up, 1 mM, from left to right: bright field, the sample excited at 488 nm, and merged figure. Scale
bar is 10 m. Bottom, 5 mM, from left to right: bright field, the sample excited at 488 nm, and
merged figure. Scale bar = 10 m.
Electronic Supplementary Material (ESI) for Organic & Biomolecular ChemistryThis journal is © The Royal Society of Chemistry 2012
S21
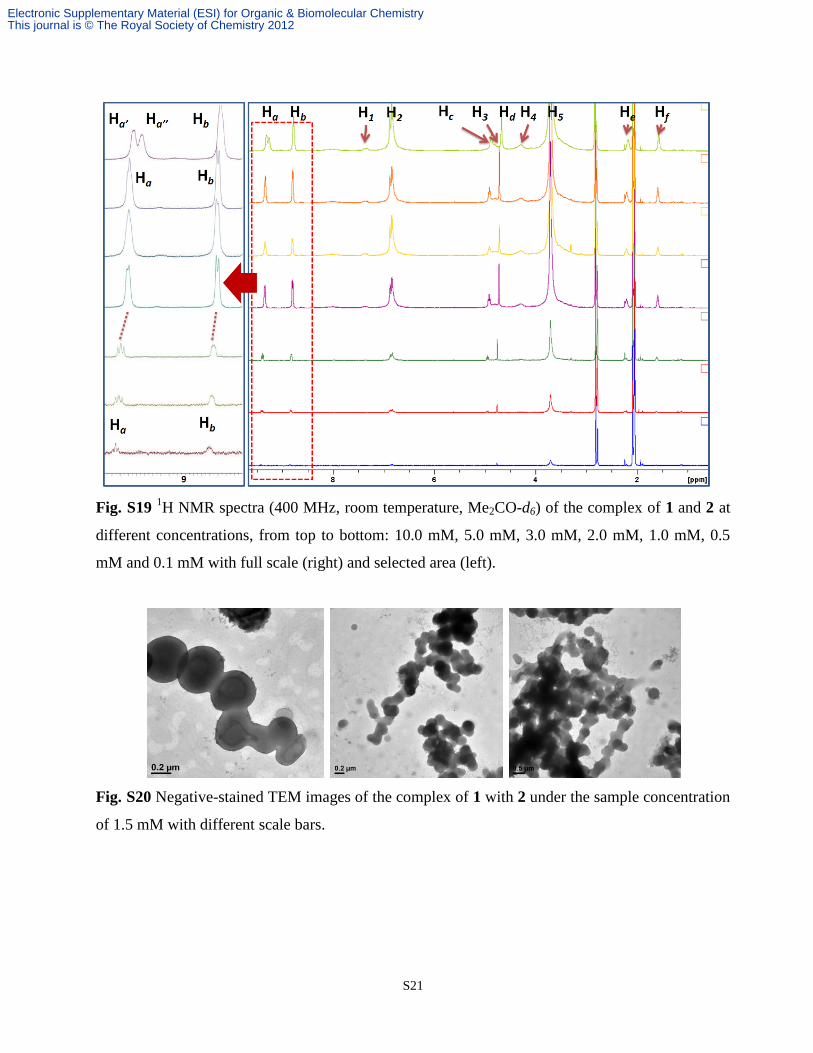
Fig. S19 1H NMR spectra (400 MHz, room temperature, Me2CO-d6) of the complex of 1 and 2 at
different concentrations, from top to bottom: 10.0 mM, 5.0 mM, 3.0 mM, 2.0 mM, 1.0 mM, 0.5
mM and 0.1 mM with full scale (right) and selected area (left).
Fig. S20 Negative-stained TEM images of the complex of 1 with 2 under the sample concentration
of 1.5 mM with different scale bars.
Electronic Supplementary Material (ESI) for Organic & Biomolecular ChemistryThis journal is © The Royal Society of Chemistry 2012

S22
References
[S1] T. Ogoshi, S. Kanai, S. Fujinami, T. Yamagishi and Y. Nakamoto, J. Am. Chem. Soc., 2008,
130, 5022.
[S2] N. L. Strutt, R. S. Forgan, J. S. Spruell, Y. Y. Botros and J. F. Stoddart, J. Am. Chem. Soc.,
2011, 133, 5668.
[S3] For more information about preparing stock solutions: (a) F. Cramer, W. Saenger and H. C.
Spatz, J. Am. Chem. Soc., 1967, 89, 14; (b) P. MacCarthy, Anal. Chem., 1978, 50, 2165; (c) P.
Mukerjee, M. J. Gumkowski, C. C. Chan and R. Sharma, J. Phys. Chem., 1990, 94, 8832; (d) G.
M. Escandar, Analyst, 1999, 124, 587; (e) A. Y. Hao, J. M. Lin and L. H. Tong, J. Inclusion
Phenom. Macro., 1999, 34, 445; (f) X. P. Wang, J. H. Pan, W. H. Li and Y. Zhang, Talanta, 2001,
54, 805; (g) D. Bardelang, A. Rockenbauer, H. Karoui, J. P. Finet and P. Tordo, J. Phys. Chem. B,
2005, 109, 10521; (h) L. X. Song, H. M. Wang, X. Q. Guo and L. Bai, J. Org. Chem., 2008, 73,
8305; (i) B. W. Liu, Y. Chen, B. E. Song and Y. Liu, Chem. Commun., 2011, 47, 441.
[S4] N. Strutt, H. Zhang, M. A. Giesener, J. Lei and J. F. Stoddart, Chem. Commun., 2012, 48,
1647.
[S5] For more information about Benesi–Hildebrand equation: (a) F. Cramer, W. Saenger and H.
C. Spatz, J. Am. Chem. Soc., 1967, 89, 14; (b) G. M. Escandar, Analyst, 1999, 124, 587; (c) A.
Y. Hao, J. M. Lin and L. H. Tong, J. Inclusion Phenom. Macro., 1999, 34, 445; (d) L. X. Song,
H. M. Wang, X. Q. Guo and L. Bai, J. Org. Chem., 2008, 73, 8305.
[S6] For more information about continuous Job’s variation method: (a) P. MacCarthy, Anal.
Chem., 1978, 50, 2165; (b) X. P. Wang, J. H. Pan, W. H. Li and Y. Zhang, Talanta, 2001, 54,
805; (c) D. Bardelang, A. Rockenbauer, H. Karoui, J. P. Finet and P. Tordo, J. Phys. Chem. B,
2005, 109, 10521.
[S7] For more information about average complex constant of 1 : 1 pillararene inclusions: (a) C.
Li, Q. Xu, J. Li, F. Yao and X. Jia, Org. Biomol. Chem., 2010, 8, 1568; (b) N. L. Strutt, R. S.
Electronic Supplementary Material (ESI) for Organic & Biomolecular ChemistryThis journal is © The Royal Society of Chemistry 2012
S23
Forgan, J. M. Spruell, Y. Y. Botros and J. F. Stoddart, J. Am. Chem. Soc., 2011, 133, 5668; (c) C.
Li, K. Han, J. Li, H. Zhang, J. Ma, X. Shu, Z. Chen, L. Weng and X. Jia, Org. Lett., 2012, 14, 42;
(d) Y. Ma, X. Chi, X. Yan, J. Liu, Y. Yao, W. Chen, F. Huang and J. Hou, Org. Lett., 2012, 14,
1532.
[S8] C. Li, Q. Xu, J. Li, F. Yao and X. Jia, Org. Biomol. Chem., 2010, 8, 1568.
Electronic Supplementary Material (ESI) for Organic & Biomolecular ChemistryThis journal is © The Royal Society of Chemistry 2012