houlihan lawrence q1 2013 market report
DESCRIPTION
Market report showing homes for sale in Westchester, Putnam and Dutchess counties.TRANSCRIPT

Houlihan LawrenceQ1-2013 Market Report

HoulihanLawrence.com
Presented by
Chris Meyers
Houlihan Lawrence
Direct: 914.220.7000Mobile: 914.220.7000
Fax: [email protected]

Q1–2013houlihanlawrence.com
Q1-2013 Executive Summary April, 2013 The seeds of a housing recovery sown last year have blossomed this spring in both our region and across the United States. In Westchester, Putnam and Dutchess counties, pending sales (commitments to purchase a home at a specified price and terms, typically closing within 60 to 90 days) are up sharply compared to the same period last year, while inventory is down to 2004 levels, near the lows of the last bull market. Our current supply/demand ratio in Westchester (three active listings for every pending home sale) is at the lowest levels since 2005, and we are increasingly seeing multiple bidders vying for new listings in many communities. With inventory being absorbed at a faster pace than new listings entering the market - both locally and nationwide - we can expect to see rising home prices in 2013, consistent with our prediction last year that home values had bottomed. In fact, median prices are beginning to edge up locally in Q1 compared to the same period last year: in Westchester the median price was up 2% to $515,000; Putnam County median price increased by 3%. The national trend toward reduced inventories reflects a combination of psychological and economic factors. Some homeowners are unable to sell because they are under water on their mortgages, or have minimal equity available to purchase another home. Others may feel that time is on their side and are waiting for higher prices before listing. Whatever their reasons, homeowners across the country are staying put in greater numbers for the time being. Beneath the broad regional trend of higher pending sales, there are significant regional variations in housing market strength.
• In Westchester, Greater White Plains and the Rivertowns are leading the way with pending sales up by 63% and 57% respectively.
• By contrast, pending sales are up more modestly in Northern Westchester (13%) and Northwest Westchester (5%), which have consistently lagged since 2008.
This dichotomy may reflect both the relative strength of the New York City job market and a growing buyer preference for in-town living and the most commuter-friendly suburbs.
In New York City, record-breaking sale prices are making headlines as limited inventory and strong demand from both local and international buyers are fueling the luxury market. This high-end market activity is just beginning to work its way to the northern suburbs, and in recent months domestic and foreign buyers have snapped up several trophy properties in our region. However, the local luxury market (homes priced at $2 Million and up) is currently not as supply-constrained as the middle market. With time, we expect our luxury market to benefit secondarily from New York City’s strong high-end demand as it has in previous cycles. With the market shifting quickly, Houlihan Lawrence is committed to providing our clients with data and insights that reflect real-time market dynamics to help make the most informed real estate decision possible. Stephen Meyers Chris Meyers President and CEO Managing Principal

Q1-2013houlihanlawrence.com
Table of ContentsClick on a green heading to jump to that page.
WESTCHESTER COUNTYOverview Single-family HomesSupply/Demand SnapshotTen-Year Market History
New York City GatewayMount VernonNew RochellePelhamYonkers
Lower WestchesterBronxvilleEastchesterEdgemontScarsdaleTuckahoe
The RivertownsArdsleyBriarcliff ManorDobbs FerryElmsfordHastingsIrvingtonMount PleasantOssiningPleasantvillePocantico HillsTarrytown
Greater White PlainsGreenburghValhallaWhite Plains
The Sound ShoreBlind BrookHarrisonMamaroneckPort ChesterRye CityRye Neck
Northern WestchesterBedfordByram HillsChappaquaKatonah–LewisboroNorth SalemSomers
Northwest WestchesterCroton–HarmonHendrick HudsonLakelandPeekskillYorktown
Westchester CondominiumsOverviewSupply/Demand SnapshotTen-Year Market History
Westchester Co-OperativesOverviewSupply/Demand SnapshotTen-Year Market History
PUTNAM COUNTYBrewsterCarmelGarrisonHaldaneLakelandMahopacPutnam Valley
Putnam CondominiumsOverviewSupply/Demand SnapshotTen-Year Market History
DUTCHESS COUNTYOverview Single-family HomesSupply/Demand SnapshotTen-Year Market History
Southeast DutchessBeekmanDoverPawlingUnion Vale
Southwest DutchessBeaconEast FishkillFishkillLaGrangePoughkeepsiePoughkeepsie/CityWappinger
Northeast DutchessAmeniaNorth EastPine PlainsStanfordWashington
Northwest DutchessClintonHyde ParkMilanPleasant ValleyRed HookRhinebeck
Dutchess CondominiumsOverviewSupply/Demand SnapshotTen-Year Market History

Q1-2013houlihanlawrence.com
Westchester County Single-family HomesOverview
Q1-2013 Q1-2012 % Change Full Year 2012 Full Year 2011 % ChangeHomes Sold 778 734 6.0% 4474 3842 16.4%Average Sale Price $709,709 $726,933 -2.4% $800,651 $814,240 -1.7%Median Sale Price $515,000 $505,500 1.9% $587,000 $600,000 -2.2%Average Days on Market 219 210 4.3% 190 181 5.0%% Sale Price to List Price 94.8 93.3 1.6% 94.4 94.3 0.1%
Supply/Demand SnapshotAs of March 31, 2013 As of March 31, 2012 2013 vs. 2012
Price Range
SUPPLYActive
Listings
DEMANDPending
Sales
Supply/DemandRatio*
SUPPLYActive
Listings
DEMANDPending
Sales
Supply/DemandRatio*
%Change inListings
%Change inPendings
$0 - $499,999 927 438 2 1318 365 4 -29.7% 20.0%$500,000 - $699,999 677 223 3 824 173 5 -17.8% 28.9%$700,000 - $999,999 507 215 2 617 177 3 -17.8% 21.5%$1,000,000 - $1,499,999 358 158 2 439 130 3 -18.5% 21.5%$1,500,000 - $1,999,999 210 67 3 258 53 5 -18.6% 26.4%$2,000,000 - $2,499,999 112 43 3 110 28 4 1.8% 53.6%$2,500,000 - $2,999,999 86 20 4 95 25 4 -9.5% -20.0%$3,000,000 - $3,999,999 87 16 5 77 14 6 13.0% 14.3%$4,000,000 and up 84 12 7 86 7 12 -2.3% 71.4%Market Totals 3048 1192 3 3824 972 4 -20.3% 22.6%
*Supply Demand Ratio Key 1-4: High Demand 5-6: Balanced 7-9: Low Demand 10+: Very Low Demand
Ten-Year Market History
AverageSale Price
$829,006 $881,789 $913,997 $936,242 $881,437 $763,469 $827,990 $814,240 $800,651 $709,709 AverageSale Price
Average PricePer Square Foot
$322 $345 $348 $350 $334 $297 $305 $292 $286 $272 Average PricePer Square Foot
Dayson Market
140 140 153 164 169 178 176 181 190 219 Dayson Market
% Sale Priceto List Price
98.1 97.6 96.4 96.0 95.2 92.9 94.2 94.3 94.4 94.8 % Sale Priceto List Price
Source: Hudson Gateway Multiple Listing Service, Single-family homes

NYC GatewaySingle-family homes
New Rochelle
Preview all our HD Videos ofWestchester, Putnam and Dutchess
houlihanlawrence.com/hltv
Homes Sold
School DistrictQ1
2013Q1
2012%
ChangeFull Year
2012Full Year
2011%
Change
Mount Vernon 21 24 -13% 96 88 9%
New Rochelle 53 41 29% 262 240 9%
Pelham 15 17 -12% 115 88 31%
Yonkers 81 90 -10% 404 337 20%
NYC Gateway 170 172 -1% 877 753 17%
Click on a School district to obtainthe latest monthly market report.
Mount Vernon New Rochelle
Pelham Yonkers
Homes Solddown 1%
Q1- 2013 vs.Q1- 2012
Median Priceup 5%
Q1- 2013 vs.Q1- 2012
Median Sale Price
School DistrictQ1
2013Q1
2012%
Change Full Year
2012Full Year
2011%
Change
Mount Vernon $370,000 $337,500 10% $317,000 $350,000 -9%
New Rochelle $525,000 $557,500 -6% $567,500 $582,500 -3%
Pelham $656,250 $510,000 29% $685,000 $803,750 -15%
Yonkers $415,000 $385,000 8% $390,000 $415,000 -6%
NYC Gateway $445,000 $423,750 5% $465,000 $490,000 -5%
Source: Hudson Gateway Multiple Listing Service, Single-family homes, Zones 7 & 8

NYC GatewaySingle-family homes
Q1-2013 Market Report
Mount Vernon, New Rochelle, Pelham, YonkersClick on a School district to obtain the latest monthly market report.
Supply and Demand Snapshot - Single-family homes
As of March 31, 2013 As of March 31, 2012 2013 vs. 2012
Price Range
SUPPLYActive
Listings
DEMANDPending
Sales
Supply/DemandRatio*
SUPPLYActive
Listings
DEMANDPending
Sales
Supply/DemandRatio*
%Change inListings
%Change inPendings
$0 - $299,999 49 38 1 95 36 3 -48.4% 5.6%
$300,000 -$399,999 108 48 2 136 38 4 -20.6% 26.3%
$400,000 - $499,999 111 37 3 131 25 5 -15.3% 48.0%
$500,000 - $599,999 102 32 3 122 20 6 -16.4% 60.0%
$600,000 - $799,999 110 40 3 133 35 4 -17.3% 14.3%
$800,000 - $999,999 41 19 2 49 13 4 -16.3% 46.2%
$1,000,000 - $1,999,999 63 19 3 76 20 4 -17.1% -5.0%
$2,000,000 and up 13 2 7 9 0 Not Valid 44.4% 0.0%
Market Totals 597 235 3 751 187 4 -20.5% 25.7%
*Supply Demand Ratio Key 1-4: High Demand 5-6: Balanced 7-9: Low Demand 10+: Very Low Demand
Ten-Year Market History
AverageSale Price
$601,033 $684,970 $658,763 $668,933 $619,854 $539,928 $572,784 $574,874 $539,314 $499,038 AverageSale Price
Average PricePer Square Foot
$270 $295 $292 $298 $283 $254 $253 $245 $239 $229 Average PricePer Square Foot
Dayson Market
138 140 151 160 165 180 178 180 197 218 Dayson Market
% Sale Priceto List Price
97.9 98.0 96.7 96.4 95.6 94.1 94.5 94.3 94.4 94.2 % Sale Priceto List Price
Source: Hudson Gateway Multiple Listing Service, Single-family homes, Zones 7 & 8

Lower WestchesterSingle-family homes
Scarsdale
Preview all our HD Videos ofWestchester, Putnam and Dutchess
houlihanlawrence.com/hltv
Homes Sold
School DistrictQ1
2013Q1
2012%
ChangeFull Year
2012Full Year
2011%
Change
Bronxville 12 10 20% 81 47 72%
Eastchester 13 9 44% 79 82 -4%
Edgemont 14 17 -18% 98 49 100%
Scarsdale 24 21 14% 226 205 10%
Tuckahoe 6 2 200% 36 27 33%
Lower Westchester 69 59 17% 520 410 27%
Click on a School district to obtainthe latest monthly market report.
Bronxville Eastchester
Edgemont Scarsdale
Tuckahoe
Homes Soldup 17%
Q1- 2013 vs.Q1- 2012
Median Pricedown 19%
Q1- 2013 vs.Q1- 2012
Median Sale Price
School DistrictQ1
2013Q1
2012%
Change Full Year
2012Full Year
2011%
Change
Bronxville $1,462,500 $1,413,500 4% $1,600,000 $1,860,000 -14%
Eastchester $485,000 $565,000 -14% $555,000 $593,500 -7%
Edgemont $812,500 $1,095,000 -26% $908,125 $925,000 -2%
Scarsdale $1,210,000 $1,355,000 -11% $1,325,000 $1,225,000 8%
Tuckahoe $925,000 $568,000 63% $660,000 $610,000 8%
Lower Westchester $975,000 $1,200,000 -19% $999,999 $995,000 1%
Source: Hudson Gateway Multiple Listing Service, Single-family homes, Zone 6

Lower WestchesterSingle-family homes
Q1-2013 Market Report
Bronxville, Eastchester, Edgemont, Scarsdale, TuckahoeClick on a School district to obtain the latest monthly market report.
Supply and Demand Snapshot - Single-family homes
As of March 31, 2013 As of March 31, 2012 2013 vs. 2012
Price Range
SUPPLYActive
Listings
DEMANDPending
Sales
Supply/DemandRatio*
SUPPLYActive
Listings
DEMANDPending
Sales
Supply/DemandRatio*
%Change inListings
%Change inPendings
$0 - $499,999 3 5 1 16 5 3 -81.3% 0.0%
$500,000 - $699,999 36 28 1 55 16 3 -34.5% 75.0%
$700,000 - $999,999 43 37 1 74 37 2 -41.9% 0.0%
$1,000,000 - $1,499,999 45 40 1 65 39 2 -30.8% 2.6%
$1,500,000 - $1,999,999 24 15 2 41 14 3 -41.5% 7.1%
$2,000,000 - $2,499,999 20 18 1 31 13 2 -35.5% 38.5%
$2,500,000 - $2,999,999 22 5 4 17 11 2 29.4% -54.5%
$3,000,000 - $3,999,999 19 4 5 17 7 2 11.8% -42.9%
$4,000,000 and up 16 4 4 15 3 5 6.7% 33.3%
Market Totals 228 156 1 331 145 2 -31.1% 7.6%
*Supply Demand Ratio Key 1-4: High Demand 5-6: Balanced 7-9: Low Demand 10+: Very Low Demand
Ten-Year Market History
AverageSale Price
$1,204,413 $1,330,846 $1,351,736 $1,393,748 $1,297,435 $1,212,153 $1,302,610 $1,282,116 $1,312,425 $1,200,235 AverageSale Price
Average PricePer Square Foot
$417 $447 $456 $455 $440 $387 $411 $398 $402 $399 Average PricePer Square Foot
Dayson Market
147 148 161 164 162 185 177 174 169 196 Dayson Market
% Sale Priceto List Price
99.1 97.5 96.5 96.6 95.6 91.9 94.6 95.0 96.0 95.3 % Sale Priceto List Price
Source: Hudson Gateway Multiple Listing Service, Single-family homes, Zone 6

The RivertownsSingle-family homes
The Rivertowns
Preview all our HD Videos ofWestchester, Putnam and Dutchess
houlihanlawrence.com/hltv
Homes Sold
School DistrictQ1
2013Q1
2012%
ChangeFull Year
2012Full Year
2011%
Change
Ardsley 15 13 15% 84 63 33%
Briarcliff Manor 12 8 50% 55 51 8%
Dobbs Ferry 12 13 -8% 59 39 51%
Elmsford 12 5 140% 37 30 23%
Hastings 15 5 200% 59 67 -12%
Irvington 9 13 -31% 77 43 79%
Mount Pleasant 8 16 -50% 86 71 21%
Ossining 21 26 -19% 145 137 6%
Pleasantville 5 11 -55% 71 47 51%
Pocantico Hills 1 1 0% 8 8 0%
Tarrytown 9 6 50% 52 38 37%
The Rivertowns 119 117 2% 733 594 23%
Click on a School district to obtainthe latest monthly market report.
Ardsley Briarcliff Manor Dobbs FerryElmsford Hastings Irvington
Mount Pleasant Ossining PleasantvillePocantico Hills Tarrytown
Homes Soldup 2%
Q1- 2013 vs.Q1- 2012
Median Priceup 11%
Q1- 2013 vs.Q1- 2012
Median Sale Price
School DistrictQ1
2013Q1
2012%
Change Full Year
2012Full Year
2011%
Change
Ardsley $515,000 $404,000 28% $523,750 $517,000 1%
Briarcliff Manor $633,750 $656,600 -4% $800,000 $683,010 17%
Dobbs Ferry $745,000 $610,000 22% $629,000 $700,000 -10%
Elmsford $357,500 $418,000 -15% $405,000 $421,000 -4%
Hastings $600,000 $560,000 7% $625,000 $660,000 -5%
Irvington $965,000 $650,000 49% $740,000 $810,000 -9%
Mount Pleasant $510,000 $468,750 9% $490,000 $500,000 -2%
Ossining $445,000 $369,111 21% $355,000 $385,000 -8%
Pleasantville $506,250 $427,000 19% $525,000 $495,000 6%
Pocantico Hills $1,100,000 $295,000 273% $790,955 $657,500 20%
Tarrytown $485,000 $595,000 -19% $550,000 $606,625 -9%
The Rivertowns $522,000 $470,000 11% $535,000 $530,000 1%
Source: Hudson Gateway Multiple Listing Service, Single-family homes, Zone 3

The RivertownsSingle-family homes
Q1-2013 Market Report
Ardsley, Briarcliff Manor, Dobbs Ferry, Elmsford, Hastings, Irvington, Mount Pleasant, Ossining, Pleasantville, Pocantico Hills, TarrytownClick on a School district to obtain the latest monthly market report.
Supply and Demand Snapshot - Single-family homes
As of March 31, 2013 As of March 31, 2012 2013 vs. 2012
Price Range
SUPPLYActive
Listings
DEMANDPending
Sales
Supply/DemandRatio*
SUPPLYActive
Listings
DEMANDPending
Sales
Supply/DemandRatio*
%Change inListings
%Change inPendings
$0 - $299,999 35 25 1 53 15 4 -34.0% 66.7%
$300,000 -$399,999 54 17 3 61 24 3 -11.5% -29.2%
$400,000 - $499,999 57 32 2 101 17 6 -43.6% 88.2%
$500,000 - $599,999 70 21 3 81 16 5 -13.6% 31.3%
$600,000 - $799,999 84 35 2 105 25 4 -20.0% 40.0%
$800,000 - $999,999 26 18 1 49 13 4 -46.9% 38.5%
$1,000,000 - $1,999,999 71 48 1 91 12 8 -22.0% 300.0%
$2,000,000 and up 24 3 8 21 5 4 14.3% -40.0%
Market Totals 421 199 2 562 127 4 -25.1% 56.7%
*Supply Demand Ratio Key 1-4: High Demand 5-6: Balanced 7-9: Low Demand 10+: Very Low Demand
Ten-Year Market History
AverageSale Price
$716,948 $749,612 $737,385 $719,413 $727,417 $622,480 $630,618 $620,144 $608,046 $626,868 AverageSale Price
Average PricePer Square Foot
$314 $335 $329 $327 $313 $288 $281 $274 $264 $283 Average PricePer Square Foot
Dayson Market
139 138 146 158 175 173 175 184 196 212 Dayson Market
% Sale Priceto List Price
98.3 98.0 96.5 96.6 95.6 94.7 94.7 95.1 95.3 96.0 % Sale Priceto List Price
Source: Hudson Gateway Multiple Listing Service, Single-family homes, Zone 3

Greater White PlainsSingle-family homes
White Plains
Preview all our HD Videos ofWestchester, Putnam and Dutchess
houlihanlawrence.com/hltv
Homes Sold
School DistrictQ1
2013Q1
2012%
ChangeFull Year
2012Full Year
2011%
Change
Greenburgh 17 24 -29% 100 92 9%
Valhalla 21 7 200% 44 39 13%
White Plains 35 32 9% 177 155 14%
Greater White Plains 73 63 16% 321 286 12%
Click on a School district to obtainthe latest monthly market report.
Greenburgh Valhalla White Plains
Homes Soldup 16%
Q1- 2013 vs.Q1- 2012
Median Priceup 12%
Q1- 2013 vs.Q1- 2012
Median Sale Price
School DistrictQ1
2013Q1
2012%
Change Full Year
2012Full Year
2011%
Change
Greenburgh $375,000 $401,250 -7% $426,877 $446,250 -4%
Valhalla $534,000 $420,000 27% $452,500 $437,500 3%
White Plains $574,000 $474,000 21% $592,000 $550,000 8%
Greater White Plains $500,000 $446,000 12% $510,000 $495,000 3%
Source: Hudson Gateway Multiple Listing Service, Single-family homes, Zone 4

Greater White PlainsSingle-family homes
Q1-2013 Market Report
Greenburgh, Valhalla, White PlainsClick on a School district to obtain the latest monthly market report.
Supply and Demand Snapshot - Single-family homes
As of March 31, 2013 As of March 31, 2012 2013 vs. 2012
Price Range
SUPPLYActive
Listings
DEMANDPending
Sales
Supply/DemandRatio*
SUPPLYActive
Listings
DEMANDPending
Sales
Supply/DemandRatio*
%Change inListings
%Change inPendings
$0 - $299,999 8 8 1 14 6 2 -42.9% 33.3%
$300,000 -$399,999 32 15 2 48 13 4 -33.3% 15.4%
$400,000 - $499,999 31 22 1 49 10 5 -36.7% 120.0%
$500,000 - $599,999 44 17 3 43 5 9 2.3% 240.0%
$600,000 - $799,999 26 14 2 63 12 5 -58.7% 16.7%
$800,000 - $999,999 12 8 2 15 3 5 -20.0% 166.7%
$1,000,000 - $1,999,999 15 4 4 24 5 5 -37.5% -20.0%
$2,000,000 and up 1 0 Not Valid 1 0 Not Valid 0.0% 0.0%
Market Totals 169 88 2 257 54 5 -34.2% 63.0%
*Supply Demand Ratio Key 1-4: High Demand 5-6: Balanced 7-9: Low Demand 10+: Very Low Demand
Ten-Year Market History
AverageSale Price
$613,760 $674,650 $675,274 $672,834 $658,832 $579,604 $578,480 $532,545 $563,760 $526,741 AverageSale Price
Average PricePer Square Foot
$294 $332 $328 $325 $308 $284 $272 $258 $252 $248 Average PricePer Square Foot
Dayson Market
120 118 132 142 163 169 166 173 193 250 Dayson Market
% Sale Priceto List Price
99.5 98.9 97.3 97.1 95.9 93.9 95.4 95.1 95.0 96.3 % Sale Priceto List Price
Source: Hudson Gateway Multiple Listing Service, Single-family homes, Zone 4
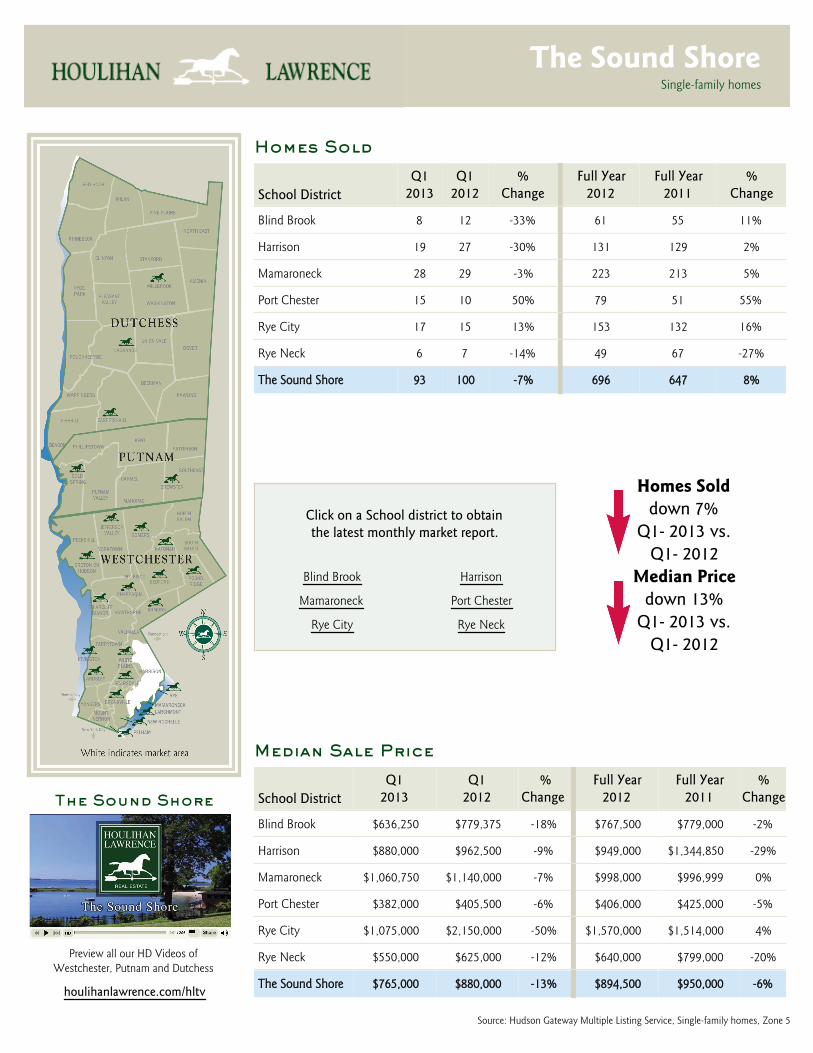
The Sound ShoreSingle-family homes
The Sound Shore
Preview all our HD Videos ofWestchester, Putnam and Dutchess
houlihanlawrence.com/hltv
Homes Sold
School DistrictQ1
2013Q1
2012%
ChangeFull Year
2012Full Year
2011%
Change
Blind Brook 8 12 -33% 61 55 11%
Harrison 19 27 -30% 131 129 2%
Mamaroneck 28 29 -3% 223 213 5%
Port Chester 15 10 50% 79 51 55%
Rye City 17 15 13% 153 132 16%
Rye Neck 6 7 -14% 49 67 -27%
The Sound Shore 93 100 -7% 696 647 8%
Click on a School district to obtainthe latest monthly market report.
Blind Brook Harrison
Mamaroneck Port Chester
Rye City Rye Neck
Homes Solddown 7%
Q1- 2013 vs.Q1- 2012
Median Pricedown 13%
Q1- 2013 vs.Q1- 2012
Median Sale Price
School DistrictQ1
2013Q1
2012%
Change Full Year
2012Full Year
2011%
Change
Blind Brook $636,250 $779,375 -18% $767,500 $779,000 -2%
Harrison $880,000 $962,500 -9% $949,000 $1,344,850 -29%
Mamaroneck $1,060,750 $1,140,000 -7% $998,000 $996,999 0%
Port Chester $382,000 $405,500 -6% $406,000 $425,000 -5%
Rye City $1,075,000 $2,150,000 -50% $1,570,000 $1,514,000 4%
Rye Neck $550,000 $625,000 -12% $640,000 $799,000 -20%
The Sound Shore $765,000 $880,000 -13% $894,500 $950,000 -6%
Source: Hudson Gateway Multiple Listing Service, Single-family homes, Zone 5

The Sound ShoreSingle-family homes
Q1-2013 Market Report
Blind Brook, Harrison, Mamaroneck, Port Chester, Rye City, Rye NeckClick on a School district to obtain the latest monthly market report.
Supply and Demand Snapshot - Single-family homes
As of March 31, 2013 As of March 31, 2012 2013 vs. 2012
Price Range
SUPPLYActive
Listings
DEMANDPending
Sales
Supply/DemandRatio*
SUPPLYActive
Listings
DEMANDPending
Sales
Supply/DemandRatio*
%Change inListings
%Change inPendings
$0 - $499,999 60 30 2 97 37 3 -38.1% -18.9%
$500,000 - $699,999 69 21 3 86 24 4 -19.8% -12.5%
$700,000 - $999,999 83 43 2 89 27 3 -6.7% 59.3%
$1,000,000 - $1,499,999 71 28 3 82 34 2 -13.4% -17.6%
$1,500,000 - $1,999,999 48 28 2 80 21 4 -40.0% 33.3%
$2,000,000 - $2,499,999 36 17 2 32 7 5 12.5% 142.9%
$2,500,000 - $2,999,999 23 8 3 36 6 6 -36.1% 33.3%
$3,000,000 - $3,999,999 28 8 4 25 4 6 12.0% 100.0%
$4,000,000 and up 25 5 5 25 3 8 0.0% 66.7%
Market Totals 443 188 2 552 163 3 -19.7% 15.3%
*Supply Demand Ratio Key 1-4: High Demand 5-6: Balanced 7-9: Low Demand 10+: Very Low Demand
Ten-Year Market History
AverageSale Price
$1,153,411 $1,237,111 $1,316,380 $1,356,202 $1,344,403 $1,149,544 $1,215,667 $1,262,051 $1,226,439 $1,102,043 AverageSale Price
Average PricePer Square Foot
$406 $433 $455 $453 $450 $395 $398 $402 $392 $379 Average PricePer Square Foot
Dayson Market
142 147 152 165 174 179 170 170 176 182 Dayson Market
% Sale Priceto List Price
97.9 96.6 96.7 95.6 94.8 91.2 93.7 94.1 93.9 95.2 % Sale Priceto List Price
Source: Hudson Gateway Multiple Listing Service, Single-family homes, Zone 5

Northern WestchesterSingle-family homes
Bedford
Preview all our HD Videos ofWestchester, Putnam and Dutchess
houlihanlawrence.com/hltv
Homes Sold
School DistrictQ1
2013Q1
2012%
ChangeFull Year
2012Full Year
2011%
Change
Bedford 23 36 -36% 205 185 11%
Byram Hills 21 12 75% 127 106 20%
Chappaqua 26 20 30% 131 132 -1%
Katonah-Lewisboro 28 30 -7% 181 141 28%
North Salem 11 19 -42% 58 34 71%
Somers 22 20 10% 114 95 20%
Northern Westchester 131 137 -4% 816 693 18%
Click on a School district to obtainthe latest monthly market report.
Bedford Byram Hills
Chappaqua Katonah–Lewisboro
North Salem Somers
Homes Solddown 4%
Q1- 2013 vs.Q1- 2012
Median Priceup 15%
Q1- 2013 vs.Q1- 2012
Median Sale Price
School DistrictQ1
2013Q1
2012%
Change Full Year
2012Full Year
2011%
Change
Bedford $979,000 $949,500 3% $705,000 $775,000 -9%
Byram Hills $987,500 $773,750 28% $860,000 $1,063,750 -19%
Chappaqua $955,000 $590,000 62% $850,000 $845,125 1%
Katonah-Lewisboro $620,000 $635,000 -2% $629,000 $596,000 6%
North Salem $455,000 $415,000 10% $454,319 $508,000 -11%
Somers $466,750 $452,500 3% $464,000 $542,000 -14%
Northern Westchester $697,000 $608,000 15% $692,500 $753,500 -8%
Source: Hudson Gateway Multiple Listing Service, Single-family homes, Zone 2

Northern WestchesterSingle-family homes
Q1-2013 Market Report
Bedford, Byram Hills, Chappaqua, Katonah–Lewisboro, North Salem, SomersClick on a School district to obtain the latest monthly market report.
Supply and Demand Snapshot - Single-family homes
As of March 31, 2013 As of March 31, 2012 2013 vs. 2012
Price Range
SUPPLYActive
Listings
DEMANDPending
Sales
Supply/DemandRatio*
SUPPLYActive
Listings
DEMANDPending
Sales
Supply/DemandRatio*
%Change inListings
%Change inPendings
$0 - $499,999 113 54 2 168 42 4 -32.7% 28.6%
$500,000 - $699,999 149 33 5 170 36 5 -12.4% -8.3%
$700,000 - $999,999 173 54 3 181 50 4 -4.4% 8.0%
$1,000,000 - $1,499,999 136 33 4 144 23 6 -5.6% 43.5%
$1,500,000 - $1,999,999 76 10 8 81 12 7 -6.2% -16.7%
$2,000,000 - $2,499,999 34 6 6 36 6 6 -5.6% 0.0%
$2,500,000 - $2,999,999 33 4 8 32 6 5 3.1% -33.3%
$3,000,000 - $3,999,999 35 4 9 29 2 15 20.7% 100.0%
$4,000,000 and up 36 3 12 40 1 40 -10.0% 200.0%
Market Totals 785 201 4 881 178 5 -10.9% 12.9%
*Supply Demand Ratio Key 1-4: High Demand 5-6: Balanced 7-9: Low Demand 10+: Very Low Demand
Ten-Year Market History
AverageSale Price
$1,045,970 $1,117,697 $1,172,111 $1,219,303 $1,073,808 $917,065 $979,814 $939,854 $912,747 $932,989 AverageSale Price
Average PricePer Square Foot
$340 $373 $360 $368 $340 $289 $299 $274 $267 $270 Average PricePer Square Foot
Dayson Market
151 149 169 182 171 180 185 193 199 257 Dayson Market
% Sale Priceto List Price
97.2 97.4 95.8 95.2 94.6 92.7 93.6 93.2 92.8 93.3 % Sale Priceto List Price
Source: Hudson Gateway Multiple Listing Service, Single-family homes, Zone 2

Northwest WestchesterSingle-family homes
Yorktown
Preview all our HD Videos ofWestchester, Putnam and Dutchess
houlihanlawrence.com/hltv
Homes Sold
School DistrictQ1
2013Q1
2012%
ChangeFull Year
2012Full Year
2011%
Change
Croton-Harmon 15 11 36% 59 64 -8%
Hendrick Hudson 19 12 58% 80 67 19%
Lakeland 35 34 3% 171 155 10%
Peekskill 17 11 55% 59 54 9%
Yorktown 35 18 94% 134 111 21%
Northwest Westchester 121 86 41% 503 451 12%
Click on a School district to obtainthe latest monthly market report.
Croton–Harmon Hendrick Hudson
Lakeland Peekskill
Yorktown
Homes Soldup 41%
Q1- 2013 vs.Q1- 2012
Median Priceup 1%
Q1- 2013 vs.Q1- 2012
Median Sale Price
School DistrictQ1
2013Q1
2012%
Change Full Year
2012Full Year
2011%
Change
Croton-Harmon $410,000 $465,000 -12% $472,500 $528,250 -11%
Hendrick Hudson $315,000 $388,500 -19% $349,000 $355,000 -2%
Lakeland $315,000 $301,000 5% $322,500 $325,000 -1%
Peekskill $230,500 $230,000 0% $240,000 $232,500 3%
Yorktown $412,500 $366,250 13% $386,500 $410,000 -6%
Northwest Westchester $340,000 $336,500 1% $342,500 $352,500 -3%
Source: Hudson Gateway Multiple Listing Service, Single-family homes, Zone 1

Northwest WestchesterSingle-family homes
Q1-2013 Market Report
Croton–Harmon, Hendrick Hudson, Lakeland, Peekskill, YorktownClick on a School district to obtain the latest monthly market report.
Supply and Demand Snapshot - Single-family homes
As of March 31, 2013 As of March 31, 2012 2013 vs. 2012
Price Range
SUPPLYActive
Listings
DEMANDPending
Sales
Supply/DemandRatio*
SUPPLYActive
Listings
DEMANDPending
Sales
Supply/DemandRatio*
%Change inListings
%Change inPendings
$0 - $299,999 97 50 2 124 54 2 -21.8% -7.4%
$300,000 -$399,999 96 37 3 134 31 4 -28.4% 19.4%
$400,000 - $499,999 67 18 4 85 12 7 -21.2% 50.0%
$500,000 - $599,999 50 8 6 49 6 8 2.0% 33.3%
$600,000 - $799,999 46 8 6 53 4 13 -13.2% 100.0%
$800,000 - $999,999 19 2 10 21 7 3 -9.5% -71.4%
$1,000,000 - $1,999,999 19 0 Not Valid 13 3 4 46.2% -100.0%
$2,000,000 and up 4 0 Not Valid 2 0 Not Valid 100.0% 0.0%
Market Totals 398 123 3 481 117 4 -17.3% 5.1%
*Supply Demand Ratio Key 1-4: High Demand 5-6: Balanced 7-9: Low Demand 10+: Very Low Demand
Ten-Year Market History
AverageSale Price
$473,575 $518,962 $524,300 $511,158 $513,692 $419,037 $421,273 $395,090 $394,992 $379,297 AverageSale Price
Average PricePer Square Foot
$239 $259 $256 $248 $243 $215 $207 $195 $187 $184 Average PricePer Square Foot
Dayson Market
130 130 151 160 167 177 178 186 194 212 Dayson Market
% Sale Priceto List Price
98.6 97.9 96.5 96.3 95.0 94.8 94.9 94.8 94.9 95.1 % Sale Priceto List Price
Source: Hudson Gateway Multiple Listing Service, Single-family homes, Zone 1

Q1-2013houlihanlawrence.com
Westchester County CondominiumsOverview
Q1-2013 Q1-2012 % Change Full Year 2012 Full Year 2011 % ChangeUnits Sold 211 191 10.5% 1007 836 20.5%Average Sale Price $347,692 $347,045 0.2% $371,925 $411,994 -9.7%Median Sale Price $312,000 $315,000 -1.0% $330,000 $337,250 -2.1%Average Price Per Square Foot $263 $268 -1.9% $262 $277 -5.4%Average Days on Market 185 220 -15.9% 187 180 3.9%% Sale Price to List Price 96.1 94.5 1.7% 94.9 94.2 0.7%
Supply/Demand SnapshotAs of March 31, 2013 As of March 31, 2012 2013 vs. 2012
Price Range
SUPPLYActive
Listings
DEMANDPending
Sales
Supply/DemandRatio*
SUPPLYActive
Listings
DEMANDPending
Sales
Supply/DemandRatio*
%Change inListings
%Change inPendings
$0 - $299,999 203 85 2 308 69 4 -34.1% 23.2%$300,000 -$399,999 140 57 2 177 55 3 -20.9% 3.6%$400,000 - $499,999 76 32 2 105 16 7 -27.6% 100.0%$500,000 - $599,999 42 15 3 59 16 4 -28.8% -6.3%$600,000 - $799,999 52 24 2 70 12 6 -25.7% 100.0%$800,000 - $999,999 19 14 1 28 4 7 -32.1% 250.0%$1,000,000 - $1,999,999 15 14 1 21 3 7 -28.6% 366.7%$2,000,000 and up 5 0 Not Valid 10 1 10 -50.0% -100.0%Market Totals 552 241 2 778 176 4 -29.0% 36.9%
*Supply Demand Ratio Key 1-4: High Demand 5-6: Balanced 7-9: Low Demand 10+: Very Low Demand
Ten-Year Market History
AverageSale Price
$372,088 $420,845 $424,230 $434,912 $430,037 $397,114 $400,317 $411,994 $371,925 $347,692 AverageSale Price
Average PricePer Square Foot
$278 $312 $328 $330 $321 $291 $286 $277 $262 $263 Average PricePer Square Foot
Dayson Market
110 116 138 162 169 174 180 180 187 185 Dayson Market
% Sale Priceto List Price
98.9 99.0 97.2 96.6 95.8 94.2 94.8 94.2 94.9 96.1 % Sale Priceto List Price
Source: Hudson Gateway Multiple Listing Service, Condominiums

Q1-2013houlihanlawrence.com
Westchester County Co-OperativesOverview
Q1-2013 Q1-2012 % Change Full Year 2012 Full Year 2011 % ChangeUnits Sold 283 260 8.8% 1258 1160 8.4%Average Sale Price $177,746 $172,112 3.3% $177,903 $185,347 -4.0%Median Sale Price $139,000 $144,500 -3.8% $148,200 $160,000 -7.4%Average Price Per Square Foot $172 $172 0.0% $174 $185 -5.9%Average Days on Market 244 220 10.9% 220 212 3.8%% Sale Price to List Price 94.0 92.9 1.2% 94.0 93.6 0.4%
Supply/Demand SnapshotAs of March 31, 2013 As of March 31, 2012 2013 vs. 2012
Price Range
SUPPLYActive
Listings
DEMANDPending
Sales
Supply/DemandRatio*
SUPPLYActive
Listings
DEMANDPending
Sales
Supply/DemandRatio*
%Change inListings
%Change inPendings
$0 - $299,999 1329 334 4 1513 284 5 -12.2% 17.6%$300,000 -$399,999 65 20 3 76 11 7 -14.5% 81.8%$400,000 - $499,999 16 11 1 26 5 5 -38.5% 120.0%$500,000 - $599,999 10 5 2 5 0 Not Valid 100.0% 0.0%$600,000 - $799,999 18 4 5 16 6 3 12.5% -33.3%$800,000 - $999,999 5 2 3 2 2 1 150.0% 0.0%$1,000,000 - $1,999,999 0 1 0 2 0 Not Valid -100.0% 0.0%$2,000,000 and up 0 0 0 0 0 0 0.0% 0.0%Market Totals 1443 377 4 1640 308 5 -12.0% 22.4%
*Supply Demand Ratio Key 1-4: High Demand 5-6: Balanced 7-9: Low Demand 10+: Very Low Demand
Ten-Year Market History
AverageSale Price
$170,763 $200,562 $207,205 $213,747 $205,727 $192,922 $195,024 $185,347 $177,903 $177,746 AverageSale Price
Average PricePer Square Foot
$180 $209 $218 $223 $219 $202 $197 $185 $174 $172 Average PricePer Square Foot
Dayson Market
142 143 153 170 173 203 207 212 220 244 Dayson Market
% Sale Priceto List Price
98.4 98.3 96.6 96.0 95.3 93.9 93.8 93.6 94.0 94.0 % Sale Priceto List Price
Source: Hudson Gateway Multiple Listing Service, Co-Operatives

Putnam CountySingle-family homes
Brewster-Mahopac
Preview all our HD Videos ofWestchester, Putnam and Dutchess
houlihanlawrence.com/hltv
Homes Sold
School DistrictQ1
2013Q1
2012%
ChangeFull Year
2012Full Year
2011%
Change
Brewster 27 22 23% 131 86 52%
Carmel 30 36 -17% 181 162 12%
Garrison 7 2 250% 13 27 -52%
Haldane 9 3 200% 46 35 31%
Lakeland 6 3 100% 23 27 -15%
Mahopac 21 32 -34% 167 135 24%
Putnam Valley 13 10 30% 63 96 -34%
Putnam County 113 108 5% 624 568 10%
Click on a School district to obtainthe latest monthly market report.
Brewster CarmelGarrison HaldaneLakeland Mahopac
Putnam Valley
Homes Soldup 5%
Q1- 2013 vs.Q1- 2012
Median Priceup 3%
Q1- 2013 vs.Q1- 2012
Median Sale Price
School DistrictQ1
2013Q1
2012%
Change Full Year
2012Full Year
2011%
Change
Brewster $255,000 $243,500 5% $274,000 $310,000 -12%
Carmel $255,500 $217,550 17% $245,000 $259,500 -6%
Garrison $508,000 $1,050,000 -52% $597,500 $557,500 7%
Haldane $535,000 $392,500 36% $405,000 $459,000 -12%
Lakeland $350,000 $280,000 25% $315,875 $350,000 -10%
Mahopac $300,000 $330,000 -9% $335,000 $347,500 -4%
Putnam Valley $260,000 $298,750 -13% $297,500 $317,500 -6%
Putnam County $281,900 $274,500 3% $299,000 $324,950 -8%
Source: Hudson Gateway Multiple Listing Service, Single-family homes, Zone 9

Putnam CountySingle-family homes
Q1-2013 Market Report
Brewster, Carmel, Garrison, Haldane, Lakeland, Mahopac, Putnam ValleyClick on a School district to obtain the latest monthly market report.
Supply and Demand Snapshot - Single-family homes
As of March 31, 2013 As of March 31, 2012 2013 vs. 2012
Price Range
SUPPLYActive
Listings
DEMANDPending
Sales
Supply/DemandRatio*
SUPPLYActive
Listings
DEMANDPending
Sales
Supply/DemandRatio*
%Change inListings
%Change inPendings
$0 - $299,999 277 77 4 315 77 4 -12.1% 0.0%
$300,000 -$399,999 137 32 4 141 25 6 -2.8% 28.0%
$400,000 - $499,999 99 18 6 90 20 5 10.0% -10.0%
$500,000 - $599,999 60 14 4 66 10 7 -9.1% 40.0%
$600,000 - $799,999 61 7 9 83 8 10 -26.5% -12.5%
$800,000 - $999,999 27 2 14 29 0 Not Valid -6.9% 0.0%
$1,000,000 - $1,999,999 25 1 25 31 2 16 -19.4% -50.0%
$2,000,000 and up 12 0 Not Valid 19 1 19 -36.8% -100.0%
Market Totals 698 151 5 774 143 5 -9.8% 5.6%
*Supply Demand Ratio Key 1-4: High Demand 5-6: Balanced 7-9: Low Demand 10+: Very Low Demand
Ten-Year Market History
AverageSale Price
$422,637 $466,576 $466,930 $463,756 $438,500 $373,616 $356,730 $372,783 $350,828 $342,060 AverageSale Price
Average PricePer Square Foot
$222 $242 $244 $232 $214 $190 $176 $178 $169 $173 Average PricePer Square Foot
Dayson Market
151 153 157 178 180 192 206 211 212 249 Dayson Market
% Sale Priceto List Price
97.3 97.1 96.3 95.6 94.5 92.7 94.3 93.7 94.0 94.6 % Sale Priceto List Price
Source: Hudson Gateway Multiple Listing Service, Single-family homes, Zone 9

Q1-2013houlihanlawrence.com
Putnam County CondominiumsOverview
Q1-2013 Q1-2012 % Change Full Year 2012 Full Year 2011 % ChangeUnits Sold 19 17 11.8% 69 80 -13.8%Average Sale Price $236,654 $220,589 7.3% $231,039 $266,995 -13.5%Median Sale Price $204,000 $187,000 9.1% $206,000 $236,500 -12.9%Average Price Per Square Foot $154 $159 -3.1% $155 $169 -8.3%Average Days on Market 318 261 21.8% 252 186 35.5%% Sale Price to List Price 96.1 95.2 0.9% 94.7 95.0 -0.3%
Supply/Demand SnapshotAs of March 31, 2013 As of March 31, 2012 2013 vs. 2012
Price Range
SUPPLYActive
Listings
DEMANDPending
Sales
Supply/DemandRatio*
SUPPLYActive
Listings
DEMANDPending
Sales
Supply/DemandRatio*
%Change inListings
%Change inPendings
$0 - $299,999 72 18 4 85 11 8 -15.3% 63.6%$300,000 -$399,999 7 2 4 15 2 8 -53.3% 0.0%$400,000 - $499,999 0 0 0 3 2 2 -100.0% -100.0%$500,000 - $599,999 7 5 1 3 3 1 133.3% 66.7%$600,000 - $799,999 1 0 Not Valid 0 0 0 0.0% 0.0%$800,000 - $999,999 0 0 0 0 0 0 0.0% 0.0%$1,000,000 - $1,999,999 1 0 Not Valid 0 0 0 0.0% 0.0%$2,000,000 and up 1 0 Not Valid 1 0 Not Valid 0.0% 0.0%Market Totals 89 25 4 107 18 6 -16.8% 38.9%
*Supply Demand Ratio Key 1-4: High Demand 5-6: Balanced 7-9: Low Demand 10+: Very Low Demand
Ten-Year Market History
AverageSale Price
$241,434 $262,122 $277,229 $290,809 $296,499 $248,638 $248,143 $266,995 $231,039 $236,654 AverageSale Price
Average PricePer Square Foot
$184 $211 $223 $217 $211 $188 $174 $169 $155 $154 Average PricePer Square Foot
Dayson Market
104 115 130 152 169 179 190 186 252 318 Dayson Market
% Sale Priceto List Price
98.1 98.3 97.2 96.6 96.2 95.4 94.8 95.0 94.7 96.1 % Sale Priceto List Price
Source: Hudson Gateway Multiple Listing Service, Condominiums

Q1-2013houlihanlawrence.com
Dutchess County Single-family HomesOverview
Q1-2013 Q1-2012 % Change Full Year 2012 Full Year 2011 % ChangeHomes Sold 343 297 15.5% 1612 1494 7.9%Average Sale Price $293,856 $273,917 7.3% $291,263 $311,943 -6.6%Median Sale Price $224,000 $235,000 -4.7% $242,134 $246,000 -1.6%Average Days on Market 213 211 0.9% 190 187 1.6%% Sale Price to List Price 92.8 93.2 -0.4% 93.7 92.0 1.8%
Supply/Demand SnapshotAs of March 31, 2013 As of March 31, 2012 2013 vs. 2012
Price Range
SUPPLYActive
Listings
DEMANDPending
Sales
Supply/DemandRatio*
SUPPLYActive
Listings
DEMANDPending
Sales
Supply/DemandRatio*
%Change inListings
%Change inPendings
$0 - $299,999 846 260 3 1035 208 5 -18.3% 25.0%$300,000 -$399,999 286 70 4 353 51 7 -19.0% 37.3%$400,000 - $499,999 122 18 7 176 20 9 -30.7% -10.0%$500,000 - $599,999 115 22 5 95 11 9 21.1% 100.0%$600,000 - $799,999 93 20 5 106 19 6 -12.3% 5.3%$800,000 - $999,999 48 6 8 44 2 22 9.1% 200.0%$1,000,000 - $1,999,999 56 5 11 67 2 34 -16.4% 150.0%$2,000,000 and up 48 2 24 56 2 28 -14.3% 0.0%Market Totals 1614 403 4 1932 315 6 -16.5% 27.9%
*Supply Demand Ratio Key 1-4: High Demand 5-6: Balanced 7-9: Low Demand 10+: Very Low Demand
Ten-Year Market History
Average PricePer Square Foot
$168 $187 $188 $181 $165 $149 $147 $140 $135 $136 Average PricePer Square Foot
Dayson Market
147 137 151 155 160 164 172 187 190 213 Dayson Market
% Sale Priceto List Price
97.3 97.3 96.2 95.2 94.6 93.7 94.0 92.0 93.7 92.8 % Sale Priceto List Price
Source: Mid-Hudson Multiple Listing Service, Residential-detached homes.

Southwest DutchessSingle-family homes
Poughkeepsie Area
Preview all our HD Videos ofWestchester, Putnam and Dutchess
houlihanlawrence.com/hltv
Homes Sold
Town/CityQ1
2013Q1
2012%
ChangeFull Year
2012Full Year
2011%
Change
Beacon 14 20 -30% 74 63 18%
East Fishkill 36 28 29% 189 189 0%
Fishkill 24 24 0% 98 72 36%
La Grange 27 17 59% 110 115 -4%
Poughkeepsie 60 51 18% 276 256 8%
City of Poughkeepsie 19 16 19% 68 90 -24%
Wappinger 26 17 53% 127 143 -11%
Southwest Dutchess 206 173 19% 942 928 2%
Click to obtain a specifictown/city monthly market report.
Beacon East FishkillFishkill La Grange
Poughkeepsie City of PoughkeepsieWappinger
Homes Soldup 19%
Q1- 2013 vs.Q1- 2012
Average Priceup 8%
Q1- 2013 vs.Q1- 2012
Average Sale Price
Town/CityQ1
2013Q1
2012%
Change Full Year
2012Full Year
2011%
Change
Beacon $224,250 $208,000 8% $203,723 $224,500 -9%
East Fishkill $366,700 $422,500 -13% $340,000 $340,000 0%
Fishkill $252,500 $238,500 6% $239,211 $249,000 -4%
La Grange $272,000 $249,100 9% $263,500 $256,000 3%
Poughkeepsie $177,000 $195,000 -9% $205,000 $215,000 -5%
City of Poughkeepsie $162,680 $160,250 2% $166,000 $166,000 0%
Wappinger $245,500 $230,000 7% $249,000 $255,000 -2%
Southwest Dutchess $224,250 $208,000 8% $203,723 $224,500 -9%
Source: Mid-Hudson Multiple Listing Service reports the Average Sale Price.

Southwest DutchessSingle-family homes
Q1-2013 Market Report
Beacon, East Fishkill, Fishkill, La Grange, Poughkeepsie, City of Poughkeepsie, WappingerClick to obtain a specific town/city monthly market report.
Supply and Demand Snapshot - Single-family homes
As of March 31, 2013 As of March 31, 2012 2013 vs. 2012
Price Range
SUPPLYActive
Listings
DEMANDPending
Sales
Supply/DemandRatio*
SUPPLYActive
Listings
DEMANDPending
Sales
Supply/DemandRatio*
%Change inListings
%Change inPendings
$0 - $299,999 452 182 2 583 146 4 -22.5% 24.7%
$300,000 -$399,999 129 41 3 171 30 6 -24.6% 36.7%
$400,000 - $499,999 63 12 5 88 15 6 -28.4% -20.0%
$500,000 - $599,999 74 16 5 55 8 7 34.5% 100.0%
$600,000 - $799,999 33 8 4 47 10 5 -29.8% -20.0%
$800,000 - $999,999 8 4 2 9 1 9 -11.1% 300.0%
$1,000,000 - $1,999,999 5 1 5 9 0 Not Valid -44.4% 0.0%
$2,000,000 and up 1 0 Not Valid 3 0 Not Valid -66.7% 0.0%
Market Totals 765 264 3 965 210 5 -20.7% 25.7%
*Supply Demand Ratio Key 1-4: High Demand 5-6: Balanced 7-9: Low Demand 10+: Very Low Demand
Ten-Year Market History
Average PricePer Square Foot
$164 $180 $183 $176 $161 $150 $142 $134 $127 $134 Average PricePer Square Foot
Dayson Market
137 128 145 148 154 159 165 183 178 216 Dayson Market
% Sale Priceto List Price
98.1 98.4 97.7 96.4 95.5 95.5 95.4 95.3 95.3 96.0 % Sale Priceto List Price
Source: Mid-Hudson Multiple Listing Service, Residential-detached homes.

Southeast DutchessSingle-family homes
Dutchess County
Preview all our HD Videos ofWestchester, Putnam and Dutchess
houlihanlawrence.com/hltv
Homes Sold
Town/CityQ1
2013Q1
2012%
ChangeFull Year
2012Full Year
2011%
Change
Beekman 11 15 -27% 84 63 33%
Dover 10 9 11% 31 47 -34%
Pawling 13 7 86% 43 31 39%
Union Vale 4 6 -33% 24 16 50%
Southeast Dutchess 38 37 3% 182 157 16%
Click to obtain a specifictown/city monthly market report.
Beekman Dover
Pawling Union Vale
Homes Soldup 3%
Q1- 2013 vs.Q1- 2012
Average Pricedown 16%
Q1- 2013 vs.Q1- 2012
Average Sale Price
Town/CityQ1
2013Q1
2012%
Change Full Year
2012Full Year
2011%
Change
Beekman $265,000 $280,000 -5% $310,125 $355,000 -13%
Dover $152,000 $145,000 5% $174,000 $160,000 9%
Pawling $237,500 $358,500 -34% $315,000 $280,000 13%
Union Vale $236,500 $238,870 -1% $296,500 $335,500 -12%
Southeast Dutchess $218,500 $260,000 -16% $284,750 $284,675 0%
Source: Mid-Hudson Multiple Listing Service reports the Average Sale Price.

Southeast DutchessSingle-family homes
Q1-2013 Market Report
Beekman, Dover, Pawling, Union ValeClick to obtain a specific town/city monthly market report.
Supply and Demand Snapshot - Single-family homes
As of March 31, 2013 As of March 31, 2012 2013 vs. 2012
Price Range
SUPPLYActive
Listings
DEMANDPending
Sales
Supply/DemandRatio*
SUPPLYActive
Listings
DEMANDPending
Sales
Supply/DemandRatio*
%Change inListings
%Change inPendings
$0 - $299,999 99 24 4 121 14 9 -18.2% 71.4%
$300,000 -$399,999 46 13 4 74 9 8 -37.8% 44.4%
$400,000 - $499,999 19 1 19 29 3 10 -34.5% -66.7%
$500,000 - $599,999 15 4 4 12 1 12 25.0% 300.0%
$600,000 - $799,999 18 7 3 22 3 7 -18.2% 133.3%
$800,000 - $999,999 11 0 Not Valid 12 1 12 -8.3% -100.0%
$1,000,000 - $1,999,999 14 0 Not Valid 12 0 Not Valid 16.7% 0.0%
$2,000,000 and up 8 1 8 8 0 Not Valid 0.0% 0.0%
Market Totals 230 50 5 290 31 9 -20.7% 61.3%
*Supply Demand Ratio Key 1-4: High Demand 5-6: Balanced 7-9: Low Demand 10+: Very Low Demand
Ten-Year Market History
Average PricePer Square Foot
$188 $206 $198 $190 $181 $156 $154 $133 $135 $117 Average PricePer Square Foot
Dayson Market
164 145 154 170 157 180 189 219 216 240 Dayson Market
% Sale Priceto List Price
97.1 97.4 96.6 95.4 94.3 93.0 94.2 93.7 96.0 91.6 % Sale Priceto List Price
Source: Mid-Hudson Multiple Listing Service, Residential-detached homes.

Northwest DutchessSingle-family homes
Dutchess County
Preview all our HD Videos ofWestchester, Putnam and Dutchess
houlihanlawrence.com/hltv
Homes Sold
Town/CityQ1
2013Q1
2012%
ChangeFull Year
2012Full Year
2011%
Change
Clinton 5 3 67% 36 40 -10%
Hyde Park 23 23 0% 133 97 37%
Milan 4 1 300% 13 12 8%
Pleasant Valley 19 10 90% 58 51 14%
Red Hook 11 13 -15% 63 51 24%
Rhinebeck 11 14 -21% 70 53 32%
Northwest Dutchess 73 64 14% 373 304 23%
Click to obtain a specifictown/city monthly market report.
Clinton Hyde Park
Milan Pleasant Valley
Red Hook Rhinebeck
Homes Soldup 14%
Q1- 2013 vs.Q1- 2012
Average Pricedown 6%
Q1- 2013 vs.Q1- 2012
Average Sale Price
Town/CityQ1
2013Q1
2012%
Change Full Year
2012Full Year
2011%
Change
Clinton $245,000 $775,000 -68% $320,650 $355,250 -10%
Hyde Park $180,000 $190,000 -5% $175,500 $179,000 -2%
Milan $258,500 $230,000 12% $330,000 $350,000 -6%
Pleasant Valley $230,000 $290,000 -21% $253,750 $250,000 2%
Red Hook $230,000 $310,000 -26% $285,500 $260,000 10%
Rhinebeck $265,000 $317,500 -17% $322,500 $295,000 9%
Northwest Dutchess $224,000 $238,500 -6% $240,000 $244,500 -2%
Source: Mid-Hudson Multiple Listing Service reports the Average Sale Price.

Northwest DutchessSingle-family homes
Q1-2013 Market Report
Clinton, Hyde Park, Milan, Pleasant Valley, Red Hook, RhinebeckClick to obtain a specific town/city monthly market report.
Supply and Demand Snapshot - Single-family homes
As of March 31, 2013 As of March 31, 2012 2013 vs. 2012
Price Range
SUPPLYActive
Listings
DEMANDPending
Sales
Supply/DemandRatio*
SUPPLYActive
Listings
DEMANDPending
Sales
Supply/DemandRatio*
%Change inListings
%Change inPendings
$0 - $299,999 203 43 5 249 39 6 -18.5% 10.3%
$300,000 -$399,999 82 14 6 76 9 8 7.9% 55.6%
$400,000 - $499,999 27 4 7 41 1 41 -34.1% 300.0%
$500,000 - $599,999 21 2 11 19 1 19 10.5% 100.0%
$600,000 - $799,999 23 4 6 23 6 4 0.0% -33.3%
$800,000 - $999,999 12 2 6 16 0 Not Valid -25.0% 0.0%
$1,000,000 - $1,999,999 19 1 19 24 1 24 -20.8% 0.0%
$2,000,000 and up 4 0 Not Valid 12 0 Not Valid -66.7% 0.0%
Market Totals 391 70 6 460 57 8 -15.0% 22.8%
*Supply Demand Ratio Key 1-4: High Demand 5-6: Balanced 7-9: Low Demand 10+: Very Low Demand
Ten-Year Market History
Average PricePer Square Foot
$167 $184 $193 $179 $165 $145 $151 $145 $140 $127 Average PricePer Square Foot
Dayson Market
157 141 155 159 172 166 167 175 199 207 Dayson Market
% Sale Priceto List Price
97.0 96.4 93.6 93.8 93.5 93.1 92.8 92.9 90.9 92.6 % Sale Priceto List Price
Source: Mid-Hudson Multiple Listing Service, Residential-detached homes.

Northeast DutchessSingle-family homes
Dutchess County
Preview all our HD Videos ofWestchester, Putnam and Dutchess
houlihanlawrence.com/hltv
Homes Sold
Town/CityQ1
2013Q1
2012%
ChangeFull Year
2012Full Year
2011%
Change
Amenia 5 4 25% 16 16 0%
North East 2 0 0% 6 4 50%
Pine Plains 3 1 200% 8 7 14%
Stanford 3 5 -40% 33 22 50%
Washington 8 8 0% 18 23 -22%
Northeast Dutchess 21 18 17% 81 72 13%
Click to obtain a specifictown/city monthly market report.
Amenia North East
Pine Plains Stanford
Washington
Homes Soldup 17%
Q1- 2013 vs.Q1- 2012
Average Pricedown 20%
Q1- 2013 vs.Q1- 2012
Average Sale Price
Town/CityQ1
2013Q1
2012%
Change Full Year
2012Full Year
2011%
Change
Amenia $80,000 $151,500 -47% $222,500 $346,000 -36%
North East $710,000 $0 0% $312,750 $317,500 -2%
Pine Plains $225,000 $177,000 27% $239,775 $175,000 37%
Stanford $450,000 $322,250 40% $335,000 $430,000 -22%
Washington $630,000 $377,500 67% $467,500 $550,000 -15%
Northeast Dutchess $225,000 $282,500 -20% $333,500 $397,500 -16%
Source: Mid-Hudson Multiple Listing Service reports the Average Sale Price.

Northeast DutchessSingle-family homes
Q1-2013 Market Report
Amenia, North East, Pine Plains, Stanford, WashingtonClick to obtain a specific town/city monthly market report.
Supply and Demand Snapshot - Single-family homes
As of March 31, 2013 As of March 31, 2012 2013 vs. 2012
Price Range
SUPPLYActive
Listings
DEMANDPending
Sales
Supply/DemandRatio*
SUPPLYActive
Listings
DEMANDPending
Sales
Supply/DemandRatio*
%Change inListings
%Change inPendings
$0 - $299,999 66 6 11 62 3 21 6.5% 100.0%
$300,000 -$399,999 21 2 11 20 3 7 5.0% -33.3%
$400,000 - $499,999 12 1 12 15 1 15 -20.0% 0.0%
$500,000 - $599,999 5 0 Not Valid 9 1 9 -44.4% -100.0%
$600,000 - $799,999 17 1 17 11 0 Not Valid 54.5% 0.0%
$800,000 - $999,999 16 0 Not Valid 7 0 Not Valid 128.6% 0.0%
$1,000,000 - $1,999,999 18 3 6 21 1 21 -14.3% 200.0%
$2,000,000 and up 34 1 34 33 2 17 3.0% -50.0%
Market Totals 189 14 14 178 11 16 6.2% 27.3%
*Supply Demand Ratio Key 1-4: High Demand 5-6: Balanced 7-9: Low Demand 10+: Very Low Demand
Ten-Year Market History
Average PricePer Square Foot
$206 $252 $244 $254 $207 $198 $204 $252 $221 $254 Average PricePer Square Foot
Dayson Market
190 180 184 205 217 177 219 234 238 209 Dayson Market
% Sale Priceto List Price
95.2 93.9 94.5 91.1 91.5 85.5 88.9 80.9 90.6 84.8 % Sale Priceto List Price
Source: Mid-Hudson Multiple Listing Service, Residential-detached homes.

Q1-2013houlihanlawrence.com
Dutchess County CondominiumsOverview
Q1-2013 Q1-2012 % Change Full Year 2012 Full Year 2011 % ChangeUnits Sold 51 51 0.0% 334 297 12.5%Average Sale Price $180,036 $168,738 6.7% $191,586 $199,877 -4.1%Median Sale Price $153,000 $152,500 0.3% $175,500 $185,000 -5.1%Average Price Per Square Foot $127 $129 -1.6% $134 $134 0.0%Average Days on Market 245 220 11.4% 208 209 -0.5%% Sale Price to List Price 95.3 93.5 1.9% 95.4 95.5 -0.1%
Supply/Demand SnapshotAs of March 31, 2013 As of March 31, 2012 2013 vs. 2012
Price Range
SUPPLYActive
Listings
DEMANDPending
Sales
Supply/DemandRatio*
SUPPLYActive
Listings
DEMANDPending
Sales
Supply/DemandRatio*
%Change inListings
%Change inPendings
$0 - $299,999 272 73 4 312 68 5 -12.8% 7.4%$300,000 -$399,999 91 14 7 63 17 4 44.4% -17.6%$400,000 - $499,999 13 4 3 8 5 2 62.5% -20.0%$500,000 - $599,999 2 0 Not Valid 4 0 Not Valid -50.0% 0.0%$600,000 - $799,999 1 0 Not Valid 0 0 0 0.0% 0.0%$800,000 - $999,999 0 0 0 0 0 0 0.0% 0.0%$1,000,000 - $1,999,999 0 0 0 1 0 Not Valid -100.0% 0.0%$2,000,000 and up 0 0 0 0 0 0 0.0% 0.0%Market Totals 379 91 4 388 90 4 -2.3% 1.1%
*Supply Demand Ratio Key 1-4: High Demand 5-6: Balanced 7-9: Low Demand 10+: Very Low Demand
Ten-Year Market History
Average PricePer Square Foot
$144 $167 $173 $175 $163 $152 $146 $135 $134 $127 Average PricePer Square Foot
Dayson Market
120 116 132 143 172 162 162 209 208 245 Dayson Market
% Sale Priceto List Price
98.1 98.2 97.0 97.2 96.1 95.2 95.1 95.5 95.4 95.3 % Sale Priceto List Price
Source: Mid-Hudson Multiple Listing Service, Residential-attached homes.

Q1–2013houlihanlawrence.com
Houlihan Lawrence Corporate Headquarters
800 Westchester Avenue in Rye Brook, New York is the new home of Houlihan Lawrence’s Corporate headquarters. Staffed with specialists in Marketing and Creative, IT, Social Media and Agent Development, our
state-of-the art headquarters is designed to assist and support our agents.
With our support departments now under one roof, 800 Westchester is a collaborativeand idea-generating environment for our company, our offices and our agents.

1.888.454.7356houlihanlawrence.com