household food expenditures at home and away from home in turkey
TRANSCRIPT

Household food expenditures
at home and away from home in Turkey
Mehmet Bozoglu Department of Agricultural Economics
College of Agriculture Samsun 19 May University, Kurupelit Campus, Samsun, 55139, Turkey
Abdulbaki Bilgic
Department of Agricultural Economics College of Agriculture
Harran University, Osmanbey Campus, Sanliurfa, 63100, Turkey
Steven T. Yen Department of Agricultural and Resource Economics
The University of Tennessee, Knoxville, TN, 37996-4518, USA
Chung L. Huang Athens, GA 30605, USA
Selected Paper prepared for presentation at the Agricultural & Applied Economics Association’s 2013 AAEA & CAES Joint Annual Meeting, Washington, DC, August 4-6, 2013. Copyright 2013 by Mehmet Bozoglu, Abdulbaki Bilgic, Steven T. Yen, and Chung L. Huang. All rights reserved. Readers may make verbatim copies of this document for non-commercial purposes by any means, provided that this copyright notice appears on all such copies.

1
Household food expenditure patterns at home and away from home in Turkey
ABSTRACT
Turkey has experienced important socio-demographic and economic changes shaping food
markets with the resultant significant changes on the consumers’ away from home and at home
food consumptions. We analyze the effects of socio-demographic and economic factors of
expenditures on food away from home (FAFH) and food at home food (FAH) for both urban and
rural households. The study is based on the 2009 Turkish Household Expenditure Survey data
and we model the food expenditure patterns using the multivariate sample selection approach.
The empirical results suggest that urban households tend to spend more on FAFH than FAH as
income increases, while the reverse is true for rural households. Other socio-demographic factors
of households show varying impacts on FAFH and FAH between the two household groups.
Keywords: Expenditures, food at home and away from home, multivariate sample selection,
urban and rural households, Turkey.

2
Introduction
Developing countries have recently experienced rapid changes in food consumption as
income increases (Akbay et al., 2007; Pingali, 2006; Chang and Yen, 2010). As a percentage of
total household spending, food expenditure continues to shrink because of increased income,
while the share of non-food has been increasing. However, the food consumption trend has been
shifting towards food away from home (FAFH) in many Asian countries (Pingali, 2006; Bai et
al., 2012). Worldwide, the consumption of FAFH including eating on and off premises has
substantially increased in recent years (Mancino et al., 2009; Liu et al., 2013). For example, in
the United States (US), the share of FAFH as a percentage of total household food expenditure
rose from 32% in 1980 to 41.3% in 2010 (Mancino et al., 2009). Likewise, the rate also rose
steadily to the level of 32% in 1992 for Canada (Jensen and Yen, 1996), and from 6% in 1983 to
29% in 2006 for Taiwan (Chang and Yen, 2010). In Spain, the proportion of FAFH increased
during the last two decades to 25% in 2002 and to 30% in 2006 (Mutlu and Gracia, 2006;
Angulo et al., 2007). Similarly, FAFH consumption increased from 18% to 24.4% in Greece
during the period of 1982-1994 (Mihalpoulos and Demoussis, 2001), and from 2.3% to 16.4% in
Italy during the period of 1973-1996 (Montini, 2001). Changes in food consumption behaviors
related to FAFH and food at home (FAH) are driven by a wide range of factors including
geography, demography, disposable income, urbanization, infrastructure, globalization,
marketing, religion, culture, women participation in labor force, education, tourism, and
consumer attitudes. These changes have contributed to increases in FAFH and decreases in food
at home (FAH), though foods consumed outside the home are generally higher in fat, saturated
fat, cholesterol, and sodium and lower in fiber and calcium than food prepared at home (Lin et
al., 1999).

3
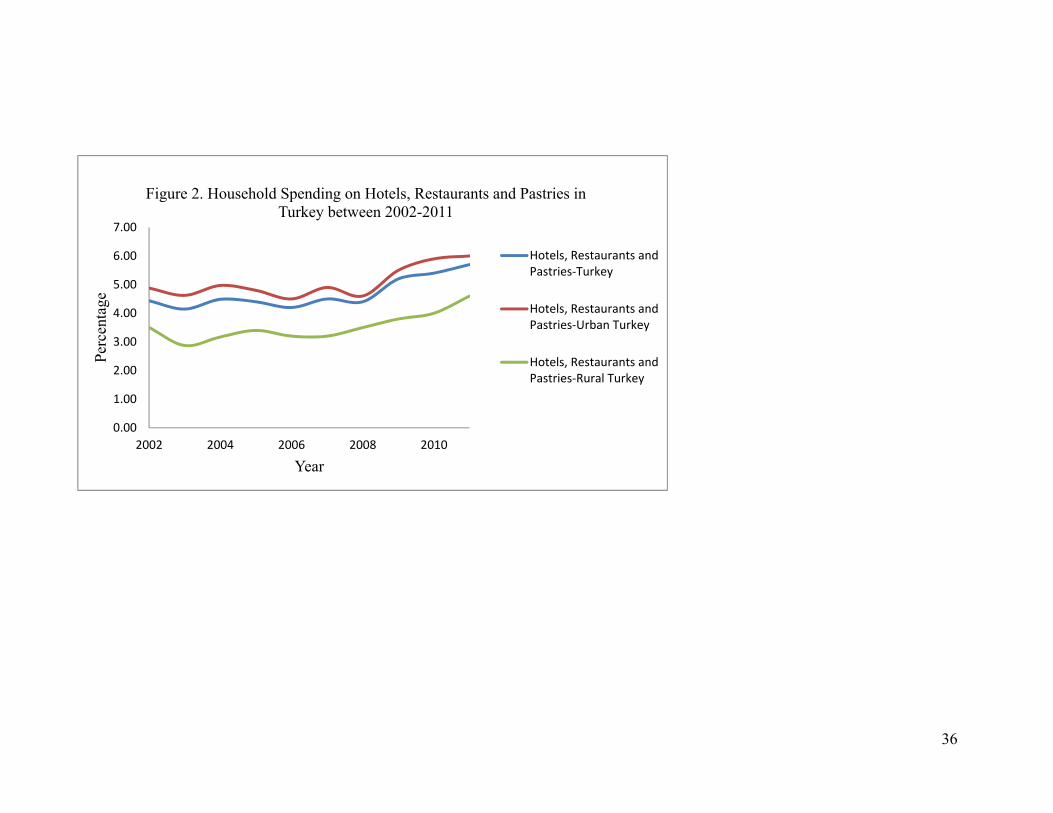
Food expenditure including non-alcoholic beverages as a percentage of total household
spending continued to shrink from 26.7% in 2002 to 20.7% in 2011, while expenditures on
hotels, restaurants, and pastry shops as a percentage of total household spending soar from
4.40% in 2005 to 5.40% in 2010 (TUIK, 2011) as Turkey has experienced an impressive
economic growth since 2002 with a 6.8% average annual rate of per-capita GDP growth (IMF,
2009).1 The average Turkish diet is still largely derived from grains, fruits, and vegetables
(OECD, 2011). Turkish consumption of fruits and vegetables is higher than other OECD
countries. The main staples of Turkish diet are bread, macaroni and bulgur (parboiled pounded
wheat). Whilst lentils, chickpeas and dried beans are the most widely consumed pulses, about
48% and 58% of daily energy comes from bread or bread with other cereals, respectively (FAO,
2001). Despite the general increase in consumption trends, the consumption of bread, milk,
yogurt, red meats, vegetables, fruits, butter, and margarine has decreased due to recent spike in
relative prices.
As the Turkish economy grows and per-capita income increases, a vast array of shopping
centers, supermarkets, hypermarkets and restaurants including fast-food markets has emerged
and the numbers of food service establishments have increased substantially (TUIK, 2011) like
many other Asian countries (Pingali, 2006). Most of these supermarkets, hypermarkets and fast-
food chains are located within big shopping centers (or malls) that they have started eroding their
counterparts’ (e.g., traditional small shops, so called “Bakkal” in Turkey and restaurants) market
potentialities. These shopping malls are becoming a contemporary and dynamic force in Turkey
since the mid-1990s that the country observed a rapid rise in the number of Western type
shopping centers serving cities. Turkey has entered a new era in the retail sector since Galeria
1 Unfortunately the Turkish Statistical Institute (TUIK) reports outside the home expenditures as spending on hotels, restaurants and pastry shops altogether, while the food expenditures also include non-alcoholic beverage spending.

4
opened in 1987 in Istanbul, the first shopping center. Developing new establishments one after
another for about 20 years, the shopping centers in the country have now numbered 135 with 2.4
million meter squares of total leasable areas and offered 450 thousand jobs in the last three years
(AMPD, 2012). This retail sector known as organized or modern retail sector will eventually and
increasingly dominate the Turkish economy in the future (currently with 40% retail share,
equivalently $47.9 million ) and will continue to remain a center of attraction for domestic and
foreign investors. Moreover, the retail companies are beginning to invest more compact store
formats and increasingly establishing new locations in smaller towns (AMPD, 2012).2 However,
unlike Western malls these shopping centers also include retail food markets (e.g., CarrefourSa,
Migros, Gima, and etc.) along with conventional units: many department stores, cafeterias, fast
food courts and/or full service restaurants, entertainment centers, movie theatres, exhibition
halls, banks, pharmacy, spots, and health centers. In general, the food retail sector accounts for
52.8 % of total Turkish retail sectors (AMPD, 2012). In 2010, supermarkets, hypermarkets,
convenience stores, discounters and self-service wholesale stores combined generated
approximately one fourth of total sales in the Turkish food distribution sector of approximately
€65.8 million (AMPD, 2012).
Although Turkish consumers have been shopping primarily from small markets and
grocery stores, their popularities are eroding in favor of mass grocery retailers (supermarkets and
hypermarkets) which provide a wider array and higher quality products. The recently published
data pertaining to the prevalence of fast-food markets throughout the country show that fast food
2 In Turkey the half a million small, independent shops including small market known as “Bakkal” is rapidly declining as organized or modern retail formats proliferate in the economy (Deloitte, 2012). On the other hand, Turkey’s discount retailer has increased its market value 18-fold in the seven years and now been listed on the Istanbul Stock Exchange reaching $6.6 billion. For example, BİM, the discount retailer food market, started with 21 stores in 1995 and increased even more rapidly with 3,538 stores and a turnover of 6.5 billion Turkish Liras by the end of 2011 (AMPD, 2012).

5
continued to be the most dynamic category of Turkish foodservice markets in 2010 (Euromonitor
International, 2010). Tab Gida is the leading franchise company in the Turkish fast-food market
owning 340 fast-food restaurants, of which 261 were Burger King, 43 Sbarro and 36 Popeye’s in
2009. The German fast-food chain Nordsee announced an investment of €100 million by opening
200 branches in Turkey within the following five years (Euromonitor International, 2010). There
are also many smaller domestic fast-food companies that copy the meals and operational
procedures of the foreign companies.3 These figures portrait the rapid change in Turkish diets
and the number of fast food chains and supermarkets has grown quite markedly in the country
and the trend seems set to continue.
The dietary habits are rapidly changing in Turkey, as well as in other developing
countries catching up with more Western-style diets and lifestyles (Pingali, 2006; Akbay et al.,
2007; Gül et al., 2007; Bai et al., 2012). Because of increased wealth and changes in population
composition, the share of FAFH expenditures had increased from 7% to 15% during the period
of 1994-2001 and it was anticipated to increase to 25% in the next 5 years (Gül et al., 2007).4
While dining at fast-food restaurants is very popular especially among children and adolescents,
older generations mostly prefer Turkish restaurants. Turkish cuisine is recognized by many
experts as one of world’s richest, most diverse, and delicious cuisines (Akbay et al., 2007; Gül et
al., 2007). 3 This type of fast-food markets launches generally in tourism dense regions such as Aegean, Mediterranean and Marmara as coastal regions and large shopping malls and centers.
4 Although it is possible to extract a ten-year (from 2000 to 2010) monthly household FAFH expenditure from annual household expenditure surveys monitored by the Turkish Statistical Institute (TUIK) to show its tendency, it is, however, time consuming given a large data set for each corresponding year. On the other hand, while total and per capita food consumption in the country are expected to soar by 34 and 21 percent, respectively, between 2009 and 2014, contrarily, the food consumption as a percent of GDP is expected to fall from 8.4% to 7.2% in the same specified period (Business Monitor International, 2010).

6
Although there has been a growing body of literature evaluating consumers’ food
consumptions and expenditures on some specific products in Turkey (Armagan and Akbay,
2008; Tiryaki and Akbay, 2010; Günden et al., 2011), no study (to our best knowledge) has
devoted to simultaneous examination of FAH and FAFH expenditures among households as
these expenditures continue to grow in both the food retailing and catering sectors.5 In particular,
over the last two decades Turkey has experienced substantial economic developments and socio-
demographic changes that may have led to prominent changes in household spending on FAH
and FAFH both in rural and urban regions. The increase in FAFH expenditures on one hand and
the growing number of modern food retail sectors on the other imply the colossal creation of
demand for high value and specialty food items and catering services. Given the rapid rise in
FAFH consumption and its increasing importance relative to FAH, there is a urgent need to
understand what important factors may determine FAFH and FAH expenditures. The decision to
consume FAH and FAFH are interrelated and a better understanding of household socio-
economic characteristics associated with both expenditure types and the probability to consume
them are essential to comprehending changes in the food sector. The information will facilitate
decision makers in forecasting food demand and drawing their implications in eating habits on
diet and health. The gained knowledge will lead to the design of effective marketing programs
for food retailing sectors including modern food retail sector and catering services.
The food consumption habits between rural and urban households are reflected in
household compositions and lifestyles, including the use of amenities and socio-economic
5 A study by Gül et al. (2007) is an exception, who investigated the households’ FAFH expenditure patterns in the urban area of Adana city using the 2001 data from Turkish Statistical Institute (TUIK). Meanwhile, Akbay et al. (2007) relied solely on fast-food consumption in Turkey.

7
statutes, which vary greatly and may show entirely different food consumption patterns.6
Expenditures on food including non-alcoholic beverages as a percentage of total household
consumption in Turkey are greater (10%) in rural than that of urban cities in 2011, while rural
households consume less on hotels, restaurants and pastries (Figures 1 and 2). As expected, rural
households have a higher share of FAH expenditures as compared to urban households, but
relatively small proportion of FAH provision is demanded in rural households. Generally, the
rural households nourish with cereals, vegetable and fruits, whilst the urban households consume
more dairy products, red and poultry meats and fishery products. Therefore, it would be
appropriate to analyze food consumption expenditures for urban and rural households separately.
Although FAH and FAFH issues in less and developing countries have been the focus of
investigation with diverse approaches encompassing economics, health, nutrition, agricultural or
catering services aspects (Pingali, 2006; Chang and Yen, 2010; Liu et al., 2013; and among
others), the focus on the need for an integrated urban-rural framework has so far not been
adequately addressed in Turkey. In this study, we use (multivariate) sample selection system
(SSS) to investigate household decision for FAH and FAFH expenditures between urban and
rural households using the 2009 Turkish national household expenditure survey. The information
obtained from this study about the driving forces behind food choices will help derive
implications of changes in household eating habits and develop effective nutrition intervention
programs for food quality improvement across the nation.
The paper is organized as follows. Section 2 outlines the econometric method. Following
a brief description of the data in section 3, the main results are presented in section 4. The final
6 Urbanization is an unavoidable driving force behind the changing food consumption patterns, given that urban dwellers are growing at a remarkable rate (70% of total population lives in urban areas with a 1.7% of urbanization rate) (CIA, 2012).

8
section summarizes and concludes.
Econometric model
We begin with household production theory (Becker, 1965) as the underlying theoretical basis
for analyzing the expenditures for FAH and FAFH (Liu et al., 2013).7 In this case, households
are assumed to be both producing and utility-maximizing units. In other words, households
maximize their utility functions in the consumption of home produced goods subject to a
household production function, time, and income constraints. Every household is assumed to
maximize the random utility subject to a fixed budget m as:
,
, ; |maxq c
U Dq c s p q c m (1)
where 1 2,[ , ..., ]nq q q q is the quantity vector (e.g., in our case FAH and FAFH) with positive
prices 1 2,[ , ..., ]np p p p , c is a composite commodity for other goods with price normalized at
unity, s is a vector of household demographic variables, and 1 2diag , ,..., nD d d d is a diagonal
matrix with elements di such that di =1 if a household is a potential consumer of qi and di = 0
otherwise (Yen, 1993; Liu et al., 2013). The solution to this optimization problem gives the
traditional demand functions for market goods which are used as inputs for goods produced in
the household. Multiplied by their respective prices, these demand functions can be expressed in
expenditure forms, Ei = piqi and in this case censoring in Ei is governed by a sample selection
mechanism. We follow this approach in deriving both expenditures for FAH and FAFH in this
study (Yen, 1993; Mutlu and Gracia, 2006; Liu et al., 2013).
We draw on the multivariate sample selection approach of Yen (2005) and consider a 7 We are grateful to an anonymous referee for drawing our attention to link the utility maximizing concept to the household production function for deriving FAH and FAFH expenditures.

9
simplified two-good sample selection system (SSS) in which censored expenditure for FAFH
1( )y is governed by a sample selection mechanism and expenditure for FAH 2( )y is always
positive:
1 1 1 0
1 0
2 2 2
log if 0
0 if 0
log
y x u z u
y z u
y x u
¢ ¢= + + >¢= + £
¢= + (2)
where x and z are vectors of explanatory variables, 1 2, and are conformable parameter
vectors, and the error terms 0 1 2[ , , ]u u u u ¢= are distributed as trivariate normal with zero means,
variances 2 21 2[1, , ] ¢ , and covariance matrix
1 01 2 02
21 10 1 1 2 12
22 20 2 1 21 2
1
é ùê úê ú= ê úê úë û
(3)
In equation (2), the dependent variables iy are log-transformed, which ameliorates non-
normality and heteroscedasticity in the error terms (Yen and Rosiński, 2008). The system can be
estimated by the method of maximum likelihood (Yen, 2005).
Restricting error correlations 10 20 21 0 = = = reduces the model to an independent
system, which constitutes a two-part model for 1log y along with a linear regression model for
2log .y This two-part system can be estimated as probit using binary outcome for 1y using the
whole sample, ordinal least-squares for 1log y using the truncated sample (conditional on 1 0y >
), and ordinal least-squares for 2log y using the whole sample. Test for the full model against
independent system can be carried out by likelihood-ratio (LR), Lagrange-multiplier (LM), or
Wald test.
Upon estimation, marginal effects on probabilities, conditional levels, and unconditional

10
levels can be calculated. For good i = 1 which is censored, the probability of a positive
observation is
1 1Pr( 0) Pr( ) ( )y u z z ¢ ¢> = >- = (6)
and the conditional mean of the dependent variable 1y is (Yen and Rosinski, 2008)
2 1 21 11 1 1
1
( )( | ) exp( / 2)
( )
zE y u z x
z
¢ +¢ ¢>- = +
¢ (7)
Using (6) and (7), the unconditional mean of 1y is
1 1 1 1
21 1 1 21 1
( ) Pr( 0) ( | 0)
exp( / 2) ( )
E y y E y y
x z
= > >
¢ ¢= + + (8)
For 2y which is not censored (and with a log-transformed dependent variable), we will examine
its unconditional mean
22 2 2( ) exp( / 2)E y x ¢= + (9)
Differentiating (differencing) equations (6)–(9) gives the marginal (discrete) effects of
explanatory variables. We calculate marginal effects for all sample observations and the results
are averaged over the sample. For statistical inference, standard errors are calculated by the delta
method (Rao, 1973, p. 388).
Data
We use the 2009 Turkish Household Expenditure Survey (THES) conducted by the Turkish
Statistics Institute (TUIK). The sample has 10,046 observations obtained between 1 January and
31 December 2009. About 10% of the households (1,050) were replaced monthly by ones with
similar characteristics. The sample used in this study includes 6,385 urban households and 2,920

11
rural households, after outliers and households headed by an individual under age 20 are deleted.8
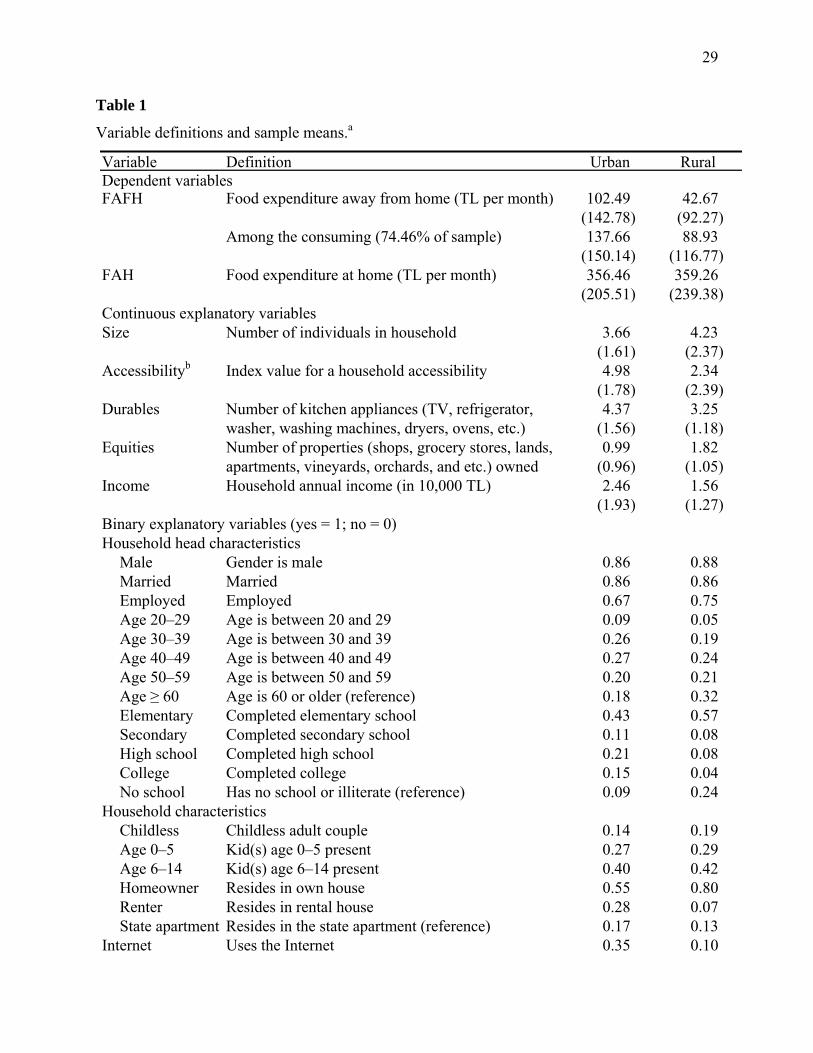
Table 1 shows descriptive statistics for both urban and rural subsamples based on the
household head and socio-demographic characteristics. These characteristics are used to quantify
factors affecting FAFH and FAH (Mutlu and Gracia, 2006; Angulo et al., 2007; Chang and Yen,
2010). FAFH includes all meals (breakfast and brunch, lunch, dinner and snacks and nonalcoholic
beverages) including tips at fast food, take-out, delivery, concession stands, buffet and cafeteria, at
full-service restaurants, and at vending machines and mobile vendors. Also included are board
(including at school), meals as pay, special catered affairs, such as weddings, bar mitzvahs, and
confirmations, school lunches, and meals away from home on trips (BLS, 2012). On the other
hand, the FAH expenditures include cereals (bread, wheat, corn, oat, rice, pasta, bulgur, barley
etc.), vegetable and fruits (all kinds of green or frozen vegetable and fruits), milk and dairy
products (milk, yoghurt, cheese etc.), red meat (fresh and frozen beef, veal, mutton, lamb, goat and
kid’s meats), poultry meat (chicken, turkey meat etc.), fishery products (fresh and frozen fish and
other fishery products), sugar, jam and marmalade products, species products (sauces, seasonings,
salt, and etc.), non-alcoholic beverages (tea, coffee, mineral waters, and carbonated drinks).
Gender, marital, employed statuses, age categories, and education are included as household
head characteristics, while household characteristics include size, number of durable goods including
TVs, and number of equities, adjacency to surrounding facilities, income, home ownership, presence
of children, and Internet uses. The TUIK classified rural settlements as those whose population is
equal or fewer than twenty thousand, while greater than twenty thousand population is classified as
urban area. We will use this classification in our analysis. Among those consuming, urban
households spend more on FAFH (138 TL per month) with relatively higher variation than their
8 We exclude households with income and some other key variables that exceed five standard deviations above (or below) their corresponding means (Yen et al., 2004).

12
rural counterparts (89 TL), probably because the majority of household members in urban areas are
working and eating outside their home. Most shopping centers in Turkey are concentrated in urban
areas and it is reasonable to expect wealthier and busier families to choose dining out more often
than preparing meals themselves at home. All other factors being equal, urban households tend to go
shopping more frequently than their rural peers due to convenience and easy accessibility.
The THES includes FAFH for both self-paid meals at restaurants, cafeterias, and food
shops and employer paid meals at a charge that is notably lower than market price for an
equivalent meal if any members of household work outside the home. Some private companies
in Turkey provide employees with food coupons or gift cards that can be used to purchase at
nearby food outlets, with the spending deducted from salary. Rural households spend slightly
more on FAH (359 TL) among the consuming than urban households (357 TL) probably because
rural households are larger in size with stronger family ties. Their FAH may include hosting
wedding ceremonies and all other social gatherings. Mean values of continuous variables are
much greater among urban households than rural households except household size and number
of properties. A vast majority of rural households are homeowners (80%) as compared with
urban households (55%). Tenants in rural areas are mostly government personnel (educators,
healthcare workers and soldiers) who may or may not pay rents for residing in buildings usually
provided by the state. Table 1 also shows that more urban households own automobile (36%)
than households residing in rural areas (25%). As expected, use of the Internet is more common
in urban areas (35%) than rural areas (10%); these rates are considerably lower than those in
Western countries.
We include automobile ownership and uses of the Internet at home as proxies for wealth
in terms of easy access to food. Internet can help search for food items and automobile provides

13
a convenient means to access food centers quickly and directly. Owning a car enables a
household to save time on shopping for staple foods or dining out. New technologies (Internet
and mobile phone) can impact the way people access information for a dinner or lunch away
from home and for maintaining closer social ties (Huang et al., 2012).
We impose exclusion restrictions to avoid over-burdening the nonlinear functional form
inherent in the distributional assumption for parameter identification. In the absence of a clear
guidance for what variables to include in which equation, we specify several continuous
variables (numbers of durable goods and real estates owned) as proxies for income in the
selection equation of FAFH, and use the income variable in the expenditure equations. Such a
model specification guarantees that the parameters among the equations in the system are
properly identified and estimated. We also check for multicollinearity among regressors in both
the selections and level equations by calculating the variance inflation factors (VIFs) for all
explanatory variables among the equations for both subsamples. All VIFs are very small for both
the urban (< 4.0) and rural (< 2.5) samples, suggesting multicollinearity was not an issue among
explanatory variables in the selections and level equations (Chatterjee and Hadi, 2006).
Results
Specification tests and maximum-likelihood estimates
Our first empirical task was to determine appropriateness of sample pooling. This is
carried out with a formal statistical test based on results of the rural, urban, and pooled samples.
Denote the maximum log-likelihood values of the three samples as log , log ,r uL L and log ,pL
with corresponding numbers of parameters kr, ku, and kp, respectively. Then, the LR statistic,
2(log log log ),r u pLR L L L is Chi-squared distributed with (kr + ku – kp) degrees of freedom.

14
Based on the log-likelihood values of the three samples, the hypothesis of equal “slope”
parameters between rural and urban households was rejected (LR = 409.926, df = 69, p-value <
0.0001). The analysis is therefore based on the separate rural and urban samples.
Another important specification issue relates to use of log-transformed model versus
untransformed model. Our attempt to estimate the dependent untransformed system was
unsuccessful and therefore we use the independent system as a vehicle for testing of functional
form. Using Vuong’s (1989) non-nested specification test, the log-transformed model (independent
system) is found to perform better than the untransformed system for the rural sample (standard
normal statistic z = 14.54) and urban sample (z = 20.25), both with a p-value < 0.0001.
Finally, results of LR and LM tests suggest rejection of the two-part model for FAFH and
the OLS model for FAH for both urban (LR = 193.00, LM = 28.07, df = 3) and rural households
(LR = 20.14, LM = 13.69, df = 3). The tests also rejected the pairwise sample selection system,
which constitutes the bivariate sample selection model for FAFH and linear equation with 1log y
for FAH, for urban households (LR = 7.61, LM =13.85, df = 2) and rural households (LR = 7.61,
LM = 7.19, df = 2). All tests were statistically significant with a p-value < 0.0001. Thus, the use
of the SSS is preferable to both the pairwise and independent systems for both the rural and
urban samples in accommodating censoring and improving statistical efficiency.
Maximum-likelihood (ML) estimates of the SSS are presented in Table 2. The correlation
coefficient, 01 , which captures the correlation among unobservable factors affecting selection
decision to consume FAFH and its spending level, is significant and interestingly negative in both
the urban and rural samples. The result suggests that after accounting for observed covariate
differences in both the probability of consuming FAFH and its spending level, the unobservable
characteristics affected the level of FAFH spending negatively in the sense that a higher propensity

15
to consume FAFH would lead to less spending. In contrast, households with lesser tendency to
participate in FAFH market would result in spending conditional on the consumption. On the other
hand, the correlation coefficient, 02 , between the error terms of the selection for FAFH and level
equation for FAH are positive in both subsamples, indicating that after controlling the observable
covariates in the system, the unobservable factors from the error terms of the FAFH selection
equation have a positive effect on the spending of FAH. In other words, a higher propensity to
consume FAFH tends to cause more spending on FAH, and vice versa, ceteris paribus. The result
provides strong evidence of a complementary relationship between the participation decision of
FAFH and both urban and rural households’ daily expenditures on FAH. This result is to be
expected because households that shop for FAH are likely eat outside the home, if they are far
away from home or if they shop with family members (kids).
Coefficients of the selection equations vary considerably in signs and magnitudes
between the urban and rural households, while spending level estimates are similar between the
two groups of households. These differences in probabilities of consuming FAFH stem partly
from differences in lifestyles and economic conditions between the rural and urban households
and further support the need to analyze the two samples separately. As marginal effects would
convey more insightful information on the effects of explanatory variables than the ML
estimates, we turn to the marginal impacts for the remainder of the analysis.
Marginal effects
Table 3 presents marginal effects of explanatory variables on the probabilities, conditional
level, and unconditional level of FAFH and FAH for both urban and rural households. Overall, all
variables except Equity are statistically significant and important factors in determining FAFH and
FAH expenditures among both urban and rural households. Among the quantitative factors,

16
household size increases the probability of participation in FAFH (2.73% for urban households and
0.96% for rural households) and FAFH and FAH spending levels in both the urban and rural
households. All else equal, each additional household member increases the probability of
consuming FAFH by 2.73%, the conditional expenditure by 10.84 TL per month, and FAH by 40.67
TL per month. The corresponding effects are much smaller for the rural households at 0.96%, 2.69
TL, and 22.58 TL, respectively. These positive effects of household size on FAFH echo findings in
previous studies (Mihalopoulos and Demoussis, 2001; Chang and Yen, 2010). Akbay et al. (2007),
in contrast, find a decreasing affinity to eat fast food as household size increases in Turkey, though
their finding was based on ordinal fast-food consumption frequencies.
Accessibility to business centers and other facilities (buses, health, schools, shopping,
and etc.) contributes to FAFH expenditure. Access to each additional facility increases the
probability to consume FAFH by 0.65% for urban households and 0.80% for rural households.
For no obvious reason, access to each additional facility decreases FAFH expenditure by 2.59 TL
per month for urban households. Accessibility has positive effects on FAH expenditure for both
urban and rural households. The effects of accessibility are interesting because they imply that
high accessibility to surrounding business centers of a home translates into more FAH and less
FAFH. Durables, which are viewed as proxy for income, have positive effects on the probability
and levels of FAFH and FAH expenditures for both urban and rural households with greater
magnitudes among rural households. Higher income increases the levels of FAFH and FAH
expenditures of urban and rural households. The positive effects of income on FAFH
expenditures are in line with the findings from previous studies (Yen, 1993; Jensen and Yen,
1996; Akbay et al., 2007; Zan and Fan, 2010; Liu et al., 2013). It is worth noting that as the
household income increases, urban households tend to spend more on FAFH than rural

17
households, while the opposite is true for FAH. The results are to be expected because dining out
is generally consistent with the lifestyles of urban households that are seeking for convenience,
social gatherings and entertainments, while rural households are more inclined to eat at home or,
more specifically, the FAFH facilities are less accessible for rural households.
Among the qualitative variables, we found both FAFH and FAH expenditures to be
higher among urban households headed by a male, while the propensity to consume FAFH
(13.84%) and the FAH expenditure level (51.05 TL) are higher among rural households headed
by a male. Angulo et al. (2007) report a positive gender (male) effect on FAFH in Spain. The
difference between male-headed urban and rural households is notable in that rural households
spent more than two and a half times more on FAH than urban households. A possible
explanation is that FAFH is more accessible for urban than for rural households so that male-
headed urban households can easily substitute FAH with the convenience of FAFH to avoid the
chores of preparing meals. Furthermore, there is a social norm about a male-headed household in
rural Turkey to be responsible for taking care for the needs of the home, while this sense of
family obligation is less evident among urban households.
Urban households with a married head are 4.14% less likely to spend on FAFH than their
unmarried peers. Being married also has significant positive effects on FAH expenditures for
both urban and rural households. Zan and Fan (2010) find that married household heads tend to
spend less on FAFH than single male-headed households. Employment plays a role on FAFH
among urban households, but not rural households. Urban households with an employed head are
14.03% more likely to consume FAFH and spend 39.49 TL more per month than their
unemployed counterparts. Our results are consistent with earlier findings (Yen, 1993; Jensen and
Yen, 1996; Stewart and Yen, 2004) that labor force participation, a measure for the opportunity
18
cost of time, increases both FAFH and FAH. Akbay et al. (2007), on the other hand, find no
significant effect of women labor force participation on the frequency of fast food consumption.
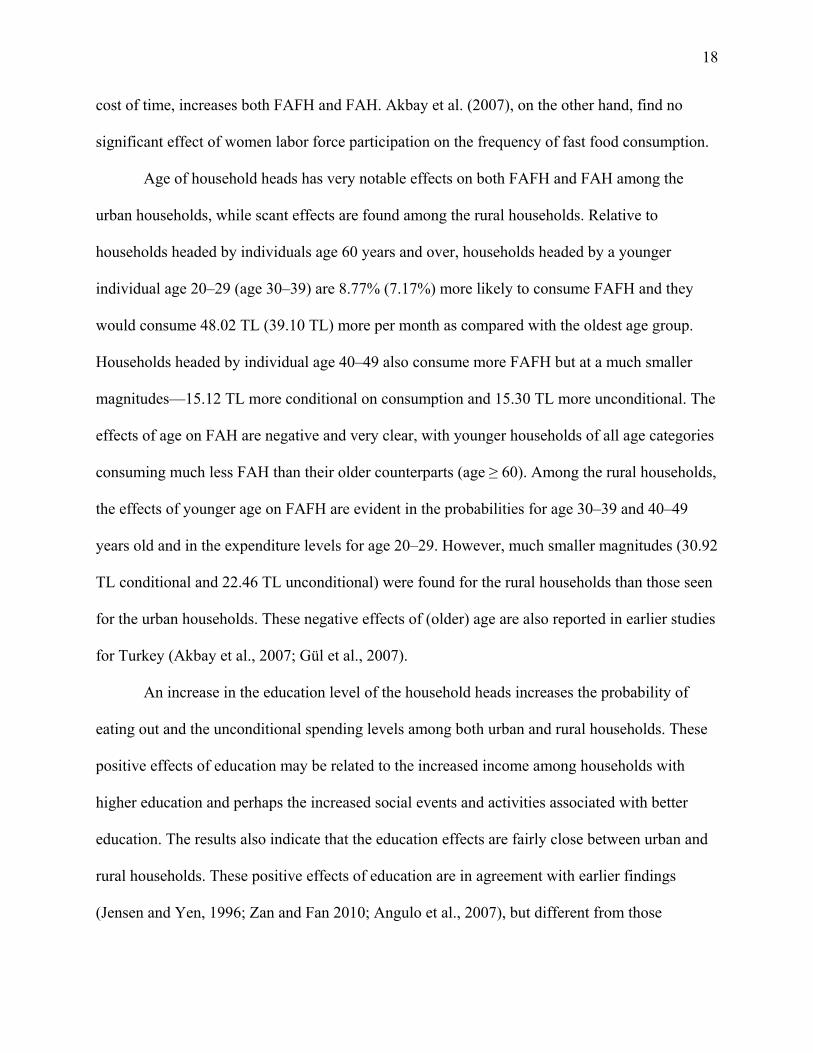
Age of household heads has very notable effects on both FAFH and FAH among the
urban households, while scant effects are found among the rural households. Relative to
households headed by individuals age 60 years and over, households headed by a younger
individual age 20–29 (age 30–39) are 8.77% (7.17%) more likely to consume FAFH and they
would consume 48.02 TL (39.10 TL) more per month as compared with the oldest age group.
Households headed by individual age 40–49 also consume more FAFH but at a much smaller
magnitudes—15.12 TL more conditional on consumption and 15.30 TL more unconditional. The
effects of age on FAH are negative and very clear, with younger households of all age categories
consuming much less FAH than their older counterparts (age ≥ 60). Among the rural households,
the effects of younger age on FAFH are evident in the probabilities for age 30–39 and 40–49
years old and in the expenditure levels for age 20–29. However, much smaller magnitudes (30.92
TL conditional and 22.46 TL unconditional) were found for the rural households than those seen
for the urban households. These negative effects of (older) age are also reported in earlier studies
for Turkey (Akbay et al., 2007; Gül et al., 2007).
An increase in the education level of the household heads increases the probability of
eating out and the unconditional spending levels among both urban and rural households. These
positive effects of education may be related to the increased income among households with
higher education and perhaps the increased social events and activities associated with better
education. The results also indicate that the education effects are fairly close between urban and
rural households. These positive effects of education are in agreement with earlier findings
(Jensen and Yen, 1996; Zan and Fan 2010; Angulo et al., 2007), but different from those

19
reported by Yen (1993). Akbay et al. (2007), however, find only college education increases
frequency of visits at fast-food market in Turkey among all education levels.
Interestingly, childless households have a less penchant to dine out. Urban (rural)
households without children are 8.05% (13.76) less likely to consume FAFH, and they spend
31.74 TL (31.07 TL) less conditional on spending, and 32.95 TL (24.55 TL) less unconditional,
than their peers with children. It is reasonable to expect that households with children are more
likely to patronize fast-food services and incur more FAFH expenditures than childless
households. Childless households may also forgo some of their food consumption to save for
other non-food items presumably at the early years of their marriage. The impacts of being
childless on FAH consumption more than doubled for rural households (57.29 TL less) as
compared to their urban peers (23.20 TL less). Similar findings for presence of children are also
reported by Stewart and Yen (2004). Urban households with young children age 0–5 are 5.71%
less likely to consume FAFH and they spend 23.05 TL less than their counterparts without such
young children. For urban households, presence of children age 6–14 does not affect the
probability to consume FAFH, but it decreases conditional and unconditional FAFH spending by
32.14 TL and 27.00 TL, respectively. Presence of children (age 0–5 and age 6–14) decreases
FAH expenditure among urban households. Negative effects of pre-school and school children
on FAFH were also reported in previous studies (Jensen and Yen, 1996; Mihalpoulos and
Demoussis, 2001; Chang and Yen, 2010). In contrast, Akbay et al. (2007) show that households
with children consume fast food more frequently than childless households, though more
frequent visits do not necessarily imply higher levels of spending. Relative to households
residing in government housing, rural homeowners are 6.71% less likely to consume FAFH,
while urban homeowners were found to spend 32 TL more per month on FAH. Urban and rural

20
renters spend 12.16 TL and 22.97 TL more per month, respectively, on FAFH. The large
difference on FAFH expenditures observed between urban and rural renters might be caused by
the fact that many rural renters being seasonal workers away from their home.
The use of Internet, a proxy measure for both income and knowledge sharing tool,
increases the probability for eating out among the urban (8.33%) and rural (15.34%) households
and it also has a significant and positive effect on FAFH expenditures for urban (26.00 TL) and
rural (15.72 TL) households. Today, the Internet has many functions as dissemination of
information network such as inviting friends or relatives to home or to go out for a dinner, or
planning a social gathering via Facebook, e-mail, messenger, etc. The internet also serves as a
convenient tool to search for the best places to dine out and to order for take-out or home-
delivery meals. While rural households with an Internet have a higher probability to dine out
than their urban peers, they tended to spend less on FAFH, as expected. On the other hand, rural
households spent more on FAH than their urban counterparts. Despite its associated burden of
fuel and maintenance costs, having an automobile increases both the probabilities of eating out
and spending levels for all households, urban or otherwise. In addition, the effects are similar for
both urban and rural households. This result is consistent with Chang and Yen (2010) who report
a positive relationship between the number of cars and FAFH expenditures.
Concluding remarks and policy implications
Turkey’s rapid economic development coupled with political stability in the last decade
has brought about significant changes in consumers’ food habits. Consequently, new processed
products are constantly introduced and become available at supermarkets, hypermarkets and
catering services. The provision of more varied menus and a wider array of dining amenities at

21
full-service restaurants and fast-food markets are evident every day as well as the emerging of
numerous new catering establishments throughout the country. In this study, we analyze factors
that influence household spending on FAFH and FAH by estimating a multivariate sample
selection system using the household expenditure data from Turkey. The study shows that after
controlling household covariates, unobservable factors that affect the likelihood of eating out will
likely diminish the amount on FAFH once non-zero expenditure is observed. Contrarily, the
unobservable factors affecting the likelihood of consuming FAFH will likely boost food
consumption at home. Consistent with recent statistics on increasing number of caterings in the
country, we find that increasing household income has a significant positive effect on FAFH as
well as FAH expenditures.
These findings are very important because they indicate that food service firms in urban
areas, in particular, are likely to capture more of the increased income than other food industries
targeting at-home food markets, while the reverse is true for the rural regions. The increased
demand for FAFH will likely trigger further growth of catering services including full-service
and fast-food markets with wider array of venues. The industry currently provides employment
for many poor workers and creates demand for other food chains from farmers to retailers. Thus,
a better understanding of household food behaviors is needed for policy makers to facilitate such
changes in the food industry and for them to plan for long-term economic growth and
development.
Households whose heads are employed spend more on both FAH and FAFH products.
The result may directly draw attention on greater participation of women, especially those with
higher levels of education, in the labor market as rapid urbanization prevails throughout the
country. Rapid urbanization, improving individuals’ education, and women participation in the

22
labor pool will in turn create the “effective demand” for food quality and security (Pingali, 2006)
for both FAH and FAFH. In this case, there is a greater need for the regulation and control of
food safety. Therefore, many countries worldwide have established new institutions, standards,
and methods for handling and regulating food safety and increased investments in controlling
hazardous elements such as the Hazard Analysis Critical Control Point (HACCP). The increased
consumption of food prepared outside the home, the frequent consumption of greater varieties of
fresh and minimally processed foods, and greater consumption of fish, seafood, meat, poultry
and dairy products along with household composition around the world let changes in food
handling and consumption. Hence, health-oriented government agencies should design and
implement effective nutrition and education programs that emphasize the importance of FAH
preparation in general and FAFH in particular (Pingali, 2006) and work on social marketing
initiatives with restaurants for tasty and healthful menu items in particular (Stewart and Yen,
2004). In order to reduce potential negative effects of eating in and out, policy makers should
also improve the efficacy of food safety controls. The Ministry of Food, Agriculture and Animal
Husbandry (MFAA) has recently started exposing to the public imitation and adulteration of
foods by food companies. This exposure seems to be a good start in the right direction, but it
should continue with stoutness and support of all non-governmental organizations including
consumers association in Turkey for improvements in quality, food safety, consumer health, and
environment. Also, the increasing use of the risk analysis framework for regulatory decision-
making process requires focusing on the food supply chain, on identifying where hazards are
introduced into products and controlled for most cost effectively in the chain (e.g., “farm to
table” or “farm to fork”) (Pingali, 2006).
Our results are also important to food industry managers and analysts interested in

23
knowing the driving forces of household food choices. Developing effective marketing programs
and policies are one of the primary concerns of the food distribution and retail industries. The
results of this study are useful to managers of the food establishments for forecasting more
accurately future consumption patterns of FAFH and FAH, for identifying new business
opportunities, and for planning and designing their marketing strategies and programs to better
serve the consumers. For example, catering services in urban areas should target larger
households with higher incomes with a promotion (discounting) to an additional member of a
family over a certain threshold. Marketing efforts by the food establishments also should place
more emphasis on the employed, more educated, younger, and male-head households. Receiving
orders from the Internet, delivering ads and promotions to their customers via the Internet and
having enough parking spaces appear to be viable means to capture additional market shares.
Also, it is worthy to note that food industries for home staples and catering establishments are
expected to continue to grow substantially in the future in Turkey. However, any changes in
market share between these two giant food industries will also depend on how these firms
collaborate with each other. Nowadays, it is common to see a supermarket with a full-service
and/or fast-food service in a building sharing the first and second floors or next to each other
throughout cities in the country. Meanwhile, changing dietary patterns of the Turkish society and
rising import competition among supermarkets, hypermarkets, catering services, and other
market-related services in the country will have general impact on agricultural sector via
commercialization that meets the needs of the changing market conditions. In such cases,
governments should do infrastructure and institutional forms that meet standards enabling
environment for commercialization of farms (Pingali, 2006). Moreover, rapid urbanization and
women in labor pool have started diverting the dietary patterns worldwide towards more

24
processed and pre-prepared foods in response to long working hours and less physical activity
(Popkin, 2001). Increasing the impacts of supermarkets, hypermarkets, discounted markets and
catering services throughout the country would ultimately bring changes in all aspects of the
food chain. Pingali (2006) points out that accessible and cost-effective communication systems
such as mobile phones and Internet can help farmers generate information and market-related
services requiring quality and diversification in product choices. Divergences in tastes and
preferences of foodstuffs consumption (FAH and FAFH) between rural and urban households in
Turkey may disappear over time with intensive migration to urban areas, transportation, mass
media, emerging of small-scale markets penetrating into the rural areas, formation of new cities
to surrounding rural villages, and/or with the expansion of existing provinces into rural area
zones, especially given the expected expansion of modern retail formats away from urban
centers. As for future research, it should be focused more on how obesity and FAFH are related,
on testing nutritional values from both FAH and FAFH, and on analyzing spending patterns
between traditional Turkish restaurants and fast-food markets.

25
References
Akbay, C., Tiryaki, G.Y., Gül, A., 2007. Consumer characteristics influencing fast food
consumption in Turkey. Food Control 18 (8), 904–913.
AMPD, Alisveris Merkezleri ve Perekendeciler Dernegi, www.ampd.org. (accessed 06 October
2012).
Angulo, A.M., Gil, J.M., Mur, J., 2007. Spanish demand for food away from home: analysis of
panel data. Journal of Agricultural Economics 58 (2), 289–307.
Bai, J., Zhang, C., Qiao, F., Wahl, T., 2012. Disaggregating household expenditures on food
away from home in Beijing by type of food facility and type of meal. China Agricultural
Economic Review 4 (1), 18–35.
Becker, G. S., 1965. A theory of allocation of time. Economic Journal, 75, 493–517.
BLS, 2012. Consumer Expenditure Survey, Bureau of Labor Statistics, United States Department
of Labor, http://www.bls.gov/cex/csxgloss.htm (accessed at October 10, 2012).
Business Monitor International, 2010. Turkey food and drink report-Q2 2010.
http://www.businessmonitor.com (accessed 20 April 2012).
Chang, H.H., Yen, S.T., 2010. Off-farm employment and food expenditures at home and away
from home. European Review of Agricultural Economics 37 (4), 523–551.
Chatterjee, S., Hadi, A.S., 2006. Regression Analysis by Example, 4 edn. Wiley, New York.
Central Intelligence Agency (CIA). The work of a nation. Available at
https://www.cia.gov/library/publications/the-world-factbook/geos/tu.html (accessed 30
October 2012).
Deloitte, 2010. Turkish food and beverage industry report. Republic of Turkey Prime Ministry.
Investment Support and Promotion Agency of Turkey. Available at

26
http://www.invest.gov.tr (accessed 23 October 2012).
Euromonitor International, 2010. Fast Food in Turkey. http://www.euromonitor.com/fast-food-
in-turkey/report (accessed 1 May 2012).
FAO, 2001. Nutrition Country Profile of Turkey. Rome: Food and Agriculture Organization of
the United Nations, Food and Nutrition Division, March.
http://www.fao.org/ag/agn/nutrition/tur_en.stm (accessed 30 May 2012).
Gül, A., Akbay, C., Özcicek, C., Özel, R., Akbay, A.O., 2007. Expenditure pattern for food away
from home consumption in Turkey. Journal of International Food and Agribusiness
Marketing 19 (4), 31–43.
Günden, C., Bilgic, A., Miran, B., Karli, B., 2011. A censored system of demand analysis to
unpacked and prepackaged milk consumption in Turkey. Quality and Quantity 45 (6),
1273–1290.
Huang, G.C, Okamoto, J., Valente, T.W., Sun, P., Wei, Y., Johnson, C.A, Unger, J.B., 2012.
Effects of media and social standing on smoking behaviors among adolescents in China.
Journal of Children and Media 6 (1), 100–118.
International Monetary Fund, 2009. Turkey: Selected issues, IMF Country Report No 07/364,
November 2007. http://www.imf.org/external/pubs/ft/scr/2007/cr07364.pdf (access 10
May 2012).
Jensen, H.H., Yen, S.T., 1996. Food expenditures away from home by type of meal. Canadian
Journal of Agricultural Economics 44 (1), 67–80.
Lin, B. H., Frazão, E., Guthrie, J., 1999. Away-from-home foods increasingly important to
quality of American diet. Washington DC: US Department of Agriculture, Economic
Research Service, Agriculture Information Bulletin No. 32, January.

27
http://www.ers.usda.gov/publications/aib749/aib749.pdf (accessed 10 June 2012).
Liu, M., Kasteridis, P., Yen, S.T., 2013. Breakfast, lunch, and dinner expenditures away from
home in the United States. Food Policy, in press.
Mancino, L., Todd, J., Lin, B.H., 2009. Separating what we eat from where: measuring the effect
of food away from home on diet quality. Food Policy 34 (6), 557–562.
Mihalopoulos, V.G., Demoussis, M.P., 2001. Greek household consumption of food away from
home: a microeconometric approach. European Review of Agricultural Economics 28
(4), 421–432.
Montini, A., 2001. Food away from home and households expenditures in Italy. The food
consumer in the early 21st century. April 19–20, Zaragoza, Spain.
Mutlu, S., Gracia, A., 2006. Spanish food expenditure away from home (FAFH): by type of
meal. Applied Economics 38 (9), 1037–1047.
OECD, 2011. Turkey - Agricultural policy monitoring and evaluation 2011.
http://www.oecd.org/document/8/0,3746,en_33873108_33873854_48709640_1_1_1_1,0
0.html (accessed 15 May 2012).
Pingali, P., 2006. Westernization of Asian diets and the transformation of food systems:
Implications for research and policy. Food Policy 32, 281–298.
Popkin, B. M., 2001. The nutrition transition and obesity in the developing world. Journal of
Nutrition 131, S871–S873.
Rao, C.R., 1973. Linear Statistical Inference and Its Applications, 2nd ed. Wiley, New York.
Stewart, H., Yen, S.T., 2004. Changing household characteristics and the away-from-home food
market: a censored equation system approach. Food Policy 29 (6), 643–658.
Tiryaki, G.Y., Akbay, C., 2010. Consumers' fluid milk consumption behaviors in Turkey: an
28
application of multinomial logit model. Quality and Quantity 44 (1), 87–98.
TUIK, 2011. Household Budget Survey 2011. Prime Ministry of the Republic of Turkey,
Ankara. http://www.tuik.gov.tr (accessed 1 November 2012).
Vuong, Q.H., 1989. Likelihood ratio tests for model selection and non-nested hypotheses.
Econometrica 57 (2), 307–333.
Yen, S.T., 1993. Working wives and food away from home: the Box-Cox double hurdle model.
American Journal of Agricultural Economics 75 (4), 884–895.
Yen, S.T., Fang, C., Su, S.J., 2004. Household food demand in urban China: A censored system
approach. Journal of Comparative Economics 32, 564–585.
Yen, S.T., 2005. A multivariate sample-selection model: estimating cigarette and alcohol
demands with zero observations. American Journal of Agricultural Economics 87 (2),
453–466.
Yen, S.T., Rosiński, J., 2008. On the marginal effects of variables in the log-transformed sample
selection models. Economics Letters 100 (1), 4–8.
Zan, H., Fan, J., 2010. Cohort effects of household expenditures on food away from home. The
Journal of Consumer Affairs 44 (1), 213–233.
29
Table 1
Variable definitions and sample means.a
Variable Definition Urban RuralDependent variables FAFH Food expenditure away from home (TL per month) 102.49 42.67 (142.78) (92.27) Among the consuming (74.46% of sample) 137.66 88.93 (150.14) (116.77) FAH Food expenditure at home (TL per month) 356.46 359.26 (205.51) (239.38) Continuous explanatory variables Size Number of individuals in household 3.66 4.23 (1.61) (2.37) Accessibilityb Index value for a household accessibility 4.98 2.34 (1.78) (2.39) Durables Number of kitchen appliances (TV, refrigerator, 4.37 3.25 washer, washing machines, dryers, ovens, etc.) (1.56) (1.18) Equities Number of properties (shops, grocery stores, lands, 0.99 1.82 apartments, vineyards, orchards, and etc.) owned (0.96) (1.05) Income Household annual income (in 10,000 TL) 2.46 1.56 (1.93) (1.27) Binary explanatory variables (yes = 1; no = 0) Household head characteristics Male Gender is male 0.86 0.88 Married Married 0.86 0.86 Employed Employed 0.67 0.75 Age 20–29 Age is between 20 and 29 0.09 0.05 Age 30–39 Age is between 30 and 39 0.26 0.19 Age 40–49 Age is between 40 and 49 0.27 0.24 Age 50–59 Age is between 50 and 59 0.20 0.21 Age ≥ 60 Age is 60 or older (reference) 0.18 0.32 Elementary Completed elementary school 0.43 0.57 Secondary Completed secondary school 0.11 0.08 High school Completed high school 0.21 0.08 College Completed college 0.15 0.04 No school Has no school or illiterate (reference) 0.09 0.24 Household characteristics Childless Childless adult couple 0.14 0.19 Age 0–5 Kid(s) age 0–5 present 0.27 0.29 Age 6–14 Kid(s) age 6–14 present 0.40 0.42 Homeowner Resides in own house 0.55 0.80 Renter Resides in rental house 0.28 0.07 State apartment Resides in the state apartment (reference) 0.17 0.13 Internet Uses the Internet 0.35 0.10

30
Automobile Has an automobile 0.36 0.25 Sample size 6385 2920
a Standard deviations in parentheses. b Accessibility refers to how nearby a house is located to surrounding markets, banks, postal
services, schools, health centers, and public transport. For example if a house is close or very close
to a supermarket(s) it is then coded 1, 0 otherwise. We summed all accessibility indicators to reach
an index value.

31
Table 2
Maximum-likelihood estimates of sample selection system.a
Urban households Rural households FAFH FAH FAFH FAH Variable Selection Level Level Selection Level Level Constant –0.654*** 4.713*** 4.968*** –1.111*** 4.367*** 4.863*** (0.104) (0.110) (0.035) (0.137) (0.226) (0.045) Size 0.095*** 0.025* 0.114*** 0.027* 0.019 0.103 (0.015) (0.015) (0.006) (0.016) (0.021) (0.007) Accessibility 0.022** –0.032 0.002 0.022** –0.027* 0.005 (0.010) (0.010) (0.003) (0.011) (0.014) (0.005) Male 0.033 0.079 0.061** 0.389*** –0.271* 0.003 (0.067) (0.068) (0.025) (0.109) (0.158) (0.040) Married –0.149** –0.047 0.133*** –0.024 –0.025 0.176*** (0.070) (0.069) (0.026) (0.104) (0.139) (0.040) Employed 0.453*** –0.037 –0.018 0.048 –0.063 0.046* (0.046) (0.048) (0.017) (0.065) (0.089) (0.026) Age 20–29 0.331*** 0.114 –0.387*** 0.152 0.251 –0.268*** (0.084) (0.083) (0.030) (0.138) (0.184) (0.059) Age 30–39 0.256*** 0.117 –0.248*** 0.235** –0.068 –0.152*** (0.071) (0.072) (0.026) (0.094) (0.121) (0.041) Age 40–49 0.096 0.054 –0.164*** 0.165** –0.029 –0.074** (0.063) (0.065) (0.023) (0.082) (0.103) (0.035) Age 50–59 0.077 –0.017 –0.077*** 0.065 0.012 0.005 (0.057) (0.061) (0.021) (0.072) (0.098) (0.030) Elementary 0.266*** –0.150** 0.072*** 0.176** 0.083 0.073** (0.064) (0.073) (0.024) (0.070) (0.098) (0.027) Secondary 0.336*** –0.219** 0.107*** 0.124 0.151 0.084* (0.079) (0.086) (0.030) (0.109) (0.141) (0.051) High school 0.423*** –0.178** 0.163*** 0.286** 0.126 0.160** (0.075) (0.081) (0.028) (0.119) (0.152) (0.051) College 0.611*** –0.323*** 0.236*** 0.476** –0.016 0.167** (0.085) (0.088) (0.031) (0.163) (0.199) (0.075) Childless –0.263*** –0.099 0.019 –0.384*** –0.236** –0.047 (0.059) (0.061) (0.022) (0.079) (0.115) (0.033) Age 0–5 –0.195*** –0.049 –0.016 –0.054 –0.062 –0.055* (0.049) (0.046) (0.017) (0.068) (0.088) (0.031) Age 6–14 –0.039 –0.219*** –0.053*** –0.199** –0.033 –0.094** (0.046) (0.043) (0.016) (0.067) (0.084) (0.030) Homeowner 0.062 –0.091* 0.095*** –0.185** 0.094 0.060*

32
(0.053) (0.048) (0.018) (0.084) (0.095) (0.032) Renter 0.010 0.101** –0.047** 0.047 0.383** –0.010 (0.051) (0.049) (0.019) (0.118) (0.139) (0.056) Internet 0.293*** –0.022 0.073*** 0.422*** –0.144 0.026 (0.041) (0.038) (0.014) (0.094) (0.109) (0.044) Automobile 0.209*** –0.103*** 0.072*** 0.146** 0.062 0.054** (0.040) (0.037) (0.014) (0.061) (0.078) (0.027) Durables 0.032*** 0.159*** (0.011) (0.024) Equities –0.012 0.007 (0.020) (0.027) Income 0.183*** 0.062*** 0.174*** 0.121*** (0.009) (0.004) (0.023) (0.008) σ 1.204*** 0.481*** 1.228*** 0.543*** (0.016) (0.004) (0.066) (0.006) Error correlations (ρij) Level: FAFH –0.894*** –0.674*** (0.011) (0.080) Level: FAH 0.060*** –0.021 0.062** 0.001 (0.017) (0.014) (0.026) (0.027) Tests for significance of all error correlations (df = 2) Wald 6953.114 84.772 [p-value] [< 0.0001] [< 0.0001] LR 737.757 20.141 [p-value] [< 0.0001] [0.0002] LM 495.987 13.690 [p-value] [< 0.0001] [0.0033] Log likelihood –71728.532 –28314.397
aAsymptotic standard errors in parentheses. Asterisks indicate levels of significance: *** = 1%, ** =
5%, * = 10%.

33
Table 3
Marginal effects of explanatory variables: urban and rural samples.a
Urban households Rural households FAFH FAH FAFH FAH
Variable Probability
× 100 Conditional
level Unconditional
level Unconditional
level Probability
× 100 Conditional
level Unconditional
level Unconditional
level Continuous explanatory variables Size 2.734*** 10.836*** 11.729*** 40.670*** 0.957* 2.688* 2.188** 22.578*** (0.442) (1.787) (1.554) (2.247) (0.566) (1.578) (0.991) (2.581) Accessibility 0.646** –2.589** –1.346 2.748** 0.799** –1.184 –0.071 3.911** (0.275) (1.083) (0.922) (1.382) (0.385) (1.011) (0.629) (1.641) Durables 0.927*** 2.499*** 3.037*** 3.214*** 5.713*** 6.965*** 8.033*** 20.805*** (0.326) (0.878) (1.067) (1.131) (0.854) (1.516) (1.307) (3.123) Equities –0.356 –0.960 –1.167 –1.235 0.257 0.313 0.361 0.935 (0.585) (1.575) (1.915) (2.030) (0.979) (1.191) (1.376) (3.563) Income 24.862*** 19.879 17.083*** 13.820*** 7.653*** 22.512*** (1.570) (1.291) (1.084) (1.992) (1.170) (1.579) Binary explanatory variables Male 0.945 12.750* 11.171* 19.557** 13.835*** –3.894 8.638 51.047*** (1.956) (6.917) (5.796) (9.356) (3.730) (11.982) (6.155) (15.035) Married –4.142** –18.595** –19.931*** 21.493** –0.853 –3.090 –2.353 27.718** (1.864) (8.395) (7.195) (8.969) (3.745) (10.349) (6.434) (13.952) Employed 14.029*** 30.743*** 39.493*** 44.019*** 1.739 –2.951 –0.335 14.546 (1.483) (4.932) (4.196) (6.954) (2.341) (6.734) (4.147) (9.558) Age 20–29 8.773*** 44.861*** 48.018*** –68.663*** 5.483 30.921* 22.464* –28.700* (2.020) (12.048) (10.558) (8.497) (4.982) (18.697) (12.434) (17.227) Age 30–39 7.170*** 37.643*** 39.096*** –42.492*** 8.524** 4.808 9.054 1.113 (1.917) (9.196) (7.922) (9.126) (3.392) (9.142) (6.120) (14.346)

34
Age 40–49 2.735 15.119** 15.298** –34.846*** 5.982** 4.937 7.217 7.484 (1.768) (7.614) (6.397) (8.621) (2.956) (7.747) (5.059) (12.833) Age 50–59 2.194 3.714 5.456 –13.288* 2.327 3.854 3.877 9.335 (1.592) (6.797) (5.601) (8.010) (2.589) (7.396) (4.632) (11.154) Elementary 7.523*** –0.137 7.986 46.005*** 6.328** 14.207** 12.382*** 36.233*** (1.762) (7.892) (6.353) (9.315) (2.483) (6.821) (4.178) (10.212) Secondary 8.916*** –5.174 5.297 63.962*** 4.473 19.010 14.406* 33.514* (1.912) (9.241) (7.842) (12.203) (3.936) (12.259) (8.061) (19.307) High school 11.328*** 7.076 18.480** 89.980*** 10.344** 24.969* 23.150** 74.619*** (1.836) (9.196) (7.769) (11.710) (4.265) (13.797) (9.686) (22.367) College 15.351*** 0.562 18.389** 132.749*** 17.014*** 20.607 26.506** 104.935*** (1.782) (9.916) (8.619) (13.611) (5.604) (17.310) (13.147) (33.690) Childless –8.050*** –31.735*** –32.950*** –23.198*** –13.759*** –31.065*** –24.546*** –57.294*** (1.883) (5.631) (4.659) (8.943) (2.769) (6.000) (3.405) (11.192) Age 0–5 –5.708*** –21.308*** –23.053*** –24.165*** –1.931 –7.156 –5.337 –17.047 (1.450) (4.875) (4.212) (6.942) (2.436) (6.217) (3.884) (10.818) Age 6–14 –1.111 –32.140*** –26.998*** –18.272*** –7.080*** –11.303* –11.433*** –43.415*** (1.326) (4.788) (4.187) (6.500) (2.339) (6.087) (3.908) (10.776) Homeowner 1.792 –7.543 –4.010 32.001*** –6.713** –0.560 –5.223 –12.522 (1.535) (5.679) (5.085) (7.241) (3.064) (7.081) (4.965) (12.283) Renters 0.284 14.788** 12.155** –11.726 1.698 38.723*** 22.970** 4.282 (1.454) (5.945) (5.148) (7.157) (4.275) (14.481) (9.559) (19.103) Internet 8.327*** 20.126*** 25.998*** 49.760*** 15.336*** 6.695 15.721** 61.576*** (1.134) (4.430) (3.988) (5.911) (3.356) (8.517) (6.410) (16.094) Automobile 5.960*** 2.247 8.653** 40.879*** 5.327** 11.694** 10.561*** 30.027*** (1.112) (4.255) (3.760) (5.726) (2.246) (5.925) (3.894) (10.568) a Asymptotic standard errors in parentheses. Asterisks indicate levels of significance: *** = 1%, ** = 5%, * = 10%.

35
0.00
5.00
10.00
15.00
20.00
25.00
30.00
35.00
40.00
2002 2004 2006 2008 2010
Per
cent
age
Year
Figure 1. Household Spending on Food and Non-Alcoholic Beverages in Turkey between 2002-2011
Food and Non‐AlcoholicBeverages‐Turkey
Food and Non‐AlcoholicBeverages‐Urban Turkey
Food and Non‐AlcoholicBeverages‐Rural Turkey
36
0.00
1.00
2.00
3.00
4.00
5.00
6.00
7.00
2002 2004 2006 2008 2010
Per
cent
age
Year
Figure 2. Household Spending on Hotels, Restaurants and Pastries in Turkey between 2002-2011
Hotels, Restaurants andPastries‐Turkey
Hotels, Restaurants andPastries‐Urban Turkey
Hotels, Restaurants andPastries‐Rural Turkey