household survey on marginalised roma communities€¦ · roma inclusion working papers undp europe...
TRANSCRIPT

INTEGRATED HOUSEHOLD
ROMA POPULATIONSSURVEYS
AMONG
ONE POSSIBLE APPROACH TO SAMPLING
USED IN THE UNDP-WORLD BANK-EC
REGIONAL ROMA SURVEY 2011
Roma Inclusion Working Papers
http://europeandcis.undp.org/ourwork/roma/


Roma Inclusion Working Papers
UNDP Europe and the CIS
Bratislava Regional Centre, 2012
ONE POSSIBLE APPROACH TO SAMPLING USED IN THE UNDP-WORLD BANK-EC
REGIONAL ROMA SURVEY 2011

© UNDP, 2012
ISBN (printed version): 978-92-95092-52-5
ISBN (electronic version): 978-92-95092-53-2
All rights reserved. No part of this publication may be reproduced, stored in a retrieval system or transmitted, in all forms by any means, mechanical, photocopying, record-ing or otherwise prior permission.
Cover design and layout: Yassen Panov
Print: Valeur, s. r. o., Slovak Republic
The content of this publication can in no way be taken to reflect the view of UNDP or the European Union.
To be cited as: Ivanov, A., Kling, J. & Kagin, J. (2012). Integrated household surveys among Roma populations: one possible approach to sampling used in the UNDP-World Bank-EC Regional Roma Survey 2011. Roma Inclusion Working Papers. Bratis-lava: United Nations Development Programme.
This publication was prepared with the support from the European Union

Authors
Andrey Ivanov, PhD, Senior Policy Advisor at the Bratislava Regional Centre, UNDP
Jaroslav Kling, Policy Analyst at the Bratislava Regional Centre, UNDP
Justin Kagin, PhD candidate at the University of California, Davis.
Acknowledgements
The authors and the team involved in this research are grateful to Balázs Horváth for his support and the methodological guidance throughout the entire project.
The authors are grateful to Christian Brüggemann, Ioannis Dimitrakopoulos, Sevinç Rende and Ilona Tomova for the valuable comments received on various drafts of this paper. We are also grateful all the colleagues involved in the 2004 and 2001 surveys for their dedication, enthusiasm and ideas that made this endeavor possible. It should be noted that the all this wouldn’t have been possible without the ! nancial support from the DG “Regional Policy” of the European Commission, and the cooperative attitude from the colleagues in the Fundamental Rights Agency, the World Bank, IPSOS (who administered the 2011 UNDP survey), GALLUP Europe (who administered the 2011 FRA surveys) and TNS BBSS (who administered the 2004 UNDP survey).

4

5
Table of Contents
Introduction ................................................................................................................ 5
Part 1: Who’s Roma? De! ning the universe of study ............................................... 6
Between self-identi! cation and external identi! cation ............................................................. 8
The second best option: focusing on the communities where Roma are overrepresented ..................................................................................................... 9
Part 2: The methodology and sampling procedure of the 2011 survey ............... 11
Experience with Roma targeted surveys .......................................................................................12
The 2011 survey: the sampling .........................................................................................................14
Fieldwork ...................................................................................................................................................19
Questionnaire ..........................................................................................................................................24
Part 3: The data-set used in the UNDP working papers......................................... 26
Conclusions .............................................................................................................................................30
References ................................................................................................................................................31

6
Introduction
The Regional Roma Survey 2011 was completed in cooperation with the United Na-tions Development Programme (UNDP), World Bank, the European Commission (EC) and in coordination with the European Union’s Agency for Fundamental Rights (FRA). Two parallel and complementary surveys were carried out in 2011 in an e" ort to map the current situation of Roma in the EU: One was focusing on social and economic de-velopment aspects and carried out by the UNDP and the World Bank (funded by the European Commission,1 UNDP and the Nordic Trust Fund at the World Bank), and one focusing on the ful! llment of key fundamental rights carried out by the EU Agency for Fundamental Rights (FRA).
The UNDP/WB/EC survey was conducted in May-July 2011 on a random sample of Roma and non-Roma households living in areas with higher density (or concentration) of Roma populations in the EU Member States of Bulgaria, Czech Republic, Hungary, Romania, Slovakia, and the non-EU Member States of Albania, Bosnia and Herzegovina, Croatia, FYR of Macedonia, Montenegro, Republic of Moldova and Serbia. In each of the countries, approximately 750 Roma households and approximately 350 non-Roma households living in proximity were interviewed.
The FRA survey was conducted in May-July 2011 on a random sample of Roma and non-Roma households living in areas with concentrated Roma populations in the EU Member States of Bulgaria, Czech Republic, Hungary, Romania, Slovakia, France, Greece, Italy, Poland, Portugal and Spain. In most of the countries the FRA sample consists of 1,100 Roma households and approximately 500 non-Roma. In France, about 700 gens du voyage and 300 Roma Migrant households in the greater Paris area were surveyed. In Poland and Italy, the sample size was reduced to 600 and 700 Roma households respectively In total 16,648 persons (11,140 Roma and 5,508 non-Roma persons) were interviewed.
The survey questionnaire was designed jointly by a team from UNDP, the World Bank and the FRA. Each survey used di" erent questions and a core common component composed of key questions on education, employment, housing, health, free move-ment and migration issues, and discrimination experiences. The questions in the com-mon core were identical.
The UNDP/WB/EC survey was implemented by the IPSOS polling agency and the FRA survey through Gallup Europe. Both surveys applied the same sampling methodology in countries of overlap allowing for the development of a common dataset on core in-dicators and ensuring comparability and consistency of results. The combined UNDP/WB/EC Regional Roma Survey 2011 and FRA Roma Pilot Survey 2011 has a total of
1/ Directorate General for Regional and Urban Policy of the European Commission funded the survey in the EU Member States.

7
20,018 Roma households (87,717 household members living in these households) and 9,782 non-Roma households living nearby (28,214 household members) covering 18 European countries.
This paper describes the methodology, dataset, and methods used behind the UNDP/World Bank/EC Regional Roma Survey 2011 while an additional paper by the FRA will provide details of the FRA Pilot Roma Survey. The two surveys were performed in con-junction and have similar methodologies, however some questions were di" erent and their geographic scope of study also di" ered. The UNDP 2011 Survey covers 11 East-ern European countries including ! ve EU countries; Albania, Bosnia and Herzegovina, Montenegro, Croatia, Macedonia, Moldova, Serbia and the EU countries of Bulgaria, the Czech Republic, Slovakia, Romania, and Hungary. The FRA Roma Pilot Survey en-compasses 11 EU countries; Greece, Spain, France, Italy, Poland, Portugal, including the ! ve covered by the UNDP 2011 Survey (FRA 2012). Forthcoming UNDP publications will note when they use the pooled data set from both surveys or data exclusively from the UNDP/World Bank/EC Regional Roma Survey 2011 when survey questions di" ered. Five European Union countries - Bulgaria, the Czech Republic, Slovakia, Romania and Hungary - represent the area of overlap.
The paper is divided into three parts. The ! rst part provides an idea of the general prob-lems related to sampling of Roma populations stemming from the # uid nature of Roma identity. The second part gives a background of the context of the survey and describes its methodology, the sampling procedure and the ! eldwork. The third part gives in-formation on the data set produced by the survey and used for the UNDP working papers.

8
Who’s Roma? De! ning the universe of study
Roma inclusion2 is increasingly visible on political agendas both of governments and international institutions. It entails many challenges which are usually reduced to its practical aspects - what to do and how to do it, so that real progress is achieved. Against the background of those practical aspects, one issue is gaining less attention than it should – a clear de! nition of who are the “Roma” that are to be “included”? The task of de! ning becomes even more challenging if we take into consideration the fact that both “Roma” and “inclusion” are vague – and interrelated – concepts. They are intellec-tual and political constructs to which di" erent people (Roma or non-Roma, politicians or ordinary citizens) usually attribute di" erent meanings. In addition, given the interre-lated nature of the two concepts, the practical content of “inclusion” varies depending on the meaning attributed to “Roma” (Ivanov, 2012).
De! ning the universe of study is even more critical in sampling research. “A sample of an unde! ned universe” is an oxymoron. Strictly speaking, one cannot de! ne a sample not knowing exactly what is being sampled. In the case of the Roma, however, the task of precisely de! ning the universe presents important challenges. Census data (the source usually used by the government which needs formalized data sources) notori-ously and signi! cantly di" er from “experts’ estimates”. On average, the di" erence can be as large as four-fold.3 Depending on the speci! c circumstances, it can change in scope and coverage. If the circumstances suggest that there is a certain risk associated with “being Roma”, the estimates get lower; if there are some potential bene! ts (prefer-ential access to services for example) – the estimates get higher.4
The need for more precise statistics on Roma has become ever more acute, as govern-
2/ The terms – “integration” and “inclusion” – are often used as synonyms despite the important di" erences between the two. The former entails the involvement of the representatives of the minority in dominating structures with limited elements of diverse identity retained (and usu-ally the resulting involvement is limited as well). In that case the external system is more toler-ant to diversity but remains static – it accepts certain elements of diversity but this acceptance doesn’t entail change in the system itself. “Inclusion” on the other hand entails a dual track process in which both the minority and the system adjust – the former preserves the core mark-ers of its identity (but not all) and the latter becomes responsive and accommodative to those elements of unique identity. It’s interesting to note that in everyday policy jargon “inclusion” is also reserved for people with disability or indigenous groups, whereas “integration” is attributed to migrants. In the EU policy language the increasingly dominating term “integration” (the EC is calling for “National Roma Integration Strategies” for example) is used although the real mean-ing is “inclusion” (see UNDP 2012, pp. p-6). However the di" erences between the two terms– as important as they might be – go beyond the direct scope of this paper.
1

9
ments have begun to develop special programs related to Roma (Petrova 2004, p. 5). This constitutes a fundamental challenge because demographics is at the core of both sampling and of the denominator of any indicator (even if the number of Roma unem-ployed could be estimated, the “unemployment rate” would di" er depending on the estimated size of the Roma labor force). What is more important, precise (to the extent possible) numbers are needed for practical responses: it matters whether you are plan-ning a resource allocation for 100,000 or for 400,000 people to be targeted in whatever intervention.
Between self-identi! cation and external identi! cation
Two approaches are usually used to de! ne one’s a$ liation (ethnic or other): self-iden-ti! cation or external identi! cation. One is a “result of choice”, the other – of “ascription” (Rughini% 2011). In the ! rst case the individual respondents are asked directly “To what ethnic group do you belong?” or indirectly “With which group/culture/community do you a$ liate?”5 In the second case, outsiders make a judgment on the identity of the person or the entire community – “Is he or she a Roma?” or “is the neighborhood over there a Roma one?”. Both approaches, which are used in various surveys, produce dif-ferent results (the universe of “self-identi! ed Roma” is often smaller than the “externally identi! ed as Roma”, for various reasons. One – and most obvious – is the stigma as-sociated with “belonging to Roma” and the experience of past and present misuse of ethnic data (Makkonen 2007, p 50). But the choice of di" erent identity is often driven by more pragmatic reasons. It is easier to integrate with other minorities constituting a majority at the local level (like the Turks in Bulgaria – in which case the Roma living in Turkish-dominated settlements usually self-identify as Turks). Another could be bet-ter protection of group rights (for example, in countries such as Greece, where Roma would self-identify as ‘Muslims’ rather than Roma, since only Muslims have speci! c mi-nority rights).
Thus each of the two approaches is reasonable but re# ects part of a complex reality. This is why they are often used as complementary. The censuses are the largest-scale data collection e" orts that rely on self-reported a$ liation. It is usually thought that
3/ One of the most frequently cited source of population estimates on “Roma” is the Council of Europe. It provides estimates of the “Roma” population for countries of CoE area, for EU member states and Europe in total. The ratio between the “minimum estimate”, “maximum estimate” and “average estimate” to and the o$ cial census data (for countries which register main ethnicity in their censuses) is respectively 2.7, 5 and 4. www.coe.int/t/dg3/romatravellers/Source/docu-ments/stats.xls. See also Liegeois 1997.4/ This phenomenon called “strategic ethnicity” is not unique for Roma. Examples as distant as Jews in 1939 Germany and being in a train with hooligans from the oppositional football team share the same logic.5/ In some countries (like the US) individuals can choose multiple identities (as in the case of children from mixed marriages). This approach however is not used in countries with large Roma minorities.

10
INTEGRATED HOUSEHOLD SURVEYS AMONG ROMA POPULATIONS
censuses underreport Roma populations because they are conducted by the state with whose structures Roma are cautious in sharing information with given their bit-ter experience from the past (see, for example OSI 2010 or &kobla et al., 2009). Unlike censuses, sample surveys are conducted by non-state actors and have lower level of mistrust on the side of the respondents. But even in that case there’s a discrepancy between the self-reported and expert (external) identi! cation of Roma ethnicity. The discrepancies are smaller than in censuses but still signi! cant.6 In addition, the universe of those “self-identi! ed” as Roma is not a simple sub-sample of the “real Roma,” identi-! ed “externally”. There is a group who self-identify as Roma but is not seen as Roma by outside observers (Rövid 2011, p. 8).
The immediate question that arises when comparing the results of the two approaches is “which estimate/! gure is the right one?” Impressive volumes already exist addressing the issue of which approach – self-identi! cation or external identi! cation – is more cor-rect in terms of quantifying populations such as Roma. The answer is that both – and neither of them – because the very de! nition of the question in those binary terms is wrong. The very question “which of the two approaches is the correct one?” frames the issue as a technical challenge in which all you need is to apply the correct de! nition, determine the proper method of “counting”, and apply the appropriate techniques (for example, to overcome the fear or the mistrust of those being counted).
Interestingly enough, the literature on the issue of “Roma and statistical data” is domi-nated by concerns about misuse of data – and not about vagueness of de! ning the population in question. All the authors assume the existence of a clearly identi! able constituency that might fall victim to discrimination, prosecution or other abuse when (if ) re# ected in ! gures. This underlying assumption is wrong and this is what makes both approaches equally right and wrong albeit for di" erent reasons. Both approaches address “Roma” as a matter of an unequivocal ethnic or national a$ liation.7 Both are built on the assumption that “Roma” as an identity is de! ned clearly enough, but is as-sociated with certain risks for the individual (prejudice, stigma, overt discrimination). They consider that the task of de! ning the universe boils down to motivating the in-dividual to reveal that identity – or ! nd some ways of getting around the individual’s reluctance. Both approaches are aware of the multifaceted and motley nature of the “Roma universe” comprised of various groups and subgroups. These partially overlap and share the common historical roots, experience of discrimination, as well as certain linguistic commonalities, shared set of values and relations to surrounding majorities.
Ideally, instead of asking the question “Are you Roma?” (and wondering which of the many possible meanings of “Roma” the respondent might have in mind, regardless of
6/ For example, in the monthly ‘omnibus’ surveys conducted by TNS BBSS (member of WIN/GIA) in 2009-2011 95% the respondents who self-identi! ed as “Roma” were similarly identi! ed by the enumerators. However only 78% 0f the respondents identi! ed as “Roma” by the enumerators self-identi! ed as “Roma” (12% self-identi! ed as “Bulgarians” and 9% – as “Turks”. Source: working communication with TNS BBSS.7/ The delineation between “ethnicity” and “a nation” – and the question is Roma a nation or ethnic group – requires a separate in-depth analysis that is not subject of the current article.

11
DEFINING THE UNIVERSE OF STUDY
his/her answer), a researcher should build a detailed pro! le of the individual ! rst. The additional ethnic identity markers commonly used (like “what is your mother tongue?”, “what language do you speak at home?”, “what is the ethnicity of your immediate neigh-bors?” etc.) are not su$ cient. Ideally those need to be complemented by a long list of questions addressing values, behavioral patterns, myths, beliefs, cultural traits etc. Only then, out of this detailed pro! le, could a researcher theoretically conclude whether the person is a “Roma” or not – assuming, of course, that one can quantify this myriad of qualitative elements (some of them even mutually contradictory) in quantitative terms and has a defendable standard (or a gauge) of what is the minimum number of indi-vidual attributes beyond which one could qualify for “being Roma”.
Obviously, this is not practically feasible for a large scale survey and in most cases both researchers and policy-makers are using an intellectual short-cut of “the Roma” – again, leaving open the question what exactly is being meant by “Roma”. Analysts and policy makers seem to be following the instinctive appeal of “we cannot precisely de! ne them – but we all know who they are”.8 This approach is de! ning a reasonably clear target of possible interventions (and resource allocation and monitoring) at the same time, leav-ing ‘out of the brackets’ the unsolvable question of rigid de! nition.
In summary, a combination of both self-a$ liation and external assessment is necessary but not entirely su$ cient – and should be applied already at the stage of sampling design.
The second best option: focusing on the communities where Roma are overrepresented
A feasible compromise was tested by UNDP in 2004 in its regional survey on Roma in CEE and South-Eastern Europe. It was building on the experience of the 2002 survey (Ivanov et al., 2002), complementing it by one important element: the risk of marginalization.
A major assumption of this survey was the # uid nature of Roma identity and the ter-ritorial concentration of vulnerable Roma. The research team was realistic about the (im)possibility of reaching “all Roma” (both those who are socially included and those who are socially excluded). Reaching those who are most in need of support – and who happen to be in most cases socially excluded and often residentially segregated – was seen as a priority.
The approach is not ideal because the data cannot claim to be representative of “all” Roma. But it is policy driven and policy relevant because it is “as representative as pos-sible of those Roma who face social exclusion and risk marginalization” and who are the target of the Roma inclusion e" orts (and funding). In the end, the process of Roma inclusion is about including the excluded and not those who are included already.
8/ A paraphrase of Andrzej Mirga’s famous phrase “you may not know who we are but we do”.

12
2 The methodology and sampling procedure of the 2011 survey
Experience with Roma targeted surveys
Roma surveys are not that common – hence experience in sampling is quite rare. De-spite these hurdles several attempts have been made over the past decade to de! ne and survey this population in order to improve targeting of social inclusion policies – mostly following the self-identi! cation approach. The World Bank used a Yale Uni-versity dataset which analyzed Roma socioeconomic status in Bulgaria, Hungary and Romania. The survey and subsequent analysis used independently determined self-identi! cation and interviewer identi! cation of Roma status. Interviewer identi! ca-tion however, seemed to largely overestimate the population of Roma; many of those identi! ed as Roma did not self-identify as such (61 percent in Romania, 38 percent in Hungary and 24 percent in Bulgaria). The survey consisted of both household and in-dividual questions and was used in combination with an additional oversampling of Roma to ensure greater e$ ciency in their estimates (see Ringold et al. 2005).
The UNDP had also previously surveyed the Roma in Bulgaria, Hungary and Romania as well as the Czech Republic and Slovakia trying to match the bene! ts of external identi! cation and self-identi! cation. For the purpose of the ! rst regional report on the status of Roma in CEE (Ivanov et al., 2002) the areas populated mainly by Roma were identi! ed ! rst using census data in consultation with experts in ethnic relations, repre-sentatives of national polling agencies, and Roma NGOs. Then sampling clusters were further selected according to the distribution of Roma. Finally, ! eld operators identi! ed Roma with help from local experts. Similar to the World Bank approach (Ringold, Oren-stein, and Wilkens, 2005), there was an oversampling of Roma who did not self-identify as Roma although on a smaller scale (14 percent in Bulgaria, 13 percent in the Czech Republic, 5 percent in Romania, and 9 percent in Slovakia). Approximately 1000 Roma individuals from each country were surveyed with individual and household level ques-tions. Non-Roma were not surveyed. Further re! ning of the sampling procedure and an expansion of the geographic area led to a more comprehensive and targeted UNDP Regional Roma Survey 2004 (Ivanov et al., 2006). This survey included nine Central and Eastern European countries and in addition to a large population of Roma included for the ! rst time samples of non-Roma living in close proximity to the Roma population. In total, it surveyed 8,273 households and 34,116 individuals.

13
Following the 2004 pilot conducted by UNDP, other organizations were increasingly in-volved in Roma targeted surveys. UNICEF for example re# ects the need for speci! c data related to the situation of children, women and men in Roma settlements, through Roma surveys in the third and fourth rounds of MICS (Multiple Indicator Cluster Sur-veys). So far, UNICEF has done such surveys in Serbia (2005 and 2010) Former Yugoslav Republic of Macedonia (2005 and 2011) and in Bosnia and Herzegovina (2011/12) and plans to run one in Montenegro and one in Kosovo (UNSCR 1244) (within ! fth round of MICS). In all cases the basis for the sampling is the census data updated through vari-ous approaches. In Serbia, a total of 1815 Roma households were selected. The sam-pling frame for Roma settlements was based on information from the 2002 Serbian Population Census, excluding all enumeration areas with 17 or less Roma households (UNICEF 2007b, pp. 24-25). Since the sampling frame (the 2002 Population Census) was not up-to-date, a new listing of households was conducted in all the sample enumera-tion areas prior to the selection of households. For this purpose, listing teams were formed, who visited each enumeration area, and listed the occupied households. The interviewers’ task was to go to the addresses listed and to identify the current Roma households, together with the number of children under ! ve living in the household. In the Former Yugoslav Republic of Macedonia a similar approach was used. The sampling frame for Roma settlements was based on information from the 2002 Population Cen-sus, using the enumeration areas with 15% or more households being Roma house-holds. Since the sampling frame (the 2002 Population Census) was not up-to-date, a new listing of households was conducted in all selected sample enumeration areas prior to the selection of households. For this purpose, listing teams were formed, who visited each enumeration area, and listed the occupied households. The interviewers’ task was to go to the addresses listed and to identify the current Roma households. Roma clusters were located in urban areas only, as over 95% of Roma population lives in urban settings. 70 clusters were allocated for the Roma population, in addition to the 300 clusters for the national sample. A total of 1079 Roma households were selected the Former Yugoslav Republic of Macedonia (UNICEF 2007a, p. 17).
Besides being an important policy tool in and of itself, by following a similar procedure as the 2004 survey, the UNDP/World Bank/EC Regional Roma Survey 2011 also allows for “some minimum level of comparability” between populations’ status over time. “Some minimum” means acceptable for outlining the magnitude of the change in major pa-rameters with certain caveats in mind. Theoretically, a longitudinal survey on a panel that would follow the same individuals over time and space might have yielded better results and have controlled for bias from omitted time invarient household e" ects (and by then controlling for time-varying factors could make an even more accurate com-parison). It wasn’t possible however in practice for a number of reasons. The ! rst is the programmatic time-frame. A longitudinal survey requires a long-term investment and commitment that it would be repeated at least once more (something impossible in the framework of the current project). The second group of reasons why a longitudinal survey wasn’t feasible includes factors of methodological and legal nature. The suspi-cion towards outsiders’ surveys and inquiries is still high among Roma communities

INTEGRATED HOUSEHOLD SURVEYS AMONG ROMA POPULATIONS
14
and enrolling in longitudinal survey (with recording names and exact contact details) would require much longer preparatory work with the communities surveyed.9
Therefore the repeated cross-sample is seen as an optimal compromise between com-parability across time and representativity at the moment of the survey. With all its ca-veats the survey does give a su$ ciently good approximation. It allows for a su$ ciently robust comparability between the situation of the Roma and the non-Roma – living in close proximity – over a 7 year period. And it thus provides objective data for evaluat-ing the success/or lack thereof of social inclusion policies during this time period.10
The 2011 survey: the sampling
The primary universe under study consisted of: (i) all the households in Roma settle-ments or areas of compact Roma population; (ii) non-Roma communities living in close proximity to Roma. It covered two sampling universes. The sampling universe for Roma sample was de! ned as “the households in Roma settlements or areas of compact Roma population who identify themselves as Roma”. The sampling universe for the non-Roma sample was de! ned as “the households of non-Roma populations living in close prox-imity to Roma.” The sampling design was based on the assumptions that, in order to achieve adequate coverage of Roma population, a combination of external and self-identi! cation is necessary when de! ning the samples. Table 1 summarizes the major stages and approaches of the sampling process.
As seen from the table, at the ! rst stage of the sampling, a list of settlements from Census data was used.11 While being aware that censuses understate the absolute numbers of Roma, the survey accepted that the census data re# ect adequately the structure and territorial distribution of those individuals who identify themselves as Roma. In practical terms, it was assumed that the propensity to underreport was identi-cal for each region within an individual country. Based on this assumption, the Roma sample was taken as representative of the Roma population living in ‘Roma settlements or areas of compact Roma population’. Those settlements and areas were de! ned as settlements where the share of Roma population equals, or is higher than, the national share of Roma population in the given country, as re# ected in the census data. Those are the settlements where the Roma population is facing the most severe challenges
9/ Another important issue related to comparability was the choice of the sampling clusters. Repeating the survey in 2011 in the same sampling clusters identi! ed in 2004 might look appropriate from a comparability perspective. But it would not re# ect the impact of internal migration, displacement and other population movement factors that are captured (with all their caveats) in censuses.10/ Those countries that were surveyed in 2011 but not in 2004 - Slovakia and Moldova - can-not be evaluated in this way and must use other representative Roma surveys for comparisons across time.11/ In those countries where the Census data are very old and some more accurate information about the Roma population exists, this more accurate information was used.

15
THE METHODOLOGY AND SAMPLING PROCEDURE OF THE 2011 SURVEY
of exclusion, therefore addressing those populations is the primary policy purpose of Roma inclusion initiatives.
Oversampling Roma by including those who did not self-identify as Roma was avoided in the third stage by beginning the interview with an indirect question about ethnic status. The interviewer after identifying a household as Roma would ask the house-hold head, “We are conducting a survey AMONG THE ROMA POPULATION. Would you mind to be interviewed?” If the head explicitly denied being Roma by saying, for example, “I am not Roma, why should you interview me?” the interviewer was told to immediately discontinue the interview. A willingness to participate in the interview was seen as a tacit endorsement of Roma status. This we later de! ned as “implicit en-dorsement of the external identi! cation”.
In other words, internal (self-identi! cation) and external (outsider’s identi! cation) modes therefore prevail at di" erent stages of the sampling process. Self-identi! cation (reported during the census) was used in the ! rst stage; external identi! cation (assess-ment of local people, NGOs, experts) was employed in the second stage. In the third stage (respondents’ selection), the results of the ! rst two stages were con! rmed or re-jected by ‘implicit endorsement of identi! cation’. The experience from the ! eldwork supported the approach taken. The interviewers didn’t have any problems identifying the ethnicity of Roma respondents. There were few situations in which the interviewers identi! ed individuals as being Roma and they denied it.
On the other hand, being Roma and self-identifying themselves as Roma when they were asked created an opportunity: they were part of a minority and this could bring them some material advantages. Others were afraid that their answers would make them lose the ! nancial support they receive from the local authorities. In these situ-ations, the interviewers had to insist on the explanation regarding the purpose of the study and where all the information collected in the questionnaires would go.
A speci! c problem occurred in Bulgaria, where in several sampling points there were cases in which the claimed ethnic identi! cation of the respondent was di" erent than the one indicated by the interviewer. Those respondents identi! ed themselves as Turks, but at the same time didn’t oppose being Roma as well. In Romania, there were situa-tions in which the interviewers were confronted with a terminology issue. After reading the introduction for the Roma sample that contains the expression “among the Roma population”, the interviewers had to explain to the respondents that the word Roma is similar to Gypsy (“Tsigani”). In some areas, Roma don’t call themselves Roma, but Tsigani. In the Czech Republic, reports from the interviewers as well as collected data suggest self-declaration of Roma ethnicity being less problematic for Roma population in the UNDP survey than in the National Census.
All steps of the survey preparation and implementation were closely coordinated with the Fundamental Rights Agency’s (FRA) survey. The sampling frames for both surveys used the same data sources (in the countries of overlap – BG, CZ, HU, RO and SK) and the same criteria – municipalities with equal or higher share of Roma in the total popu-lation when compared with the overall population share of Roma in a given country.

INTEGRATED HOUSEHOLD SURVEYS AMONG ROMA POPULATIONS
16
LocationRomania, Slovakia, Croatia, Bosnia and Herzegovina, Serbia, Mon-tenegro, Macedonia, Albania, Bulgaria, Czech Republic, Hungary, Republic of Moldova
Method of data
collectionFace-to-face interviews at the respondent’s household
Roma sample Non-Roma sample
Sample universe
The households in Roma settlements or areas of compact Roma population; representa-tives of Roma population who implicitly identify themselves as Roma
The households of non-Roma populations living in close prox-imity to Roma
Sample frame
List of settlements from Census with average and above share of Roma updated with information from other relevant sources; no. of inhabitants in each settle-ment: general population and of Roma ethnicity
List of settlements from Census with average and above share of Roma updated with information from other relevant sources
Type of sample
Two/three stage random repre-sentative sample
Booster sample in area of close proximity to Roma: Two/three stage random sample
1st stage: PSU
Clusters within settlements in-habited by the Roma population (approx. size 30 households), selected by equal probability
Clusters in close proximity of settlements inhabited by the Roma population included in the Roma sample
2nd stage: SSU
Households chosen with equal probabilities, and selected by the method of random start and equal random walk
Households chosen with equal probabilities, and selected by the method of random start and equal random walk
3rd stage: TSU(only for module C) Household member 16+, and selected by “! rst birthday” technique
(only for module C) Household member 16+, and selected by “! rst birthday” technique
Strati! cation, purpose and
method
Strata: type of settlements and region
Purpose: Optimization of the sample plan, and reducing the sam-pling errorMethod: The strata are de! ned by criteria of optimal geographical and cultural uniformity
Table 1: Outline of the sampling methodology, the UNDP/World Bank/EC Regional Roma Survey 2011
17
THE METHODOLOGY AND SAMPLING PROCEDURE OF THE 2011 SURVEY
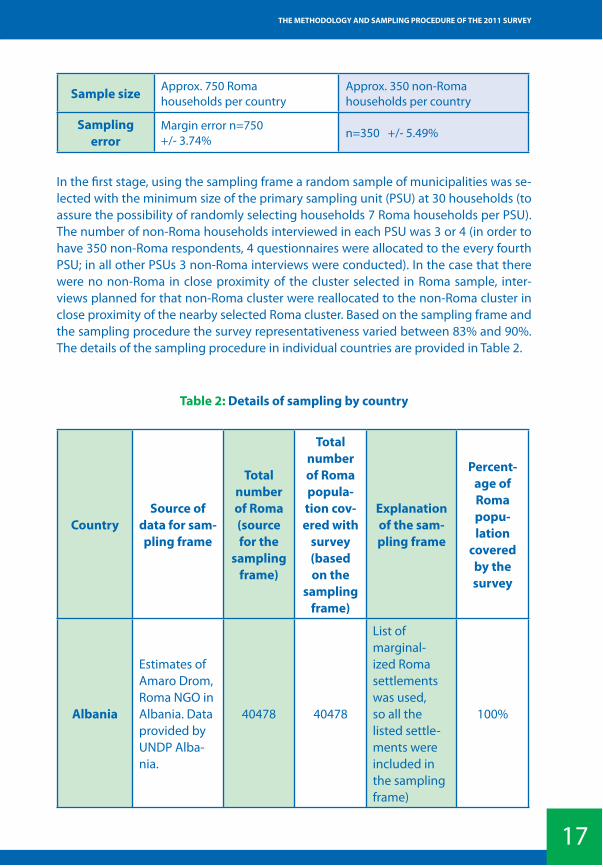
In the ! rst stage, using the sampling frame a random sample of municipalities was se-lected with the minimum size of the primary sampling unit (PSU) at 30 households (to assure the possibility of randomly selecting households 7 Roma households per PSU). The number of non-Roma households interviewed in each PSU was 3 or 4 (in order to have 350 non-Roma respondents, 4 questionnaires were allocated to the every fourth PSU; in all other PSUs 3 non-Roma interviews were conducted). In the case that there were no non-Roma in close proximity of the cluster selected in Roma sample, inter-views planned for that non-Roma cluster were reallocated to the non-Roma cluster in close proximity of the nearby selected Roma cluster. Based on the sampling frame and the sampling procedure the survey representativeness varied between 83% and 90%. The details of the sampling procedure in individual countries are provided in Table 2.
Sample size Approx. 750 Roma households per country
Approx. 350 non-Roma households per country
Sampling error
Margin error n=750 +/- 3.74% n=350 +/- 5.49%
Table 2: Details of sampling by country
CountrySource of
data for sam-pling frame
Total number of Roma (source for the
sampling frame)
Total number of Roma popula-tion cov-ered with
survey (based on the
sampling frame)
Explanation of the sam-pling frame
Percent-age of Roma popu-lation
covered by the survey
Albania
Estimates of Amaro Drom, Roma NGO in Albania. Data provided by UNDP Alba-nia.
40478 40478
List of marginal-ized Roma settlements was used, so all the listed settle-ments were included in the sampling frame)
100%

INTEGRATED HOUSEHOLD SURVEYS AMONG ROMA POPULATIONS
18
Bosnia and Her-zegovina
Results of process of registration of Roma and Roma house-holds, 2009-2010, Ministry of Human Rights and Refugees.
16771 16771
Results of the process of registra-tion of Roma and Roma households were used. Data were on the level of municipality
100%
Bulgaria
2001 Census data, National Statistical Institute
370880 327460
National average + minimum 20 HH criteria was used
88%
Croatia
2001 Cen-sus data by settlements, with inputs of NGO “Roma for Roma Croatia”
9463 8829National aver-age criteria was used
93%
Hungary
2001 Census data, Hungar-ian Central Statistical O$ ce
193484 151732National aver-age criteria was used
78%
Macedo-nia
2002 Census data, State Statistical O$ ce
53879 47403
National average + minimum 20 HH criteria was used
88%
Moldova
2004 Census data, National Bureau of Statistics
12271 12271
Since ! nding marginalized Roma was di$ cult, all settlements inhabited by Roma were included in sampling frame
100%

19
THE METHODOLOGY AND SAMPLING PROCEDURE OF THE 2011 SURVEY
Montene-gro
2008 Census of RAE popu-lation, Statis-tical O$ ce of Montenegro
6893 6893
Since ! nding marginalized Roma was di$ cult, all settlements inhabited by Roma were included in sampling frame
100%
Romania
2002 Census data, National Institute of Statistics
535140 478790
National average + minimum 20 HH criteria was used
89%
Serbia
2002 Census data, Statisti-cal O$ ce of republic of Serbia
108193 95046National aver-age criteria was used
88%
Czech Republic
Map of socially ex-cluded Roma localities in the Czech Re-public 2006
68623 62023 National average + minimum 20 HH criteria was used
90%
Slovakia Atlas of Roma communities in Slovakia 2004
289088 240749 National average + minimum 20 HH criteria was used
83%
Fieldwork
The implementation of the survey lasted from May 16th until June 30th, 2011. It was implemented by local partners of IPSOS Strategic Marketing Belgrade (www.ipsos.com) in individual countries. Table 3 provides details on the realized sample sizes and response rates by countries of the 2011 survey.
It’s worth noting that in most countries the response rate among Roma respondents was slightly higher than the response rate among non-Roma. In Macedonia, Croatia, Albania, Montenegro, Bulgaria, Bosnia and Herzegovina, Serbia and Hungary the re-

INTEGRATED HOUSEHOLD SURVEYS AMONG ROMA POPULATIONS
20
Table 3: Realized sample size by country, UNDP/WB/EC Regional Roma Survey 2011
sponse rate was in# uenced mostly by a number of refusals among Roma and non-Roma population with no uniform reason for the non-response situations. The refusal among Roma population was caused primarily by the fear that their answers might have negative implications for the ! nancial support they receive from the local authori-ties. In those cases the interviewers were devoting more time to explain the purpose of the study and how the information collected will be used. Involving interviewers of Roma ethnicity boosted the con! dence among the Roma respondents and increased their willingness to participate in the survey. In Romania, the Czech Republic, Slovakia and Moldova additional reasons for non-response situations were (a) the entire house-hold working abroad or involved in seasonal work in another part of the country or (b) people working in the ! eld till night (particularly in rural areas). In such cases interview-ers had to visit the households several times and some interviews were conducted in late hours or early in the morning. In some cases the respondents were not found at home even after 4 visits. A special case was encountered in Romania in the Petresti community (Satu Mare), where the interviewers had di$ culties in establishing contact with the male household members. It was reported that men often leave to ! nd work outside the community during the summer.
Country Roma Non-Roma
Hou
seho
lds
Hou
seho
ld
Mem
bers
Resp
onse
ra
te
Hou
seho
lds
Hou
seho
ld
Mem
bers
Resp
onse
ra
te
Albania 787 3,533 86% 355 1,384 83%Bosnia and
Herzegovina 779 3,551 78% 365 1,130 74%
Bulgaria 763 3,058 80% 366 938 79%Croatia 757 3,869 90% 350 1,106 80%
Czech Republic 756 3,353 66% 350 1,049 56%Hungary 753 3,204 70% 354 931 75%
Macedonia 788 3,696 90% 358 1,374 87%Moldova 759 3,163 56% 351 934 63%
Montenegro 766 3,237 84% 356 1,046 79%Romania 757 3,514 68% 350 1,021 56%
Serbia 786 3,645 80% 369 1,216 68%Slovakia 756 3,511 68% 350 1,197 48%
Total UNDP 2011 Regional Roma Survey 9,207 41,334 75% 4,274 13,326 69%

21
THE METHODOLOGY AND SAMPLING PROCEDURE OF THE 2011 SURVEY
All interviewers passed training before administering the survey and received a detailed interviewer manual to be followed during the ! eld work. In total, 1472 people were involved in the ! eldwork (interviewers/supervisors/editors). Country polling agencies engaged a total of 220 Roma enumerators and 102 Roma assistants to enumerators (20% or 50% of PSUs respectively were interviewed in cooperation with Roma NGOs in Slovakia and the Czech Republic). The data quality during the ! eldwork was assured through a realization of logical checks for each ! lled in questionnaire and back-check of 10%-20% of the questionnaires (contacting the respondents to con! rm that they have been interviewed). For more details on ! eldwork by country see Table 4.
The ! eldwork in the EU member countries (Bulgaria, Czech Republic, Hungary, Romania and Slovakia) was coordinated with the ! eldwork of the parallel survey implemented by the Fundamental Rights Agency. This coordination assured that the enumerators did not visit the same PSUs, producing for these countries a larger sample for selected questions (questions covered by both surveys – see the section on the questionnaire).
For the purpose of this survey, a Roma settlement was de! ned as part of a settle-ment in which the Roma population represents more than 50% of the total population of that part of the settlement). Non-Roma populations living in close proximity to Roma were de! ned as non-Roma households in the range of 300m from a Roma settle-ment (in the direction of the municipal o$ ce). In cases when there was no non-Roma population in close proximity or in the case of high diversity in socio-economic status between Roma and non-Roma population (for example in case that the Roma settle-ment was surrounded only by large new buildings - the di" erence in socio-economic status between Roma and non-Roma was high and visible) interviews with non-Roma would not be done in this sampling point, but a double number of non-Roma inter-views would be done in the next sampling point. The non-Roma sample was not to be fully distinguished from the Roma sample. If an interviewer came to a person in a Roma settlement who was NOT Roma by self-declaration and interviewers’ observation, he/she was included in the sample of non-Roma. After performing all 7 interviews from the Roma sample, interviewers went among non-Roma in close proximity of the Roma settlement and then performed the rest of the interviews from the non-Roma sample.
The enumerators were instructed to strictly keep the rules of the household selection. In case of non-response (due to not being at home) the interviewers had to re-visit a selected household 4 more times until they could replace it. The enumerators achieved response rates between 60% (Slovakia) and 89% (Macedonia).
No major problems occurred during the administration of the survey. Encouraging Roma respondents to take part in the study was successful. Although in most of the cases people were happy to take part to the survey and provide all the information they were asked for, hoping that their answers will count and their communities will receive some kind of help, in some communities the respondents were reserved, claiming that answering the questions won’t do them any good, that it would not change their situ-ation. Households which agreed to participate in the survey were relaxed and did not have di$ culties in answering, but the questions regarding income sources, credits /

INTEGRATED HOUSEHOLD SURVEYS AMONG ROMA POPULATIONS
22
loans of the household members and activity status made them feel more uncomfort-able and hesitant in giving a straight answer.
In all countries where the survey was conducted, in certain sampling points help and consent of local settlement leaders was crucial part in order to ensure that the survey would be conducted successfully. Beside this consent, in sampling points where there were problems in entering and conducting the survey, help of local authorities or spe-cialized NGOs was necessary and much appreciated. Speci! c problems with encour-aging respondents occurred in the municipality of Hlinné in Slovakia, where the local Roma authority did not allow the survey to be conducted.
Regarding the non-Roma sample, in Slovakia and the Czech Republic it was relatively more di$ cult to encourage non-Roma to take part in the survey. Probable reasons in-clude antipathy towards Roma neighbors, unwillingness to participate in activities to-wards helping them and fear of speaking about Roma neighbors.
Each household was visited by a pair of enumerators (male and female to assure the interviewees felt comfortable answering potentially gender sensitive questions). This method proved to be prevailingly helpful, although there were reported a few disad-vantages as well. Strengths of this technique seemed to be more associated with the interviewing process itself, while weaknesses seemed to be more associated with or-ganizational matters.
The interviewers pointed out that using the two interviewers’ technique was some-times problematic, due to the need to coordinate their schedules within a short period of time, but also due to the unequal distribution of work. The latter reason was also pointed out, every so often, as an advantage, in that it eased the interviewing process: the interviewer who ! nished ! rst could hold the others’ attention, while the second interviewer could complete their modules as well. On the other hand, for the interview-ing process, this method proved to be more viable since it increased the credibility of the survey and the participation rate. Besides that, the time of completion was sig-ni! cantly shortened given the distribution of modules per interviewer (on average, the administration of the entire questionnaire lasted 1.5 hours (net time), hence in reality the enumerators spent in each household less time when splitting the interviews).
Using two interviewers and the fact that they were able to complete questionnaires at the same time prevented any unwanted complications related to Module 4 (see de-scription below), and its privacy requirements. Interviewers often appreciated working in pairs sometimes due to their safety concerns. An interesting fact to be mentioned would be that, occasionally, respondents associated the presence of two interviewers with the lack of trust and feeling of fear related to Roma people.
Including interviewers of Roma ethnicity in the survey proved a particularly good experience. Namely, in the case of a Roma interviewer, Roma respondents had more con! dence and the presence of one Roma interviewer helped establish a connection sooner.
In each household up to three household members could have been interviewed during

23
THE METHODOLOGY AND SAMPLING PROCEDURE OF THE 2011 SURVEY
Table 4: Details of the ! eldwork
CountryField-work
duration
Re-sponse
rate
Number of sta" (inter-
viewers / super-visors / editors) involved
Number of teams
Number of Roma enumer-
ators
Number of Roma
assis-tants to enumer-
ator
Albania 20/5-24/6 85% 195 91 15 4
Bosnia and Herzegovina 18/5-18/6 76% 127 76 12 3
Bulgaria 16/5-19/6 80% 127 67 5 25
Croatia 18/5-30/6 87% 92 52 11 3
Czech Republic 16/5-24/6 62% 112 57 20
more than 50%
PSUs inter-
viewed in
coopera-tion with
Roma NGOs
Hungary 20/5-23/6 72% 134 71 5 5
Macedonia 17/5-26/6 89% 102 62 14 4
Moldova 20/5-20/6 58% 97 56 42 48
Montenegro 18/5-20/6 82% 106 86 11 2
Romania 18/5-18/6 64% 149 81 0 5
Serbia 20/5-14/6 75% 128 75 13 3
Slovakia 16/5-29/6 60% 103 56 72
more than 20%
PSUs inter-
viewed in
coopera-tion with
Roma NGOs

INTEGRATED HOUSEHOLD SURVEYS AMONG ROMA POPULATIONS
24
the questionnaire administration (see the description in the section on questionnaire). The interviewers reported some problems when interviewing three members but not in a signi! cant number. They mentioned that option of interviewing three persons in the household caused a suspicious reaction of head of household. There were cases in which the randomly chosen person refused to answer questions in Module 4 and asked another household member (usually the head of household) to answer instead. The main reason for this situation was that many of the randomly chosen respondents were still young, even though they were older than 16, and felt insecure to share their opinions with a stranger. Also, due to the rather low employment rate among Roma, in most situations, the interviewer had no problems in ! nding the household members at home.
More problematic than interviewing three respondents in the household was inter-viewing one person who had to answer three or more modules in the interview. In-terviewing with quite sophisticated or personal questions for more than 1,5 hours was tiring and poorly accepted by some respondents.
The majority of interviews did not have problems with in identifying the randomly cho-sen respondent. When applying the ! rst birthday technique for choosing a random respondent, two problems were occasionally identi! ed: the inability to recall all family members’ date of birth and illiteracy problems. This latter issue, although not directly related to the ! rst, helped in some situations to obtain more valid data. Respondents who were not sure about the dates and who also could not read o" ered their docu-ments (IDs) to the interviewer so that he could write down all information needed. In some cases where documents were not accessible, the interviewer selected respon-dents using the season they were born in as criteria.
Questionnaire
The survey questionnaire of the 2004 survey followed the philosophy of integrated household surveys, with separate components containing both household and in-dividual modules (Ivanov et al, 2006). Within the individual module, each household member’s pro! le was registered (demographic characteristics, economic status, edu-cation, health). The household module addresses issues related to the household in general (dwelling type, access to basic infrastructures, household items possession etc.). Questions related to incomes and expenditures were addressed in both modules, making it possible to crosscheck the results. The UNDP/World Bank/EC regional Roma survey 2011 followed the same logic and to a large extent copies the questions used in the 2004 survey.
The questionnaire consisted of ! ve modules (see the full questionnaire in the annex). Module 0 – Management section was ! lled in by the interviewer based on their ob-servation. It covers: interviewer’s evaluation of settlement characteristics and housing conditions; identi! cation of the respondent; assessment of the interview and informa-tion about the supervisor check.

25
THE METHODOLOGY AND SAMPLING PROCEDURE OF THE 2011 SURVEY
Module 1 – Household members pro! le was answered by the head of household (participation of other household members was acceptable). In this module informa-tion on each household member was collected in: demographic pro! le card (12 ques-tions; covering all household members); education pro! le card (14 questions; all house-hold members 6+ years old); health pro! le card (3 questions; all household members); current employment status card (16 questions; 10+ years old); and sources of income card (3 questions; 10+ years old).
Module 2 – Early childhood education and care was answered by the primary care taker of children (participation of other household members was acceptable). For each household member up to 6 years old the questions covered the following topics: Child Vaccinations (9 questions); Child Assessment (7); Attending Nursery / Kindergarten / Preschool (4); Parenting Techniques (3); and Kindergarten/Pre-School Characteristics (8).
Module 3 – Status of the household was responded by the household head (while allowing other household members to participate). This module collected: General household information (10 questions); information on Health (3); information on In-comes, Employment and Entrepreneurial Activity (22); and information on Levels of living standards and economic security (24).
Module 4 – Individual status and attitudes of the randomly selected respondent was administered to a randomly selected household member 16+ years old. The selec-tion method is described above (Sampling). This respondent relied to questions cover-ing the following topics: Health (19 questions); Values and norms (21); Migration – mo-bility (21); General discrimination – rights awareness (28); and Active citizen/trust (3).
The questionnaire was drafted in English, translated into local languages (in case of Moldova, both Moldovan and Russian). The questionnaire was not translated into lo-cal Roma languages – the interviewers did not report any di$ culties in addressing the interviewees with national language questionnaires – the Roma enumerators or assis-tants to enumerators were at place in case of language problems. The national versions of the questionnaire were back translated into English. In each country the question-naire was pre-tested on a sample of 10 households (7 Roma and 3 non-Roma) and nec-essary adjustments were made before the actual start of the ! eldwork.
Following the agreement on coordination of the UNDP/WB/EC regional Roma survey 2011 with the 2011 Roma Pilot survey of the Fundamental Rights Agency, the question-naire contained a limited number of questions formulated in the same way. The ! rst results of this “merged” data from both surveys were published in early 2012.12
12/ The situation of Roma in 11 EU Member States. Survey results at a glance. FRA 2012

26
The data-set used in the UNDP working papers
The resulting dataset from the UNDP/World Bank/EC Regional Roma Survey 2011 is used in addition to the merged dataset from the inclusion of the FRA Pilot Roma Sur-vey as the main data source of the “Roma Inclusion Working Papers” series launched by UNDP. Those papers address in-depth major aspects of Roma vulnerability in speci! c sectors and go beyond registering the status and depth of Roma exclusion. Using the quantitative data generated by the survey, the individual papers outline the fundamen-tal factors contributing to exclusion and the internal linkages between them.13 This is what makes the papers highly policy-relevant and interesting both for researchers and for stakeholders working on Roma inclusion.
The two datasets (the one from the UNDP/World Bank/EC Regional Roma Survey 2011 and the one from the FRA Pilot Roma Survey) are derived from a similar sampling pro-cedure described above and thus the pooled data for the ! ve EU countries – Bulgaria, the Czech Republic, Hungary, Slovakia and Romania - can be used to improve the e$ -ciency of the estimates. Individually, the survey indicators are similar in magnitude and direction. However, it is true that the results are statistically di" erent for several indica-tors but this is due to a great extent on the large sample size of each dataset rather than signi! cant di" erences in magnitudes (see Tables 5-7 as examples). As a precaution for any potential bias, analysis from the UNDP Working Papers use the merged dataset on a limited basis and only for demonstrating simple correlations rather than regression analysis.
The UNDP/World Bank/EC Regional Roma Survey 2011 has several di" erent survey modules both individual and household level questions. One section speci! cally, the section on individual status and attitudes of a randomly selected respondent requires
3
13/ The papers under the series include: Brüggemann, C. (2012). Roma education in compara-tive perspective. Analysis of the UNDP/World Bank/EC regional Roma Survey. Bratislava: UNDP; Cukrowska, E., Kóczé, A. (2013, forthcoming). Roma, women and men: when gender and ethnic disparities add up. Bratislava: UNDP; Ivanov, A. (2013, forthcoming). Roma poverty in a human development perspective. Bratislava: UNDP; Kóczé, A. (2013, forthcoming). Civil society, civil in-volvement and social inclusion of the Roma. Bratislava: UNDP; Mihailov, D. (2012, forthcoming). The health situation of Roma communities: Analysis of the data from the UNDP/World Bank/EC regional Roma Survey. Bratislava: UNDP; O’Higgins, N. (2012). Roma and non-Roma in the Labour Market in Central and South Eastern Europe. Bratislava: UNDP; Peri', T. (2012, forthcom-ing). The Housing Situation of Roma Communities: Analysis of the Findings of the UNDP/World Bank/EC Regional Roma Survey. Bratislava: UNDP; Tomova, I., Cherkezova, S. (2013, forthcom-ing). Migration as an option of last resort? Bratislava: UNDP.

27
Table 5: Literacy rate (Roma)
the use of weights for estimation. The respondent in this section is randomly selected among household members aged 16 and above. The probability weight of choosing this individual over other adults must therefore be calculated and included. Weights are trimmed at 3 individuals over 16 for each household. They are then multiplied by the scale factor - the number of cases divided by the sum of the weights by country and
Table 6: Health insurance (Roma)
Country UNDP FRA T-test for Di" e-rence in Means
Bulgaria 88.16% 86.20% **
Czech Republic 98.82% 94.84% ***
Hungary 94.74% 95.08%
Romania 79.19% 71.36% ***
Slovakia 99.17% 95.38% ***
Source: UNDP/WB/EC Regional Roma Survey 2011 and FRA Roma Pilot Survey 2011
Source: UNDP/WB/EC Regional Roma Survey 2011 and FRA Roma Pilot Survey 2011
Table 7: Neighborhood change (Roma)
Country UNDP FRA T-test for Di" e-rence in Means
Bulgaria 16.30% 10.45% ***
Czech Republic 16.76% 17.61%
Hungary 15.18% 14.76%
Romania 34.68% 23.13% ***
Slovakia 30.73% 22.07% ***
Source: UNDP/WB/EC Regional Roma Survey 2011 and FRA Roma Pilot Survey 2011
Country UNDP FRA T-test for Di" erence in Means
Bulgaria 56.64% 41.80% ***Czech Republic 94.32% 91.29% ***Hungary 90.83% 96.61% ***Romania 50.78% 52.72%Slovakia 97.15% 91.78% ***

INTEGRATED HOUSEHOLD SURVEYS AMONG ROMA POPULATIONS
28
Roma/Non-Roma status. In the UNDP Working Papers these weights are used when-ever variables from this module are included.
The analysis used in the UNDP Working Papers employs several statistical techniques in-cluding cross-tabulations, di" erence in means tests, graphical and regression analysis.
Cross-tabulations are the most frequently used analysis in the UNDP Working Papers. They are used to compare di" erences in frequencies or averages by Roma and non-Roma within a given country. Sometimes they are restricted to a further subsample like primary school aged children, or the unemployed. These tabulations help compare dif-ferences between Roma and non-Roma and are supplemented statistically by testing if the di" erences are indeed signi! cant. They are also displayed graphically in histograms or line graphs, highlighting their results.
The UNDP Working Papers use a student t-test or a Pearson’s chi squared test to com-pare di" erences in means. Roma and non-Roma are compared for each country to test whether there is a signi! cant di" erence in either the mean shares of the population or direct averages of an indicator like the mean number of rooms per household member or average years of education. The large sample sizes allow for mostly non-ambiguous results when testing the null hypothesis of no di" erence in means in favor of the alter-native two tailed hypothesis, that there is a di" erence (either positive or negative). The student t –test is used when variables are binary; poor or non-poor, literate or not, have health insurance or not, etc. The t-distribution looks like a normal distribution with fat-ter tails, so it is more likely than the normal to generate values far from the mean.
Depending on the number of observations in the estimate, number of restrictions in the hypothesis being tested, and the level of signi! cance desired critical t values at the tails can be found. If you compare the t statistic from the di" erence in means test to these critical t values, you can determine whether your result is statistically signi! cant at di" erent signi! cance levels, or p values. Usually one chooses signi! cance levels of 10 percent (p=0.10), 5 percent (p=0.05), or 1 percent (p=0.01) and rejects the null hypoth-esis, no di" erence in means, if the estimated t-statistic is greater than the critical t val-ues at the chosen signi! cance level. The Pearson’s chi-squared test is used for compar-ing indicators with multiple responses like comparing sources for heat or for cooking by Roma and non-Roma. In some instances the test is also used for binary comparisons (where it returns the phi coe$ cient). Rather than the student t distribution this test fol-lows the chi-squared distribution and is analyzed in much the same way. It again tests the null hypothesis that there is no di" erence in means against the alternative that there is a signi! cant di" erence between Roma and Non-Roma.
Regressions expand on cross-tabulation as a way of analyzing the e" ect of multiple independent variables on a dependent variable. The UNDP Working Papers sometimes employ regression techniques in identifying possible causes of school attendance, em-ployment or wages, health, etc. These techniques test a variety of hypotheses without the bias of omitting key variables. By including various factors in a multiple regression context, under speci! c assumptions, we can control for those e" ects on both the factor and the outcome. The following is one such example employed in the UNDP Working

29
THE DATA-SET USED IN THE UNDP WORKING PAPERS
Paper on Education and can be used as an example of the technique most applied:
Dropouti = !+Xi "+#1 rurali+#2 romanidominanti+#3 primarywalki+COUNTRYji Z+ei
This probit model estimates the possible factors contributing to school attendance among children ages 9 to 17.14 We use a standard probit because the dependent vari-able is dichotomous and we want to estimate what e" ect the independent variables have on the probability of having dropped out/not attending school. Dropouti is the dependent variable equaling 1 if the individual is not attending school, 0 otherwise. Independent variables are tested for whether they have an e" ect on the dropout rate while controlling for the other variables in the regression: Xi are a vector of demograph-ic variables of person i like gender, age, and Roma or Non-Roma status, rurali equals 1 if the person lives in a rural area, romanidominanti equals 1 if person i lives in a majority Roma area, primarywalki is the distance to a primary school from person i, and COUN-TRYji is a vector of country dummies equal to 1 if the individual lives in COUNTRYj. The model also controls for the country sampling procedure by clustering errors on the country level to give more precise results. The estimation proceeds using maximum likelihood methods. The resulting coe$ cients and standard errors are then used to test if the null hypothesis of no e" ect on the dropout rate can be rejected for each of these variables. Finally, we can calculate the marginal e" ects from these initial estimates and ! nd out the e" ect of a marginal change in an independent variable on the probability of dropping out of school15.
A few other regression techniques are applied in the papers however, the probit is the most common. Where it is not appied there are appropriate descriptions of the regres-sion techniques employed.
14/ The model is written as a linear regression for ease of view but formally the probit is Pr(y>0|X)=((X’ )) where X are all the variables in the model, Pr stands for probability, and ((*) is the CDF of the normal distribution. It is important to note that there are di" erent modeling techniques with varying complexities that could be employed with this dataset but these are meant as a preliminary examination of di" erent hypotheses under a multiple regression con-text. Also note that the model does not give general Roma/Non-Roma population results but rather follows the data sampled by providing results for the marginalized Roma and neighbor-ing majority population subsample.15/ See the UNDP Working Papers for more speci! c examples of this procedure.

30
Conclusions
Providing a single and precise de! nition of the ‘Roma universe’ is close to impossible. “Roma” is not just a multifaceted category and a meta-group – it is also a political con-struct and its meaning di" ers depending on the interpretative frameworks of the dif-ferent sides involved in the debate on the issue. Roma identity may also be quite situ-ational and re# ective de! ned vis-à-vis the non-Roma (the Gadzo).
This doesn’t mean though that sampling surveys targeting Roma populations are not possible and the data generated through them are not su$ ciently robust. It is possible to generate meaningful and policy-relevant data on the status of Roma.
The key in that regard is properly de! ning the target – the Roma living in the commu-nities where they are overrepresented. “Overrepresentation” is correlated with higher risk of marginalization and exclusion. Those are the groups requiring (and increasingly receiving) support, including through development projects targeting those commu-nities.
The methods tested in the UNDP, WB and FRA surveys allow for generating exactly such policy-relevant data. It doesn’t allow drawing conclusions on the status of “all Roma” – but it does make possible outlining the challenges and the needs of those who need support most. This is what makes the methodology highly policy-relevant. In the end, the process of Roma inclusion means including the excluded.

31
References16
ERIO. (2009). Survey on ethnic data collection: risk or opportunity? Brussels: European Roma Information O$ ce. http://cloud2.snappages.com/ecc3fa83da15cf423fe3aaa342f-545fa355b24f3/Data%20Collection%20Survey_2009.pdf
FRA. (2012). The situation of Roma in 11 EU Member States - Survey results at a glance. Vienna: Fundamental Fights Agency. http://fra.europa.eu/en/publication/2012/situa-tion-roma-11-eu-member-states-survey-results-glance
Guy, W. (2001). ‘Romani Identity and Post-Communist Policy’, in Will Guy (ed.), Between Past and Future: the Roma of Central and Eastern Europe. Hat! eld: University of Hert-fordshire Press
Ivanov, A., Zhelyazkova A., Slay B., Márczis, M., Va+e,ka, M., O’Higgins, N., Cace, S., & Sirovatka, T. (2002). Avoiding the Dependency Trap. The Roma in Central and Eastern Europe. Bratislava: UNDP Regional Bureau for Europe and the CIS. http://hdr.undp.org/en/reports/regional/europethecis/Avoiding_the_Dependency_Trap_EN.pdf
Ivanov, A., Collins, M., Grosu C., Kling, J., Milcher, S., O’Higgins, N., Slay, B., Zhelyazkova, A. (2006). At Risk: Roma and the Displaced in Southeast Europe. Bratislava: UNDP; http://hdr.undp.org/en/reports/regional/europethecis/Europe_&_the_CIS_2005_en.pdf
Ivanov, A. (2012). Quantifying the Unquanti! able: De! ning Roma Populations in Quan-titative Surveys. -./010230 Issue no. 3-4/2012, pp. 79-95. http://www.ceeol.com/aspx/issuedetails.aspx?issueid=529e262d-a405-433c-806c-a5ccf96369eb
Ladányi, J., Szelényi, I. (2001). The social construction of Roma ethnicity in Bulgaria, Ro-mania and Hungary during market transition. Review of Sociology Vol. 7-2, pp. 79-89.
Liegeois, J-P. (1997). Roma, Gypsies, Travellers. Strasbourg: Council of Europe.
Makkonen, T. (2007). Measuring Discrimination - Data Collection and EU Equality Law. Luxemburg: O$ ce for O$ cial Publications of the European Communities. http://www.non-discrimination.net/content/media/Measuring%20Discrimination%20-%20Data%20collection%20and%20EU%20Equality%20Law%20_en.pdf
Milcher, S., Ivanov, A. (2004). “The United Nations Development Programme’s Vulner-ability Projects: Roma and Ethnic Data”. Roma Rights 2, 2004: Ethnic Statistics. Budapest: ERRC. http://www.errc.org/cikk.php?cikk=1936
OSI. (2010). No Data – No Progress. Data collection in Countries Participating in the Decade of Roma Inclusion 2005-2015. Budapest: Open Society Institute. http://www.romadecade.org/files/downloads/General%20Resources/No%20Data%20No%20Progress%20Country%20Findings.pdf
16/ The electronically available publications were last accessed on 20 December 2012.

32
Petrova, D. (2004). “Ethnic Statistics”. Roma Rights 2, 2004: Ethnic Statistics. Budapest: ERRC. http://www.errc.org/cikk.php?cikk=1935
Ringold, D., Orenstein, M.A., Wilkens, E. (2005). Roma in an Expanding Europe: Breaking the Poverty Cycle. Washington: The World Bank; http://siteresources.worldbank.org/EXTROMA/Resources/roma_in_expanding_europe.pdf
Rövid, M. (2001). One-size-! ts-all Roma? On the normative dilemmas of the emerging Eu-ropean Roma policy. Romani Studies 5, Vol. 21, No. 1, pp. 1–22. http://academos.ro/sites/default/! les/biblio-docs/338/m__rton_r__vid___34_one_size_! ts_all_roma__34___on_the_normative_dilemmas_of_the_emerging_european_roma_policy_.pdf
Rughini%, C. (2011). ‘Quantitative tales of ethnic di" erentiation: measuring and using Roma/Gypsy ethnicity in statistical analyses’, Ethnic and Racial Studies, 34: 4, pp. 594-619.
UNDP. (2005). Faces of Poverty, Faces of Hope. Bratislava: UNDP. http://issuu.com/undp_in_europe_cis/docs/faces_of_poverty__faces_of_hope
UNDP. (2012). Opportunities for Roma inclusion. Development and Transition, issue 19, June 2012; http://issuu.com/undp_in_europe_cis/docs/undp_dt_news_19_web
&kobla, D., Leon,ikas, T., &t4pánková, M.. (2009). Ethnicity as a statistical indicator for the monitoring of living conditions and discrimination. Bratislava: UNDP. http://issuu.com/UNDP_in_Europe_CIS/docs/ethnicity_as_a_statistical_indicator_for_the_monit/1
UNICEF. (2007a). Republic of Macedonia: Monitoring the situation of children and women. Multiple Indicator Cluster Survey. 2005-2006. Skopje: State Statistical O$ ce. http://www.unicef.org/tfyrmacedonia/MICS-ENG-1(1).pdf
UNICEF. (2007b). Serbia: Monitoring the situation of children and women. Multiple Indicator Cluster Survey. 2005. http://www.childinfo.org/! les/MICS3_Serbia_FinalRe-port_2005-06_Eng.pdf
WHO. (2012). Roma health newsletter, Issues 1 (May 2012) and 2 (September 2012). http://www.euro.who.int/en/what-we-publish/newsletters/roma-health-newsletter

