housing and affordable housing – wednesday 17 april rescheduled session 2 - housing and affordable...
TRANSCRIPT
1
ED
TORFAEN COUNTY BOROUGH COUNCIL
FURTHER LDP EXAMINATION STATEMENT
Session 2 - Housing / Affordable Housing - Tuesday 18
th June 2013
2
Rescheduled Session 2 - Housing and Affordable Housing Tuesday 18th June 2013 Introduction
This further examination statement has been prepared by Torfaen County Borough Council with advice from Dr Andrew Golland from Andrew Golland Associates and Steve Gibbon from GVA, in order to facilitate discussion at the rescheduled ‘Housing and Affordable Housing’ session 2 on Tuesday 18th June 2013; which was adjourned from Wednesday 17th April 2013 pending the submission of further information. It should be read in conjunction with the Council’s original examination statement (ED21).
When the matter was examined on the 17th April 2013, the Home Builders Federation (HBF) challenged several of the Council’s March 2013 ‘Affordable Housing Viability Study Update’ (AHVSU) (see ED21, Appendix 3) testing assumptions and thus its results and use in informing policies in the LDP. Therefore, the Inspector adjourned the Examination Session in order for the ‘Development Appraisal Toolkit’ (DAT) (an excel based spreadsheet used by Councils throughout England and Wales to evaluate the viability of housing sites) to be re-run using the HBF’s testing assumptions; and for further examination submissions and rebuttals based upon this work to be submitted by an agreed date.
Therefore, at the request of the LDP Inspector, the Council has re-run the DAT using the HBF’s testing assumptions and produced the HBF AHVSU (ED107) to show the potential results and implications for setting affordable housing policy through the County Borough.
The Council does not support the HBF AHVSU and has produced this further examination submission that challenges all of the HBF’s testing assumptions and its results. Comments on HBF AHVSU
As stated in the ‘Key Findings and Conclusions’ chapter 3, of the HBF AHVSU (ED107, page 18), when using the HBF testing assumptions, the impact of introducing mandatory fire suppression systems (sprinklers) and 40% energy efficiency improvements is that no (0%) affordable housing can be sought on any site within the County Borough, even in the highest value market areas of South & East Cwmbran. Indeed, no residential development would be viable anywhere in Torfaen. Therefore, all the LDP housing allocations would be undeliverable; thus making the LDP unsound.
Therefore, the Council has identified a clear ‘reality gap’ in the HBF analysis. The HBF testing assumptions, by suggesting residual development appraisals produce results totally at odds with the figures they claim are ‘land values’. Similarly, the HBF’s testing assumptions are weighted unfairly in favour of the development industry and land owners, at the expense of meeting housing requirements or making Section 106 planning obligations that either make the development of a housing site acceptable or provide essential facilities to serve their residents.
The HBF have entirely failed to show that land supply is being held back by viability and the affordable housing and Section 106 process. Their analysis fails to contextualise the impacts of the Council’s policies within the wider housing market framework. On the contrary, it is clear that landowners are releasing housing land and developers are building or bringing forward housing sites whilst meeting the Council’s affordable housing policy and SPG requirement as proposed by the LDP.
Therefore, the HBF will need to decide which of their testing assumptions are incorrect or not applicable to rectify this situation.
3
Analysis of the HBF Testing Assumptions
The Council considers that, leaving aside the few areas of consensus (which are detailed below), all of the HBF testing assumptions are either incorrect or overstated as follows: - Methodology - As regards methodology, the HBF support the use of the Three Dragons DAT and ‘residual value approach’ in assessing viability, with the fundamental exception that they consider that residual value be benchmarked against residential land sale values, rather than the ‘Existing Use Value (EUV) plus’ approach which is very widely established in case law, judicial precedent and best practice across the United Kingdom.
The concept of ‘residential land value’ as a way of assessing viability matters is flawed. The approach fails to recognise that land value is a function of both the planning system as well as the wider economy. The wider economy drives land and property values, but the planning system effects the distribution of this value. Thus the argument is about the value of land at varying Section 106 impacts, including affordable housing. Without knowing this, the concept of ‘residential land value’ is futile.
Viability comes back to Existing Use Value. It is impossible to make sense of policy setting and policy development in any other way. The house building industry argues that sites have a ‘value’ and that this ‘value’ is one which can be traded in the market. They are right. But it is the place of policy makers to lead the development process by providing clear policies that reflect known policy impacts.
It is a hard fact that many sites in South Wales rely entirely on the planning process to make them viable. The EUV is low; in some cases, very very low. In most cases a residential consent will change the economics significantly; and a residential consent including a relatively high percentage of affordable housing will change the economics very significantly. Land Values - Notwithstanding the Council’s fundamental objection to the use of benchmarked residential land sales, as stated above, the HBF consider that land values range from £700k per ha in lower value areas to £1.2m per ha in higher value areas of Torfaen. This is based upon a land value figure for Merthyr of £1m per ha; the nearly £700k per ha net land value of the South Sebastopol site (from the Council’s South Sebastopol examination statement Appendix 10, see ED30j); and an assertion that an average percentage of a site’s Gross Development Value (GDV) should be used (see the HBF examination statement ED26, pages 2-5 for details) to define land values.
Unfortunately, the HBF did not state that the figure for Merthyr was produced in July 2009, nearly 4 years ago; noting that the Valuation Office in providing the information stated that “values should be regarded as illustrative rather than definitive”. Also, surely land values from Torfaen would be more appropriate in a Torfaen assessment if the HBF methodology was to be accepted.
Similarly, the HBF have used the net (based upon the 43ha developable area) land value of the South Sebastopol site in Torfaen. However, the gross site area of the site is 103.5ha; noting that the larger site area is required to make the site acceptable in planning terms. Therefore, the South Sebastopol site has a gross land value of £315k per ha. Indeed, it was on the basis of this gross land value that the Council accepted the viability assessment and reduced S106 package for the site. Furthermore, it should be noted that the Council also recognised that the developers purchased some of the land and signed options when house prices were higher.
4
Finally, the HBF’s assertion that an average percentage of a site’s Gross Development Value (GDV) should be used to define land values is not supported; as explained in Dr Golland’s response to this assertion in the Council’s March 2011 AHVSU (see SD31, page 46). House Prices - The 2011 AHVS used recent new house price sales data derived from HM Land Registry information and local surveys; which was agreed by the Affordable Housing Workshop / Study Group in October 2010.
The Council’s March 2013 AHVSU used ‘Hometrack’ supplied house price data which is derived from all HM Land Registry house sales information (both new and second hand); which indicated a 3.4% drop in houses price values since October 2010.
The HBF, have proposed the use of the latest HM Land Registry monthly House Price Index (HPI) on the average house price change in Torfaen; which indicates a 12% drop in house prices to February 2013.
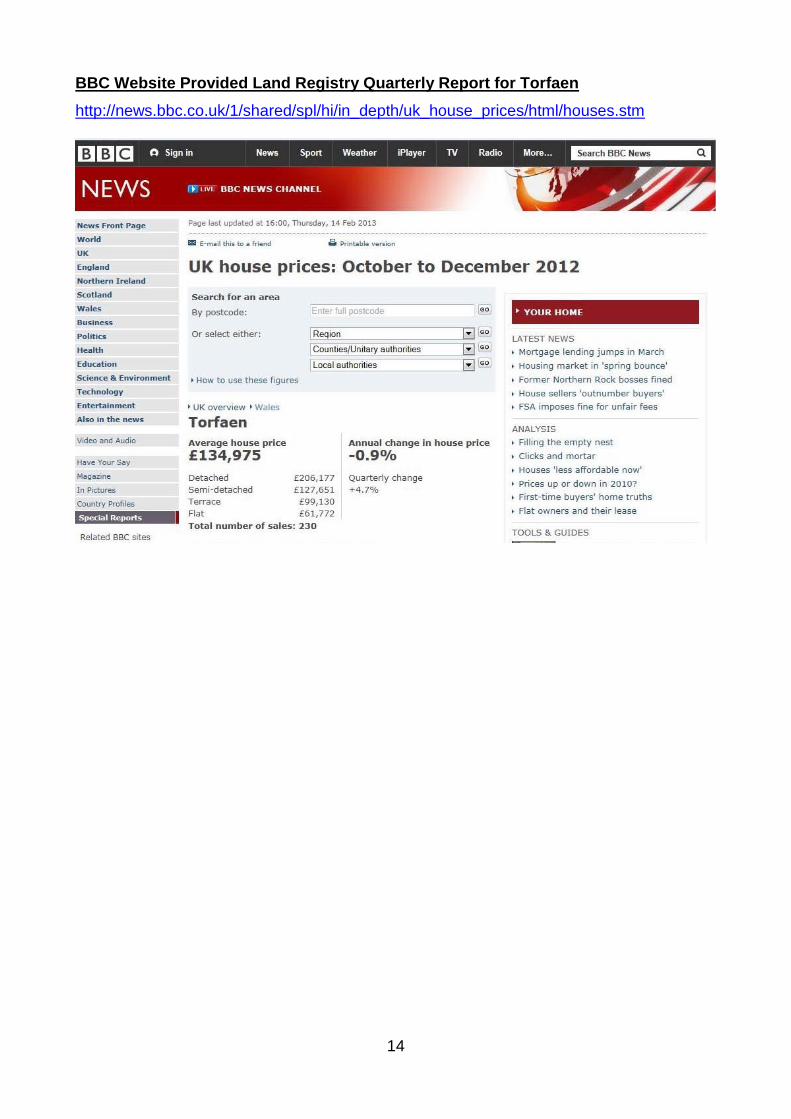
However, this difference in house prices can be explained; as the HPI is only based upon data from second hand rather than new house price sales; and even then, as an index, as stated by the Land Registry only measures “price change rather than absolute values”. Therefore, it clearly cannot be used as a measure of the change in the absolute value of new houses within Torfaen. I have attached the Council’s notes from the HM Land Registry website (with links) to explain this at Appendix 1. I have also attached a ‘This is Money’ financial website article, published on 30th January 2013, that explains this in detail and states that the Land Registry’s Quarterly Report, which is a paid for data service, is a better measure of the changes in house price sales across the whole housing market, rather than the indexed second hand market as proposed by the HBF. Finally, Appendix 1 also contains an extract from the BBC website page that shows the Land Registry Quarterly Report for Torfaen from October to December 2012 with an average house price of £134,975. This is similar to the Hometrack value of £127,011 for October 2012 used by the Council in its March 2013 AHVSU, thus supporting the validity of the Council’s figures, which are clearly on the low side.
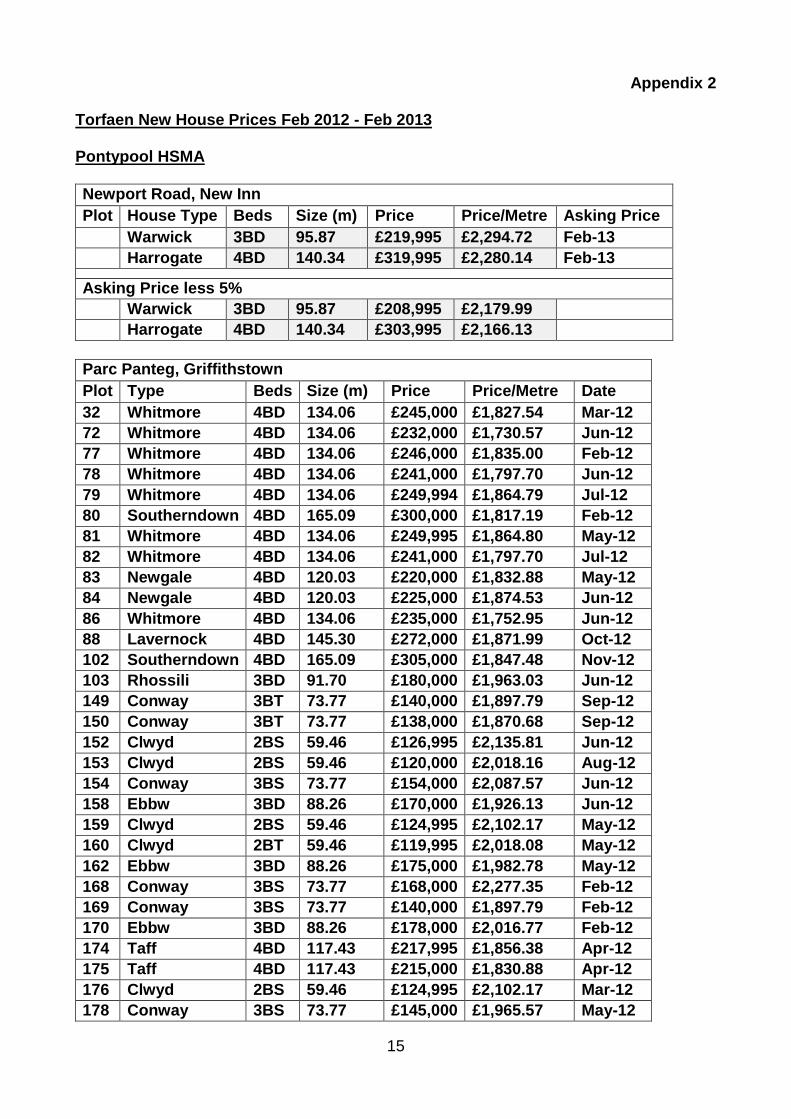
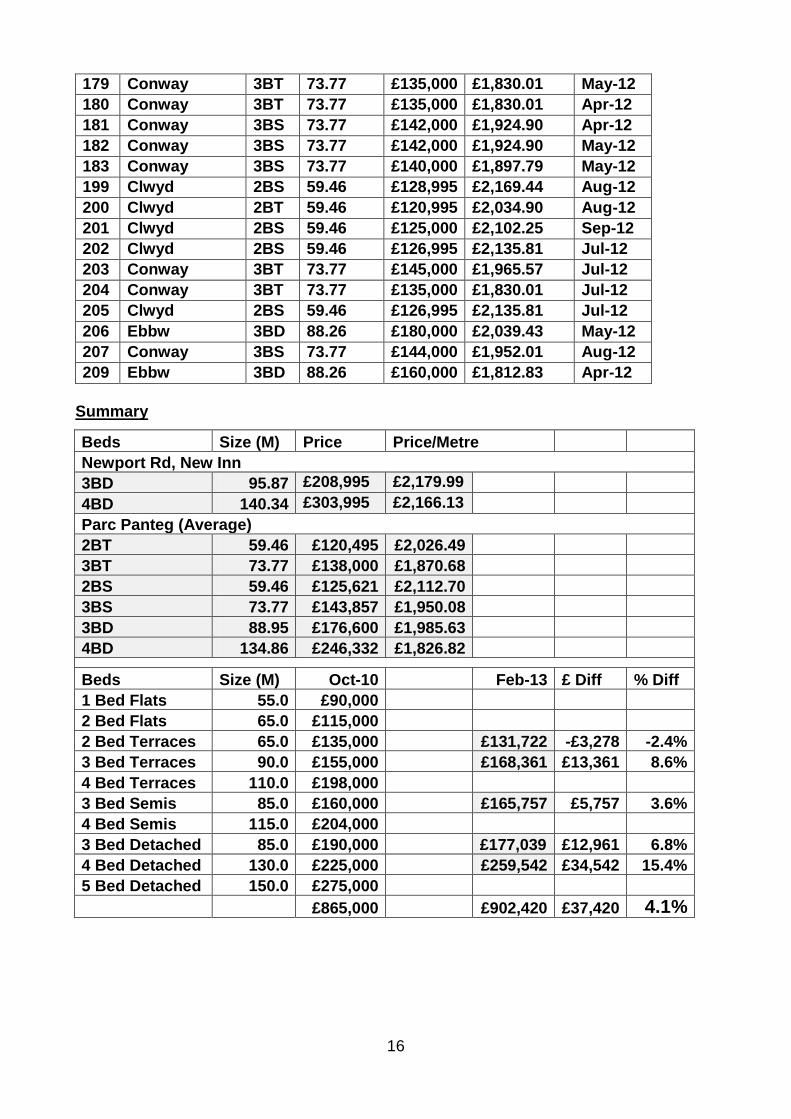
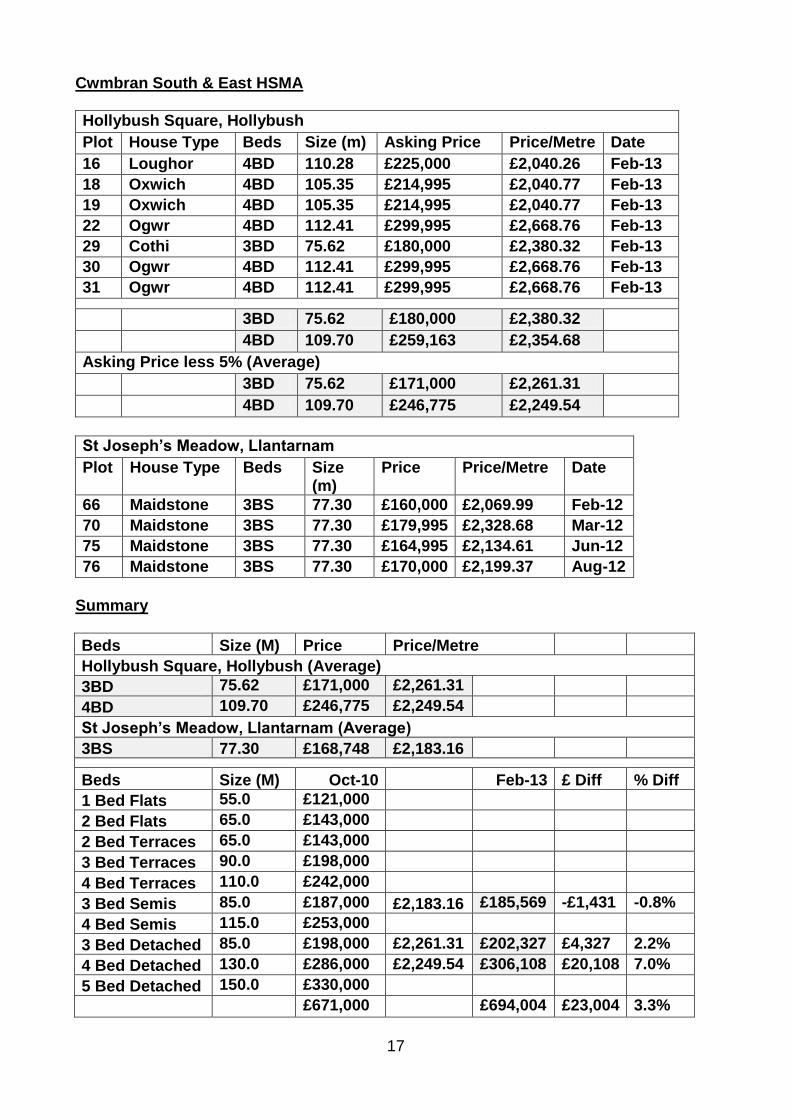
In order to verify this information, the Council carried out a further survey of new house price sales from HM Land Registry data over the last year (until February 2013) in Torfaen. The results are attached in Appendix 2: which shows that new house prices have actually risen, on average, by 3.7% since October 2010. This result was statistically expected, as if the HBF data represents the lower value indexed second hand market and the Hometrack data represents the average value of both the second hand and new markets (in the knowledge that new house prices have a new house premium), it must then follow that new house prices would be higher than the Hometrack average.
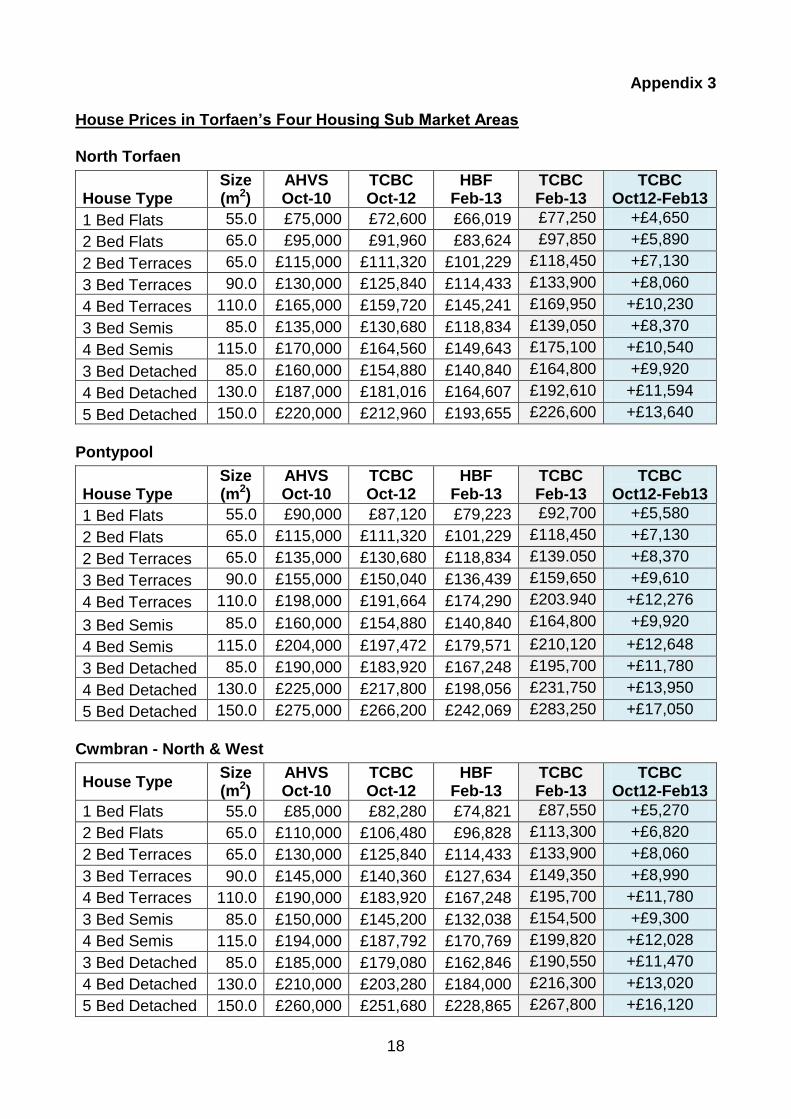
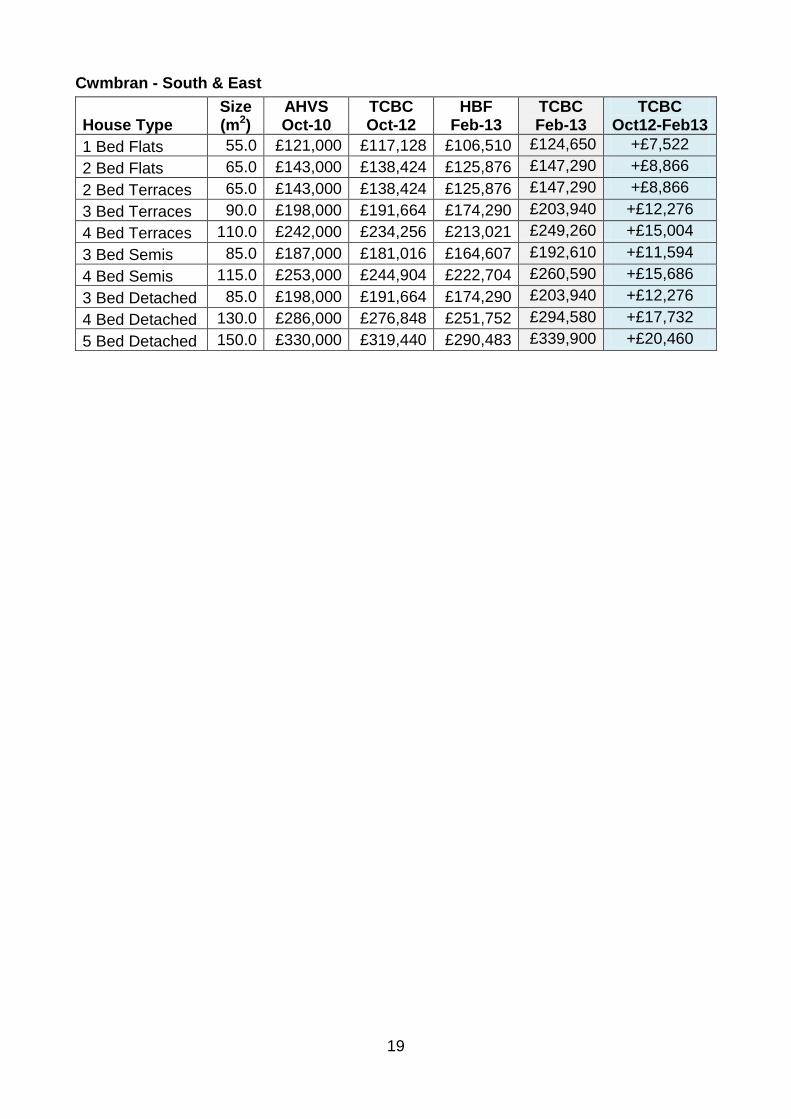
Therefore, the Council now considers that this latest, Torfaen based, new house price sales data should be used to assess the viability of housing sites. At Appendix 3, the Council has shown new house prices in Torfaen’s 4 housing sub market areas when taking at least a 3.0% average price rise into account.
Appendix 3 also shows the difference in house value this increase would have between the October 2012 and February 2013 data; which allows comparisons to be made with the results of the Council’s March 2013 AHVSU. Indeed, this shows that with at least a 3% increase in new house prices, the impact of the WG’s introduction of both fire suppression systems and energy efficiency improvements would be negated for every house type throughout all of Torfaen’s Housing Sub Market Areas; noting that flats would only need to increase by £879 and approximately £3,000 respectively = £3,879 and houses by £7,275.
5
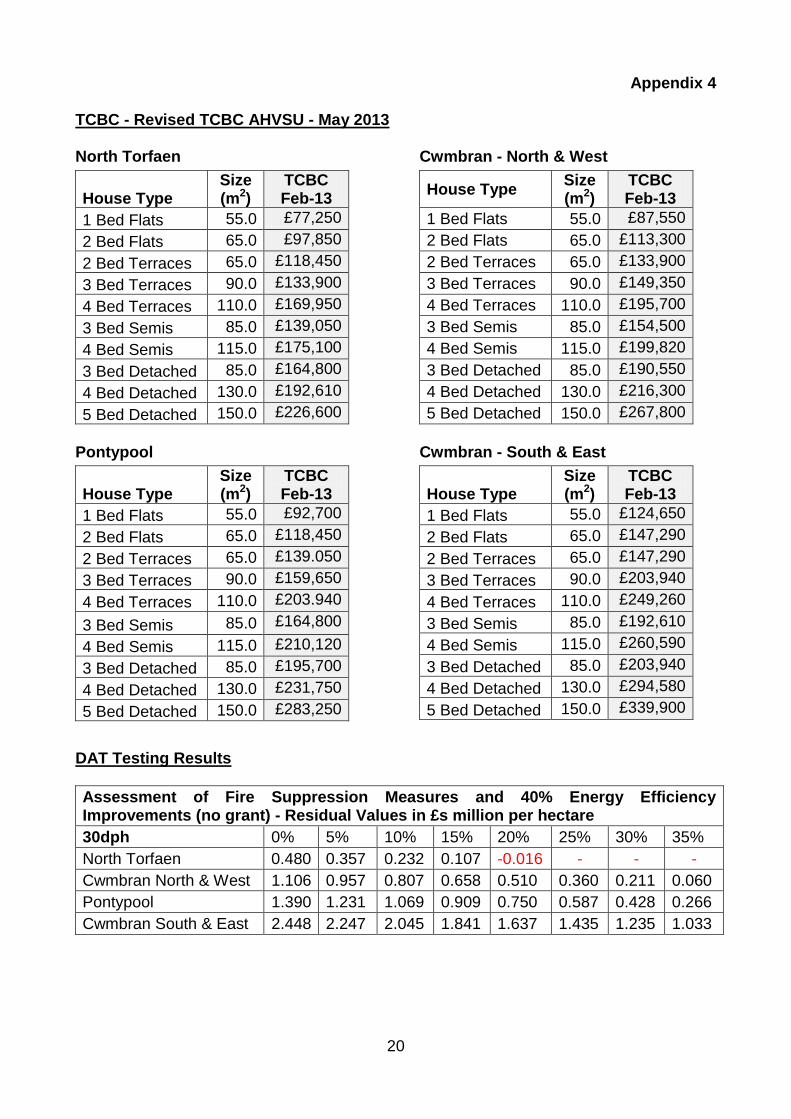
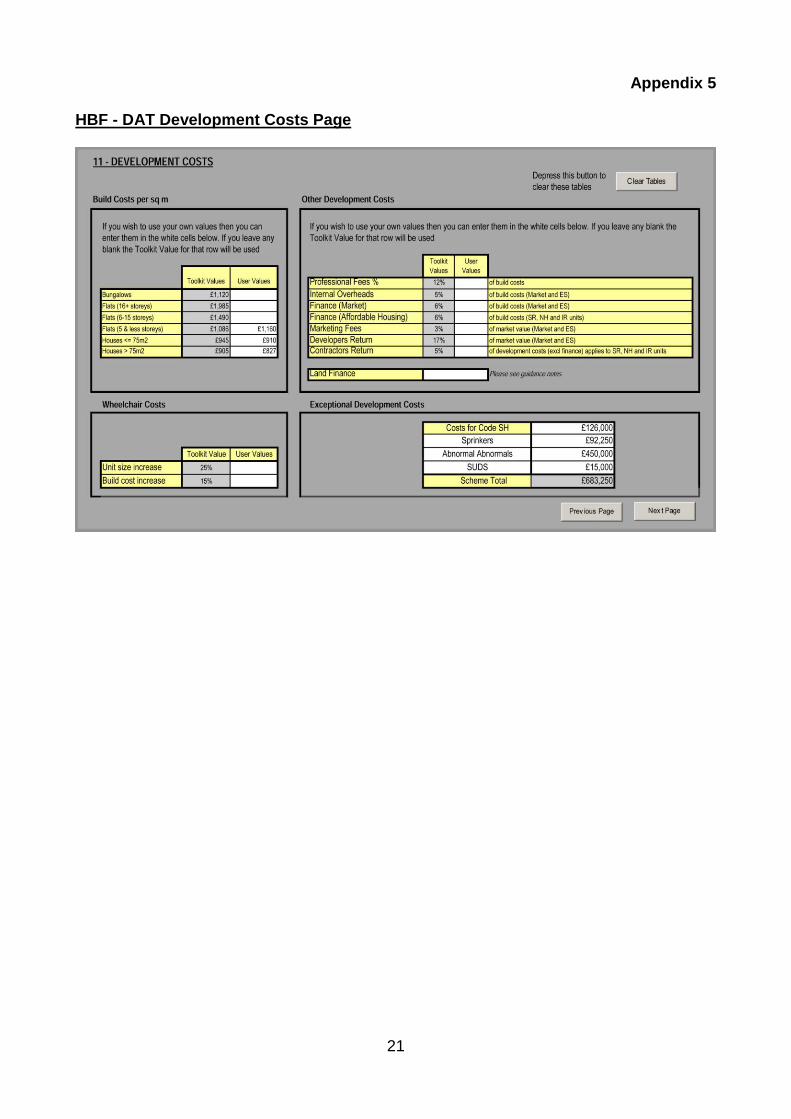
In addition, the Council has rerun the DAT for the highest level of WG additional costs (£7,275 per dwelling for both sprinklers and 40% energy improvements) with the above minimum 3% increase in new house prices and produced revised TCBC AHVSU - a May 2013 result; which is attached at Appendix 4. This confirms that these additional WG costs are negated by the increase in house prices and that sites are even more viable than was originally considered. Therefore, the Council considers that its AHVSU is still valid in determining the strategic affordable housing and S106 policies of the LDP, which should remain unchanged as a result. Use of BCIS Build Costs - There is consensus that the latest BCIS build costs should be used in the DAT, which represents the average build costs in Torfaen with the ‘Normal’ level of abnormals (known as ‘Normal Abnormals’). However, the HBF consider that more than the average level of abnormals should be used (known as ‘Abnormal Abnormals’) as well as an allowance for the provision of Sustainable Urban Drainage Systems (SUDS); which are considered in the next sections. I have attached an extract from the DAT, at Appendix 5, which shows how the DAT adds these HBF costs. Other Development Costs - There is consensus on these other developer costs, such as professional fees, overheads, finance, marketing and developer & contractor returns; see the attached extract from the DAT, at Appendix 5, which shows the % allowed for these costs. ‘Abnormal’ Abnormal Development Costs - Based upon a variety of sites and locations from outside Torfaen and only the South Sebastopol site from within the County Borough, the HBF consider that the AHVSU should include a minimum cost of £450,000 per ha to cover abnormal development costs which are claimed to apply to all sites. The HBF and their consultants consider these costs to include: -
the remediation / reclamation of brownfield sites;
pile or raft foundations;
gas protection barriers;
importation of clean subsoil / topsoil for a capping layer or flood mitigation;
remediation of ground contamination;
ground consolidation;
demolition;
asbestos removal;
drainage and on-site attenuation;
land profiling;
service diversion;
pumping stations;
etc.
Firstly, the Council considers these costs to be ‘abnormal’ abnormal costs which are not applicable to all sites. In addition, the South Sebastopol site is considered to be a worse case scenario site which should not be considered the norm. In any event, evidence from the construction of current housing sites in Torfaen shows that sites can provide many of the Council’s S106 requirements, including the full level of affordable housing whilst bearing abnormal development costs. For example:-
1. The Persimmon Homes, Hollybush School site in the Cwmbran S&E HSMA, is delivering the required 30% affordable housing, providing for children’s play, adult
6
recreation and pos. Known abnormals include the demolition of the former primary school, a few special foundations, etc. It should be noted that no education, transport or biodiversity contributions were required; and neither did the developer seek any reduction in the S106 package.
2. The Redrow Homes, Newport Road New Inn site, in the Pontypool HSMA, is delivering the required 25% affordable housing; providing a children’s play area and pos; and making a £58,900 contribution for educational provision; with ‘abnormals’ that include providing a SuDS and a foul pumping station. However, it is not known if there any special foundations or any other abnormals as the developer did not seek any reduction in the S106 package. It should be noted that no adult recreation, transport or biodiversity contributions were required.
3. Similarly, the Trevethin School site in the Pontypool HSMA is currently the subject of a planning application by Barratt Homes who are proposing the required 25% affordable housing as well as all of the S106 obligations as stated in the site development brief (see SD48).
4. Finally, the planning application for the windfall housing sites on the Commodore Hotel in Llanyravon or the Cold Stores in Llantarnam, which are both brownfield sites in the Cwmbran S&E HSMA, have proposed their required 30% affordable housing, noting that both sites have abnormal development costs for the demolition of the existing building. In addition, Barratt’s have stated the following abnormals on their 2.1ha Cold Stores site: asbestos risk, the provision of noise attenuation measures / acoustic fencing, a SuDS, retaining walls, special foundations, roots barriers, offsite highway and footway links, a pedestrian crossing, inert capping, imported topsoil, site raising, a bat building and woodland / landscape mitigation measures. Finally, whilst pos is provided, no educational or recreation facilities are proposed due to the proximity of existing nearby facilities.
Therefore, the Council’s approach of not including abnormal abnormals in the AHVSU is still considered valid in determining the affordable housing and S106 policies of the LDP. Any abnormal abnormals can be considered at the planning application / design stage when they can be more easily quantified. Sustainable Drainage Schemes (SuDS) - The HBF consider that the AHVSU should include a cost of at least £500 per dwelling for the provision of SuDS, taken from the “Welsh Government’s viability analysis”, presumably the one undertaken as part of the work on Part L of the Building Regulations, but do not clearly provide the source for scrutiny by the Council.
Notwithstanding this, the Council’s drainage engineers consider the provision of SuDS is at least cost neutral; noting that this is not a new cost item, as developers have been dealing with surface water runoff as a matter of existing practice, mainly through traditional drainage solutions. Also, the actual costs of SuDS measures and therefore SuDS schemes are dependent upon a large number of factors, such as soil type, groundwater vulnerability, design criteria / features, access, space requirements, location, system size, etc. Many of these factors are site specific and therefore generalisation about costs can be problematic and includes high levels of uncertainty.
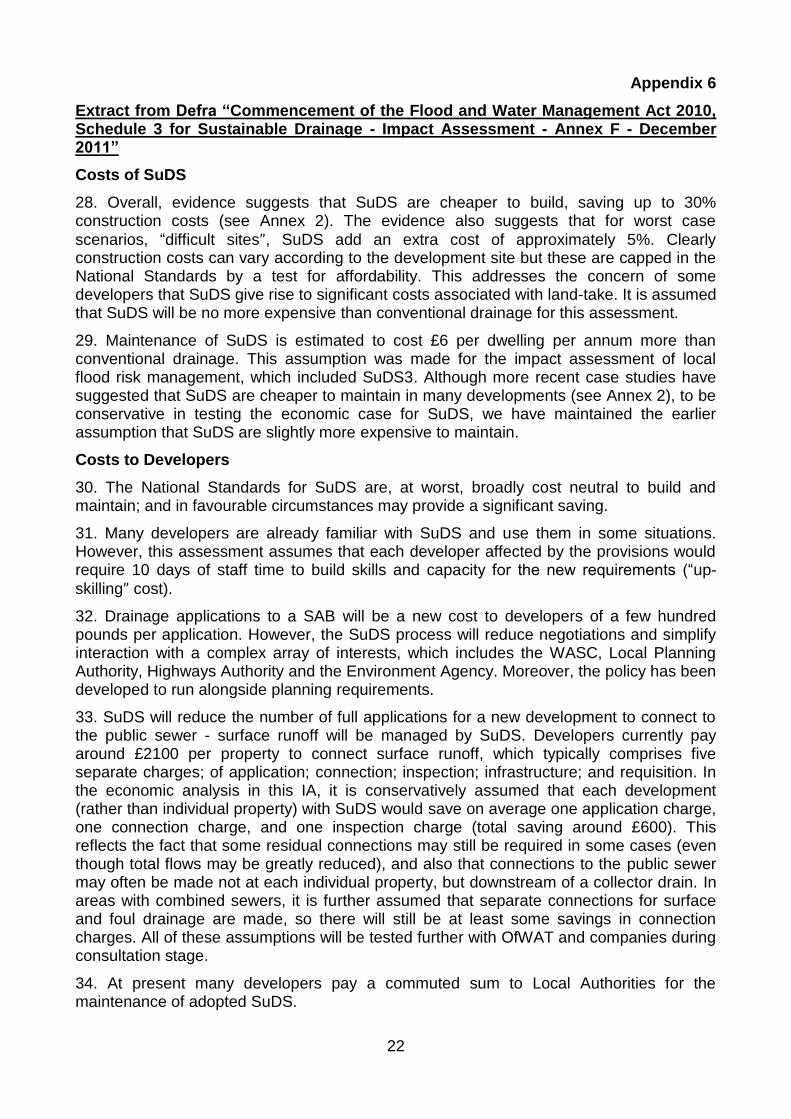
Furthermore, an assessment of the costs of SuDS was undertaken by Defra, in December 2011 (Commencement of the Flood and Water Management Act 2010, Schedule 3 for Sustainable Drainage - Impact Assessment, Annex F extract (from page 21) attached at Appendix 6), which recognised that the cost of SuDS, to provide the same performance criteria as traditional drainage, are much lower. Defra also noted, from case study
7
examples, that overall evidence suggests SuDS may be up to 30% cheaper to construct, albeit challenging sites can be 5% more expensive to construct than traditional drainage.
https://www.gov.uk/government/uploads/system/uploads/attachment_data/file/82428/suds-consult-annexf-ia-111220.pdf
Therefore, the Council considers that SuDS should not be added as a development cost in the AHVSU as suggested by the HBF. Indeed, the Defra evidence shows that use of SuDS is more likely to be a cost saving, especially when their use becomes more widespread. However, the Council is not seeking a reduction in the exceptional development costs in the AHVSU at the current time as a result; rather it notes that the use of SuDS could counter the costs of any ‘abnormal abnormals’ if sites are tested for viability as part of a planning application. Other Section 106 Contributions - The costs of other S106 contributions have not been challenged. However, from housing sites developed or permitted from 2006 in Torfaen, it is noted that whilst recreation and open space contributions are secured on the majority of eligible sites, several sites have been fully exempted and even more did not provide for either children’s play or adult recreation, especially where there is an adequate level of facilities in the local area. Similarly, very few transport contributions (13 in total) and even less biodiversity contributions (only 2) have been made. Therefore, there is high likelihood that the £500 allowed for transport contributions and £500 allowed for biodiversity contributions may not be payable at all; which represents a saving of at least £1,000 per dwelling on most sites and the potential to save up to a further £1,868 per dwelling if recreational or public open space contributions are not made. Educational Section 106 Contributions - Based upon the Council’s ‘Implementation of CIL on Site Delivery’ table at Appendix 2 of its ‘Housing / Affordable Housing’ Examination Statement (ED21, pages 12-15), which lists ‘Likely S106 Requirements’ and potential ‘Pooling Implications’ that includes ‘Education’ on most housing sites, the HBF consider that the AHVSU should include a cost of at least £2,000 per dwelling for education provision as standard.
With hindsight, it may have been better to use the phase ‘Potential S106 Requirement’ rather than ‘Likely S106 Requirement’ in the table at Appendix 2 of ED21. As the reality is that the likelihood of educational contributions being required on sites, other than the very large South Sebastopol SAA6 and Mamhilad SAA4, is very low, as explained below. A similar point can be made for the other S106 requirements listed in the table. The table mainly served to illustrate all potential S106 obligations that could be asked for and the implications for ‘pooling’ if that was the case.
Indeed, of the 1,155 dwellings built within Torfaen between 1st January 2006 and 1st April 2012 or the 674 dwellings permitted on large sites (of 10 or more dwellings) to 19th March 2013 (total of 1,829 dwellings), the Council has only received educational contributions on 2 sites: -
1. The 213 dwellings, Persimmon Homes, Avesta Steelworks South (Phase 2) site in Griffithstown, where the Council requested on-site land for a primary school site in lieu of affordable housing - in this case there was capacity in local primary schools to accommodate the educational needs generated by the site; and
2. The 67 dwellings, Redrow Homes, Newport Road, New Inn site - where Redrow Homes offered £58,900, in a unilateral undertaking, to cover the educational needs generated by their site (67 dwellings x 0.29 (the Torfaen primary school place generation rate per dwelling from SD84, Annex 3, page iii)) of 19 primary school places x £3,100 per dwelling school refurbishment costs). - It should be noted that this was the
8
refurbishment cost of £3,100 per school place rather than the new build cost of £9,300 per school place used in the HBF AHVSU.
It is recognised that the Council has signed a S106 Agreement for the South Sebastopol site (690 dwellings with the Plan period; 1,200 overall), which includes financial payments for educational provision. Similarly, the Mamhilad SAA4 will be expected to provide a primary school to serve the site (690 dwellings within the Plan period; 1,700 overall).
It should also be noted that under the Council’s adopted Planning Obligations SPG (SD84, page 10 & Annex 3, pages i-ii) the Council would only seek educational facilities on large sites of 10 or more dwellings and makes exceptions for 1 bed dwellings, elderly persons accommodation, care / rest / nursing homes, hostels and student flats on the basis that such developments are unlikely to house children of school age.
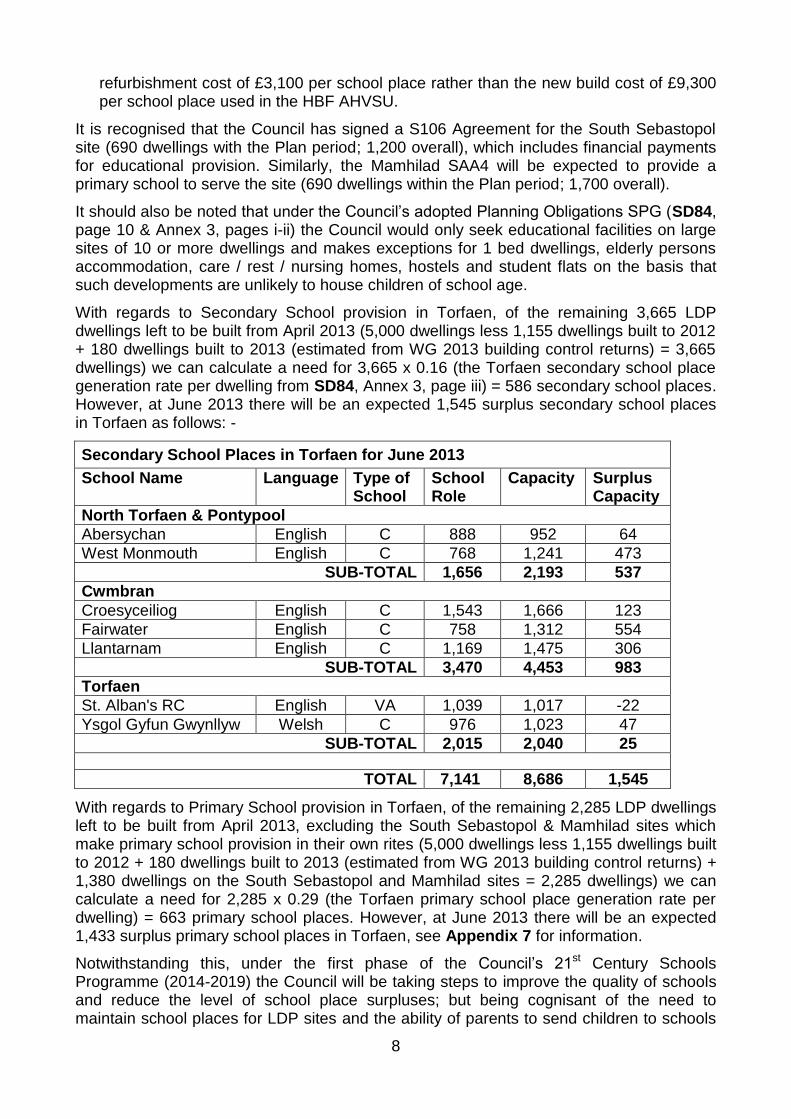
With regards to Secondary School provision in Torfaen, of the remaining 3,665 LDP dwellings left to be built from April 2013 (5,000 dwellings less 1,155 dwellings built to 2012 + 180 dwellings built to 2013 (estimated from WG 2013 building control returns) = 3,665 dwellings) we can calculate a need for 3,665 x 0.16 (the Torfaen secondary school place generation rate per dwelling from SD84, Annex 3, page iii) = 586 secondary school places. However, at June 2013 there will be an expected 1,545 surplus secondary school places in Torfaen as follows: -
Secondary School Places in Torfaen for June 2013
School Name Language Type of School
School Role
Capacity Surplus Capacity
North Torfaen & Pontypool
Abersychan English C 888 952 64
West Monmouth English C 768 1,241 473
SUB-TOTAL 1,656 2,193 537
Cwmbran
Croesyceiliog English C 1,543 1,666 123
Fairwater English C 758 1,312 554
Llantarnam English C 1,169 1,475 306
SUB-TOTAL 3,470 4,453 983
Torfaen
St. Alban's RC English VA 1,039 1,017 -22
Ysgol Gyfun Gwynllyw Welsh C 976 1,023 47
SUB-TOTAL 2,015 2,040 25
TOTAL 7,141 8,686 1,545
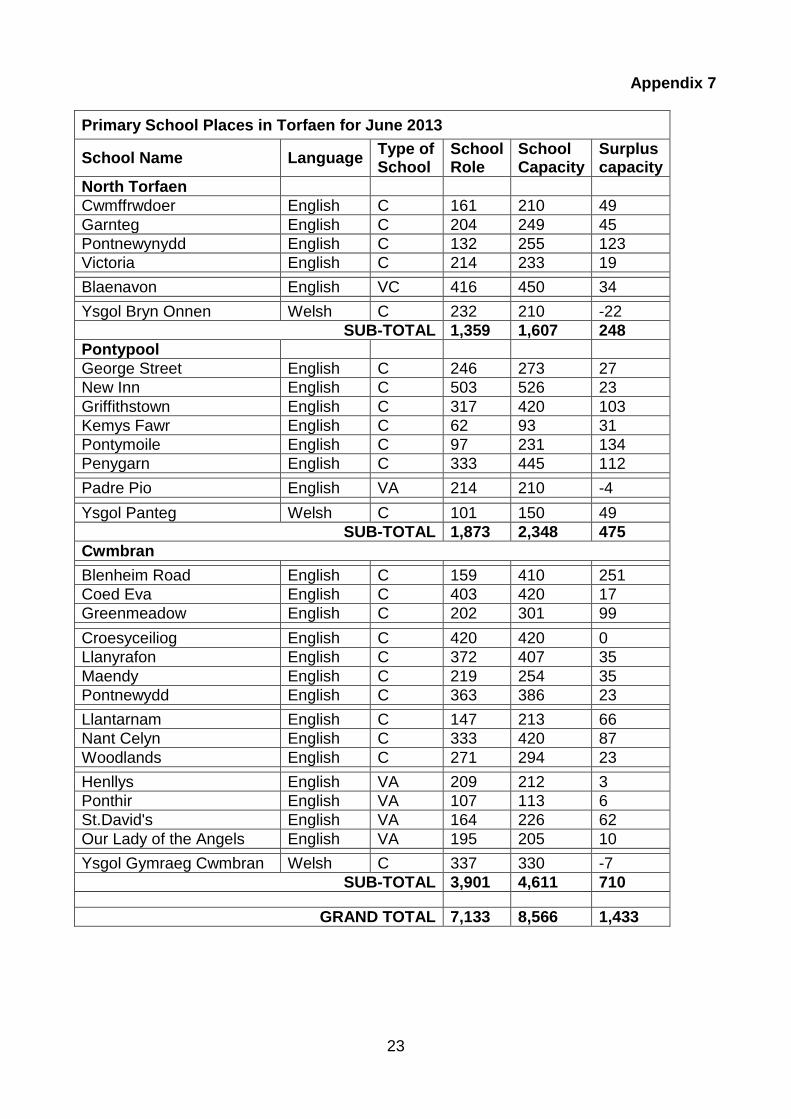
With regards to Primary School provision in Torfaen, of the remaining 2,285 LDP dwellings left to be built from April 2013, excluding the South Sebastopol & Mamhilad sites which make primary school provision in their own rites (5,000 dwellings less 1,155 dwellings built to 2012 + 180 dwellings built to 2013 (estimated from WG 2013 building control returns) + 1,380 dwellings on the South Sebastopol and Mamhilad sites = 2,285 dwellings) we can calculate a need for 2,285 x 0.29 (the Torfaen primary school place generation rate per dwelling) = 663 primary school places. However, at June 2013 there will be an expected 1,433 surplus primary school places in Torfaen, see Appendix 7 for information.
Notwithstanding this, under the first phase of the Council’s 21st Century Schools Programme (2014-2019) the Council will be taking steps to improve the quality of schools and reduce the level of school place surpluses; but being cognisant of the need to maintain school places for LDP sites and the ability of parents to send children to schools
9
out of their home catchment. So far, Pontymoile Primary School is programmed for closure in September 2013 with the loss of 231 primary school places; with the 97 pupils going to predominantly George Street Primary and New Inn Primary Schools. In addition, there are three new primary schools currently proposed which provide the capacity for an additional 487 surplus primary school places, as follows:-
1. Avesta Steelworks South, Pontypool - new 420 place Welsh medium school to replace the existing 150 place Ysgol Panteg school in Griffithstown;
2. Blenheim Road, Cwmbran - remodelled 420 place school to replace the existing 410 place Blenheim Road school; and
3. Llantarnam, Cwmbran - new 420 place school to replace the existing Oakfield / Llantarnam 213 place school.
Therefore, it can be seen that based upon the evidence of past planning permissions and existing & future school place surpluses, the need for an educational contribution on LDP housing sites is and will be the exception rather than the norm. Therefore, the AHVSU should not include an educational provision as standard as suggested by the HBF. This matter can only be considered on a case by case basis, depending on the need generated by the site and the level of surplus school places in the area when the planning application is determined; noting that the cheaper school refurbishment cost (of £899 per dwelling) may be charged in any event. Value of Socially Rented Affordable Housing Units - There is consensus that the latest WG Acceptable Cost Guidance (ACG) values from August 2012 should be used to base the sum paid by RSLs for the 2/3rds socially rented affordable housing units. Value of Intermediate Affordable Housing Units - The HBF assert (ED26, page 1) that as there is no ‘Homebuy’ scheme in operation in Wales the revenue from this source should be removed from the AHVSU. However, the term ‘Homebuy’ in the DAT is a generic term for ‘Intermediate Purchase’ affordable homes. Indeed, the Council’s adopted Planning Obligations SPG (SD84, Annex 1 page iv) clearly states that the RSLs will pay 50% of Market Value (MV) for the 1/3rd intermediate affordable housing units (under the Council’s intermediate purchase ‘Help2Own’ scheme) which is the current practice. Therefore, it is only correct for this developer revenue source to be taken into account in the DAT. Costs of Fire Suppression Systems - There is consensus on the costs (£3,075 for a house and £879 for a flat) to be used in the AHVSU for the potential introduction of automatic fire suppression systems (sprinklers) in April 2014. However, the Welsh Government are currently consulting on the implementation of the associated Regulations and if they should be applied to dwellings and flats; noting that there is considerable opposition to their introduction for these types of residences. Furthermore, the Council notes that much cheaper mist systems could be used in the future; economies of scale can give up to a 30% saving on these costs; and installation costs should reduce as more systems are installed by local contractors rather than specialist installers. Costs of Energy Efficiency Improvements - There is consensus on the costs (£4,200 per dwelling) of the potential introduction of up to 40% energy efficiency improvements under a revised Part L of the Building Regulations in 2015. Albeit timescales for its introduction or the level of energy efficiency improvements (which could alternatively be set at 25%) have not yet been decided by WG.
10
Conclusions In the HBF AHVSU (ED107), the Council has shown that the HBF’s testing assumptions would result in no affordable housing being provided in Torfaen, indeed, no residential development would be viable anywhere in the County Borough. Therefore, all the LDP housing allocations would be undeliverable; thus making the LDP unsound.
Similarly, the HBF’s testing assumptions are weighted unfairly in favour of the development industry and land owners, at the expense of meeting housing requirements or making Section 106 planning obligations that either make the development of a housing site acceptable or provide essential facilities to serve their residents.
The HBF have entirely failed to show that land supply is being held back by viability and the affordable housing and Section 106 process. On the contrary, it is clear that landowners are releasing housing land and developers are building or bringing forward housing sites whilst meeting the Council’s affordable housing policy and SPG requirement as proposed by the LDP.
The Council has also shown that all of the HBF testing assumptions are either incorrect or overstated and that the Council’s testing assumptions are both reasonable and appropriate.
New house prices, rather than being lower than they were in October 2010, are actually 3.0% higher; and as a result, the impact of the WG’s introduction of both fire suppression systems and energy efficiency improvements would be negated throughout all of Torfaen.
Therefore, the Council considers that its AHVSU is still valid in determining the strategic affordable housing and S106 policies of the LDP, which should remain unchanged as a result.
11
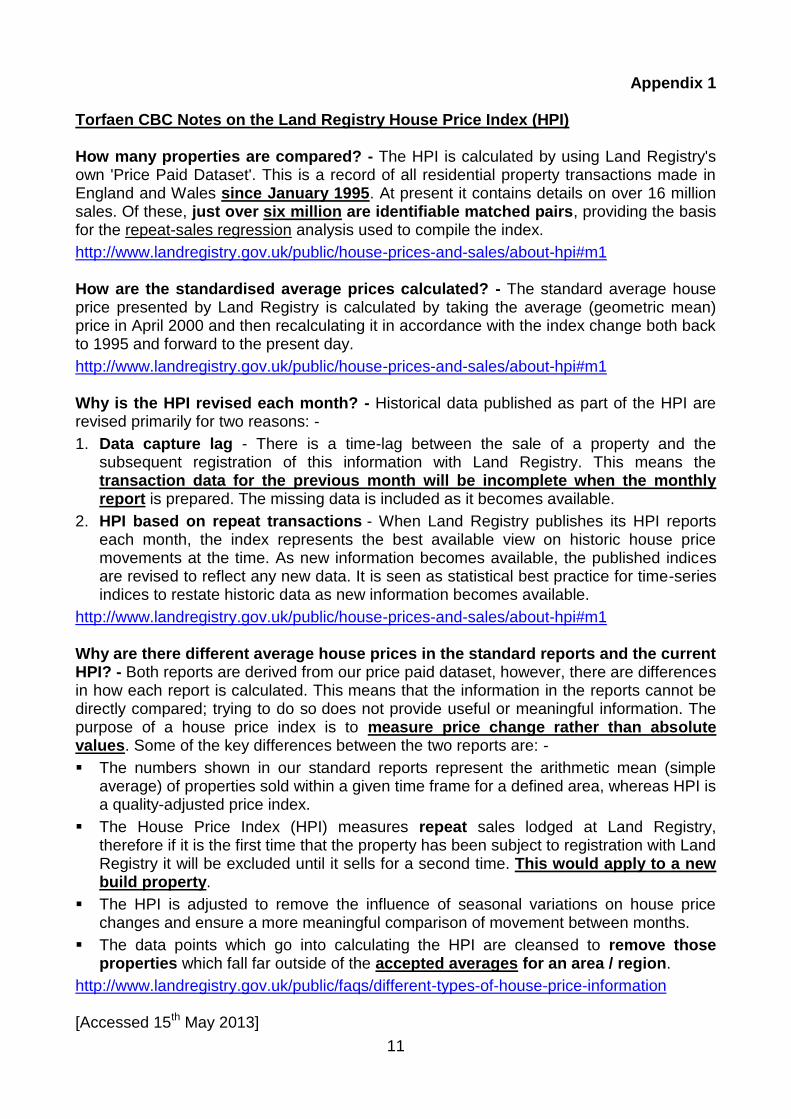
Appendix 1 Torfaen CBC Notes on the Land Registry House Price Index (HPI) How many properties are compared? - The HPI is calculated by using Land Registry's own 'Price Paid Dataset'. This is a record of all residential property transactions made in England and Wales since January 1995. At present it contains details on over 16 million sales. Of these, just over six million are identifiable matched pairs, providing the basis for the repeat-sales regression analysis used to compile the index.
http://www.landregistry.gov.uk/public/house-prices-and-sales/about-hpi#m1 How are the standardised average prices calculated? - The standard average house price presented by Land Registry is calculated by taking the average (geometric mean) price in April 2000 and then recalculating it in accordance with the index change both back to 1995 and forward to the present day.
http://www.landregistry.gov.uk/public/house-prices-and-sales/about-hpi#m1 Why is the HPI revised each month? - Historical data published as part of the HPI are revised primarily for two reasons: -
1. Data capture lag - There is a time-lag between the sale of a property and the subsequent registration of this information with Land Registry. This means the transaction data for the previous month will be incomplete when the monthly report is prepared. The missing data is included as it becomes available.
2. HPI based on repeat transactions - When Land Registry publishes its HPI reports each month, the index represents the best available view on historic house price movements at the time. As new information becomes available, the published indices are revised to reflect any new data. It is seen as statistical best practice for time-series indices to restate historic data as new information becomes available.
http://www.landregistry.gov.uk/public/house-prices-and-sales/about-hpi#m1 Why are there different average house prices in the standard reports and the current HPI? - Both reports are derived from our price paid dataset, however, there are differences in how each report is calculated. This means that the information in the reports cannot be directly compared; trying to do so does not provide useful or meaningful information. The purpose of a house price index is to measure price change rather than absolute values. Some of the key differences between the two reports are: -
The numbers shown in our standard reports represent the arithmetic mean (simple average) of properties sold within a given time frame for a defined area, whereas HPI is a quality-adjusted price index.
The House Price Index (HPI) measures repeat sales lodged at Land Registry, therefore if it is the first time that the property has been subject to registration with Land Registry it will be excluded until it sells for a second time. This would apply to a new build property.
The HPI is adjusted to remove the influence of seasonal variations on house price changes and ensure a more meaningful comparison of movement between months.
The data points which go into calculating the HPI are cleansed to remove those properties which fall far outside of the accepted averages for an area / region.
http://www.landregistry.gov.uk/public/faqs/different-types-of-house-price-information [Accessed 15th May 2013]
12
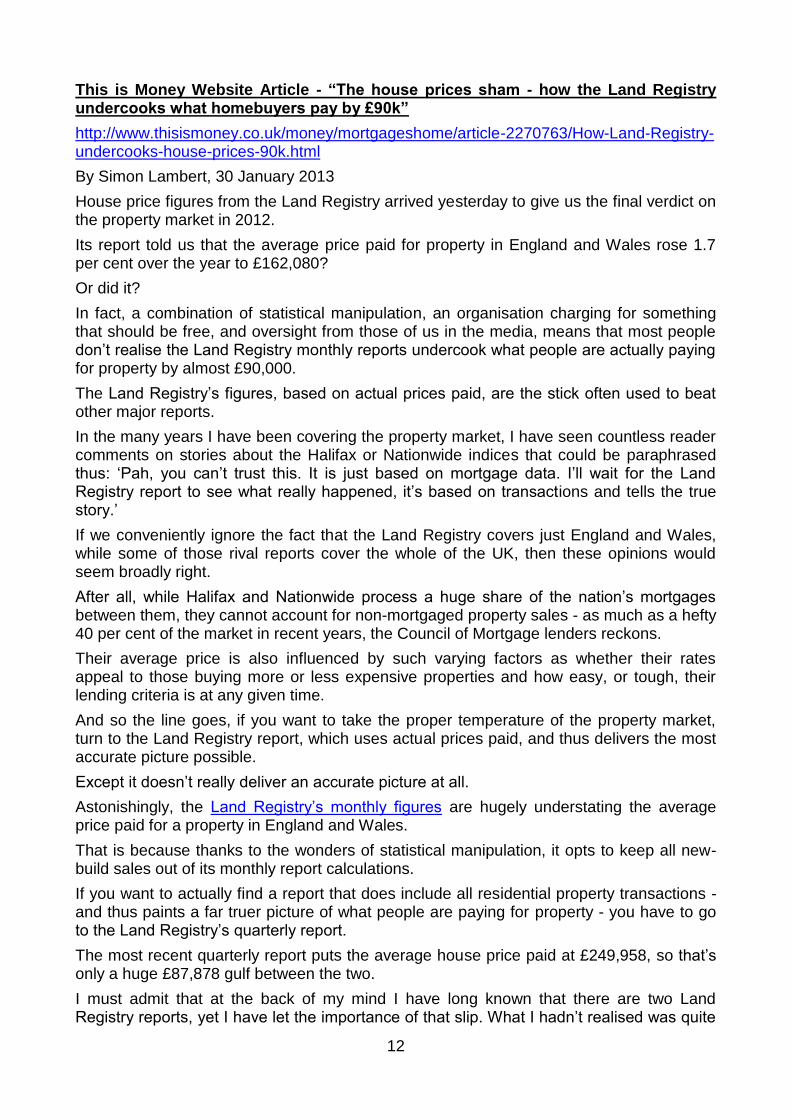
This is Money Website Article - “The house prices sham - how the Land Registry undercooks what homebuyers pay by £90k”
http://www.thisismoney.co.uk/money/mortgageshome/article-2270763/How-Land-Registry-undercooks-house-prices-90k.html
By Simon Lambert, 30 January 2013
House price figures from the Land Registry arrived yesterday to give us the final verdict on the property market in 2012.
Its report told us that the average price paid for property in England and Wales rose 1.7 per cent over the year to £162,080?
Or did it?
In fact, a combination of statistical manipulation, an organisation charging for something that should be free, and oversight from those of us in the media, means that most people don’t realise the Land Registry monthly reports undercook what people are actually paying for property by almost £90,000.
The Land Registry’s figures, based on actual prices paid, are the stick often used to beat other major reports.
In the many years I have been covering the property market, I have seen countless reader comments on stories about the Halifax or Nationwide indices that could be paraphrased thus: ‘Pah, you can’t trust this. It is just based on mortgage data. I’ll wait for the Land Registry report to see what really happened, it’s based on transactions and tells the true story.’
If we conveniently ignore the fact that the Land Registry covers just England and Wales, while some of those rival reports cover the whole of the UK, then these opinions would seem broadly right.
After all, while Halifax and Nationwide process a huge share of the nation’s mortgages between them, they cannot account for non-mortgaged property sales - as much as a hefty 40 per cent of the market in recent years, the Council of Mortgage lenders reckons.
Their average price is also influenced by such varying factors as whether their rates appeal to those buying more or less expensive properties and how easy, or tough, their lending criteria is at any given time.
And so the line goes, if you want to take the proper temperature of the property market, turn to the Land Registry report, which uses actual prices paid, and thus delivers the most accurate picture possible.
Except it doesn’t really deliver an accurate picture at all.
Astonishingly, the Land Registry’s monthly figures are hugely understating the average price paid for a property in England and Wales.
That is because thanks to the wonders of statistical manipulation, it opts to keep all new-build sales out of its monthly report calculations.
If you want to actually find a report that does include all residential property transactions - and thus paints a far truer picture of what people are paying for property - you have to go to the Land Registry’s quarterly report.
The most recent quarterly report puts the average house price paid at £249,958, so that’s only a huge £87,878 gulf between the two.
I must admit that at the back of my mind I have long known that there are two Land Registry reports, yet I have let the importance of that slip. What I hadn’t realised was quite
13
how big the gap between the two had got and along with most others in the property media I have been remiss in not highlighting this anomaly.
And one of the primary reasons why I haven’t been keeping tabs on quarterly figures is that, as part of improvements to the Land Registry’s service, the quarterly report stopped being free some time ago - and not even us journalists can access the data without paying.
There is a big question here as to whether any public organisation should be charging for crucial statistics, such as those that provide the broadest snapshot of the property market that the nation’s economy is propped up by.
But there is an even more serious issue in that the Land Registry will not even provide free access to the data to journalists. This is something that the Council of Mortgage Lenders is happy to do with its figures, for example, and most private businesses will do for reports that they usually charge for.
The big difference between the two sets of Land Registry was drawn to my attention when I was writing on how stamp duty bills are due to hit £7,500 for the average homebuyer (with figures kindly supplied by property investment specialist London Central Portfolio).
That reflection on how heavy a burden stamp duty is imposing on homebuyers - it being the main contender for Britain’s most unfairly constructed tax - highlights just one reason why these quarterly figures are important.
Of course, I am not suggesting the Land Registry is trying in any way to deceive people. It gives a statistical justification for excluding new builds, based on an 'apples-for-apples' index comparison.
But new-build homes are hardly a niche market, completion figures show them as roughly 20 per cent of the total market. No official index claiming to put a value on the average house price should be excluding them.
In my view that makes the fanfare that surrounds the monthly report and the average price figure within it a sham.
This is Money reader, Tony, commented on the gap in on our stamp duty report and summed up the situation nicely. He said: ‘May I suggest that where the Land Registry proudly tells us 'Our House Price Index is the most accurate independent house price index available', that it adds the caveat: 'By this we mean our quarterly index (which includes new-build sales, and which you need to pay for) and NOT our free monthly index, which currently only gives you an average sale price of 160k, some 36% below the true figure of 250k.
'Apologies to all the public, industry and property professionals for any misunderstanding you may have had over all these years'.
Luckily for those wanting to check up on the Land Registry quarterly figures for free, the BBC publishes a snapshot of them every three months. You can find them here.
And rest assured, from now on This is Money will be following the gap between the quarterly and monthly data closely.”
14
BBC Website Provided Land Registry Quarterly Report for Torfaen
http://news.bbc.co.uk/1/shared/spl/hi/in_depth/uk_house_prices/html/houses.stm
15
Appendix 2 Torfaen New House Prices Feb 2012 - Feb 2013 Pontypool HSMA
Newport Road, New Inn
Plot House Type Beds Size (m) Price Price/Metre Asking Price
Warwick 3BD 95.87 £219,995 £2,294.72 Feb-13
Harrogate 4BD 140.34 £319,995 £2,280.14 Feb-13
Asking Price less 5%
Warwick 3BD 95.87 £208,995 £2,179.99
Harrogate 4BD 140.34 £303,995 £2,166.13
Parc Panteg, Griffithstown
Plot Type Beds Size (m) Price Price/Metre Date
32 Whitmore 4BD 134.06 £245,000 £1,827.54 Mar-12
72 Whitmore 4BD 134.06 £232,000 £1,730.57 Jun-12
77 Whitmore 4BD 134.06 £246,000 £1,835.00 Feb-12
78 Whitmore 4BD 134.06 £241,000 £1,797.70 Jun-12
79 Whitmore 4BD 134.06 £249,994 £1,864.79 Jul-12
80 Southerndown 4BD 165.09 £300,000 £1,817.19 Feb-12
81 Whitmore 4BD 134.06 £249,995 £1,864.80 May-12
82 Whitmore 4BD 134.06 £241,000 £1,797.70 Jul-12
83 Newgale 4BD 120.03 £220,000 £1,832.88 May-12
84 Newgale 4BD 120.03 £225,000 £1,874.53 Jun-12
86 Whitmore 4BD 134.06 £235,000 £1,752.95 Jun-12
88 Lavernock 4BD 145.30 £272,000 £1,871.99 Oct-12
102 Southerndown 4BD 165.09 £305,000 £1,847.48 Nov-12
103 Rhossili 3BD 91.70 £180,000 £1,963.03 Jun-12
149 Conway 3BT 73.77 £140,000 £1,897.79 Sep-12
150 Conway 3BT 73.77 £138,000 £1,870.68 Sep-12
152 Clwyd 2BS 59.46 £126,995 £2,135.81 Jun-12
153 Clwyd 2BS 59.46 £120,000 £2,018.16 Aug-12
154 Conway 3BS 73.77 £154,000 £2,087.57 Jun-12
158 Ebbw 3BD 88.26 £170,000 £1,926.13 Jun-12
159 Clwyd 2BS 59.46 £124,995 £2,102.17 May-12
160 Clwyd 2BT 59.46 £119,995 £2,018.08 May-12
162 Ebbw 3BD 88.26 £175,000 £1,982.78 May-12
168 Conway 3BS 73.77 £168,000 £2,277.35 Feb-12
169 Conway 3BS 73.77 £140,000 £1,897.79 Feb-12
170 Ebbw 3BD 88.26 £178,000 £2,016.77 Feb-12
174 Taff 4BD 117.43 £217,995 £1,856.38 Apr-12
175 Taff 4BD 117.43 £215,000 £1,830.88 Apr-12
176 Clwyd 2BS 59.46 £124,995 £2,102.17 Mar-12
178 Conway 3BS 73.77 £145,000 £1,965.57 May-12
16
179 Conway 3BT 73.77 £135,000 £1,830.01 May-12
180 Conway 3BT 73.77 £135,000 £1,830.01 Apr-12
181 Conway 3BS 73.77 £142,000 £1,924.90 Apr-12
182 Conway 3BS 73.77 £142,000 £1,924.90 May-12
183 Conway 3BS 73.77 £140,000 £1,897.79 May-12
199 Clwyd 2BS 59.46 £128,995 £2,169.44 Aug-12
200 Clwyd 2BT 59.46 £120,995 £2,034.90 Aug-12
201 Clwyd 2BS 59.46 £125,000 £2,102.25 Sep-12
202 Clwyd 2BS 59.46 £126,995 £2,135.81 Jul-12
203 Conway 3BT 73.77 £145,000 £1,965.57 Jul-12
204 Conway 3BT 73.77 £135,000 £1,830.01 Jul-12
205 Clwyd 2BS 59.46 £126,995 £2,135.81 Jul-12
206 Ebbw 3BD 88.26 £180,000 £2,039.43 May-12
207 Conway 3BS 73.77 £144,000 £1,952.01 Aug-12
209 Ebbw 3BD 88.26 £160,000 £1,812.83 Apr-12
Summary
Beds Size (M) Price Price/Metre Newport Rd, New Inn
3BD 95.87 £208,995 £2,179.99
4BD 140.34 £303,995 £2,166.13
Parc Panteg (Average)
2BT 59.46 £120,495 £2,026.49 3BT 73.77 £138,000 £1,870.68 2BS 59.46 £125,621 £2,112.70 3BS 73.77 £143,857 £1,950.08 3BD 88.95 £176,600 £1,985.63 4BD 134.86 £246,332 £1,826.82
Beds Size (M) Oct-10 Feb-13 £ Diff % Diff
1 Bed Flats 55.0 £90,000 2 Bed Flats 65.0 £115,000 2 Bed Terraces 65.0 £135,000 £131,722 -£3,278 -2.4%
3 Bed Terraces 90.0 £155,000 £168,361 £13,361 8.6%
4 Bed Terraces 110.0 £198,000 3 Bed Semis 85.0 £160,000 £165,757 £5,757 3.6%
4 Bed Semis 115.0 £204,000 3 Bed Detached 85.0 £190,000 £177,039 £12,961 6.8%
4 Bed Detached 130.0 £225,000 £259,542 £34,542 15.4%
5 Bed Detached 150.0 £275,000
£865,000 £902,420 £37,420 4.1%
17
Cwmbran South & East HSMA
Hollybush Square, Hollybush
Plot House Type Beds Size (m) Asking Price Price/Metre Date
16 Loughor 4BD 110.28 £225,000 £2,040.26 Feb-13
18 Oxwich 4BD 105.35 £214,995 £2,040.77 Feb-13
19 Oxwich 4BD 105.35 £214,995 £2,040.77 Feb-13
22 Ogwr 4BD 112.41 £299,995 £2,668.76 Feb-13
29 Cothi 3BD 75.62 £180,000 £2,380.32 Feb-13
30 Ogwr 4BD 112.41 £299,995 £2,668.76 Feb-13
31 Ogwr 4BD 112.41 £299,995 £2,668.76 Feb-13
3BD 75.62 £180,000 £2,380.32
4BD 109.70 £259,163 £2,354.68
Asking Price less 5% (Average)
3BD 75.62 £171,000 £2,261.31
4BD 109.70 £246,775 £2,249.54
St Joseph’s Meadow, Llantarnam
Plot House Type Beds Size (m)
Price Price/Metre Date
66 Maidstone 3BS 77.30 £160,000 £2,069.99 Feb-12
70 Maidstone 3BS 77.30 £179,995 £2,328.68 Mar-12
75 Maidstone 3BS 77.30 £164,995 £2,134.61 Jun-12
76 Maidstone 3BS 77.30 £170,000 £2,199.37 Aug-12
Summary
Beds Size (M) Price Price/Metre Hollybush Square, Hollybush (Average)
3BD 75.62 £171,000 £2,261.31
4BD 109.70 £246,775 £2,249.54
St Joseph’s Meadow, Llantarnam (Average)
3BS 77.30 £168,748 £2,183.16
Beds Size (M) Oct-10 Feb-13 £ Diff % Diff
1 Bed Flats 55.0 £121,000
2 Bed Flats 65.0 £143,000
2 Bed Terraces 65.0 £143,000
3 Bed Terraces 90.0 £198,000
4 Bed Terraces 110.0 £242,000
3 Bed Semis 85.0 £187,000 £2,183.16 £185,569 -£1,431 -0.8%
4 Bed Semis 115.0 £253,000
3 Bed Detached 85.0 £198,000 £2,261.31 £202,327 £4,327 2.2%
4 Bed Detached 130.0 £286,000 £2,249.54 £306,108 £20,108 7.0%
5 Bed Detached 150.0 £330,000
£671,000 £694,004 £23,004 3.3%
18
Appendix 3 House Prices in Torfaen’s Four Housing Sub Market Areas North Torfaen
House Type Size (m2)
AHVS Oct-10
TCBC Oct-12
HBF Feb-13
TCBC Feb-13
TCBC Oct12-Feb13
1 Bed Flats 55.0 £75,000 £72,600 £66,019 £77,250 +£4,650
2 Bed Flats 65.0 £95,000 £91,960 £83,624 £97,850 +£5,890
2 Bed Terraces 65.0 £115,000 £111,320 £101,229 £118,450 +£7,130
3 Bed Terraces 90.0 £130,000 £125,840 £114,433 £133,900 +£8,060
4 Bed Terraces 110.0 £165,000 £159,720 £145,241 £169,950 +£10,230
3 Bed Semis 85.0 £135,000 £130,680 £118,834 £139,050 +£8,370
4 Bed Semis 115.0 £170,000 £164,560 £149,643 £175,100 +£10,540
3 Bed Detached 85.0 £160,000 £154,880 £140,840 £164,800 +£9,920
4 Bed Detached 130.0 £187,000 £181,016 £164,607 £192,610 +£11,594
5 Bed Detached 150.0 £220,000 £212,960 £193,655 £226,600 +£13,640
Pontypool
House Type Size (m2)
AHVS Oct-10
TCBC Oct-12
HBF Feb-13
TCBC Feb-13
TCBC Oct12-Feb13
1 Bed Flats 55.0 £90,000 £87,120 £79,223 £92,700 +£5,580
2 Bed Flats 65.0 £115,000 £111,320 £101,229 £118,450 +£7,130
2 Bed Terraces 65.0 £135,000 £130,680 £118,834 £139.050 +£8,370
3 Bed Terraces 90.0 £155,000 £150,040 £136,439 £159,650 +£9,610
4 Bed Terraces 110.0 £198,000 £191,664 £174,290 £203.940 +£12,276
3 Bed Semis 85.0 £160,000 £154,880 £140,840 £164,800 +£9,920
4 Bed Semis 115.0 £204,000 £197,472 £179,571 £210,120 +£12,648
3 Bed Detached 85.0 £190,000 £183,920 £167,248 £195,700 +£11,780
4 Bed Detached 130.0 £225,000 £217,800 £198,056 £231,750 +£13,950
5 Bed Detached 150.0 £275,000 £266,200 £242,069 £283,250 +£17,050
Cwmbran - North & West
House Type Size (m2)
AHVS Oct-10
TCBC Oct-12
HBF Feb-13
TCBC Feb-13
TCBC Oct12-Feb13
1 Bed Flats 55.0 £85,000 £82,280 £74,821 £87,550 +£5,270
2 Bed Flats 65.0 £110,000 £106,480 £96,828 £113,300 +£6,820
2 Bed Terraces 65.0 £130,000 £125,840 £114,433 £133,900 +£8,060
3 Bed Terraces 90.0 £145,000 £140,360 £127,634 £149,350 +£8,990
4 Bed Terraces 110.0 £190,000 £183,920 £167,248 £195,700 +£11,780
3 Bed Semis 85.0 £150,000 £145,200 £132,038 £154,500 +£9,300
4 Bed Semis 115.0 £194,000 £187,792 £170,769 £199,820 +£12,028
3 Bed Detached 85.0 £185,000 £179,080 £162,846 £190,550 +£11,470
4 Bed Detached 130.0 £210,000 £203,280 £184,000 £216,300 +£13,020
5 Bed Detached 150.0 £260,000 £251,680 £228,865 £267,800 +£16,120
19
Cwmbran - South & East
House Type Size (m2)
AHVS Oct-10
TCBC Oct-12
HBF Feb-13
TCBC Feb-13
TCBC Oct12-Feb13
1 Bed Flats 55.0 £121,000 £117,128 £106,510 £124,650 +£7,522
2 Bed Flats 65.0 £143,000 £138,424 £125,876 £147,290 +£8,866
2 Bed Terraces 65.0 £143,000 £138,424 £125,876 £147,290 +£8,866
3 Bed Terraces 90.0 £198,000 £191,664 £174,290 £203,940 +£12,276
4 Bed Terraces 110.0 £242,000 £234,256 £213,021 £249,260 +£15,004
3 Bed Semis 85.0 £187,000 £181,016 £164,607 £192,610 +£11,594
4 Bed Semis 115.0 £253,000 £244,904 £222,704 £260,590 +£15,686
3 Bed Detached 85.0 £198,000 £191,664 £174,290 £203,940 +£12,276
4 Bed Detached 130.0 £286,000 £276,848 £251,752 £294,580 +£17,732
5 Bed Detached 150.0 £330,000 £319,440 £290,483 £339,900 +£20,460
20
Appendix 4 TCBC - Revised TCBC AHVSU - May 2013 North Torfaen
House Type Size (m2)
TCBC Feb-13
1 Bed Flats 55.0 £77,250
2 Bed Flats 65.0 £97,850
2 Bed Terraces 65.0 £118,450
3 Bed Terraces 90.0 £133,900
4 Bed Terraces 110.0 £169,950
3 Bed Semis 85.0 £139,050
4 Bed Semis 115.0 £175,100
3 Bed Detached 85.0 £164,800
4 Bed Detached 130.0 £192,610
5 Bed Detached 150.0 £226,600
Pontypool
House Type Size (m2)
TCBC Feb-13
1 Bed Flats 55.0 £92,700
2 Bed Flats 65.0 £118,450
2 Bed Terraces 65.0 £139.050
3 Bed Terraces 90.0 £159,650
4 Bed Terraces 110.0 £203.940
3 Bed Semis 85.0 £164,800
4 Bed Semis 115.0 £210,120
3 Bed Detached 85.0 £195,700
4 Bed Detached 130.0 £231,750
5 Bed Detached 150.0 £283,250
Cwmbran - North & West
House Type Size (m2)
TCBC Feb-13
1 Bed Flats 55.0 £87,550
2 Bed Flats 65.0 £113,300
2 Bed Terraces 65.0 £133,900
3 Bed Terraces 90.0 £149,350
4 Bed Terraces 110.0 £195,700
3 Bed Semis 85.0 £154,500
4 Bed Semis 115.0 £199,820
3 Bed Detached 85.0 £190,550
4 Bed Detached 130.0 £216,300
5 Bed Detached 150.0 £267,800
Cwmbran - South & East
House Type Size (m2)
TCBC Feb-13
1 Bed Flats 55.0 £124,650
2 Bed Flats 65.0 £147,290
2 Bed Terraces 65.0 £147,290
3 Bed Terraces 90.0 £203,940
4 Bed Terraces 110.0 £249,260
3 Bed Semis 85.0 £192,610
4 Bed Semis 115.0 £260,590
3 Bed Detached 85.0 £203,940
4 Bed Detached 130.0 £294,580
5 Bed Detached 150.0 £339,900
DAT Testing Results
Assessment of Fire Suppression Measures and 40% Energy Efficiency Improvements (no grant) - Residual Values in £s million per hectare
30dph 0% 5% 10% 15% 20% 25% 30% 35%
North Torfaen 0.480 0.357 0.232 0.107 -0.016 - - -
Cwmbran North & West 1.106 0.957 0.807 0.658 0.510 0.360 0.211 0.060
Pontypool 1.390 1.231 1.069 0.909 0.750 0.587 0.428 0.266
Cwmbran South & East 2.448 2.247 2.045 1.841 1.637 1.435 1.235 1.033
21
Appendix 5 HBF - DAT Development Costs Page
22
Appendix 6
Extract from Defra “Commencement of the Flood and Water Management Act 2010, Schedule 3 for Sustainable Drainage - Impact Assessment - Annex F - December 2011”
Costs of SuDS
28. Overall, evidence suggests that SuDS are cheaper to build, saving up to 30% construction costs (see Annex 2). The evidence also suggests that for worst case
scenarios, “difficult sites”, SuDS add an extra cost of approximately 5%. Clearly construction costs can vary according to the development site but these are capped in the National Standards by a test for affordability. This addresses the concern of some developers that SuDS give rise to significant costs associated with land-take. It is assumed that SuDS will be no more expensive than conventional drainage for this assessment.
29. Maintenance of SuDS is estimated to cost £6 per dwelling per annum more than conventional drainage. This assumption was made for the impact assessment of local flood risk management, which included SuDS3. Although more recent case studies have suggested that SuDS are cheaper to maintain in many developments (see Annex 2), to be conservative in testing the economic case for SuDS, we have maintained the earlier assumption that SuDS are slightly more expensive to maintain.
Costs to Developers
30. The National Standards for SuDS are, at worst, broadly cost neutral to build and maintain; and in favourable circumstances may provide a significant saving.
31. Many developers are already familiar with SuDS and use them in some situations. However, this assessment assumes that each developer affected by the provisions would require 10 days of staff time to build skills and capacity for the new requirements (“up-
skilling” cost).
32. Drainage applications to a SAB will be a new cost to developers of a few hundred pounds per application. However, the SuDS process will reduce negotiations and simplify interaction with a complex array of interests, which includes the WASC, Local Planning Authority, Highways Authority and the Environment Agency. Moreover, the policy has been developed to run alongside planning requirements.
33. SuDS will reduce the number of full applications for a new development to connect to the public sewer - surface runoff will be managed by SuDS. Developers currently pay around £2100 per property to connect surface runoff, which typically comprises five separate charges; of application; connection; inspection; infrastructure; and requisition. In the economic analysis in this IA, it is conservatively assumed that each development (rather than individual property) with SuDS would save on average one application charge, one connection charge, and one inspection charge (total saving around £600). This reflects the fact that some residual connections may still be required in some cases (even though total flows may be greatly reduced), and also that connections to the public sewer may often be made not at each individual property, but downstream of a collector drain. In areas with combined sewers, it is further assumed that separate connections for surface and foul drainage are made, so there will still be at least some savings in connection charges. All of these assumptions will be tested further with OfWAT and companies during consultation stage.
34. At present many developers pay a commuted sum to Local Authorities for the maintenance of adopted SuDS.
23
Appendix 7
Primary School Places in Torfaen for June 2013
School Name Language Type of School
School Role
School Capacity
Surplus capacity
North Torfaen
Cwmffrwdoer English C 161 210 49
Garnteg English C 204 249 45
Pontnewynydd English C 132 255 123
Victoria English C 214 233 19
Blaenavon English VC 416 450 34
Ysgol Bryn Onnen Welsh C 232 210 -22
SUB-TOTAL 1,359 1,607 248
Pontypool
George Street English C 246 273 27
New Inn English C 503 526 23
Griffithstown English C 317 420 103
Kemys Fawr English C 62 93 31
Pontymoile English C 97 231 134
Penygarn English C 333 445 112
Padre Pio English VA 214 210 -4
Ysgol Panteg Welsh C 101 150 49
SUB-TOTAL 1,873 2,348 475
Cwmbran
Blenheim Road English C 159 410 251
Coed Eva English C 403 420 17
Greenmeadow English C 202 301 99
Croesyceiliog English C 420 420 0
Llanyrafon English C 372 407 35
Maendy English C 219 254 35
Pontnewydd English C 363 386 23
Llantarnam English C 147 213 66
Nant Celyn English C 333 420 87
Woodlands English C 271 294 23
Henllys English VA 209 212 3
Ponthir English VA 107 113 6
St.David's English VA 164 226 62
Our Lady of the Angels English VA 195 205 10
Ysgol Gymraeg Cwmbran Welsh C 337 330 -7
SUB-TOTAL 3,901 4,611 710
GRAND TOTAL 7,133 8,566 1,433