housing development finance corporation limited · pdf filecompany in india • now a...
TRANSCRIPT
Housing Development Finance
Corporation Limited
March 2015

2
CONTENTS
• HDFC Snapshot
• Mortgage Market in India
• Operational and Financial Highlights: Mortgages
• Valuations and Shareholding
• Key Subsidiaries and Associates
• Financials: Standalone and Consolidated
3
HDFC SNAPSHOT
4
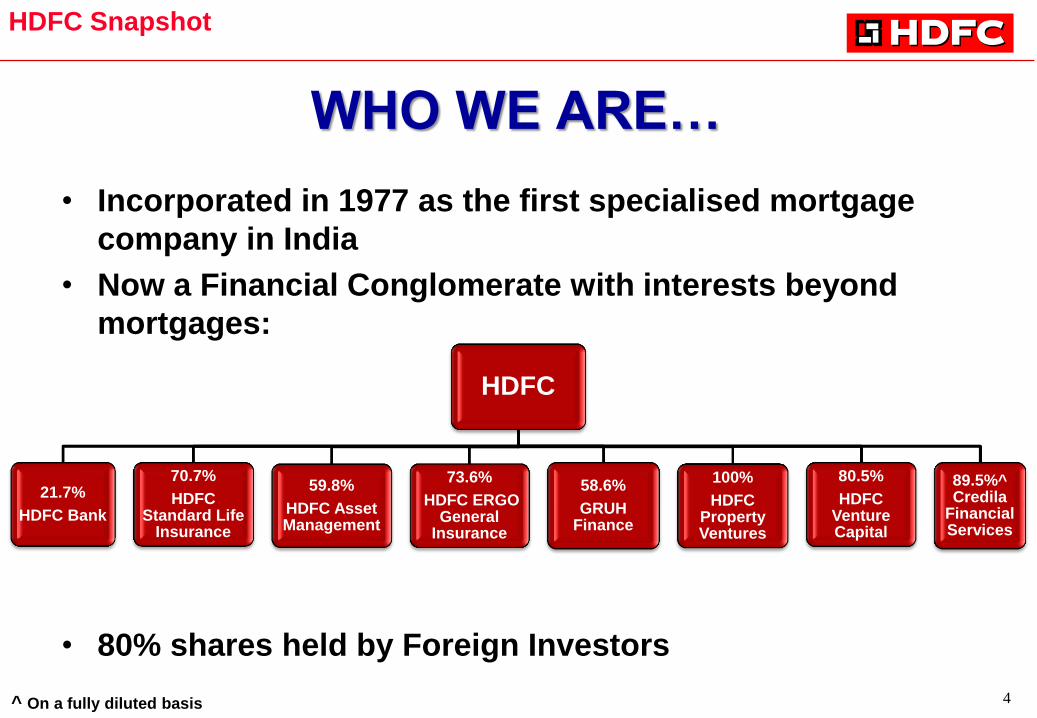
WHO WE ARE…
• Incorporated in 1977 as the first specialised mortgage
company in India
• Now a Financial Conglomerate with interests beyond
mortgages:
• 80% shares held by Foreign Investors
HDFC
21.7%
HDFC Bank
70.7%
HDFC Standard Life
Insurance
59.8%
HDFC Asset Management
73.6%
HDFC ERGO General
Insurance
58.6%
GRUH Finance
100%
HDFC Property Ventures
80.5%
HDFC Venture Capital
89.5%^ Credila
Financial Services
HDFC Snapshot
^ On a fully diluted basis
5
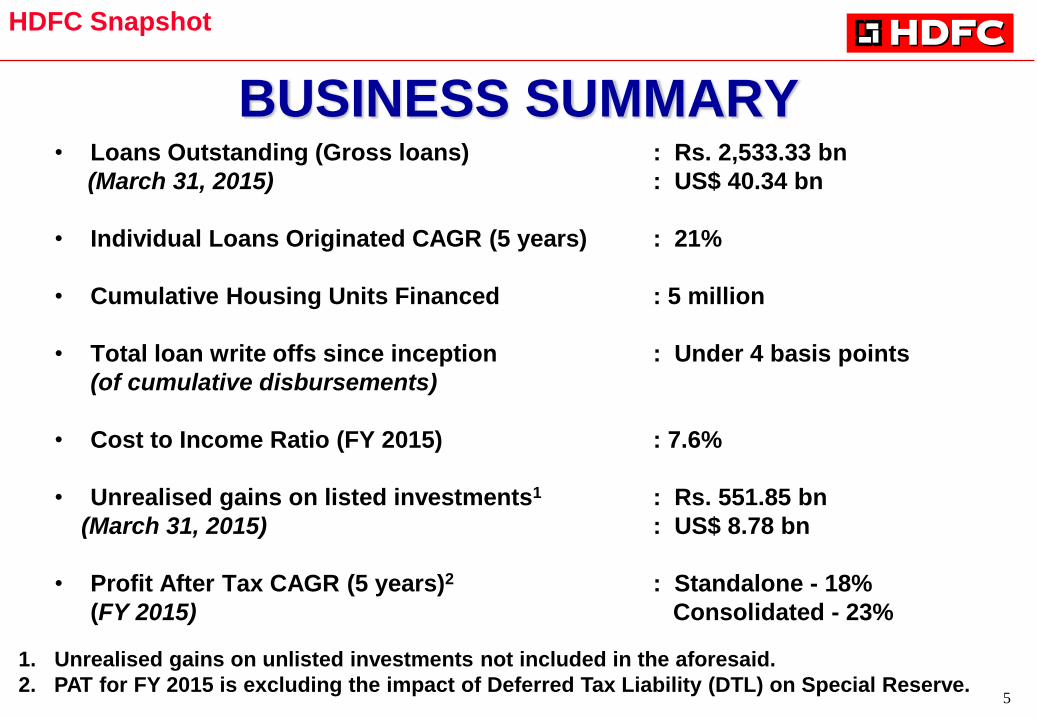
BUSINESS SUMMARY • Loans Outstanding (Gross loans) : Rs. 2,533.33 bn
(March 31, 2015) : US$ 40.34 bn
• Individual Loans Originated CAGR (5 years) : 21%
• Cumulative Housing Units Financed : 5 million
• Total loan write offs since inception : Under 4 basis points
(of cumulative disbursements)
• Cost to Income Ratio (FY 2015) : 7.6%
• Unrealised gains on listed investments1 : Rs. 551.85 bn
(March 31, 2015) : US$ 8.78 bn
• Profit After Tax CAGR (5 years)2 : Standalone - 18%
(FY 2015) Consolidated - 23%
HDFC Snapshot
1. Unrealised gains on unlisted investments not included in the aforesaid.
2. PAT for FY 2015 is excluding the impact of Deferred Tax Liability (DTL) on Special Reserve.
6
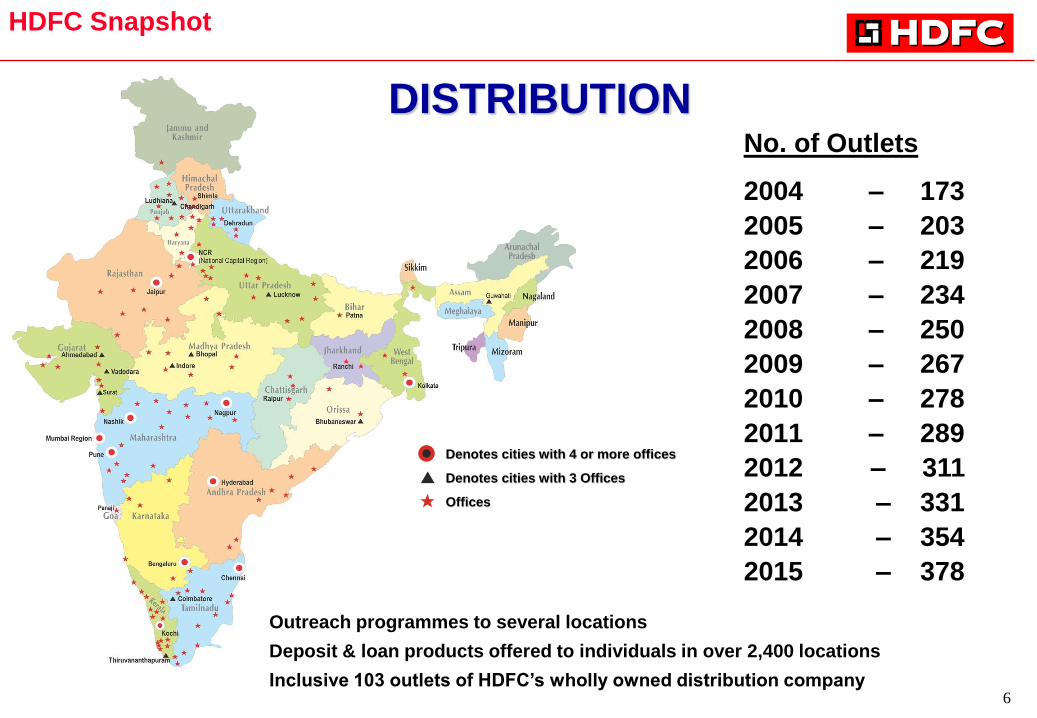
No. of Outlets
2004 – 173
2005 – 203
2006 – 219
2007 – 234
2008 – 250
2009 – 267
2010 – 278
2011 – 289
2012 – 311
2013 – 331
2014 – 354
2015 – 378
HDFC Snapshot
Denotes cities with 4 or more offices
Denotes cities with 3 Offices
Offices
DISTRIBUTION
Outreach programmes to several locations
Deposit & loan products offered to individuals in over 2,400 locations
Inclusive 103 outlets of HDFC‟s wholly owned distribution company

7
MORTGAGE MARKET IN INDIA
8
• High demand growth driven by:
– Improved Affordability
• Rising disposable income
• Tax incentives (interest and principal repayments deductible)
• Affordable interest rates
– Increasing Urbanisation
• Currently only 31% of Indian population is urban
– Favorable Demographics
• 60% of India‟s population is below 30 years of age
• Rapid rise in new households
• The urban housing shortage is estimated at 18.78 million units (Source:
Ministry of Housing & Urban Poverty Alleviation)
MARKET SCENARIO
Mortgage Market in India
9
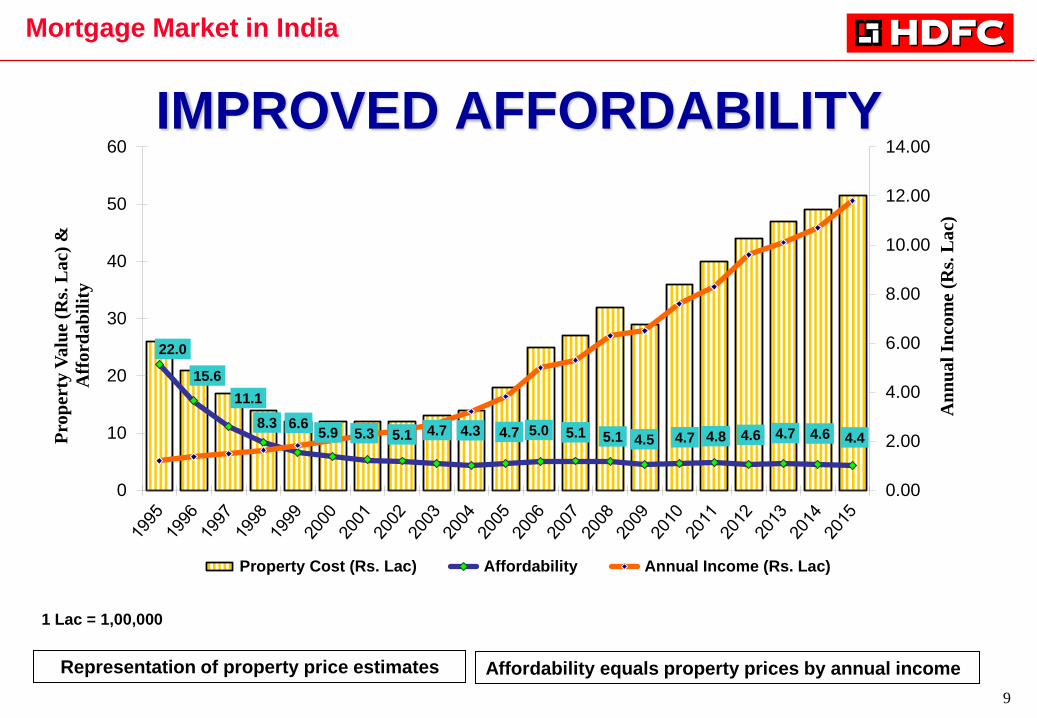
IMPROVED AFFORDABILITY
22.0
15.6
11.1
8.3 6.6 5.9 5.3 5.1 4.7 4.3 4.7 5.0 5.1 5.1 4.5 4.7 4.8 4.6 4.7 4.6 4.4
0.00
2.00
4.00
6.00
8.00
10.00
12.00
14.00
0
10
20
30
40
50
60
An
nu
al
Inco
me
(Rs.
La
c)
Pro
per
ty V
alu
e (R
s. L
ac)
&
Aff
ord
ab
ilit
y
Property Cost (Rs. Lac) Affordability Annual Income (Rs. Lac)
Mortgage Market in India
1 Lac = 1,00,000
Representation of property price estimates Affordability equals property prices by annual income
10
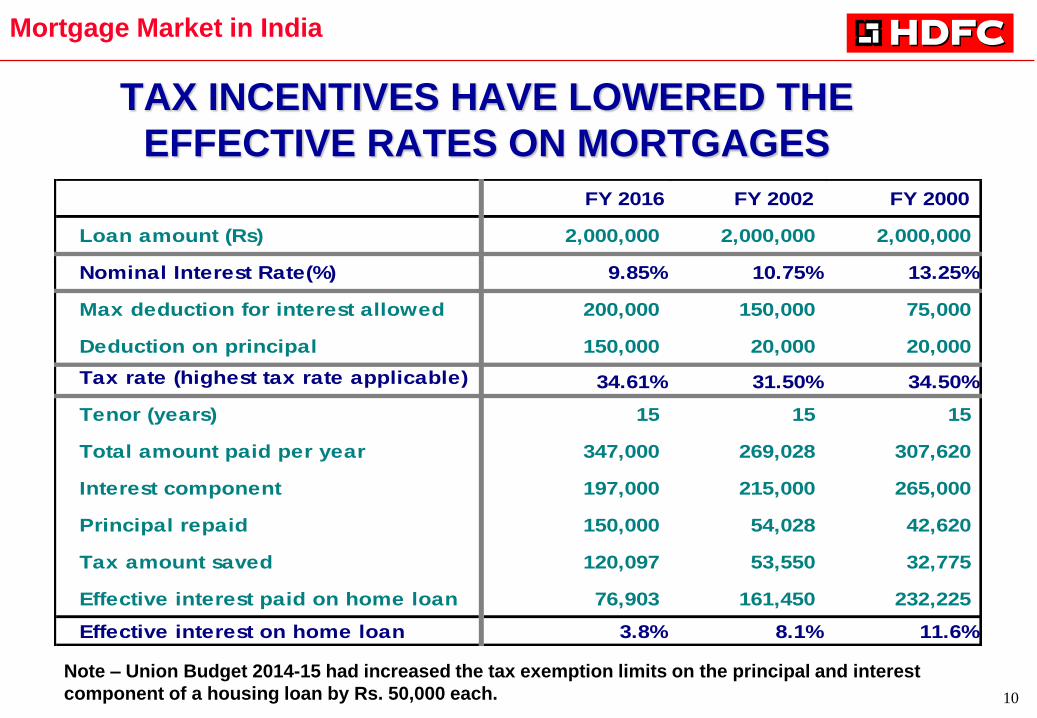
TAX INCENTIVES HAVE LOWERED THE
EFFECTIVE RATES ON MORTGAGES
Mortgage Market in India
FY 2016 FY 2002 FY 2000
Loan amount (Rs) 2,000,000 2,000,000 2,000,000
Nominal Interest Rate(%) 9.85% 10.75% 13.25%
Max deduction for interest allowed 200,000 150,000 75,000
Deduction on principal 150,000 20,000 20,000
Tax rate (highest tax rate applicable) 34.61% 31.50% 34.50%
Tenor (years) 15 15 15
Total amount paid per year 347,000 269,028 307,620
Interest component 197,000 215,000 265,000
Principal repaid 150,000 54,028 42,620
Tax amount saved 120,097 53,550 32,775
Effective interest paid on home loan 76,903 161,450 232,225
Effective interest on home loan 3.8% 8.1% 11.6%
Note – Union Budget 2014-15 had increased the tax exemption limits on the principal and interest
component of a housing loan by Rs. 50,000 each.

11
0%
20%
40%
60%
80%
100%
120%
9%
18% 20%
32% 36% 40%
45% 45%
56% 62%
81%
94%
LOW PENETRATION IMPLIES ROOM FOR GROWTH MORTGAGES AS A PERCENT OF NOMINAL GDP
Mortgage Market in India
Source: European Mortgage Federation, HOFINET & HDFC estimates for India

12
OPERATIONAL & FINANCIAL
HIGHLIGHTS: MORTGAGES
13
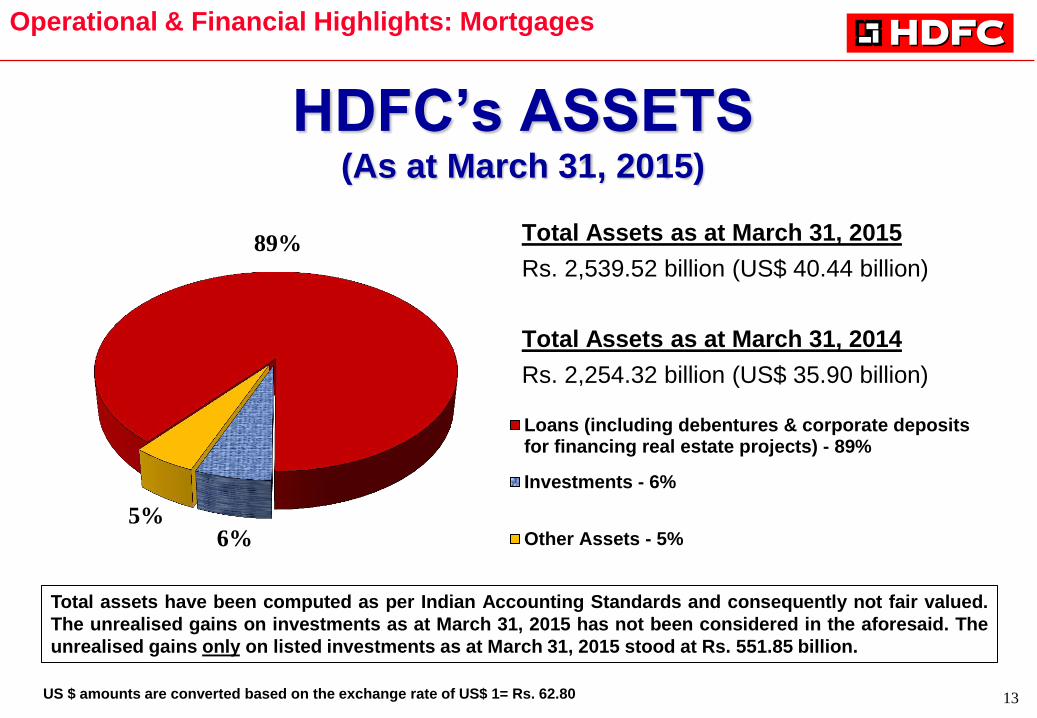
HDFC‟s ASSETS (As at March 31, 2015)
89%
6% 5%
Loans (including debentures & corporate depositsfor financing real estate projects) - 89%
Investments - 6%
Other Assets - 5%
Total Assets as at March 31, 2015
Rs. 2,539.52 billion (US$ 40.44 billion)
Total Assets as at March 31, 2014
Rs. 2,254.32 billion (US$ 35.90 billion)
Total assets have been computed as per Indian Accounting Standards and consequently not fair valued.
The unrealised gains on investments as at March 31, 2015 has not been considered in the aforesaid. The
unrealised gains only on listed investments as at March 31, 2015 stood at Rs. 551.85 billion.
Operational & Financial Highlights: Mortgages
US $ amounts are converted based on the exchange rate of US$ 1= Rs. 62.80
14
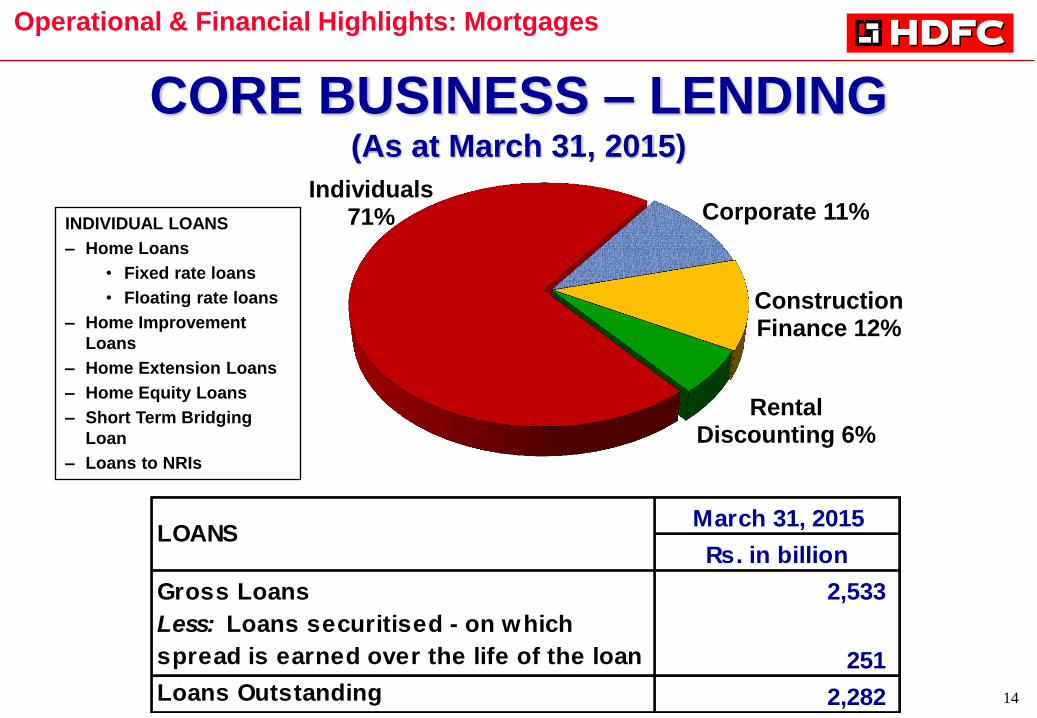
INDIVIDUAL LOANS
– Home Loans
• Fixed rate loans
• Floating rate loans
– Home Improvement
Loans
– Home Extension Loans
– Home Equity Loans
– Short Term Bridging
Loan
– Loans to NRIs
CORE BUSINESS – LENDING (As at March 31, 2015)
Operational & Financial Highlights: Mortgages
Individuals 71% Corporate 11%
Construction Finance 12%
Rental Discounting 6%
March 31, 2015
Rs. in billion
Gross Loans 2,533
Less: Loans securitised - on which
spread is earned over the life of the loan 251
Loans Outstanding 2,282
LOANS
15
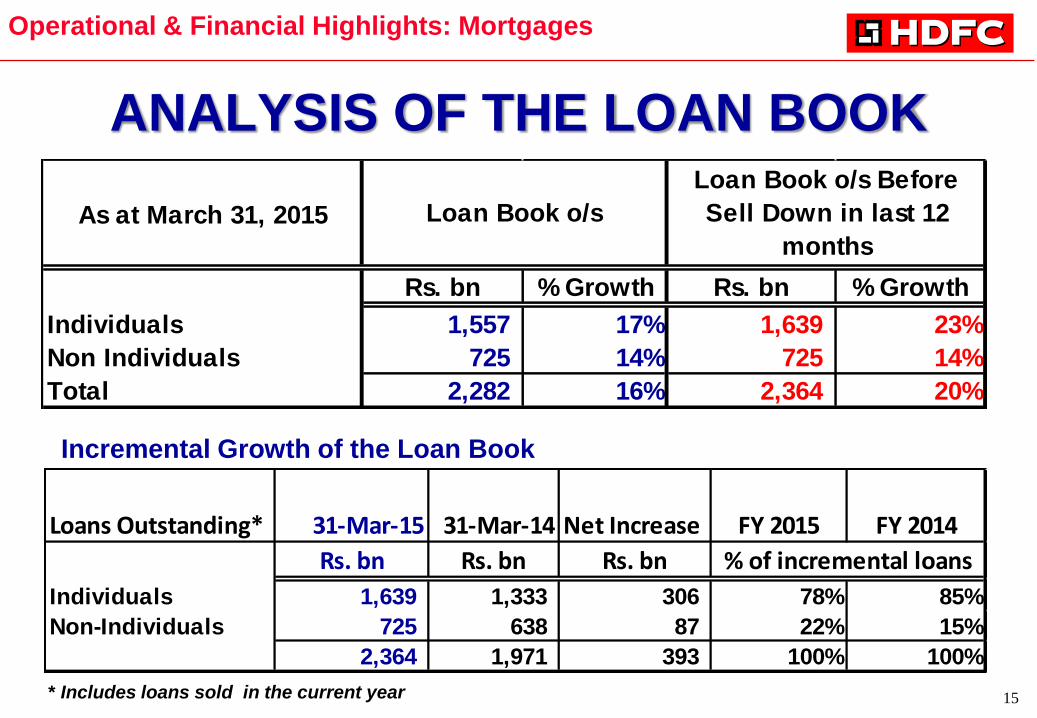
ANALYSIS OF THE LOAN BOOK
Loans Outstanding* 31-Mar-15 31-Mar-14 Net Increase FY 2015 FY 2014
Rs. bn Rs. bn Rs. bn
Individuals 1,639 1,333 306 78% 85%
Non-Individuals 725 638 87 22% 15%
2,364 1,971 393 100% 100%
% of incremental loans
* Includes loans sold in the current year
Operational & Financial Highlights: Mortgages
Incremental Growth of the Loan Book
As at March 31, 2015
Rs. bn % Growth Rs. bn % Growth
Individuals 1,557 17% 1,639 23%
Non Individuals 725 14% 725 14%
Total 2,282 16% 2,364 20%
Loan Book o/s
Loan Book o/s Before
Sell Down in last 12
months
16
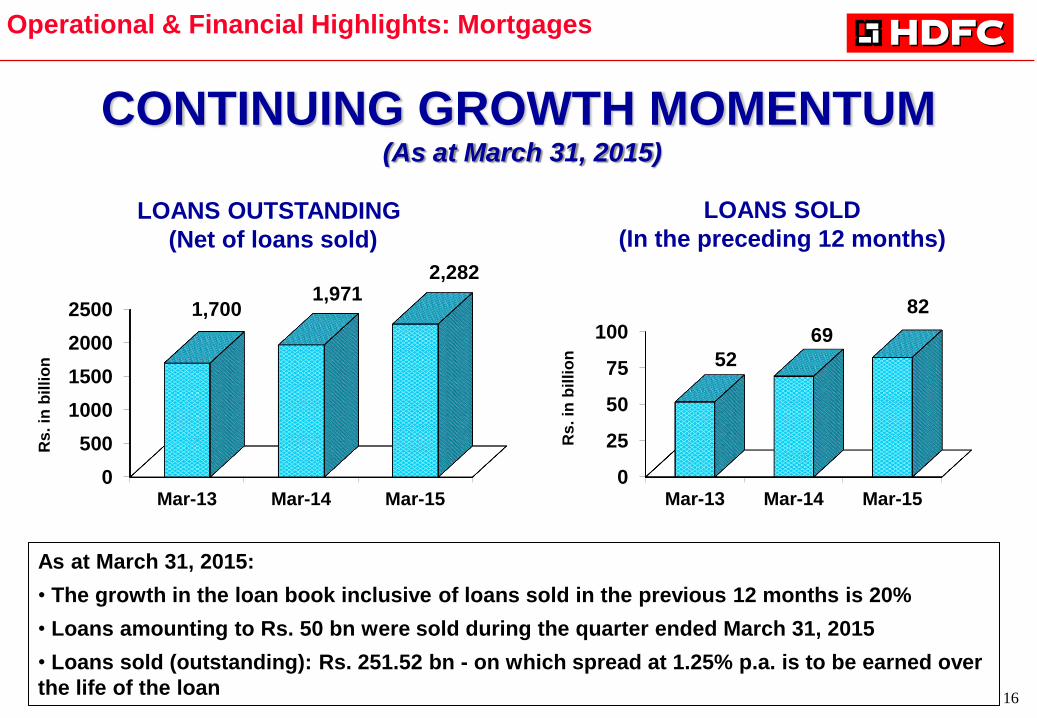
CONTINUING GROWTH MOMENTUM (As at March 31, 2015)
0
500
1000
1500
2000
2500
Mar-13 Mar-14 Mar-15
1,700 1,971
2,282
Rs
. in
bil
lio
n
LOANS OUTSTANDING
(Net of loans sold)
0
25
50
75
100
Mar-13 Mar-14 Mar-15
52
69
82
Rs
. in
bil
lio
n
LOANS SOLD
(In the preceding 12 months)
As at March 31, 2015:
• The growth in the loan book inclusive of loans sold in the previous 12 months is 20%
• Loans amounting to Rs. 50 bn were sold during the quarter ended March 31, 2015
• Loans sold (outstanding): Rs. 251.52 bn - on which spread at 1.25% p.a. is to be earned over
the life of the loan
Operational & Financial Highlights: Mortgages
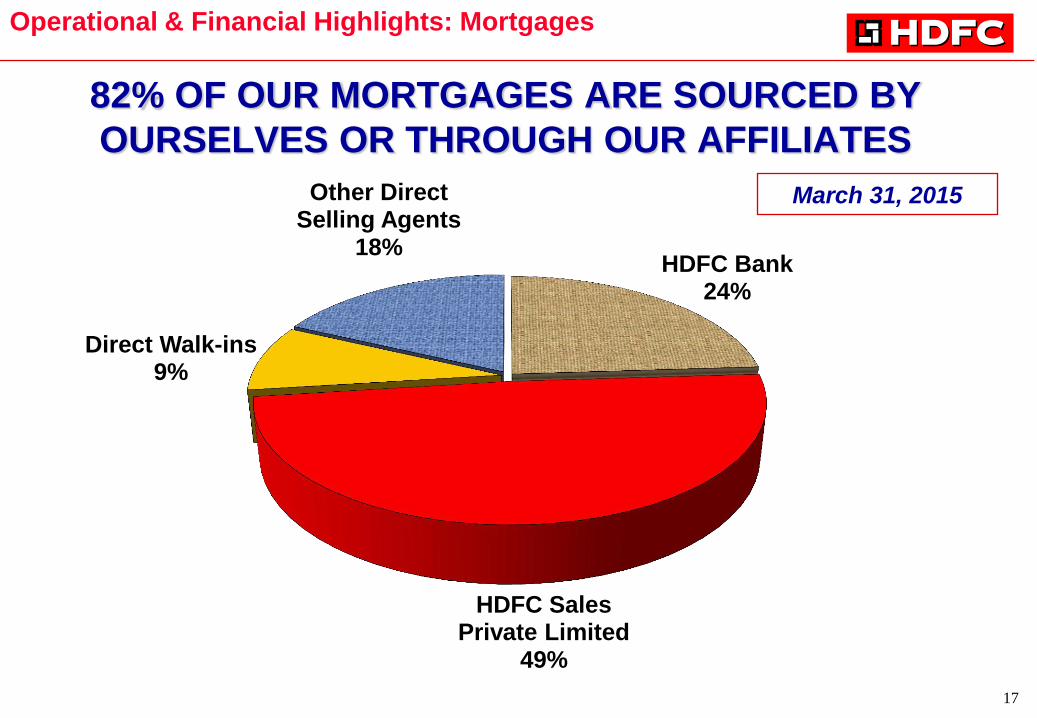
17
HDFC Bank 24%
HDFC Sales Private Limited
49%
Direct Walk-ins 9%
Other Direct Selling Agents
18%
82% OF OUR MORTGAGES ARE SOURCED BY
OURSELVES OR THROUGH OUR AFFILIATES
Operational & Financial Highlights: Mortgages
March 31, 2015
18
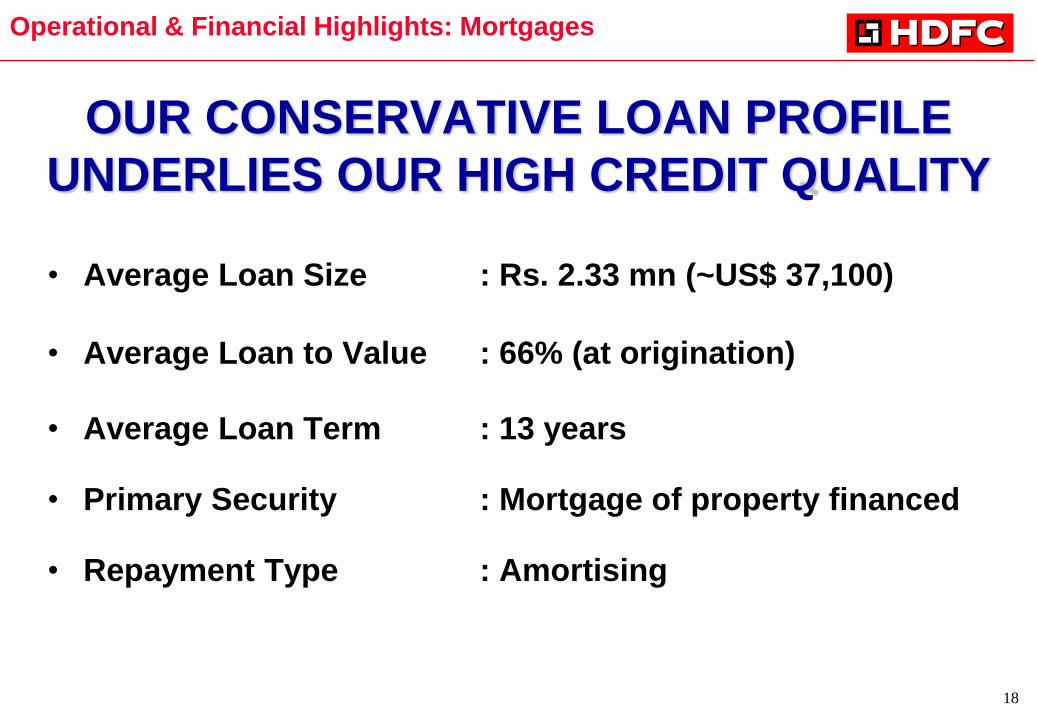
OUR CONSERVATIVE LOAN PROFILE
UNDERLIES OUR HIGH CREDIT QUALITY
• Average Loan Size : Rs. 2.33 mn (~US$ 37,100)
• Average Loan to Value : 66% (at origination)
• Average Loan Term : 13 years
• Primary Security : Mortgage of property financed
• Repayment Type : Amortising
Operational & Financial Highlights: Mortgages
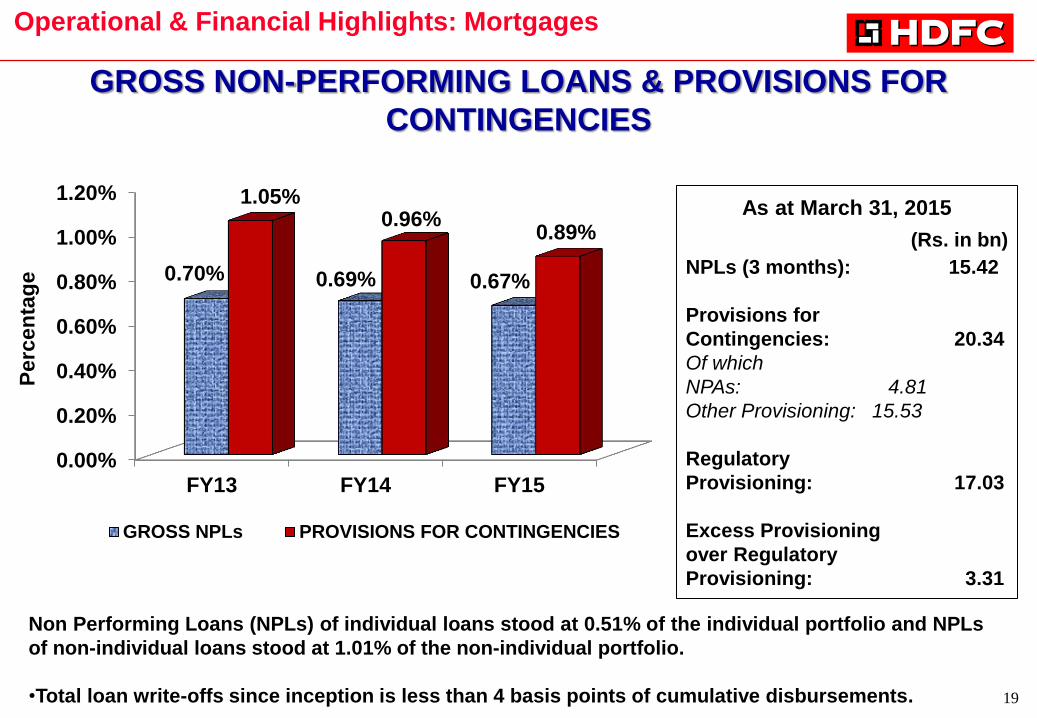
19
GROSS NON-PERFORMING LOANS & PROVISIONS FOR
CONTINGENCIES
Operational & Financial Highlights: Mortgages
Non Performing Loans (NPLs) of individual loans stood at 0.51% of the individual portfolio and NPLs
of non-individual loans stood at 1.01% of the non-individual portfolio.
•Total loan write-offs since inception is less than 4 basis points of cumulative disbursements.
Perc
en
tag
e
As at March 31, 2015
(Rs. in bn)
NPLs (3 months): 15.42
Provisions for
Contingencies: 20.34
Of which
NPAs: 4.81
Other Provisioning: 15.53
Regulatory
Provisioning: 17.03
Excess Provisioning
over Regulatory
Provisioning: 3.31
0.00%
0.20%
0.40%
0.60%
0.80%
1.00%
1.20%
FY13 FY14 FY15
0.70% 0.69% 0.67%
1.05% 0.96%
0.89%
GROSS NPLs PROVISIONS FOR CONTINGENCIES
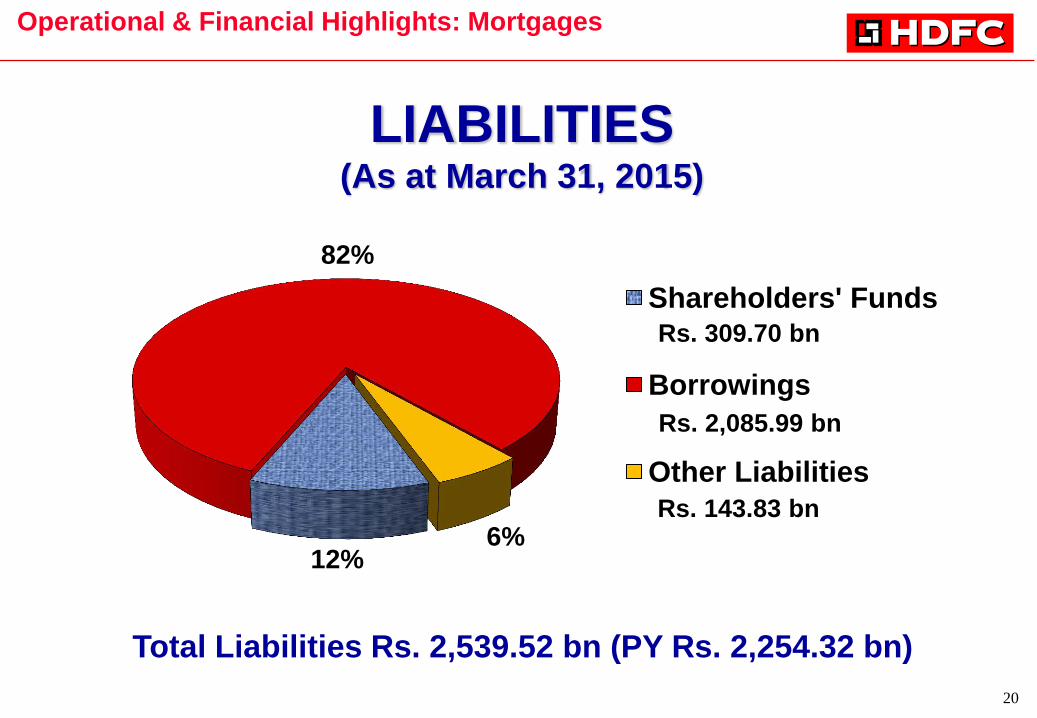
20
12%
82%
6%
Shareholders' Funds
Borrowings
Other Liabilities
Rs. 309.70 bn
Rs. 2,085.99 bn
Rs. 143.83 bn
LIABILITIES (As at March 31, 2015)
Operational & Financial Highlights: Mortgages
Total Liabilities Rs. 2,539.52 bn (PY Rs. 2,254.32 bn)
21
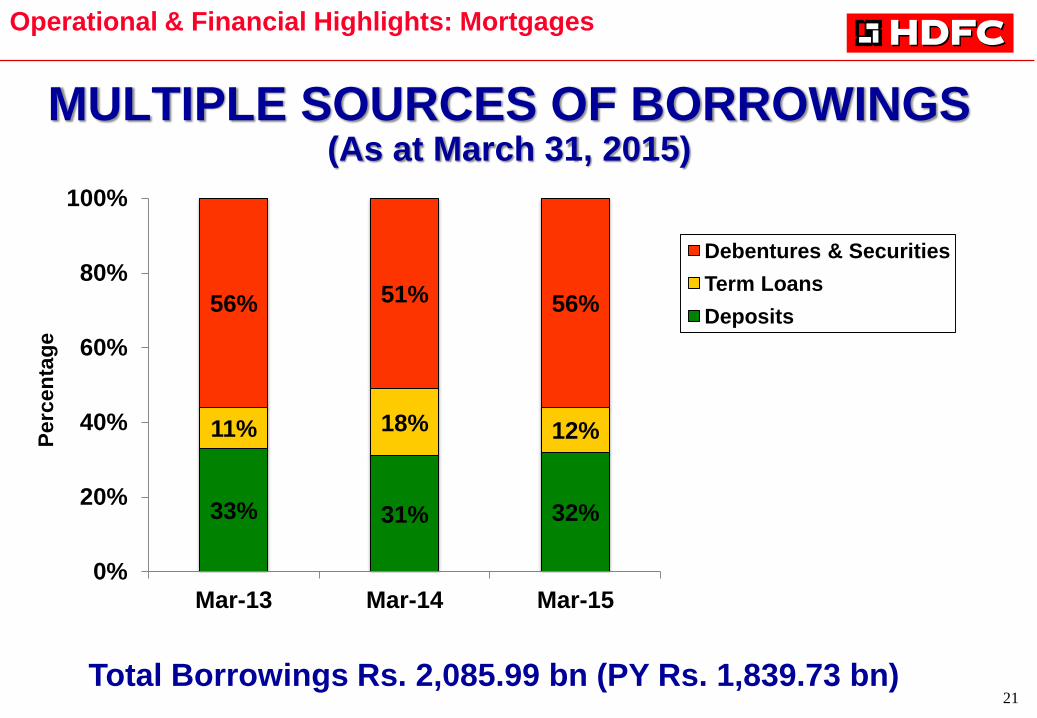
MULTIPLE SOURCES OF BORROWINGS (As at March 31, 2015)
Total Borrowings Rs. 2,085.99 bn (PY Rs. 1,839.73 bn)
Operational & Financial Highlights: Mortgages P
erc
en
tag
e
33% 31% 32%
11% 18% 12%
56% 51% 56%
0%
20%
40%
60%
80%
100%
Mar-13 Mar-14 Mar-15
Debentures & Securities
Term Loans
Deposits
22
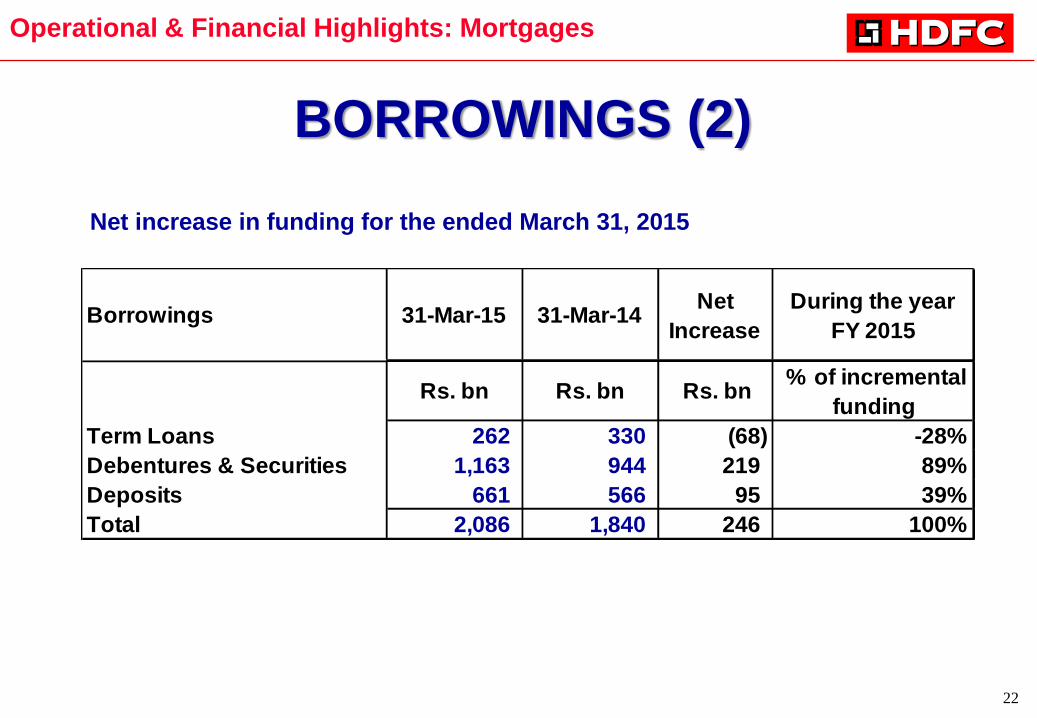
BORROWINGS (2)
Operational & Financial Highlights: Mortgages
Net increase in funding for the ended March 31, 2015
Borrowings 31-Mar-15 31-Mar-14Net
Increase
During the year
FY 2015
Rs. bn Rs. bn Rs. bn % of incremental
funding
Term Loans 262 330 (68) -28%
Debentures & Securities 1,163 944 219 89%
Deposits 661 566 95 39%
Total 2,086 1,840 246 100%
23
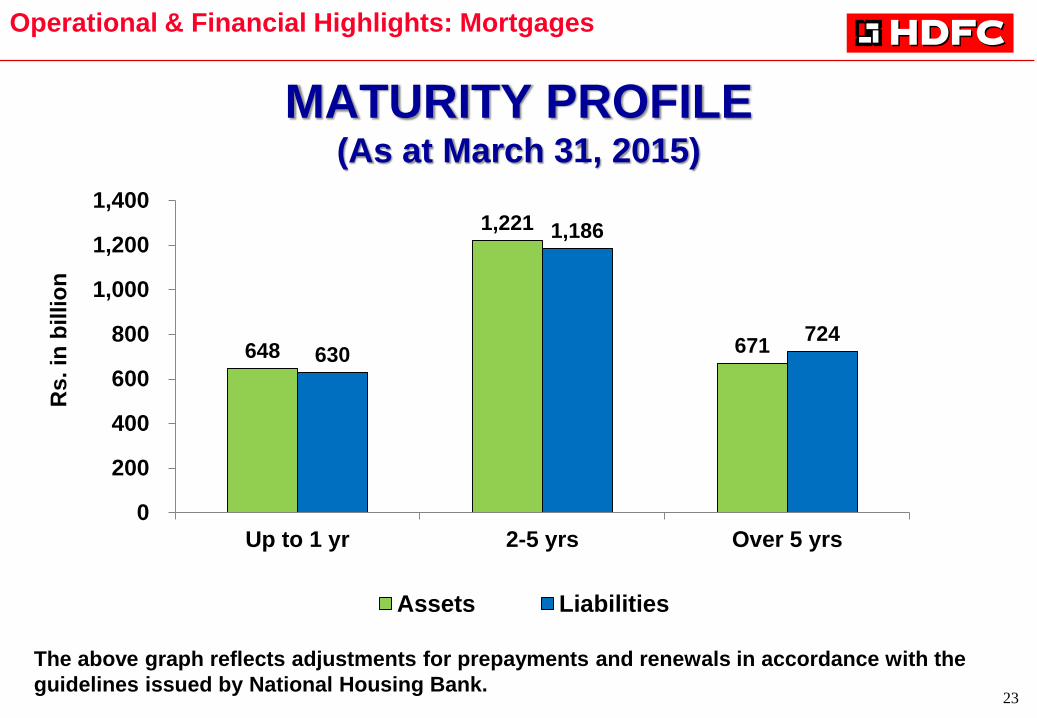
648
1,221
671 630
1,186
724
0
200
400
600
800
1,000
1,200
1,400
Up to 1 yr 2-5 yrs Over 5 yrs
Assets Liabilities
Rs
. in
billio
n
MATURITY PROFILE (As at March 31, 2015)
The above graph reflects adjustments for prepayments and renewals in accordance with the
guidelines issued by National Housing Bank.
Operational & Financial Highlights: Mortgages
24
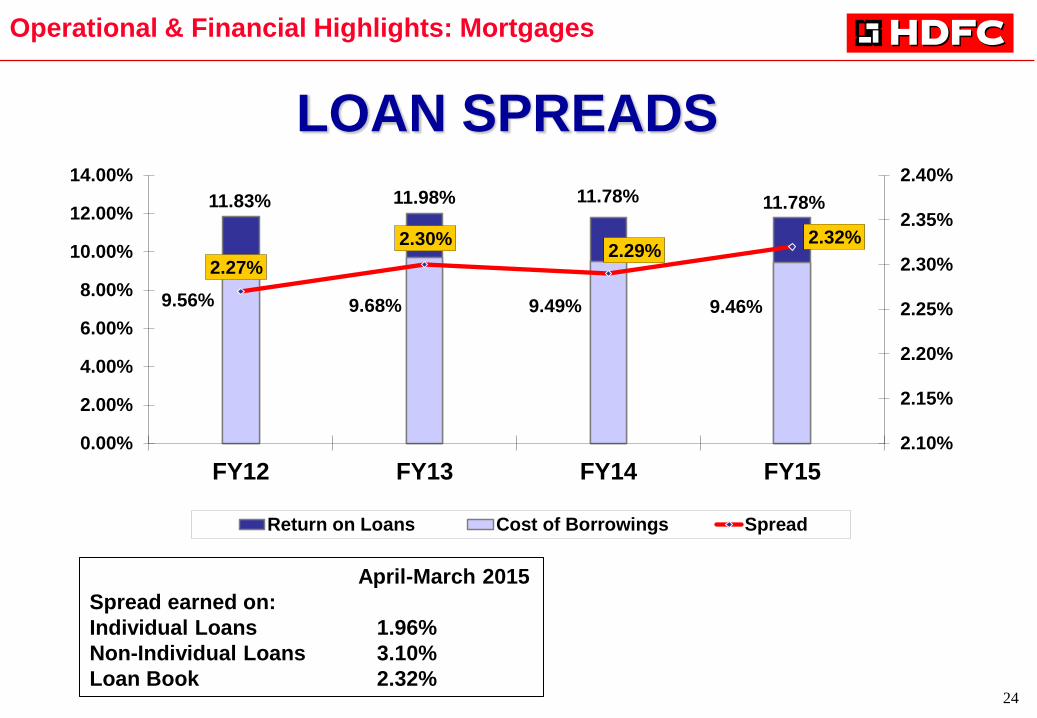
LOAN SPREADS
Operational & Financial Highlights: Mortgages
April-March 2015
Spread earned on:
Individual Loans 1.96%
Non-Individual Loans 3.10%
Loan Book 2.32%
11.83% 11.98% 11.78% 11.78%
9.56% 9.68% 9.49% 9.46%
2.27%
2.30% 2.29%
2.32%
2.10%
2.15%
2.20%
2.25%
2.30%
2.35%
2.40%
0.00%
2.00%
4.00%
6.00%
8.00%
10.00%
12.00%
14.00%
FY12 FY13 FY14 FY15
Return on Loans Cost of Borrowings Spread
25
STRENGTHS Home Loan Strengths
• Low average loan to value ratio and instalment to income ratios
• Efficient recovery mechanisms
• Steady level of prepayments
• Quality underwriting with experience of over 38 years
Corporate Strengths
• Strong brand – customer base of 5 million
• Stable and experienced management – average tenor of senior
management in HDFC ~ 30 years
• High service standards
• Low cost income ratio: 7.6% (As at March 31, 2015)
Operational & Financial Highlights: Mortgages
26
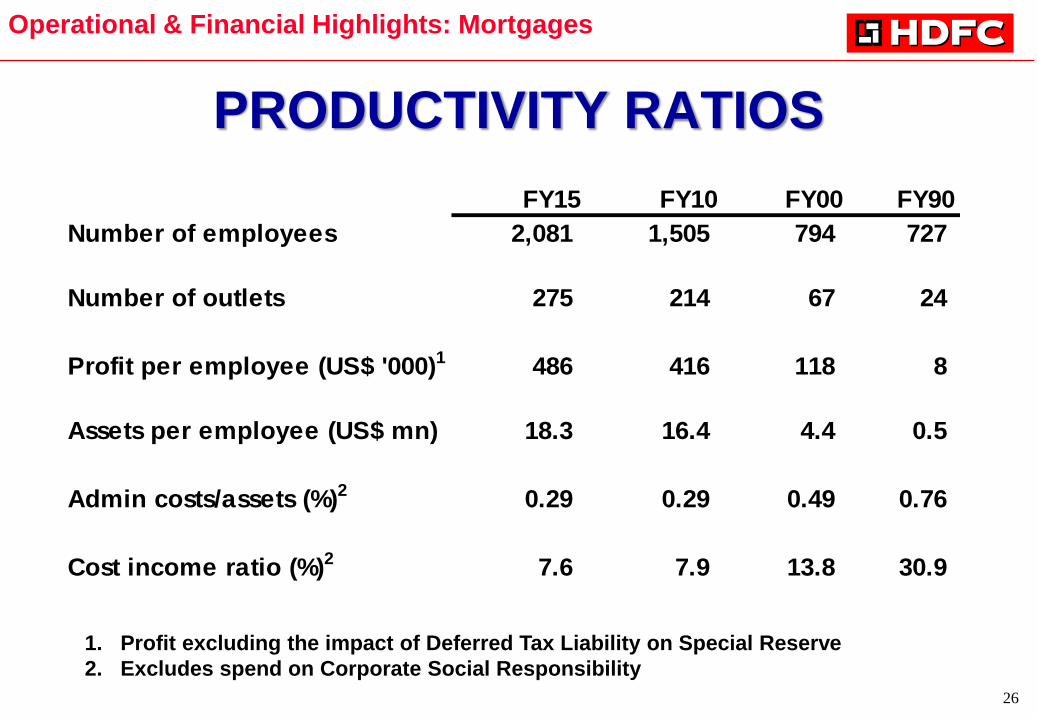
PRODUCTIVITY RATIOS
Operational & Financial Highlights: Mortgages
FY15 FY10 FY00 FY90
Number of employees 2,081 1,505 794 727
Number of outlets 275 214 67 24
Profit per employee (US$ '000)1 486 416 118 8
Assets per employee (US$ mn) 18.3 16.4 4.4 0.5
Admin costs/assets (%)2 0.29 0.29 0.49 0.76
Cost income ratio (%)2 7.6 7.9 13.8 30.9
1. Profit excluding the impact of Deferred Tax Liability on Special Reserve
2. Excludes spend on Corporate Social Responsibility
27
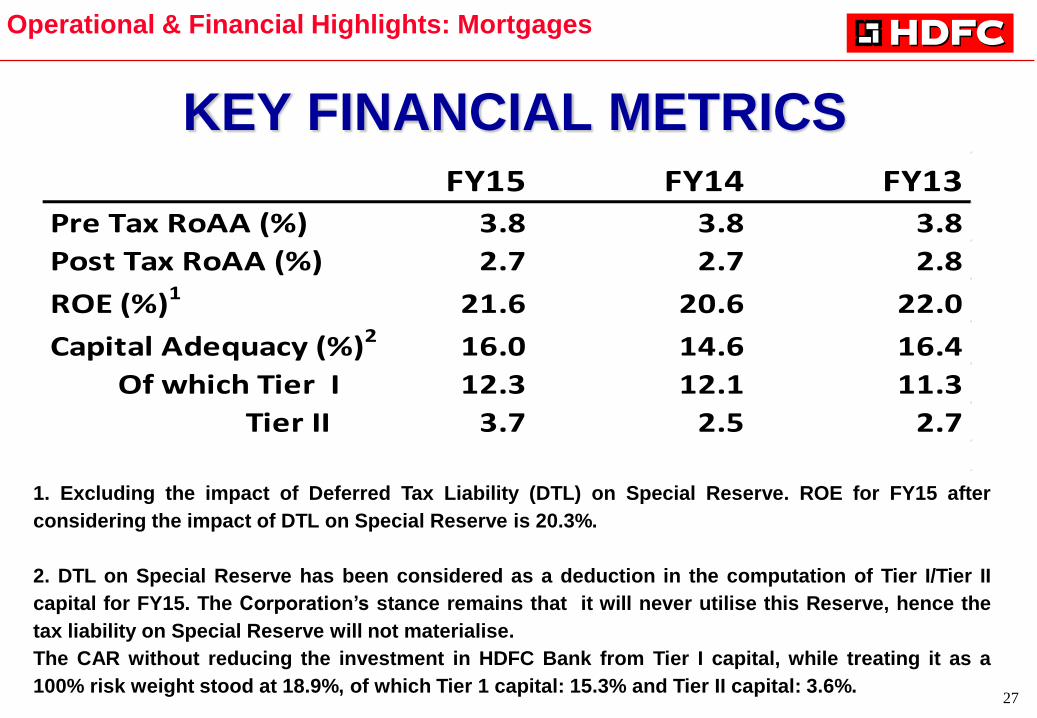
KEY FINANCIAL METRICS
Operational & Financial Highlights: Mortgages
FY15 FY14 FY13
Pre Tax RoAA (%) 3.8 3.8 3.8
Post Tax RoAA (%) 2.7 2.7 2.8
ROE (%)1 21.6 20.6 22.0
Capital Adequacy (%)2 16.0 14.6 16.4
Of which Tier I 12.3 12.1 11.3
Tier II 3.7 2.5 2.7
1. Excluding the impact of Deferred Tax Liability (DTL) on Special Reserve. ROE for FY15 after
considering the impact of DTL on Special Reserve is 20.3%.
2. DTL on Special Reserve has been considered as a deduction in the computation of Tier I/Tier II
capital for FY15. The Corporation‟s stance remains that it will never utilise this Reserve, hence the
tax liability on Special Reserve will not materialise.
The CAR without reducing the investment in HDFC Bank from Tier I capital, while treating it as a
100% risk weight stood at 18.9%, of which Tier 1 capital: 15.3% and Tier II capital: 3.6%.
28
VALUATIONS & SHAREHOLDING
29
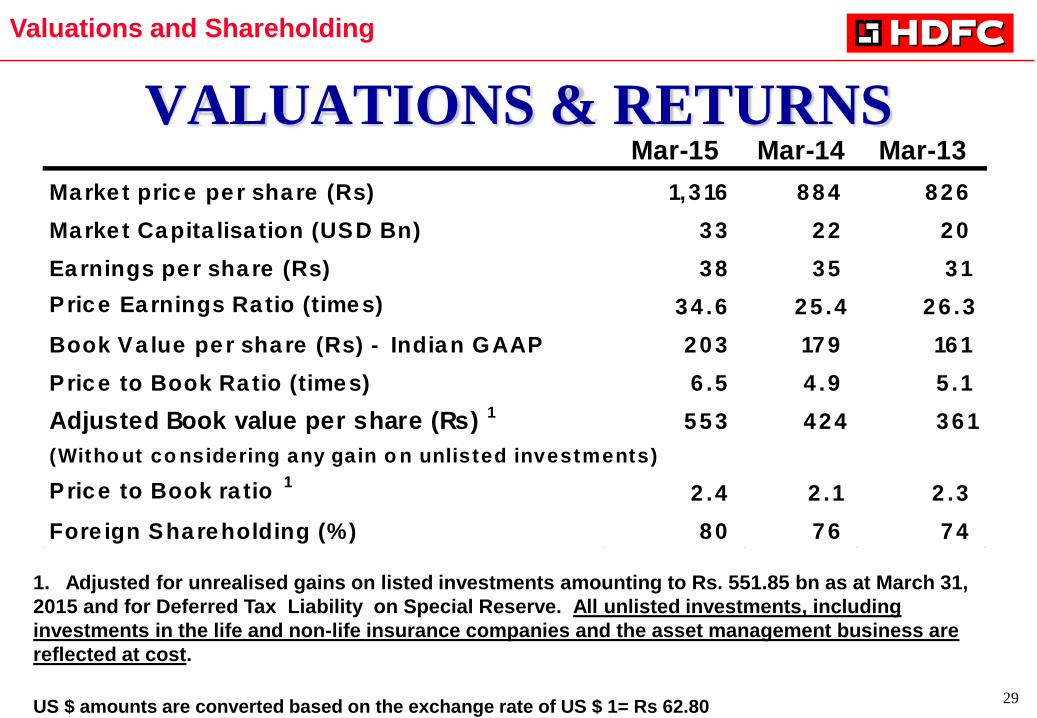
1. Adjusted for unrealised gains on listed investments amounting to Rs. 551.85 bn as at March 31,
2015 and for Deferred Tax Liability on Special Reserve. All unlisted investments, including
investments in the life and non-life insurance companies and the asset management business are
reflected at cost. US $ amounts are converted based on the exchange rate of US $ 1= Rs 62.80
VALUATIONS & RETURNS
Valuations and Shareholding
Mar-15 Mar-14 Mar-13
Marke t price pe r share (Rs) 1,316 8 8 4 8 2 6
Marke t Capita lisa tion (USD Bn) 3 3 2 2 2 0
Ea rnings per share (Rs) 3 8 3 5 3 1
P rice Earnings Ra tio (times) 34 .6 25 .4 26 .3
Book Va lue per share (Rs) - Indian GAAP 2 0 3 179 161
P rice to Book Ra tio (times) 6 .5 4 .9 5 .1
Adjusted Book value per share (Rs) 1 5 5 3 4 2 4 3 6 1
(Witho ut co nsidering any gain o n unlisted investments)
Price to Book ra tio 1
2 .4 2 .1 2 .3
Fore ign Shareholding (%) 8 0 7 6 7 4
30
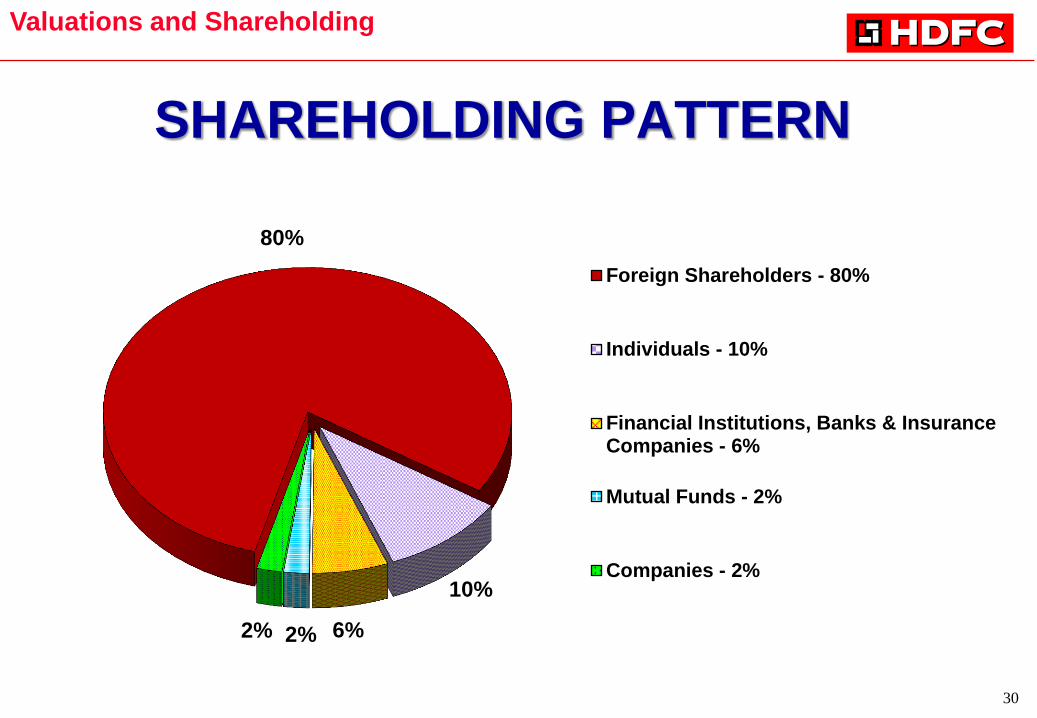
SHAREHOLDING PATTERN
80%
10%
6% 2% 2%
Foreign Shareholders - 80%
Individuals - 10%
Financial Institutions, Banks & InsuranceCompanies - 6%
Mutual Funds - 2%
Companies - 2%
Valuations and Shareholding
31
FINANCIALS Standalone
32
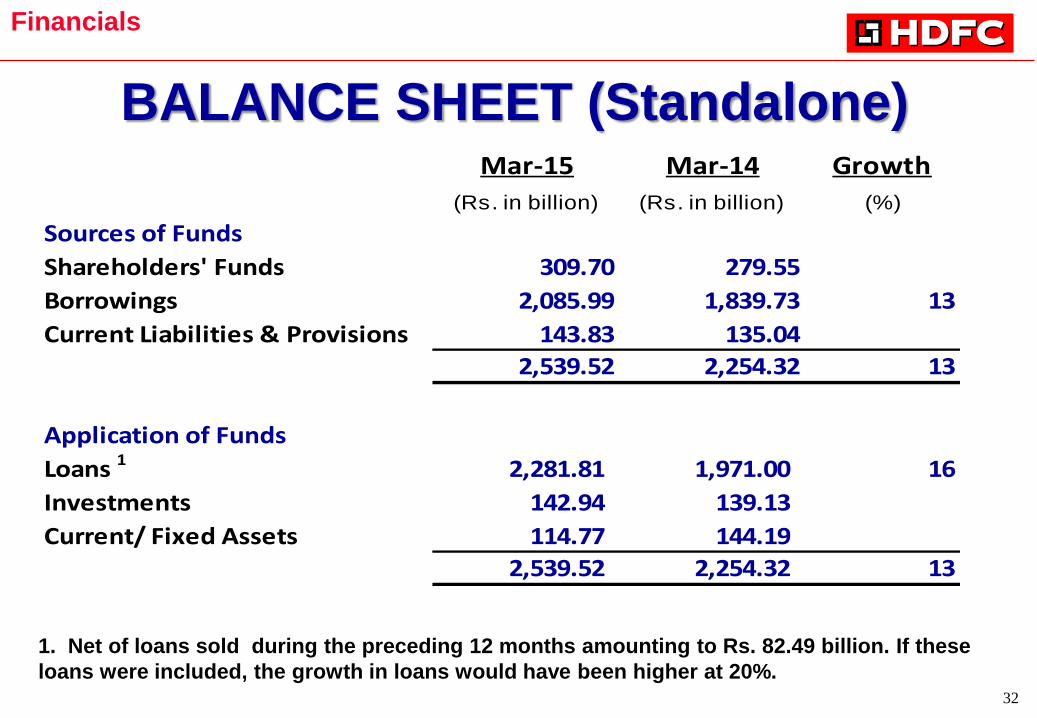
BALANCE SHEET (Standalone)
1. Net of loans sold during the preceding 12 months amounting to Rs. 82.49 billion. If these
loans were included, the growth in loans would have been higher at 20%.
Financials
Mar-15 Mar-14 Growth
(Rs. in billion) (Rs. in billion) (%)
Sources of Funds
Shareholders' Funds 309.70 279.55
Borrowings 2,085.99 1,839.73 13
Current Liabilities & Provisions 143.83 135.04
2,539.52 2,254.32 13
Application of Funds
Loans 1 2,281.81 1,971.00 16
Investments 142.94 139.13
Current/ Fixed Assets 114.77 144.19
2,539.52 2,254.32 13

33
PROFIT AND LOSS ACCOUNT – FY 15 Arp-Mar-15 Apr-Mar-14 Growth
(Rs in bn) (Rs in bn) (%)
Operating Income of which: 262.72 233.38 13%Interest Expenses 179.75 160.29 12%
Net Interest Income 82.97 73.09 14%
Less Non Interest Expenses 7.07 6.28 13%Less Provision for Contingencies 1.65 1.00
Add Other Income 0.70 0.54 Profit Before Tax, Dividend & Sale of Investments 74.95 66.35 13%
Dividend 6.88 5.56
Profit on Sale of Investments 4.41 2.49
Profit Before Tax 86.24 74.40 16%
Tax Expense 22.69 20.00 13%
Profit after tax but before Deferred Tax Liability (DTL)
on Special Reserve 63.55 54.40 17%
Less: Provision for DTL on Special Reserve 3.65 - Profit After tax 59.90 54.40 10%
Effective tax rate (%) 30.5% 26.9%
Financials
34
KEY ASSOCIATES AND
SUBSIDIARIES
35
HDFC BANK • 21.7% owned by HDFC
• Market Cap US$ 41 bn
• ADRs listed on NYSE
• 4014 branches, 11,766 ATMs, 2,464 locations
• Key business areas
– Wholesale banking Retail banking Treasury operations
• Financials (as per Indian GAAP) for the year ended March 31, 2015
– Advances as at March 31, 2015, stood at Rs. 3,654.95 bn – an increase of 21% over
the previous year
– Total deposits stood at Rs. 4,507.96 bn – an increase of 23% over the previous year
– PAT: Rs. 102.16 bn – an increase of 21% over the previous year
• Arrangement between HDFC & HDFC Bank
– HDFC Bank sources home loans for a fee
– Loans originated in the books of HDFC
– HDFC offers a part of the disbursed loans for assignment to HDFC Bank
– HDFC retains a spread on the loans that have been assigned
Associates and Subsidiaries
36
Ownership and Capitalisation
• HDFC holds 70.7% and Standard Life 26% of the equity of HDFC Life
• HDFC sold 0.95% of its equity stake in HDFC Life to Azim Premji Trust
• No capital infused during the year
Premium income and growth for the year ended March 31, 2015
• New business premium income (including single premium) stood at Rs. 33.13
bn – growth of 30% over the previous year, aided by strong growth from
bancassurance and direct channels
• Group business grew by 47% over the previous year
• Share of renewal premium to total premium was 63%
• Total premium income stood at Rs. 148.30 bn -- a growth of 23% (PY 7%)
Market share
• Ranked 1st in group premium and 3rd in individual business for the ended
March 31, 2015 (private sector market share)
• Individual business market share of 14.8% (private sector) and 7.3% (overall)
(Source: IRDA)
HDFC STANDARD LIFE INSURANCE COMPANY LTD.
(HDFC LIFE)
Associates and Subsidiaries
37
Assets Under Management
• As at March 31, 2015, Assets Under Management stood at Rs. 670.47 bn – an
increase of 33% over March 31, 2014.
Products
• Offers 24 individual products and 7 group products along with 9 optional
riders
• Offers 28 fund options across product categories
Distribution
• HDFC group network is used to cross sell by offering customised products
• Operates out of 414 offices across the country serving over 1,000 locations
and a liaison office in Dubai
• Network of 86,000 financial consultants, 4 key bancassurance partners, 9 pan
India brokers and corporate agency tie-ups
HDFC STANDARD LIFE INSURANCE COMPANY LTD.
Associates and Subsidiaries
38
Solvency Ratio
• As at March 31, 2015: 196% (as against regulatory requirement of 150%)
Operating highlights for the nine months ended March 31, 2015
• Commission ratio:4.2% (PY 4.3%)
• Operating expenses: 10.2% (PY 10.7%)
• Individual business conservation ratio: 90% (PY 79%)
Financial highlights
• Indian GAAP profits for March 31, 2015 stood at Rs. 7.86 bn
• New Business Margin for individual business for the year ended March 31, 2015:
• Pre overrun (based on loaded acquisition expenses): 22.5%
• Post overrun (after impact of acquisition overrun): 17.5% (PY 16.1%)
• At the company level, the post overrun margins (after the impact of acquisition
overrun) is 18.5%
• Market Consistent Embedded Value as at March 31, 2015: Rs. 88.05 bn
HDFC STANDARD LIFE INSURANCE COMPANY LTD.
Associates and Subsidiaries
39
HDFC ASSET MANAGEMENT
• Tie-up with Standard Life Investments (SLI)
• HDFC holds 59.8% of HDFC Asset Management
• HDFC MF manages 55 schemes comprising debt, equity, gold exchange
traded fund and fund of funds schemes
• Earned a Profit After Tax of Rs. 4.16 bn for FY 2015
• Average Assets under Management (AUM) for the month of March 2015 stood
at Rs. 1.67 trillion, which is inclusive of assets under discretionary portfolio
management and advisory services.
• Average equity assets of HDFC MF as a proportion of total MF assets is 43%
• Largest in the industry on the basis of quarterly average assets under
management (Source: AMFI)
• Overall market share: 13.6%
• Market share of equity-oriented funds: 19.6%
Associates and Subsidiaries
40
HDFC ERGO GENERAL INSURANCE COMPANY LTD.
Ownership and Capitalisation
• HDFC holds 73.6% and ERGO 26% of the equity of HDFC ERGO
• Paid-up share capital as at March 31, 2015: Rs. 5.39 bn
• Capital injected by promoters during the year ended March 31, 2015: Rs. 0.6
bn (including share premium)
Financials
• Gross written premium (excluding declined risk pool) for the year ended
March 31, 2015 stood at Rs. 32.56 bn (PY Rs. 29.78 bn) – a growth of 9%
• Profit After Tax for FY14: Rs. 1.04 bn
• Combined Ratio as at March 31, 2015 : 108.6% (after motor and declined risk
pool losses)
• Solvency as at March 31, 2015 : 165% (as against regulatory requirement of
150%).
Associates and Subsidiaries
41
HDFC ERGO GENERAL INSURANCE COMPANY LTD. Market share
• Market share of 8.4% (private sector) and 3.9% (overall) in terms of gross
direct premium for the year ended March 31, 2015 (Source: GI Council)
Products
• The company offers insurance products such as:
– Motor, health, travel, home and personal accident in the retail segment
and;
– Property, marine, aviation and liability insurance in the corporate
segment
• Retail accounts for 59% of the total business
Distribution
• Operates out of 108 branches across the country
• HDFC group network is used to cross sell home and health insurance products
Associates and Subsidiaries
42
GRUH FINANCE LIMITED (GRUH) • 58.6% owned by HDFC
• Registered housing finance company offering loans to individuals for
purchase, construction and renovation of dwelling units
• Also offers loans to the self employed segment where formal income
proofs are not available
• Retail network of 154 offices across 8 states in India – Gujarat, Maharashtra,
Karnataka, Rajasthan, Madhya Pradesh, Uttar Pradesh, Chhattisgarh and Tamil
Nadu
• Financials for March 31, 2015
• Loan portfolio as at March 31, 2015, stood at Rs. 89.15 bn – an increase of
27% over the previous year
• Gross non-performing assets: 0.28%
• PAT (before DTL on Special Reserve): Rs. 2.23 billion – an increase of 26%
over the previous year. PAT post DTL on Special Reserve: Rs. 2.04 bn
• Market Capitalisation: US$ 1.4 bn
Associates and Subsidiaries
43
HDFC PROPERTY FUND • HDFC India Real Estate Fund
– Launched in 2005
– Fund corpus : Rs. 10 billion – fully invested
– Domestic investors, close-ended fund
– Funds managed by HDFC Venture Capital Limited
– Exits have commenced; 1.55 X of the fund corpus has been returned to investors
• HIREF International LLC
– Launched in 2007
– Fund corpus : US$ 750 mn
– International investors, 9 year close-ended fund
– Targeted at premier institutions and funds across the world interested in taking an exposure to
Indian real estate
– Exits have commenced and the Fund is in the process of exiting from the balance investments
• HIREF International LLC II Pte Ltd.
– Fund corpus targeted: US$ 350 mn
– Second and final closing of US$ 321 mn was completed in April 2015
– International investors, 8 year close-ended fund
Associates and Subsidiaries
44
CREDILA FINANCIAL SERVICES • HDFC holds 89.5% in Credila Financial Services Private Limited
• Credila is a non-banking finance company and was the first Indian lender to
exclusively focus on education loans
• The company lends to under-graduate and post-graduate students studying
in India or abroad
• As at March 31, 2015
– Cumulative disbursements: Rs. 22 bn
– Loan book outstanding as at March 31, 2015: Rs. 16.9 bn – growth of 43%
over previous year
– Average loan: Rs. 1.05 mn
– Gross non-performing assets: 0.05%
Associates and Subsidiaries
45
FINANCIALS Consolidated
46
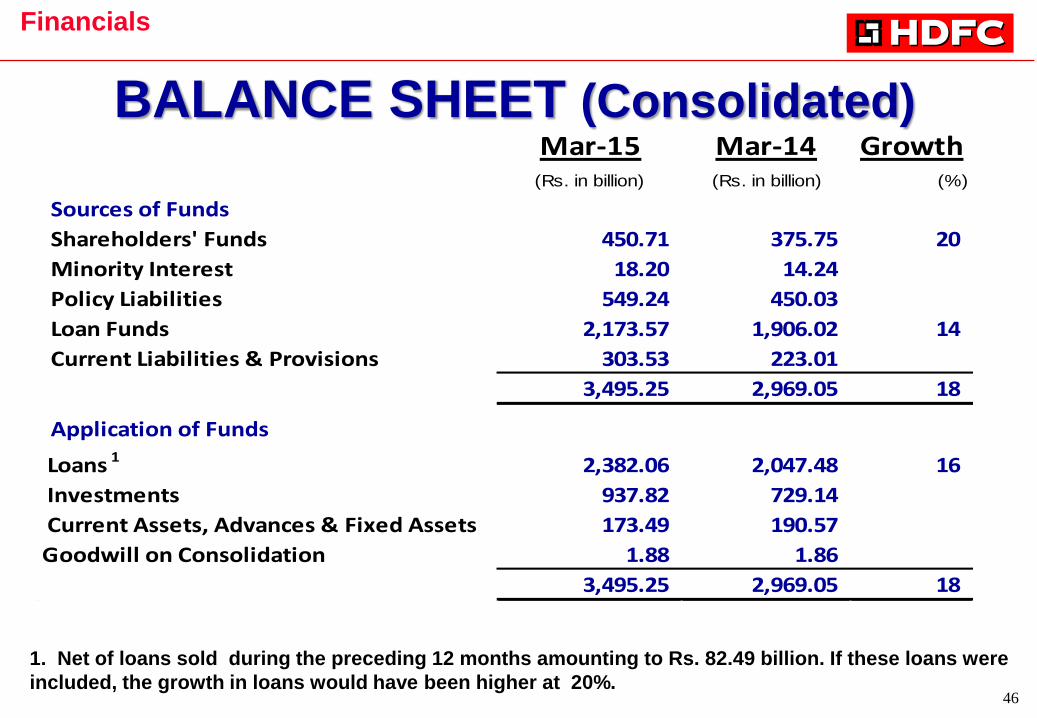
Mar-15 Mar-14 Growth(Rs. in billion) (Rs. in billion) (%)
Sources of Funds
Shareholders' Funds 450.71 375.75 20
Minority Interest 18.20 14.24
Policy Liabilities 549.24 450.03
Loan Funds 2,173.57 1,906.02 14
Current Liabilities & Provisions 303.53 223.01
3,495.25 2,969.05 18
Application of Funds
Loans 1 2,382.06 2,047.48 16
Investments 937.82 729.14
Current Assets, Advances & Fixed Assets 173.49 190.57
Goodwill on Consolidation 1.88 1.86
3,495.25 2,969.05 18
BALANCE SHEET (Consolidated)
Financials
1. Net of loans sold during the preceding 12 months amounting to Rs. 82.49 billion. If these loans were
included, the growth in loans would have been higher at 20%.
47
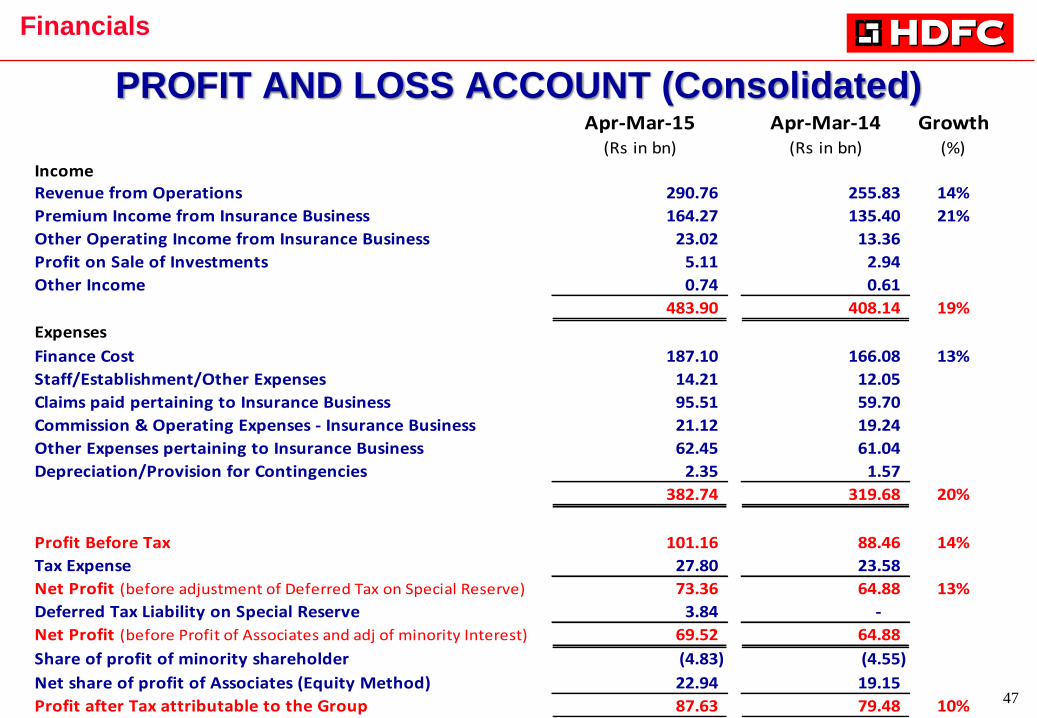
PROFIT AND LOSS ACCOUNT (Consolidated) Apr-Mar-15 Apr-Mar-14 Growth
(Rs in bn) (Rs in bn) (%)
Income
Revenue from Operations 290.76 255.83 14%
Premium Income from Insurance Business 164.27 135.40 21%
Other Operating Income from Insurance Business 23.02 13.36
Profit on Sale of Investments 5.11 2.94
Other Income 0.74 0.61
483.90 408.14 19%
Expenses
Finance Cost 187.10 166.08 13%
Staff/Establishment/Other Expenses 14.21 12.05
Claims paid pertaining to Insurance Business 95.51 59.70
Commission & Operating Expenses - Insurance Business 21.12 19.24
Other Expenses pertaining to Insurance Business 62.45 61.04
Depreciation/Provision for Contingencies 2.35 1.57
382.74 319.68 20%
Profit Before Tax 101.16 88.46 14%
Tax Expense 27.80 23.58
Net Profit (before adjustment of Deferred Tax on Special Reserve) 73.36 64.88 13%
Deferred Tax Liability on Special Reserve 3.84 -
Net Profit (before Profit of Associates and adj of minority Interest) 69.52 64.88
Share of profit of minority shareholder (4.83) (4.55)
Net share of profit of Associates (Equity Method) 22.94 19.15
Profit after Tax attributable to the Group 87.63 79.48 10%
Financials
48
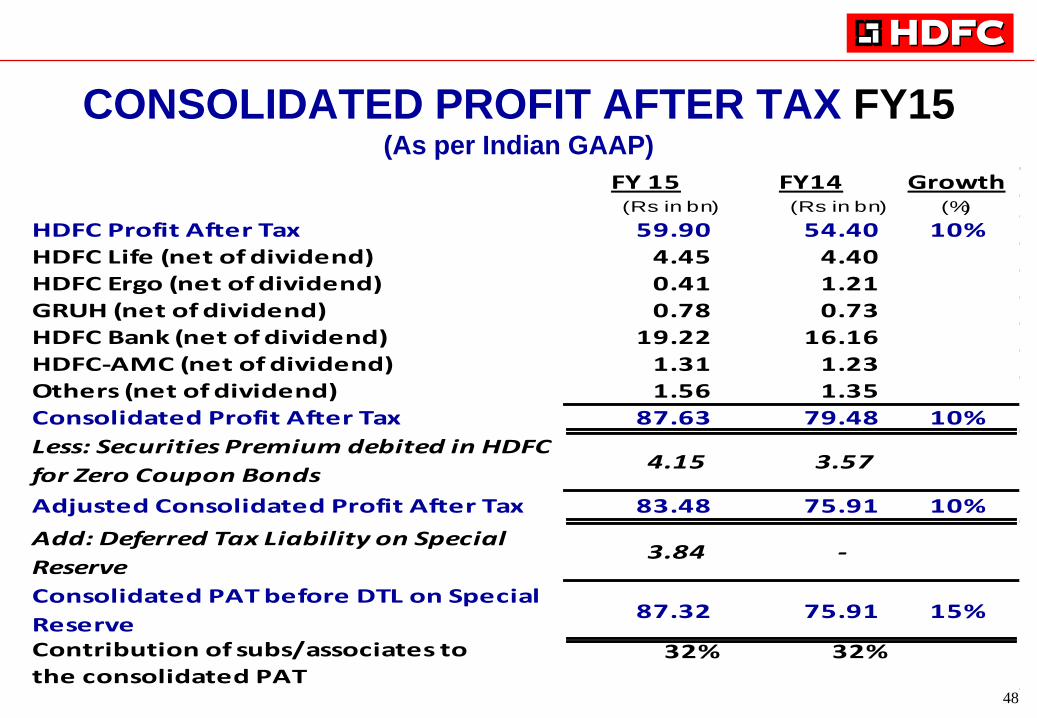
FY 15 FY14 Growth(Rs in bn) (Rs in bn) (%)
HDFC Profit After Tax 59.90 54.40 10%
HDFC Life (net of dividend) 4.45 4.40
HDFC Ergo (net of dividend) 0.41 1.21
GRUH (net of dividend) 0.78 0.73
HDFC Bank (net of dividend) 19.22 16.16
HDFC-AMC (net of dividend) 1.31 1.23
Others (net of dividend) 1.56 1.35
Consolidated Profit After Tax 87.63 79.48 10%
Less: Securities Premium debited in HDFC
for Zero Coupon Bonds4.15 3.57
Adjusted Consolidated Profit After Tax 83.48 75.91 10%
Add: Deferred Tax Liability on Special
Reserve3.84 -
Consolidated PAT before DTL on Special
Reserve87.32 75.91 15%
Contribution of subs/associates to 32% 32%the consolidated PAT
CONSOLIDATED PROFIT AFTER TAX FY15 (As per Indian GAAP)
49
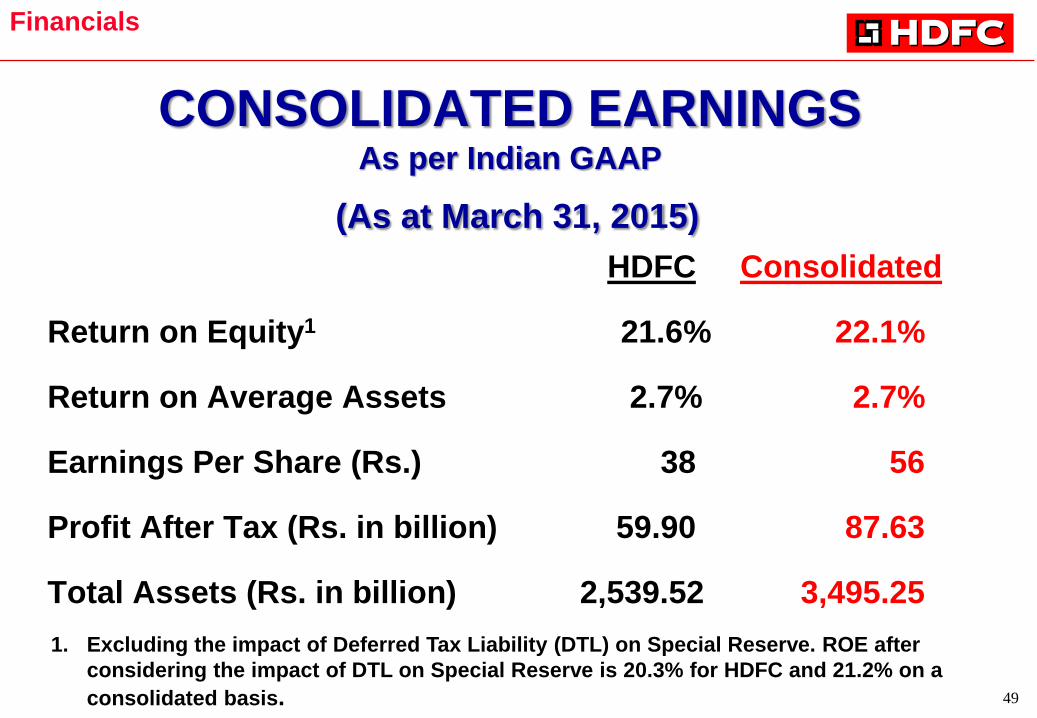
CONSOLIDATED EARNINGS As per Indian GAAP
(As at March 31, 2015)
HDFC Consolidated
Return on Equity1 21.6% 22.1%
Return on Average Assets 2.7% 2.7%
Earnings Per Share (Rs.) 38 56
Profit After Tax (Rs. in billion) 59.90 87.63
Total Assets (Rs. in billion) 2,539.52 3,495.25
Financials
1. Excluding the impact of Deferred Tax Liability (DTL) on Special Reserve. ROE after
considering the impact of DTL on Special Reserve is 20.3% for HDFC and 21.2% on a
consolidated basis.
50
AWARDS & ACCOLADES HDFC among the Top 5 Most Impactful Companies of the last decade – CNBC Awaaz, 2014
HDFC awarded the Best Loan Finance Bank & Best Overall Bank for Real Estate in India‟ at EUROMONEY Real
Estate Awards 2014
HDFC board recognised amongst the “Best Boards” by The Economic Times and Hay Group on India's Best
Boards for two consecutive years – 2013 and 2014.
Top Indian Company in the „Financial Institutions/Non-Banking Financial Companies/Financial Services‟
category at the Dun & Bradstreet Corporate Awards 2014. The Corporation has won this award seven times.
HDFC selected as the Best Home Loan Provider by CNBC Awaaz – CNBC Awaaz Real Estate Awards 2013
HDFC adjudged the „Best Home Loan Provider‟ for third consecutive year – Outlook Money Awards, 2013
Awarded the Qimpro-Best Prax Benchmark 2013 in Leadership Governance
HDFC is the only Indian company to be included in the fifth annual list of the „ 2011 World‟s Most Ethical
Companies‟ by Ethisphere Institute, USA
HDFC voted „Best Investor Relations‟ in India – Finance Asia‟s 2011 Annual Poll
HDFC ranked amongst India‟s best companies to work for – Great Place to Work Institute®, 2012
Awarded the „Best Foreign Enterprise with a Developmental Role in Housing Finance in Africa‟ – African Real
Estate & Housing Finance Academy
HDFC one of India‟s „Best Managed Companies‟ for two consecutive years – Finance Asia‟s 2010 and 2011
Annual Poll
51
Thank You
May 8, 2015