housing diversity and affordability in the city of north … paper...housing diversity and...
TRANSCRIPT

Cheryl Kathler | Community Planner | Community Development
Wendy Tse | Research Assistant | Community Development December 2011
Housing Diversity and Affordability in the City of North Vancouver
A Discussion Paper Prepared to Inform the Direction of a New Official Community Plan 2021

Table of Contents
1.0 INTRODUCTION .................................................................................................................................................... 1
1.1 Report Organization ............................................................................................................................................ 1
1.2 Data Limitations .................................................................................................................................................. 1
2.0 HOUSING IN THE CITY – 1986 to 2006 ................................................................................................................ 3
2.1 Structural Types in the City ................................................................................................................................. 4
2.1.1 Single Detached Dwellings .......................................................................................................................... 4
2.1.2 Duplexes ...................................................................................................................................................... 5
2.1.3 Townhouses ................................................................................................................................................. 6
2.1.4 Low Rise Apartments (Under 5 Storeys) ..................................................................................................... 7
2.1.5 High Rise Apartments (Over 5 Storeys) ...................................................................................................... 8
2.1.6 Secondary Suites ......................................................................................................................................... 9
2.1.7 Coach Houses ........................................................................................................................................... 10
2.2 Age of City’s Housing Stock.............................................................................................................................. 10
2.3 Housing Prices in the City ................................................................................................................................. 11
3.0 HOUSING AFFORDABILITY ................................................................................................................................ 15
3.1 Incidence of Low Income .................................................................................................................................. 16
3.2 Core Need Households and Spending at Least Half (INALH) .......................................................................... 17
4.0 RENTAL HOUSING 1986 – 2011 ......................................................................................................................... 18
4.1 Age of the Rental Housing Stock ...................................................................................................................... 19
4.2 Rental Housing Stock Estimates using City Data – 2000 and 2010 ................................................................. 20
4.3 Shifts in the Rental Stock - 2000-2010 ............................................................................................................. 22
4.4 Purpose-Built Rental Housing ........................................................................................................................... 23
4.5 Investment in the Purpose-Built Rental Stock ............................................................................................ 24
4.6 Inadequate Supply and High Rents .................................................................................................................. 24
4.6.1 Vacancy Rates ........................................................................................................................................ 24
4.6.2 Rent Payments ........................................................................................................................................ 25
4.7 Inability of Renters to ‘Afford’ Rents ................................................................................................................. 27
4.8 Renter Households in Core Need ..................................................................................................................... 28
4.9 Core Need Households and Spending at Least Half (INALH) .......................................................................... 28
5.0 CHALLENGES FOR 2021 .............................................................................................................................. 29
6.0 CONCLUSIONS .............................................................................................................................................. 31
1 | P a g e
1.0 INTRODUCTION
The City of North Vancouver’s current 2002 Official Community Plan (OCP) is based on a vision for a vibrant, diverse, and highly liveable community. By integrating land use planning with social, economic, and environmental considerations, the OCP sets the broad path to achieving a desirable and sustainable future.
Housing is a key element in the social and economic sustainability of the City. The City has identified goals and objectives to ensure a range of housing types and tenure are available to meet the diverse housing needs of the community. This entails maintaining and improving the existing housing stock, as well as finding opportunities to increase the number and types of affordable units in the community. By addressing the entire Housing Continuum, which encompasses the full range of housing options for households of all incomes, the City strives to create a community where there are viable housing options for people from all walks of life.
Providing accessible, affordable, and appropriate housing has long been a priority for the City, but the goal of creating a complete community has given it even greater importance. Accordingly, housing will continue to be a major focus in the updated OCP 2021.
1.1 Report Organization
As a background document for the OCP update, this report analyzes City housing trends between 1986 and 2011. In particular, this report seeks to answer:
How has the housing stock changed? What are the emerging issues for the City’s housing stock? What new approaches can be used to address these emerging issues?
The document consists of three sections. The first section describes how the City’s housing stock and land values have changed during this period. The second section details changes to the City’s rental housing stock, with particular emphasis on the last 10 years. The final section outlines some challenges the City’s housing stock is facing and discusses new approaches and strategies to help overcome them.
1.2 Data Limitations
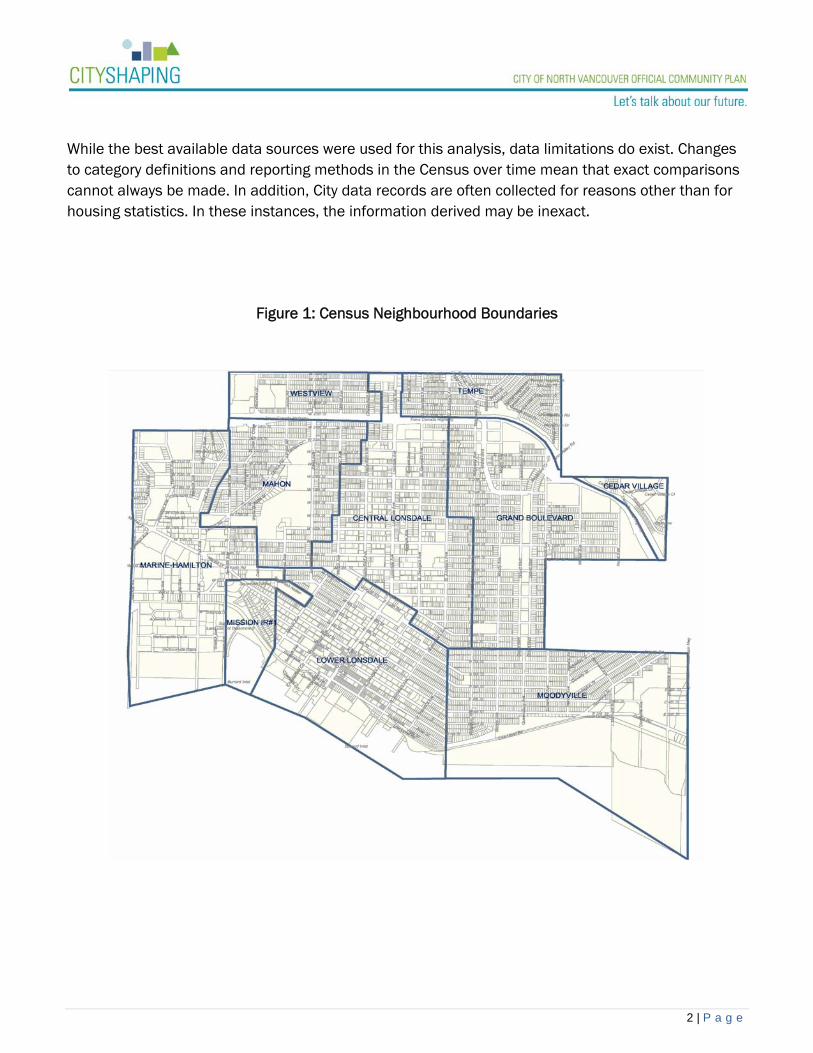
Data used in this report was accessed from Statistics Canada, Canada Mortgage and Housing Corporation (CMHC), Metro Vancouver, BC Assessment, the Real Estate Board of Greater Vancouver, and the City of North Vancouver. For trend analysis, neighbourhood-level census data was used for all nine City neighbourhoods: Cedar Village, Central Lonsdale, Grand Boulevard, Lower Lonsdale, Mahon, Marine Drive-Hamilton, Moodyville, and Tempe Heights (Figure 1). When neighbourhood-level data was unavailable, city-wide information was used.
2 | P a g e
While the best available data sources were used for this analysis, data limitations do exist. Changes to category definitions and reporting methods in the Census over time mean that exact comparisons cannot always be made. In addition, City data records are often collected for reasons other than for housing statistics. In these instances, the information derived may be inexact.
Figure 1: Census Neighbourhood Boundaries

3 | P a g e
2.0 HOUSING IN THE CITY – 1986 to 2006
The City of North Vancouver is home to a diverse and growing population. To ensure attainable housing options are available to residents, the City supports a diverse housing stock – in type, size, tenure, and location – to accommodate the variety of housing needs in the community.
The City has seen a significant increase in its housing stock in the past two decades. Since 1986, the City’s housing supply has grown by 4,175 units, for a total of 21,350 dwelling units in 2006 (Figure 2). While housing units were built in all neighbourhoods during this period, the Lower Lonsdale and Central Lonsdale neighbourhoods accommodated approximately 74% of the development. Residential construction has remained strong since 2006, with the addition of 1,095 dwelling units as of August 2011.
Figure 2: Figure 1: Total Number of Dwelling Units, 1986-2006 (Source: Statistics Canada, 1986-2006 Census)
During this period, the City also experienced a steady rise in homeownership (Figure 3). In fact, the number of owner households surpassed the number of renter households in the City in approximately 2003. Renting remains an important form of tenure in the City though, as nearly 46% of households are renters according to the latest Census results. With almost half of the City’s households made up of renters, the City’s percentage is significantly higher than the other North Shore municipalities (District of North Vancouver - 18% and District of West Vancouver - 23%), as well as the entire Metro Vancouver region at 35% (Statistics Canada, 2006).
17,175
18,220
19,545
20,705
21,350
15,000
16,000
17,000
18,000
19,000
20,000
21,000
22,000
1986 1991 1996 2001 2006

4 | P a g e
Figure 3: Total Number of Dwelling Units, 1986-2006 (Source: Statistics Canada, 1986-2006 Census)
2.1 Structural Types in the City
2.1.1 Single Detached Dwellings
The number of single detached dwellings has decreased in most City neighbourhoods since 1991 (Figure 4). The decrease in this structural type has been prompted by greater densification in certain areas, particularly the Lower Lonsdale and Central Lonsdale neighbourhoods, which together make up the Lonsdale Regional City Centre. The only neighbourhood to show an increase in single detached dwellings in 2006 was Cedar Village.
While there is a definite trend towards fewer single family homes in the City, the dramatic decrease in some neighbourhoods is likely due to a misclassification of this structural type based on a definition change to the 2006 Census, rather than an actual loss in this type of housing. The 2006 Census changed the category, ‘apartment or flat in a detached duplex’, to ‘apartment or flat in a duplex’, which in effect, broadened the definition of ‘duplex’ to include single detached houses with secondary suites. As a result, the number of single detached dwellings declined significantly in the 2006 Census, with a corresponding increase in the ‘apartment or flat in a duplex’ category. In actual fact, the number of single detached dwellings has increased in the Grand Boulevard, Mahon and Moodyville neighbourhoods due to the subdivision of large lots.
6170
7480
8720
9940
1151510920 10750 10765 10725
9830
5000
7000
9000
11000
1986 1991 1996 2001 2006
Homeowners Renters

5 | P a g e
Figure 4: Number of Single Detached Dwellings by Neighbourhood, 1991-2006
(Source: Statistics Canada, 1991-2006 Census)
2.1.2 Duplexes
A duplex, or semi-detached house, is a structure where one of two dwellings are attached side by side (or back to front) to each other, has no dwelling either above or below it, and the two units together have open space on all sides (Statistics Canada, 2006). The City has seen a substantial increase in duplexes in the Central Lonsdale and Lower Lonsdale neighbourhoods since 1991 (Figure 5). Moodyville also saw a modest growth in this structural type between 2001 and 2006, increasing by 20 units. Conversely, Grand Boulevard lost approximately 55 duplex units since 2001.
Relatively high land values in the City may be encouraging the construction of more duplexes. As a popular form of more compact living, as well as a more affordable option to a single detached house, many duplexes are being built to replace older single detached dwellings.
30
570
1055
215
635
275
845
545
330
45
415
1140
165
620
255
615
490
335
10
545
1050
120
665
255
640
485
350
25
390
855
80
490
215
550
455
295
0
200
400
600
800
1000
1200
1991 1996 2001 2006
6 | P a g e
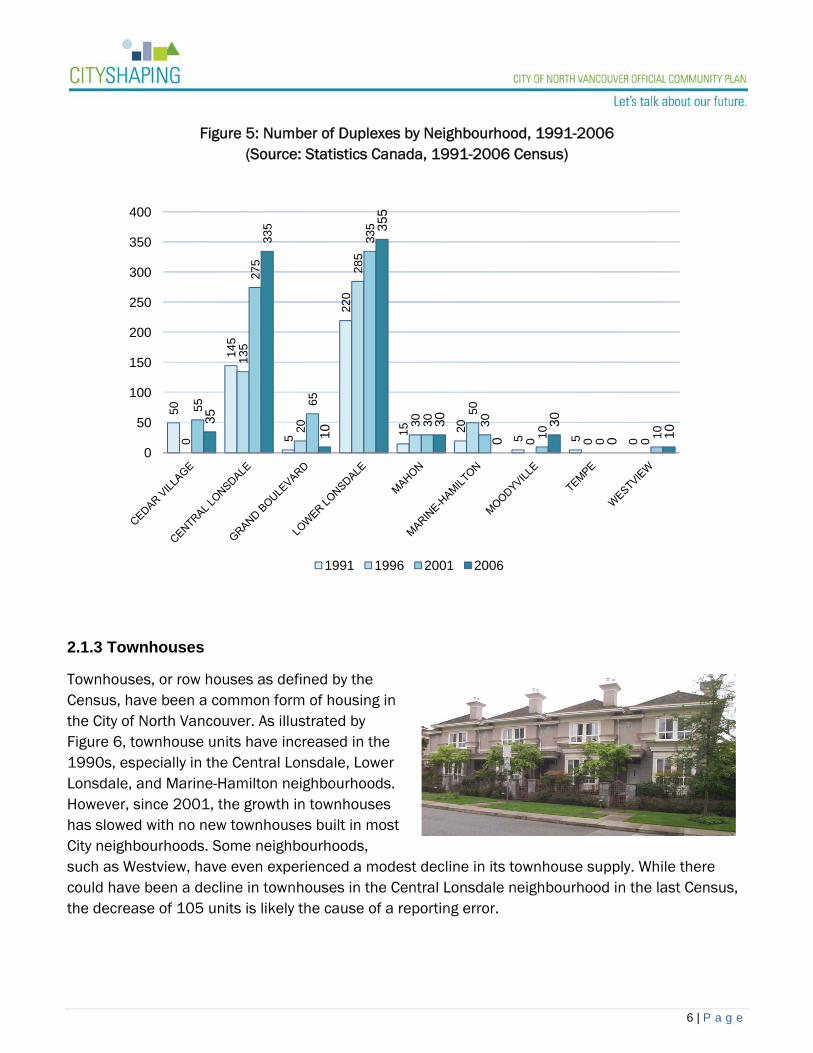
Figure 5: Number of Duplexes by Neighbourhood, 1991-2006
(Source: Statistics Canada, 1991-2006 Census)
2.1.3 Townhouses
Townhouses, or row houses as defined by the Census, have been a common form of housing in the City of North Vancouver. As illustrated by Figure 6, townhouse units have increased in the 1990s, especially in the Central Lonsdale, Lower Lonsdale, and Marine-Hamilton neighbourhoods. However, since 2001, the growth in townhouses has slowed with no new townhouses built in most City neighbourhoods. Some neighbourhoods, such as Westview, have even experienced a modest decline in its townhouse supply. While there could have been a decline in townhouses in the Central Lonsdale neighbourhood in the last Census, the decrease of 105 units is likely the cause of a reporting error.
50
145
5
220
15 20
5 5 00
135
20
285
30
50
0 0 0
55
275
65
335
30 30
10 0 10
35
335
10
355
30
0
30
0 10
0
50
100
150
200
250
300
350
400
1991 1996 2001 2006

7 | P a g e
Figure 6: Number of Townhouses by Neighbourhood, 1991-2006 (Source: Statistics Canada, 1991-2006 Census)
2.1.4 Low Rise Apartments (Under 5 Storeys)
The neighbourhoods of Central Lonsdale and Lower Lonsdale have continued to accommodate the majority of low rise apartments over the past four Census periods (Figure 7). The Marine-Hamilton neighbourhood also experienced growth in this structural type during this period, with the addition of
145 units. Overall, the Census reports decreasing numbers in low rise apartments in all neighbourhoods zoned for this structural type. In particular, the Lower Lonsdale neighbourhood saw a decline of 175 units between 2001 and 2006, due to the redevelopment of existing low rise apartments to higher density developments.
As was the case in the single detached dwelling category, a definition change in the 2006 Census has affected the accurate classification of low rise
apartments. Prior to the reclassification of ‘apartment or flat in a detached duplex’ to ‘apartment or flat in a duplex’, a duplex that was attached to other dwellings or buildings would be considered an ‘apartment in a building that has fewer than five storeys (Statistics Canada, 2006). Consequently, the growth in the number of low rise apartment units in a single detached dwelling neighbourhood such as Grand Boulevard, between 2001 and 2006, is likely a misclassification.
195
415
0
190
5
350
10 5
120
235
520
0
240
0
235
15 0
125
205
685
0
350
10
420
10 0
135
205
580
0
380
10
420
55
0
120
0
100
200
300
400
500
600
700
1991 1996 2001 2006

8 | P a g e
Figure 7: Number of Low Rise Apartments by Neighbourhood, 1991-2006 (Source: Statistics Canada, 1991-2006 Census)
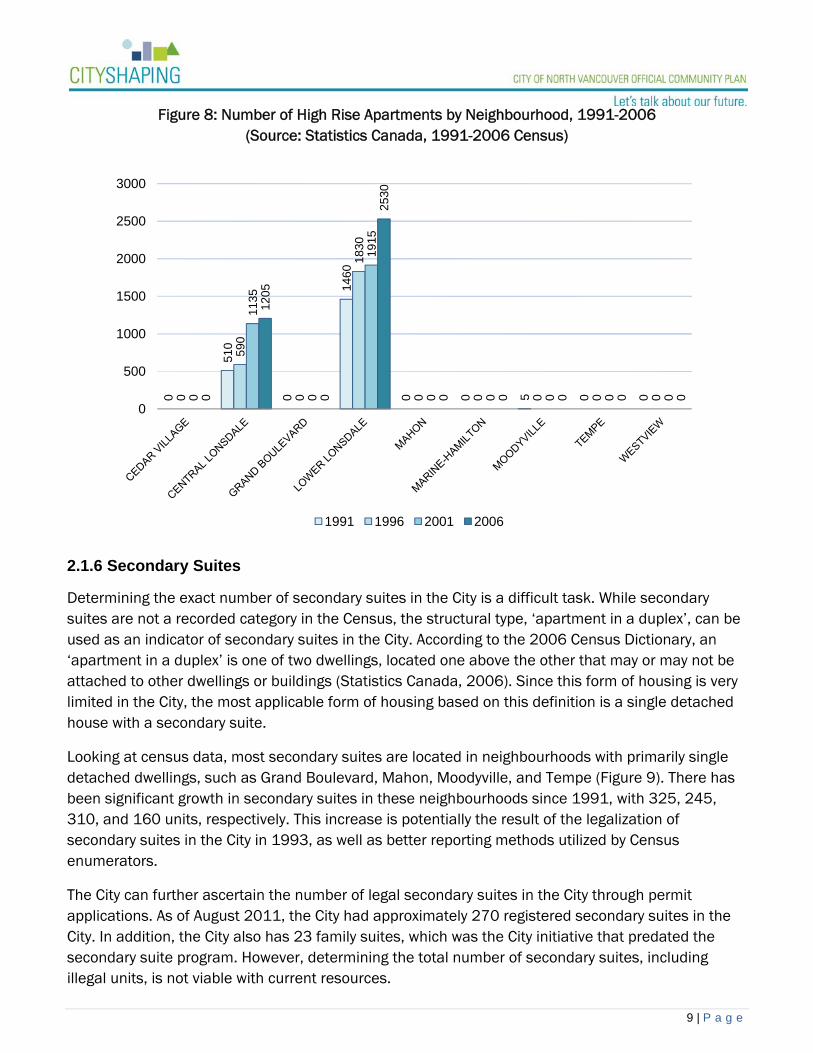
2.1.5 High Rise Apartments (Over 5 Storeys)
Facilitated by the Lonsdale Regional City Centre designation, the growth in high rise apartment buildings (over 5 storeys) has been concentrated in the Lower Lonsdale and Central Lonsdale neighbourhoods (Figure 8). The growth has been quite substantial for both neighbourhoods, with the addition of 695 dwellings in Central Lonsdale and 1,070 units in Lower Lonsdale between 1991 and 2006. Part of the City’s overall vision is to create attractive high-density mixed-use areas in these neighbourhoods served by a vibrant retail and commercial Lonsdale Corridor.
0
3805
35
4385
145
130
20 65 180
0
3965
15
4505
75
340
55 20 180
0
3660
0
4965
70 215
15 20 160
0
3925
30
4790
105
275
40 0
180
0
1000
2000
3000
4000
5000
1991 1996 2001 2006
9 | P a g e
Figure 8: Number of High Rise Apartments by Neighbourhood, 1991-2006 (Source: Statistics Canada, 1991-2006 Census)
2.1.6 Secondary Suites
Determining the exact number of secondary suites in the City is a difficult task. While secondary suites are not a recorded category in the Census, the structural type, ‘apartment in a duplex’, can be used as an indicator of secondary suites in the City. According to the 2006 Census Dictionary, an ‘apartment in a duplex’ is one of two dwellings, located one above the other that may or may not be attached to other dwellings or buildings (Statistics Canada, 2006). Since this form of housing is very limited in the City, the most applicable form of housing based on this definition is a single detached house with a secondary suite.
Looking at census data, most secondary suites are located in neighbourhoods with primarily single detached dwellings, such as Grand Boulevard, Mahon, Moodyville, and Tempe (Figure 9). There has been significant growth in secondary suites in these neighbourhoods since 1991, with 325, 245, 310, and 160 units, respectively. This increase is potentially the result of the legalization of secondary suites in the City in 1993, as well as better reporting methods utilized by Census enumerators.
The City can further ascertain the number of legal secondary suites in the City through permit applications. As of August 2011, the City had approximately 270 registered secondary suites in the City. In addition, the City also has 23 family suites, which was the City initiative that predated the secondary suite program. However, determining the total number of secondary suites, including illegal units, is not viable with current resources.
0
510
0
1460
0 0 5 0 00
590
0
1830
0 0 0 0 00
1135
0
1915
0 0 0 0 00
1205
0
2530
0 0 0 0 0
0
500
1000
1500
2000
2500
3000
1991 1996 2001 2006

10 | P a g e
Figure 9: Number of Secondary Suites by Neighbourhood, 1991-2006
(Source: Statistics Canada, 1991-2006 Census)
2.1.7 Coach Houses
While coach houses have been present in the City since the early 1900s, this form of housing was formally recognized in the zoning bylaw in 2010, which now permits coach houses to be built in the RS (single family residential) zone. It is too early in the process to note any trends, but between April 2010, when the bylaw passed, and October 2011, the City has received 17 applications and has issued nine coach house permits.
2.2 Age of City’s Housing Stock
Approximately 64% of all dwellings units in the City were built prior to 1980 (Figure 10). Residential growth after 1980 has been relatively slow with the exception of the Central Lonsdale and Lower Lonsdale neighbourhoods, which accommodated 2,600 and 3,310 units, respectively, or 76% of the total dwellings units built after 1980. The growth in both neighbourhoods has been part of the City’s efforts to develop the Lonsdale Regional City Centre. The other neighbourhoods to experience moderate growth since 1980 include Marine-Hamilton and Tempe.
The majority of residential dwellings in single family neighbourhoods were also built prior to 1980. For example, in the Grand Boulevard, Mahon, Moodyville, and Tempe neighbourhoods, 89% of the dwellings were built before 1980. The Marine-Hamilton neighbourhood has experienced more growth recently and the upcoming 2011 Census should reflect t this fact.
5
230
300
135
145
15
105
80
0
285
450
115
225
40
450
10
210
355
185 25
0
20
415
0
275
625
85
390
90
415
240
0
100
200
300
400
500
600
700
1991 1996 2001 2006

11 | P a g e
Figure 10: Age of City’s Housing Stock by Neighbourhood
(Source: Statistics Canada, 2006 Census)
2.3 Housing Prices in the City
Housing prices in the City of North Vancouver have increased significantly over the last 10 years. A report generated from the Real Estate Board of Greater Vancouver shows the rising real estate prices in the City between 2000 and August 2011 (Table 1).
185
4,15
0
1,27
0
4,95
0
790
350
960
335 59
0
85
2,60
0
260
3,31
0
230 65
0
125 36
0
140
0
1,000
2,000
3,000
4,000
5,000
Constructed prior to 1980 Constructed after 1980

12 | P a g e
Table 1: Housing Prices in the City, 2000-August 2011 (Source: Real Estate Board of Greater Vancouver, 2011)
Year Detached
House
Townhouse under 2 years old (1200 sq ft)
Apartment under 2 years old (750 sq ft)
Apartment 10 to 15 years old (750 sq ft)
2000 $335,000 $216,000 $129,176 $130,654
2001 $374,833 $203,601 $175,129 $145,680
2002 $402,225 $258,997 $188,605 $145,239
2003 $ 474,600 $333,543 $228,510 $160,366
2004 $531,070 $345,045 $269,122 $229,866
2005 $586,367 $390,398 $317,051 $262,772
2006 $718,593 $495,344 $367,493 $299,458
2007 $795,938 $528,889 $464,076 $332,652
2008 $815,490 $574,692 $435,249 $341,061
2009 $789,021 $508,475 $423,386 $337,089
2010 $866,518 $638,400 $438,000 $370,750
2011 $913,695 $721,404 $414,368 $361,500
Totals Change 2000-
2011 +$578,695 +$505,404 +$285,192 +$230,846
Percent Increase
2000-2011 173% 234% 221% 177%
In summary, the table above shows that since 2000, prices have increased as such:
A single detached house in the City increased by 173%. A 1200 sq. ft. townhouse increased by 234%. A 750 sq. ft. 1 bedroom apartment under two years old increased by 221%. A 750 sq. ft. 1 bedroom apartment 10 to 15 years old increased by 177%.
Over the same period, the change in inflation in Canada was 23.9% (Statistics Canada, 206). For the Province of British Columbia, the change in the average weekly wage rate was $209.17 or an increase of 24% from 2000 to 2011 (BC Stats, 2011).

13 | P a g e
While the cost of housing has historically been relatively expensive in the City of North Vancouver, the past 10 years has been especially severe. For example, in 1981, the cost of housing was approximately 7 times the average household income (Figure 11). This gap decreased in 1986 due to an economic recession, but has steadily increased since. More recently in 2006, the cost of housing was 10 times greater than the average household income in the City. The growing difference between income and housing prices means that many residents continue to have insufficient income to secure quality, affordable housing.
Figure 11: Average Household Income and Average Housing Price, 1981-2006
(Source: Statistics Canada, 1986-2006 Census)
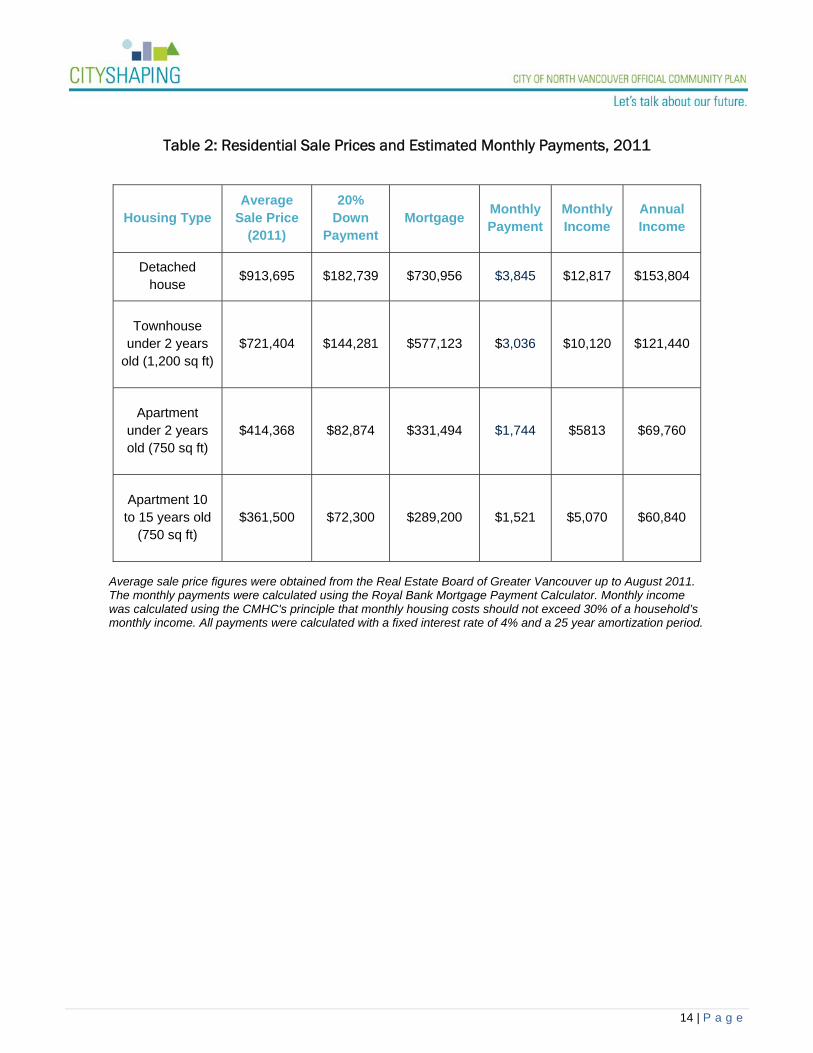
With housing prices increasing at this rapid rate, the income required to afford a dwelling in the City is, unfortunately, beyond what most residents earn. For example, while the average household income in the City is $57,197, the annual income needed to support a mortgage for a single detached house is $153,804 (Table 2). Furthermore, the median annual household income is even less at $49,486 (Statistics Canada, 2006). With the gap between household income and housing costs increasing, being able to obtain housing that is affordable, which the Canadian Mortgage and Housing Corporation defines as housing that does not exceed 30% of a household’s gross income, is proving very difficult in the City.
$56,
969
$55,
102
$61,
167
$63,
476
$66,
256
$57,
197
$383
,053
$205
,594
$308
,658
$353
,473
$327
,034
$549
,033
$0
$100,000
$200,000
$300,000
$400,000
$500,000
$600,000
1981 1986 1991 1996 2001 2006
Average Household Income Average Housing Price
14 | P a g e
Table 2: Residential Sale Prices and Estimated Monthly Payments, 2011
Average sale price figures were obtained from the Real Estate Board of Greater Vancouver up to August 2011. The monthly payments were calculated using the Royal Bank Mortgage Payment Calculator. Monthly income was calculated using the CMHC's principle that monthly housing costs should not exceed 30% of a household’s monthly income. All payments were calculated with a fixed interest rate of 4% and a 25 year amortization period.
Housing Type Average
Sale Price (2011)
20% Down
Payment Mortgage
Monthly Payment
Monthly Income
Annual Income
Detached house
$913,695 $182,739 $730,956 $3,845 $12,817 $153,804
Townhouse under 2 years
old (1,200 sq ft) $721,404 $144,281 $577,123 $3,036 $10,120 $121,440
Apartment under 2 years old (750 sq ft)
$414,368 $82,874 $331,494 $1,744 $5813 $69,760
Apartment 10 to 15 years old
(750 sq ft) $361,500 $72,300 $289,200 $1,521 $5,070 $60,840

15 | P a g e
3.0 HOUSING AFFORDABILITY
With current real estate values so high, few households can afford to both live and work in the City of North Vancouver. Table 3 shows the starting salary for various employment positions available in the City, as well as the gap between what they earn and what they need to pay to own a home in the City.
Table 3: Income and Homeowner Payments for Common Employment Positions in the City
Employment Position
Average Annual Salary
30% of Monthly Income
Monthly Salary Gap for
townhouses under 2 years
old
Monthly Salary Gap for
Apartments under two years old
Monthly Salary Gap for
Apartments 10 to 15 years old
Banking, Insurance and
Other Financial
Clerks
$33,013 $825 -$2,211 -$919 -$696
Bus Driver $35,159 $879 -$2,157 -$865 -$642
Coffee Barista $17,550 $439 -$2,597 -$1,305 -$1,082
Hairstylist $24,102 $603 -$2,433 -$1,141 -$918
Registered Nurse
$61,679 $1542 -$1,494 -$202 +$21
Nurse Aid $37,050 $926 -$2,110 -$818 -$595
Teacher $41,730 $1,043 -$1,993 -$701 -$478
Average annual salary figures calculated from the 2009 BC Wage & Salary Survey (BC Stats, 2011), except for coffee barista, which was calculated using the wage of $9 per hour. Average annual salaries were calculated assuming a 37.5 hour work week, excluding overtime. Salary gap refers to the difference between 30% of monthly household income and housing mortgage payments (Table 2).
It is evident from Table 3 that for the employment positions listed, the income earned is inadequate to meet the affordability principle of spending less than 30% on housing (CMHC, 2011). Furthermore, these payment figures do not include other household costs, including electricity, heating, maintenance fees, as well as other necessities. High real estate prices appear to defy the City’s attempt to meet the housing and affordability objectives expressed in the 2002 Official Community Plan.

16 | P a g e
3.1 Incidence of Low Income
The City has traditionally been known for having a higher incidence of low income households than the other North Shore municipalities. However, the City has seen its incidence of low income in private households declined slightly over the last 20 year as shown in Table 4.
Table 4: Incidence of Low Income in the City, 1986-2006 (Source: Statistics Canada, 1986-2006 Census)
Year Incidence of Low Income in
the City
1986 22.9%
1991 21.2%
1996 25.0%
2001 21.2%
2006 20.3%
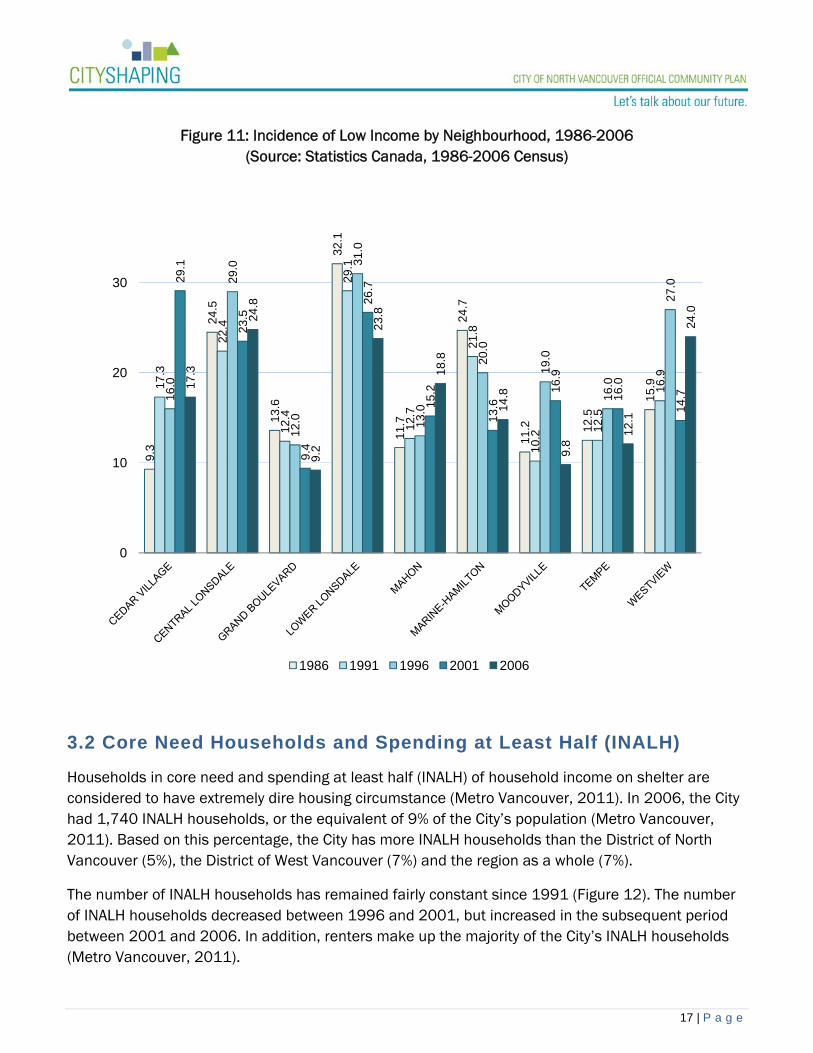
While the incidence of low income has declined in the City overall, the incidence level for each City neighbourhood is notably different. For example, between 1986 and 2006, the neighbourhoods of Grand Boulevard, Lower Lonsdale, Marine-Hamilton, Moodyville, and Tempe all experienced a decrease in the incidence of low income (Figure 11). The decline in Lower Lonsdale, Marine-Hamilton, and Moodyville are likely the result of new residents with higher incomes purchasing new apartment units. The Westview neighbourhood also saw a significant decline in its level of low income between 1996 and 2001. This particular decrease may be the result of a large townhouse project changing from rental tenure to limited share ownership.
The only neighbourhoods to see an increase in low income residents between 1986 and 2006 is Cedar Village, Mahon, and Westview. The cause for this increase could be due to homeowners in these neighbourhoods accommodating renters in secondary suites, which tend to be a more affordable housing option. Overall, the number of low income residents has remained relatively constant in the City.
17 | P a g e
Figure 11: Incidence of Low Income by Neighbourhood, 1986-2006
(Source: Statistics Canada, 1986-2006 Census)
3.2 Core Need Households and Spending at Least Half (INALH)
Households in core need and spending at least half (INALH) of household income on shelter are considered to have extremely dire housing circumstance (Metro Vancouver, 2011). In 2006, the City had 1,740 INALH households, or the equivalent of 9% of the City’s population (Metro Vancouver, 2011). Based on this percentage, the City has more INALH households than the District of North Vancouver (5%), the District of West Vancouver (7%) and the region as a whole (7%).
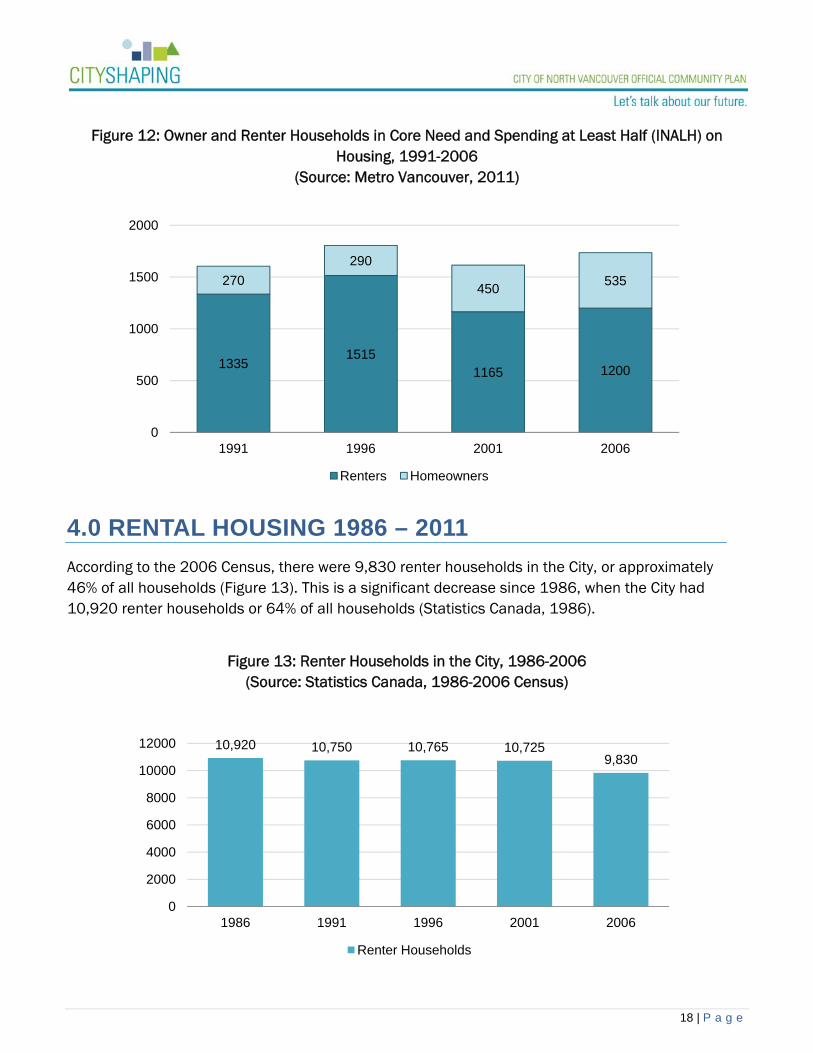
The number of INALH households has remained fairly constant since 1991 (Figure 12). The number of INALH households decreased between 1996 and 2001, but increased in the subsequent period between 2001 and 2006. In addition, renters make up the majority of the City’s INALH households (Metro Vancouver, 2011).
9.3
24.5
13.6
32.1
11.7
24.7
11.2 12
.5
15.917
.3
22.4
12.4
29.1
12.7
21.8
10.2
12.5
16.9
16.0
29.0
12.0
31.0
13.0
20.0
19.0
16.0
27.029
.1
23.5
9.4
26.7
15.2
13.6
16.9
16.0
14.7
17.3
24.8
9.2
23.8
18.8
14.8
9.8
12.1
24.0
0
10
20
30
1986 1991 1996 2001 2006
18 | P a g e
Figure 12: Owner and Renter Households in Core Need and Spending at Least Half (INALH) on
Housing, 1991-2006 (Source: Metro Vancouver, 2011)
4.0 RENTAL HOUSING 1986 – 2011
According to the 2006 Census, there were 9,830 renter households in the City, or approximately 46% of all households (Figure 13). This is a significant decrease since 1986, when the City had 10,920 renter households or 64% of all households (Statistics Canada, 1986).
Figure 13: Renter Households in the City, 1986-2006
(Source: Statistics Canada, 1986-2006 Census)
13351515
1165 1200
270
290
450535
0
500
1000
1500
2000
1991 1996 2001 2006
Renters Homeowners
10,920 10,750 10,765 10,7259,830
0
2000
4000
6000
8000
10000
12000
1986 1991 1996 2001 2006
Renter Households
19 | P a g e
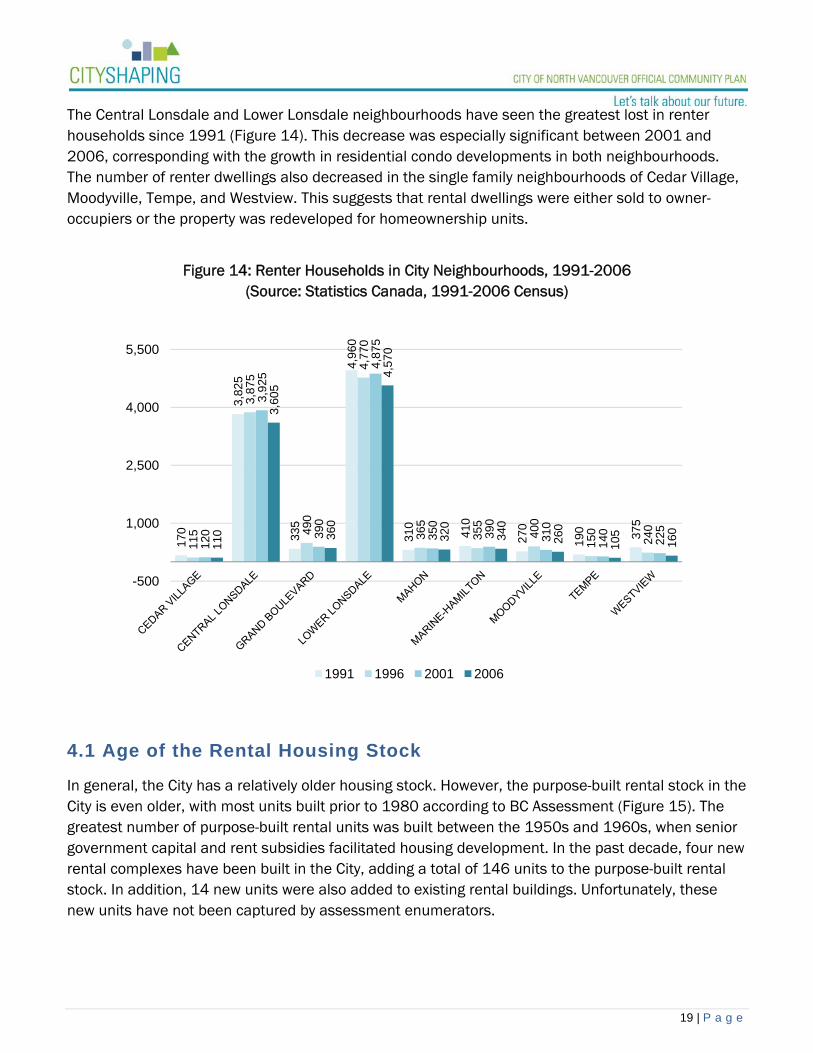
The Central Lonsdale and Lower Lonsdale neighbourhoods have seen the greatest lost in renter households since 1991 (Figure 14). This decrease was especially significant between 2001 and 2006, corresponding with the growth in residential condo developments in both neighbourhoods. The number of renter dwellings also decreased in the single family neighbourhoods of Cedar Village, Moodyville, Tempe, and Westview. This suggests that rental dwellings were either sold to owner-occupiers or the property was redeveloped for homeownership units.
Figure 14: Renter Households in City Neighbourhoods, 1991-2006
(Source: Statistics Canada, 1991-2006 Census)
4.1 Age of the Rental Housing Stock
In general, the City has a relatively older housing stock. However, the purpose-built rental stock in the City is even older, with most units built prior to 1980 according to BC Assessment (Figure 15). The greatest number of purpose-built rental units was built between the 1950s and 1960s, when senior government capital and rent subsidies facilitated housing development. In the past decade, four new rental complexes have been built in the City, adding a total of 146 units to the purpose-built rental stock. In addition, 14 new units were also added to existing rental buildings. Unfortunately, these new units have not been captured by assessment enumerators.
170
3,82
5
335
4,96
0
310
410
270
190 37
5
115
3,87
5
490
4,77
0
365
355
400
150
240
120
3,92
5
390
4,87
5
350
390
310
140
225
110
3,60
5
360
4,57
0
320
340
260
105
160
-500
1,000
2,500
4,000
5,500
1991 1996 2001 2006

20 | P a g e
Consequently, the City now faces an aging housing stock that requires a variety of minor and major repairs. Based on the 2006 census results, 24% of the City’s housing stock is in need of minor repair and 8% requires major repairs. With much of the purpose-built rental stock also in need of repairs, rental building owners face increasing pressure to sell or re-develop. Any loss in the dedicated rental stock affects the availability of affordable rental options in the City.
Figure 15: Period of Construction for Purpose-Built Rental Units, 1900-2010 (Source: BC Assessment, 2011 and City of North Vancouver, 2011)
4.2 Rental Housing Stock Estimates using City Data – 2000 and 2010
The City of North Vancouver collects limited information about rental housing from building permits, property tax information, and other municipal records. Based on this data, information about rental housing in the City was obtained for the years 2000 and 2010.
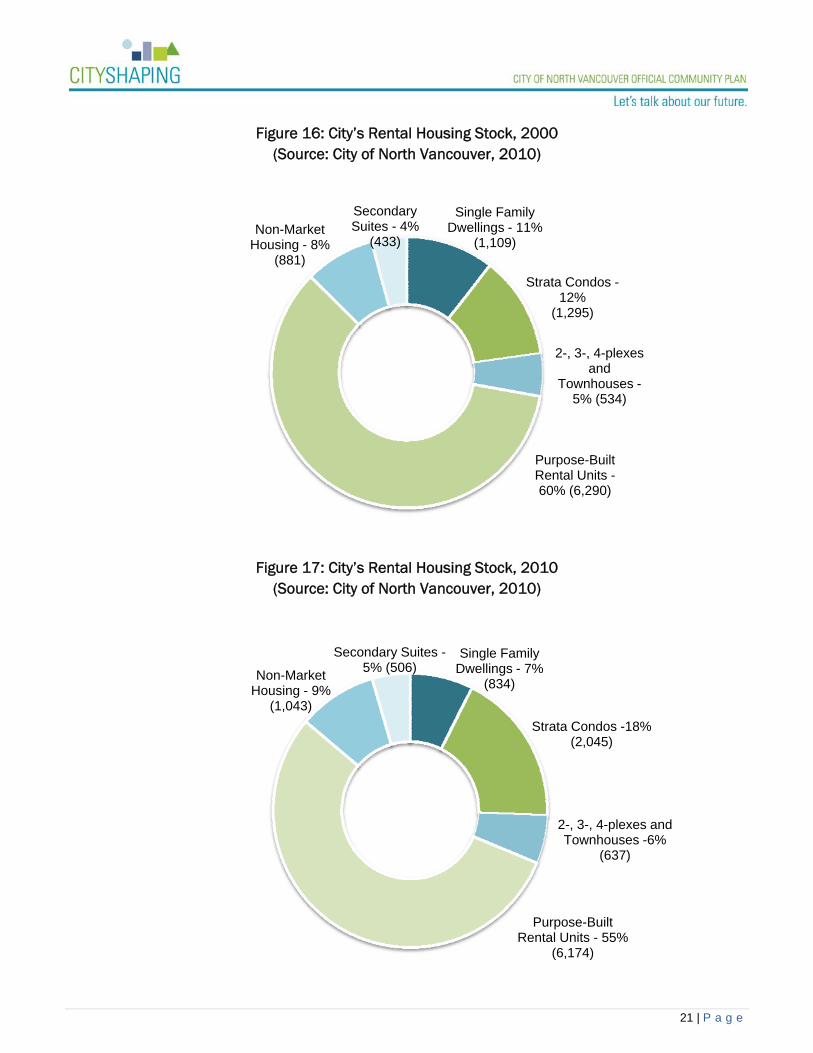
In 2000, approximately 60% of the City’s rental units were located in purpose-built rental buildings (Figure 16). Strata condo units were the next most common rental type at 12%, followed closely by single family dwellings at 11%.
In comparison, purpose-built rental units only made up 55% of the City’s rental stock in 2010, a decrease of 5% from a decade earlier (Figure 17). Rental units in single family dwellings also decreased during this period, from 11% to 7%. Strata condo rentals increased by 6%, for a total of 18% of the City’s overall rental supply.
18 45 0 0 24
1028
3669
2441
0 0146
00
1000
2000
3000
4000
1900 1910 1920 1930 1940 1950 1960 1970 1980 1990 2000 2010
21 | P a g e
Figure 16: City’s Rental Housing Stock, 2000
(Source: City of North Vancouver, 2010)
Figure 17: City’s Rental Housing Stock, 2010 (Source: City of North Vancouver, 2010)
Single Family Dwellings - 11%
(1,109)
Strata Condos -12%
(1,295)
Secondary Suites - 4%
(433)
2-, 3-, 4-plexes and
Townhouses -5% (534)
Purpose-Built Rental Units -60% (6,290)
Non-Market Housing - 8%
(881)
Single Family Dwellings - 7%
(834)
Strata Condos -18% (2,045)
2-, 3-, 4-plexes and Townhouses -6%
(637)
Secondary Suites -5% (506)
Purpose-Built Rental Units - 55%
(6,174)
Non-Market Housing - 9%
(1,043)
22 | P a g e
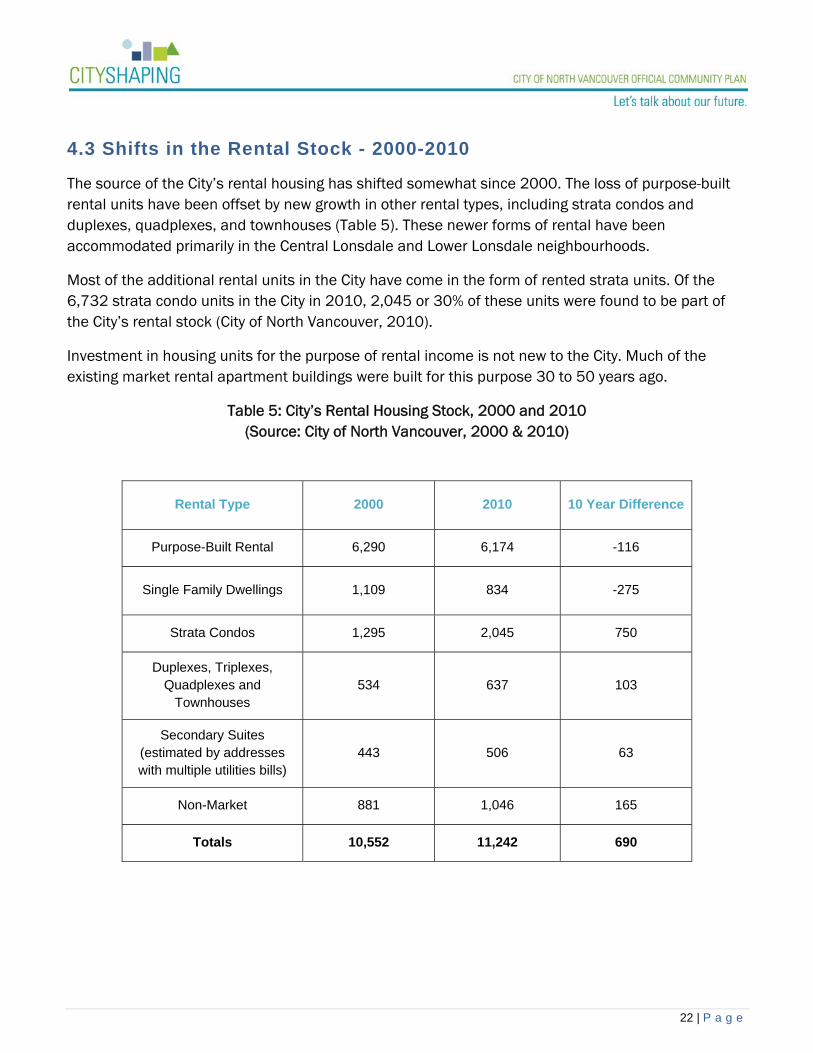
4.3 Shifts in the Rental Stock - 2000-2010
The source of the City’s rental housing has shifted somewhat since 2000. The loss of purpose-built rental units have been offset by new growth in other rental types, including strata condos and duplexes, quadplexes, and townhouses (Table 5). These newer forms of rental have been accommodated primarily in the Central Lonsdale and Lower Lonsdale neighbourhoods.
Most of the additional rental units in the City have come in the form of rented strata units. Of the 6,732 strata condo units in the City in 2010, 2,045 or 30% of these units were found to be part of the City’s rental stock (City of North Vancouver, 2010).
Investment in housing units for the purpose of rental income is not new to the City. Much of the existing market rental apartment buildings were built for this purpose 30 to 50 years ago.
Table 5: City’s Rental Housing Stock, 2000 and 2010 (Source: City of North Vancouver, 2000 & 2010)
Rental Type 2000 2010 10 Year Difference
Purpose-Built Rental 6,290 6,174 -116
Single Family Dwellings 1,109 834 -275
Strata Condos 1,295 2,045 750
Duplexes, Triplexes, Quadplexes and
Townhouses 534 637 103
Secondary Suites (estimated by addresses with multiple utilities bills)
443 506 63
Non-Market 881 1,046 165
Totals 10,552 11,242 690

23 | P a g e
4.4 Purpose-Built Rental Housing
Purpose-built rental housing is an important component of the City’s rental housing stock. While the term, ‘purpose-built’, has historically referred to low and high rise apartment buildings built as rental housing, other forms of housing, such as non-market housing and secondary suites, are also built with this intention (City of North Vancouver, 2001).
Based on City records, 116 units were lost from the licensed purpose-built rental stock in the last 10 years, or approximately 12 units per year. This limited loss is likely the result of City efforts to maintain its purpose-built rental stock. For example, strata conversion controls came into effect in 1979.
Another important form of rental housing in the City is secondary suites. In 2000, secondary suites represented at least 4% of the City’s rental housing stock, with 113 legal secondary suites and 40 family suites (City of North Vancouver, 2001). In August 2011, the number of legal secondary suites increased to 270 units, while family suites declined to 25 units (City of North Vancouver, 2011). With secondary suites becoming common additions to single family dwellings, the number of these units will likely continue to increase.
Determining the exact number of illegal secondary suites is a challenge. One potential estimate of these units is to look at single family homes with multiple utilities bills, which could be an indication that more than one household lives in the dwelling. Based on this criterion, municipal records showed that 443 single family dwellings had multiple bills for sewer and water service in 2000 (City of North Vancouver, 2000). As of August 2010, the number of dwellings with multiple utilities bills was 506, an increase of 63 over the past 10 years. While this data provides some insight, the number of secondary suites in the City may well number over 1000 units and may be found in an assortment of dwelling structures, including duplexes and other multi-family units.
Currently there are 1,054 non-market units located in the City, of which 877 are non-profit rental units (remainder are cooperative units). Most of this stock is older (1970s – 1990s) and was built under senior government housing programs. Nevertheless, City partnerships have added nearly 130 non-profit rental units since 2000. An additional 23 non-profit rental units have been approved as part of rezonings and will be developed between 2011 and 2013 - 11 units negotiated as part of two new strata developments and a 12 unit apartment building for persons with disabilities.
The City has worked to maintain and continuously improve rental options for residents. In 1996, the City created a policy that allows older rental apartments to add new units or legalize existing illegal units in an attempt to create additional market rental units. These units can often be added in basements, manager suites, and vacant or under-utilized common areas. In 2006, the zoning bylaw was amended to allow additional suites to be legalized through a building permit process rather than a rezoning or development permit process, which helped to reduce processing time and costs for rental apartment owners. Since 2006, 14 new rental units and 14 legalized rental units have been added to existing rental buildings.
24 | P a g e
4.5 Investment in the Purpose-Built Rental Stock
There has been limited investment in the purpose-built rental stock since the 1970s. This lack of investment can be linked to changes in the federal tax structure that made it difficult for investors to recapture their rental housing investments (City of North Vancouver, 2001). In addition, improvements to units and building structures became heavily taxed, thereby limiting upgrades to the existing supply (City of North Vancouver, 2001). As a result, many current investors struggle financially to manage their properties, and the unfavourable tax structure has effectively deterred new investment.
The federal government has since made some changes to help alleviate the tax burden on rental housing investments. As of 2001, developers of rental housing were able to claim a GST rebate on construction costs (City of North Vancouver, 2001). In addition, on the sale of their property, owners of rental housing only had to pay 50% capital gains tax, rather than 75% (City of North Vancouver, 2001). In July 2010, a provincial Harmonized Sales Tax (HST) was implemented that resulted in a 12% tax on all goods and services associated with the operation, maintenance, and renovation of property. However, a province-wide referendum held in August 2011 extinguished the HST and reinstated the prior tax system of GST and PST, which is expected to be fully re-established in 2013.
While these tax relief measures have marginally increased profits for rental property owners, a very limited numbers of rental projects have been viable. This is due to the fact that the short term fiscal returns from rental housing remain less profitable than developing strata condos (Coriolis Consulting, 2009).
In spite of these challenges, the City has achieved some new purpose-built rental housing. Between 2001 and 2004, four rental buildings (one supportive housing complex) added 146 new rental units. In addition, a 27 unit rental building is currently under construction, and a 50+ unit rental building is in the early stages of the development process.
4.6 Inadequate Supply and High Rents
4.6.1 Vacancy Rates
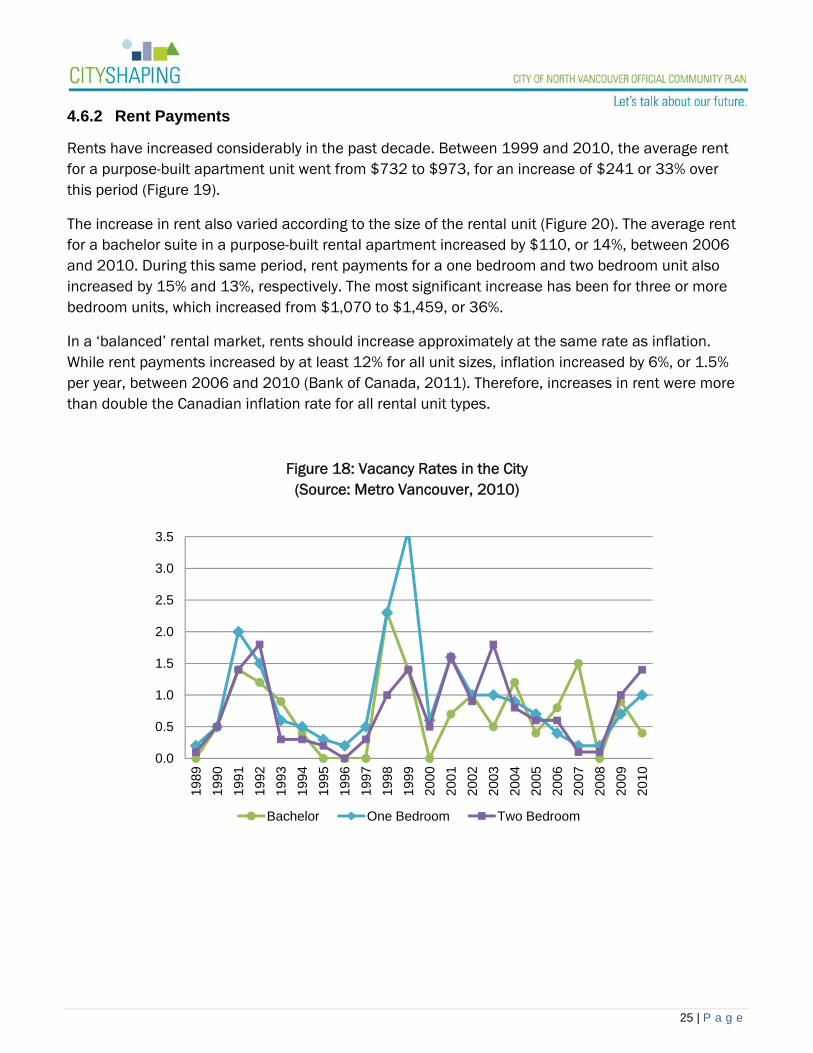
Vacancy rates in the City have remained low for the past two decades. Bachelor suites, in particular, have consistently had very low vacancy rate, dipping to 0% in 1989, 1995, 1997, 2000, and 2008 (Figure 18). Vacancy for one bedroom units has also been sparse, with the rate only exceeding 1.5% in 1998, 1999, and 2001. The vacancy rate for two bedroom units was at 0.1% as recently as 2008, but has increased to 1.4% in 2010.
A healthy vacancy rate can range anywhere between 2.5% and 4%. The City has a Strata Conversion bylaw that allows three or more rental units to be converted to strata units if the vacancy rate is at or above 4% for 12 consecutive months. However, with vacancy rates so low, there have been no conversions to date.
25 | P a g e
4.6.2 Rent Payments
Rents have increased considerably in the past decade. Between 1999 and 2010, the average rent for a purpose-built apartment unit went from $732 to $973, for an increase of $241 or 33% over this period (Figure 19).
The increase in rent also varied according to the size of the rental unit (Figure 20). The average rent for a bachelor suite in a purpose-built rental apartment increased by $110, or 14%, between 2006 and 2010. During this same period, rent payments for a one bedroom and two bedroom unit also increased by 15% and 13%, respectively. The most significant increase has been for three or more bedroom units, which increased from $1,070 to $1,459, or 36%.
In a ‘balanced’ rental market, rents should increase approximately at the same rate as inflation. While rent payments increased by at least 12% for all unit sizes, inflation increased by 6%, or 1.5% per year, between 2006 and 2010 (Bank of Canada, 2011). Therefore, increases in rent were more than double the Canadian inflation rate for all rental unit types.
Figure 18: Vacancy Rates in the City (Source: Metro Vancouver, 2010)
0.0
0.5
1.0
1.5
2.0
2.5
3.0
3.5
1989
1990
1991
1992
1993
1994
1995
1996
1997
1998
1999
2000
2001
2002
2003
2004
2005
2006
2007
2008
2009
2010
Bachelor One Bedroom Two Bedroom

26 | P a g e
Figure 19: Average Purpose-Built Apartment Rents in the City, 1999-2010 (Source: Metro Vancouver, 2011)
Figure 20: Average Purpose-Built Apartment Rents by Unit Size, 2006-2010
(Source: Metro Vancouver, 2011)
$732$748
$788$805 $809
$829 $839$857
$895$924
$958$973
$500
$600
$700
$800
$900
$1,000
1999 2000 2001 2002 2003 2004 2005 2006 2007 2008 2009 2010
Average Purpose-Built Apartment Rents
$702$737
$761$799 $812
$802$835 $869
$899$923
$1,010$1,047
$1,083 $1,116$1,140
$1,070$1,130
$1,381 $1,401$1,459
$500
$700
$900
$1,100
$1,300
$1,500
2006 2007 2008 2009 2010
Bachelor One Bedroom Two Bedroom 3 Bedroom +
27 | P a g e
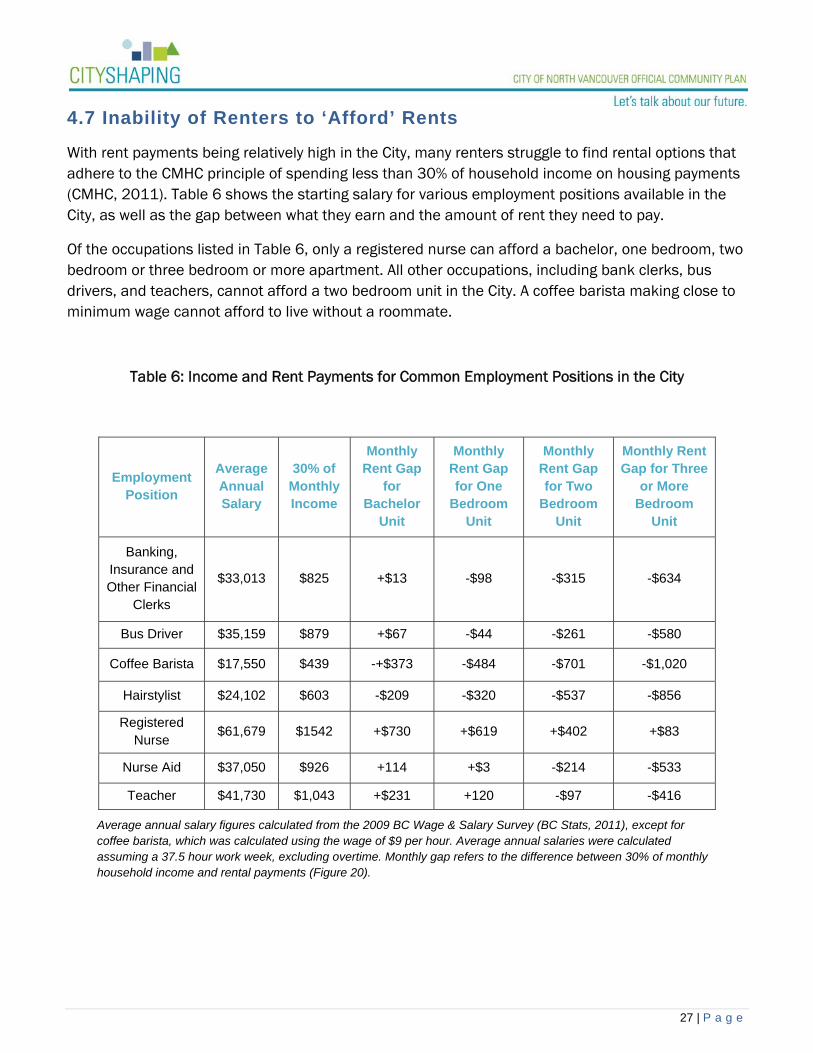
4.7 Inability of Renters to ‘Afford’ Rents
With rent payments being relatively high in the City, many renters struggle to find rental options that adhere to the CMHC principle of spending less than 30% of household income on housing payments (CMHC, 2011). Table 6 shows the starting salary for various employment positions available in the City, as well as the gap between what they earn and the amount of rent they need to pay.
Of the occupations listed in Table 6, only a registered nurse can afford a bachelor, one bedroom, two bedroom or three bedroom or more apartment. All other occupations, including bank clerks, bus drivers, and teachers, cannot afford a two bedroom unit in the City. A coffee barista making close to minimum wage cannot afford to live without a roommate.
Table 6: Income and Rent Payments for Common Employment Positions in the City
Employment Position
Average Annual Salary
30% of Monthly Income
Monthly Rent Gap
for Bachelor
Unit
Monthly Rent Gap for One
Bedroom Unit
Monthly Rent Gap for Two
Bedroom Unit
Monthly Rent Gap for Three
or More Bedroom
Unit
Banking, Insurance and Other Financial
Clerks
$33,013 $825 +$13 -$98 -$315 -$634
Bus Driver $35,159 $879 +$67 -$44 -$261 -$580
Coffee Barista $17,550 $439 -+$373 -$484 -$701 -$1,020
Hairstylist $24,102 $603 -$209 -$320 -$537 -$856
Registered Nurse
$61,679 $1542 +$730 +$619 +$402 +$83
Nurse Aid $37,050 $926 +114 +$3 -$214 -$533
Teacher $41,730 $1,043 +$231 +120 -$97 -$416
Average annual salary figures calculated from the 2009 BC Wage & Salary Survey (BC Stats, 2011), except for coffee barista, which was calculated using the wage of $9 per hour. Average annual salaries were calculated assuming a 37.5 hour work week, excluding overtime. Monthly gap refers to the difference between 30% of monthly household income and rental payments (Figure 20).
28 | P a g e
4.8 Renter Households in Core Need
Renter households make up the majority of the City’s core need households. Core need is a measure of the number of households that are inadequately housed due to the condition, size, or cost of the unit, given that an alternative affordable option costing no more than 30% of household income is not available (Metro Vancouver, 2011).
In 2006, approximately 2,790 households, or 72%, of the City’s core need households were renters (Metro Vancouver, 2011). This percentage is quite high when compared to the District of North Vancouver at 46% and the District of West Vancouver at 52% (Metro Vancouver, 2011). Yet, while renter households make up a high percentage of the City’s core need households, core need renters only make up 31% of all renter households in the City. This percentage is the same as Metro Vancouver, and is very comparable the other North Shore municipalities (District of North Vancouver - 25% and the District of West Vancouver - 30%) (Metro Vancouver, 2011).
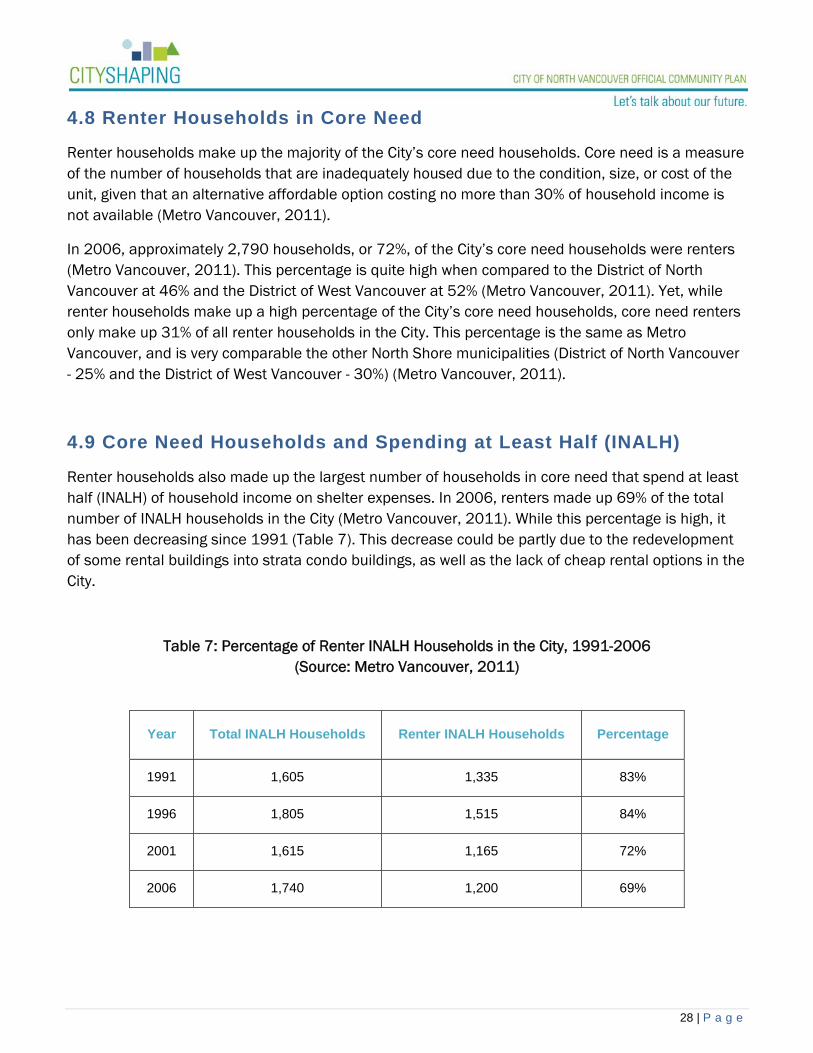
4.9 Core Need Households and Spending at Least Half (INALH)
Renter households also made up the largest number of households in core need that spend at least half (INALH) of household income on shelter expenses. In 2006, renters made up 69% of the total number of INALH households in the City (Metro Vancouver, 2011). While this percentage is high, it has been decreasing since 1991 (Table 7). This decrease could be partly due to the redevelopment of some rental buildings into strata condo buildings, as well as the lack of cheap rental options in the City.
Table 7: Percentage of Renter INALH Households in the City, 1991-2006 (Source: Metro Vancouver, 2011)
Year Total INALH Households Renter INALH Households Percentage
1991 1,605 1,335 83%
1996 1,805 1,515 84%
2001 1,615 1,165 72%
2006 1,740 1,200 69%

29 | P a g e
5.0 CHALLENGES FOR 2021
Over the past two decades, the diversity of housing available to City residents has expanded. Homeownership has increased relative to renting, particularly in the City core areas where denser forms of housing have been developed.
Although the City’s housing stock has diversified, affordability remains a growing issue. Homeownership is increasingly beyond the means of low to moderate income City households. In terms of rental housing, the purpose-built rental stock which has been a more affordable housing option has specific concerns:
Rising property values Rent increases that outpace inflation and wage increases Lack of investment in new purpose-built rental housing Aging rental housing stock in need of renovations and repairs Very low vacancy rates
High land values and construction costs hinder investment in rental housing. As of 2007, rents at a break-even level needed to be at a minimum of $3 per square foot or $1800 a month for a new 600 square feet rental suite (City of North Vancouver, 2007). In spite of the City’s best efforts, investment in purpose-built rental housing remains largely uneconomical. Without the senior government stimulation programs of the past, increases in the purpose-built rental housing supply will be small scale and incremental, and will require creative use of municipal tools and resources in partnership with the development and investment sectors.
Given the dual challenges of non-investment in rental housing and the un-affordability of homeownership, the City may wish to explore how affordable homeownership concepts aimed at low and middle income renter households may help decrease pressure on the existing rental stock. Other potential outcomes include increases in vacancy rates to healthier levels and provision of ownership opportunities to households currently unable to enter the homeownership market. Several new approaches that are consistent with the City’s Housing Affordability Strategies, and have been contemplated by the City of North Vancouver or Metro Vancouver, are summarized below:
Resale Control Agreements: These agreements allow owners to buy and sell their dwelling at a stipulated discount below fair market value. As property values continue to increase, owners gain some equity on their purchase, but the agreed upon discount means that subsequent homebuyers can buy a more ‘affordable’ unit (Paris, 2009). This concept has been implemented in the Verdant Development at SFU’s UniverCity and Dockside Green in Victoria where specific units were sold 20% and 15%, respectively, below market value and will remain below market when resold (Paris, 2009). Both developments have had success providing ownership options to the affordable housing market with no resales to date (Paris, 2009). Agreements should be overseen and held by a third party or non-profit housing authority.

30 | P a g e
Affordable Sustainable Housing (ASH) concept: ASH is 12 to15 small-footprint apartment homes, four or five to a floor in an attractive 3 storey, wood framed building on a single standard city lot. ASH apartments are self contained one bedroom (375 sq ft) and two bedrooms (485 sq ft) finished and furnished suites (Schwinn, Kay, & Miller). Their equivalent can be seen on the display floor of any IKEA. The concept also applies to non-market studio (265 sq ft) suites (Schwinn, Kay, & Miller). Buildings are walk-up, with ground floor suites having individual entrances. Parking is curb side. Buildings come with two share-cars and two motorbikes to discourage auto-dependency. Average 1 bedroom selling prices is $160,000 and 2 bedroom prices at $199,900 (Schwinn, Kay, & Miller).
Alteration of Existing Rental Buildings: Additional rental units could be realized in exterior parking spaces of existing rental buildings that are underutilized. Also, the City may wish to inventory existing buildings and parking lots to determine how much underutilized interior and exterior space is present and if additional units can be constructed.
Smart Houses: This concept of housing was introduced in 2009 to the City by Vernacular Design Inc and offers homes that minimize finished interiors and offer fewer appliances. Buildings are completed to the extent that new owners can immediately occupy the homes but interior improvements and finishes are gradually completed when time and resources permit. This lowers the purchase price for entry level buyers and also gives owners more flexibility with regard to the type, cost, and pace of the construction of interior design and building components.
Mini Homes: Mini houses are generally less than 800 square feet, highly energy efficient, rely on alternative energy sources and often utilize recycled or up-cycled building materials. Prices for mini houses depend on the size, grade of materials, and amount of on-site construction required. There are an increasing number of companies producing prefabricated mini homes, making it a readily available housing option. Because of its reduced size, mini homes can increase the number of houses on a standard City lot without losing open space and setback areas, and also help maintain the single family nature of neighbourhoods.
Lock-off Units: Lock-off units are compact, self-contained units (250-300 square feet) that are currently permitted in the City as a form of more affordable rental housing. Lock-off units are attached to a main housing unit in multi-family housing and are self-contained bedrooms with a full bath, a kitchenette, and a direct exterior access. While these units are currently permitted as rental housing in the City, other jurisdictions have been experimenting with strata-owned lock-off suites as a more affordable housing option for homeowners.
Approaches and concepts such as these, combined with the City’s Housing Affordability Strategies, can provide additional housing options which are more affordable than the range currently available.

31 | P a g e
6.0 CONCLUSIONS
While the City has always had a healthy mix of housing types to accommodate a variety of residents over the past 20 years, the City’s housing stock has changed considerably. The current trend is towards more compact, smaller units to correspond with smaller households and higher housing costs. As a result, the City has seen a decrease in single detached dwellings in most City neighbourhoods, with a corresponding increase in multi-family housing structures, especially duplexes and high rise apartments. The Lower Lonsdale and Central Lonsdale neighbourhoods, which together make up the Lonsdale Regional City Centre, continue to accommodate the bulk of the City’s new development.
The predominant form of tenure in the City is also shifting towards homeownership as a result of the new strata residential developments. Nevertheless, renters continue to make up nearly half of all City households. While land values, and consequently the price of housing, has increased throughout the City, renters often face greater affordability challenges compared to homeowners. Rental housing is often insecure, increasingly in need of repair, and challenging to find at affordable rents. Without the senior government programs of the past to support non-market and market rental housing, the City must use its municipal tools and resources in creative ways and explore new affordable housing approaches in partnership with the development, investment, and non-profit sectors.
While the housing goals in the City’s Official Community Plan and Social Plan related to increasing the density and diversity of the housing stock have been the basis for the City’s actions related to market and non-market housing, affordability across the housing continuum remains a great concern. The significant increase in housing costs over the last 20 years has decreased the ability of people to afford housing the City. If the City plans to continue to pursue a vision of vibrant, diverse, and sustainable community, housing goals in the OCP should emphasize preserving rental housing and increasing affordable ownership opportunities in the community.