housing finance at a glance - urban institute · pdf fileabout the chartbook the housing...
TRANSCRIPT

November 2017
1
A MONTHLY CHARTBOOK
HOUSING FINANCE POLICY CENTER
HOUSING FINANCEAT A GLANCE
ABOUT THE CHARTBOOK
The Housing Finance Policy Center’s (HFPC) mission is to produce analyses and ideas that promote sound public policy, efficient markets, and access to economic opportunity in the area of housing finance. At A Glance, a monthly chartbook and data source for policymakers, academics, journalists, and others interested in the government’s role in mortgage markets, is at the heart of this mission.
We welcome feedback from our readers on how we can make At A Glance a more useful publication. Please email any comments or questions to [email protected].
To receive regular updates from the Housing Finance Policy Center, please visit here to sign up for our bi-weekly newsletter.
HOUSING FINANCE POLICY CENTER STAFF
Laurie GoodmanCenter Co-Director
Alanna McCargoCenter Co-Director
Edward GoldingSenior Fellow
Jim ParrottSenior Fellow
Sheryl PardoAssociate Director of Communications
Todd Hill Policy & Research Program Manager
Jun ZhuSenior Research Associate
Bing BaiResearch Associate I
Karan KaulResearch Associate I
Bhargavi GaneshResearch Assistant
Sarah StrochakResearch Assistant
Andrea Reyes
Center Administrator

CONTENTSOverview
Market Size OverviewValue of the US Residential Housing Market 6Size of the US Residential Mortgage Market 6Private Label Securities 7Agency Mortgage-Backed Securities 7
Origination Volume and Composition First Lien Origination Volume & Share 8
Mortgage Origination Product TypeComposition (All Originations & Purchase Originations Only) 9
Securitization Volume and CompositionAgency/Non-Agency Share of Residential MBS Issuance 10Non-Agency MBS Issuance 10Non-Agency Securitization 10
Agency Activity: Volumes and Purchase/Refi CompositionAgency Gross Issuance 11 Percent Refi at Issuance 11
Non-bank Origination ShareNonbank Origination Share: All Loans 12Nonbank Origination Share: Purchase Loans 12Nonbank Origination Share: Refi Loans 12
Non-bank Credit BoxAgency FICO: Bank vs. Nonbank 13GSE FICO: Bank vs. Nonbank 13Ginnie Mae FICO: Bank vs. Nonbank 13GSE LTV: Bank vs. Nonbank 14Ginnie Mae LTV: Bank vs. Nonbank 14GSE DTI: Bank vs. Nonbank 14Ginnie Mae DTI: Bank vs. Nonbank 14
State of the Market
Mortgage Origination ProjectionsTotal Originations and Refinance Shares 15Housing Starts and Home Sales 15
Credit Availability and Originator ProfitabilityHousing Credit Availability Index (HCAI) 16Originator Profitability and Unmeasured Costs (OPUC) 16
Credit Availability for Purchase LoansBorrower FICO Score at Origination Month 17Combined LTV at Origination Month 17Origination FICO and LTV by MSA 18
CONTENTS
Housing Affordability National Housing Affordability Over Time 19Affordability Adjusted for MSA-Level DTI 19
First-Time HomebuyersFirst-Time Homebuyer Share 20Comparison of First-time and Repeat Homebuyers, GSE and FHA Originations 20
Home Price IndicesNational Year-Over-Year HPI Growth 21Changes in CoreLogic HPI for Top MSAs 21
Negative Equity & Serious DelinquencyNegative Equity Share 22Loans in Serious Delinquency 22
Modifications and LiquidationsLoan Modifications and Liquidations (By Year & Cumulative) 23
GSEs under Conservatorship
GSE Portfolio Wind-DownFannie Mae Mortgage-Related Investment Portfolio 24Freddie Mac Mortgage-Related Investment Portfolio 24
Effective Guarantee Fees & GSE Risk-Sharing Transactions Effective Guarantee Fees 25Fannie Mae Upfront Loan-Level Price Adjustment 25GSE Risk-Sharing Transactions and Spreads 26-27
Serious Delinquency RatesSerious Delinquency Rates – Fannie Mae & Freddie Mac 28Serious Delinquency Rates – Single-Family Loans & Multifamily GSE Loans 29
Agency Issuance
Agency Gross and Net IssuanceAgency Gross Issuance 30Agency Net Issuance 30
Agency Gross Issuance & Fed PurchasesMonthly Gross Issuance 31Fed Absorption of Agency Gross Issuance 31
Mortgage Insurance ActivityMI Activity & Market Share 32FHA MI Premiums for Typical Purchase Loan 33Initial Monthly Payment Comparison: FHA vs. PMI 33
Related HFPC Work
Publications and Events 34
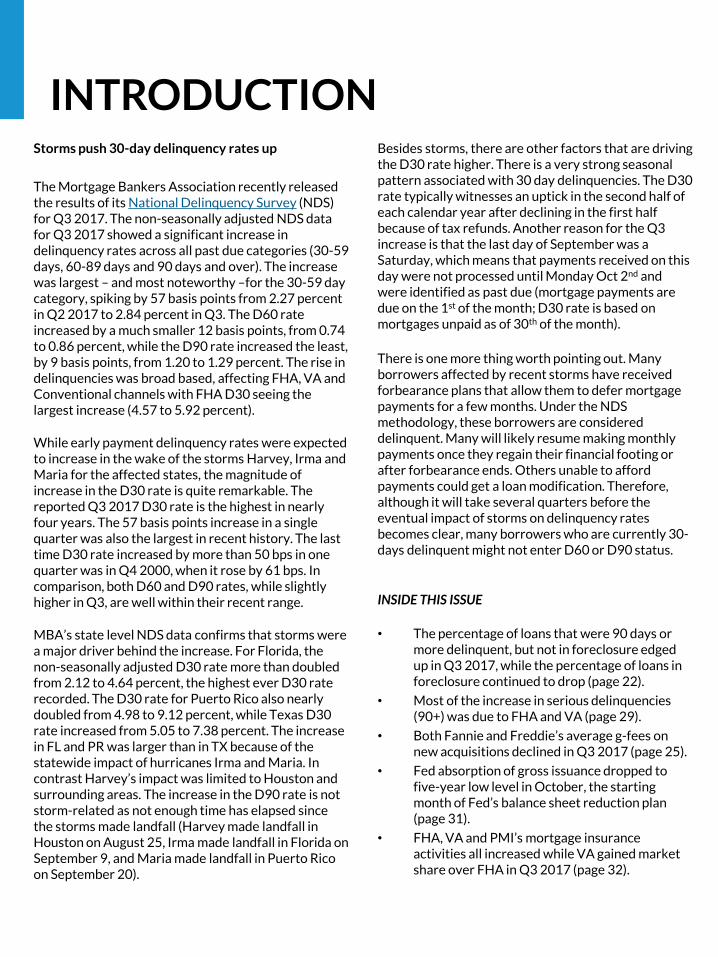
INTRODUCTIONStorms push 30-day delinquency rates up
The Mortgage Bankers Association recently released the results of its National Delinquency Survey (NDS) for Q3 2017. The non-seasonally adjusted NDS data for Q3 2017 showed a significant increase in delinquency rates across all past due categories (30-59 days, 60-89 days and 90 days and over). The increase was largest – and most noteworthy –for the 30-59 day category, spiking by 57 basis points from 2.27 percent in Q2 2017 to 2.84 percent in Q3. The D60 rate increased by a much smaller 12 basis points, from 0.74 to 0.86 percent, while the D90 rate increased the least, by 9 basis points, from 1.20 to 1.29 percent. The rise in delinquencies was broad based, affecting FHA, VA and Conventional channels with FHA D30 seeing the largest increase (4.57 to 5.92 percent).
While early payment delinquency rates were expected to increase in the wake of the storms Harvey, Irma and Maria for the affected states, the magnitude of increase in the D30 rate is quite remarkable. The reported Q3 2017 D30 rate is the highest in nearly four years. The 57 basis points increase in a single quarter was also the largest in recent history. The last time D30 rate increased by more than 50 bps in one quarter was in Q4 2000, when it rose by 61 bps. In comparison, both D60 and D90 rates, while slightly higher in Q3, are well within their recent range.
MBA’s state level NDS data confirms that storms were a major driver behind the increase. For Florida, the non-seasonally adjusted D30 rate more than doubled from 2.12 to 4.64 percent, the highest ever D30 rate recorded. The D30 rate for Puerto Rico also nearly doubled from 4.98 to 9.12 percent, while Texas D30 rate increased from 5.05 to 7.38 percent. The increase in FL and PR was larger than in TX because of the statewide impact of hurricanes Irma and Maria. In contrast Harvey’s impact was limited to Houston and surrounding areas. The increase in the D90 rate is not storm-related as not enough time has elapsed since the storms made landfall (Harvey made landfall in Houston on August 25, Irma made landfall in Florida on September 9, and Maria made landfall in Puerto Rico on September 20).
Besides storms, there are other factors that are driving the D30 rate higher. There is a very strong seasonal pattern associated with 30 day delinquencies. The D30 rate typically witnesses an uptick in the second half of each calendar year after declining in the first half because of tax refunds. Another reason for the Q3 increase is that the last day of September was a Saturday, which means that payments received on this day were not processed until Monday Oct 2nd and were identified as past due (mortgage payments are due on the 1st of the month; D30 rate is based on mortgages unpaid as of 30th of the month).
There is one more thing worth pointing out. Many borrowers affected by recent storms have received forbearance plans that allow them to defer mortgage payments for a few months. Under the NDS methodology, these borrowers are considered delinquent. Many will likely resume making monthly payments once they regain their financial footing or after forbearance ends. Others unable to afford payments could get a loan modification. Therefore, although it will take several quarters before the eventual impact of storms on delinquency rates becomes clear, many borrowers who are currently 30-days delinquent might not enter D60 or D90 status.
INSIDE THIS ISSUE
• The percentage of loans that were 90 days or more delinquent, but not in foreclosure edged up in Q3 2017, while the percentage of loans in foreclosure continued to drop (page 22).
• Most of the increase in serious delinquencies (90+) was due to FHA and VA (page 29).
• Both Fannie and Freddie’s average g-fees on new acquisitions declined in Q3 2017 (page 25).
• Fed absorption of gross issuance dropped to five-year low level in October, the starting month of Fed’s balance sheet reduction plan (page 31).
• FHA, VA and PMI’s mortgage insurance activities all increased while VA gained market share over FHA in Q3 2017 (page 32).
6
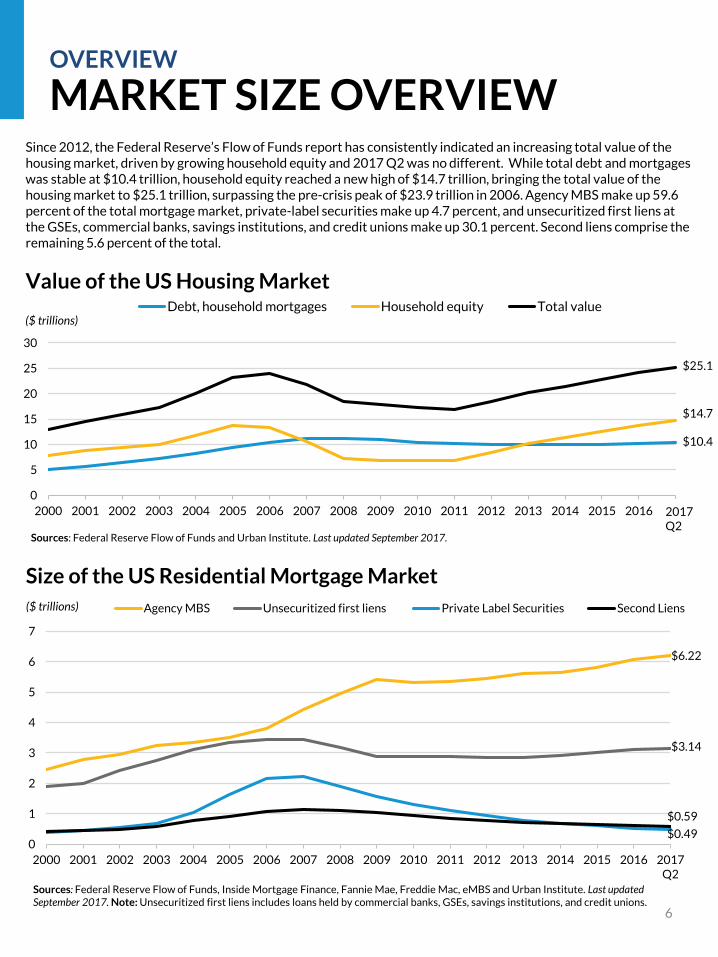
MARKET SIZE OVERVIEWSince 2012, the Federal Reserve’s Flow of Funds report has consistently indicated an increasing total value of the housing market, driven by growing household equity and 2017 Q2 was no different. While total debt and mortgages was stable at $10.4 trillion, household equity reached a new high of $14.7 trillion, bringing the total value of the housing market to $25.1 trillion, surpassing the pre-crisis peak of $23.9 trillion in 2006. Agency MBS make up 59.6 percent of the total mortgage market, private-label securities make up 4.7 percent, and unsecuritized first liens at the GSEs, commercial banks, savings institutions, and credit unions make up 30.1 percent. Second liens comprise the remaining 5.6 percent of the total.
OVERVIEW
Debt,household mortgages,
$9,833
$6.22
$3.14
$0.59
0
1
2
3
4
5
6
7
2000 2001 2002 2003 2004 2005 2006 2007 2008 2009 2010 2011 2012 2013 2014 2015 2016 2017Q2
($ trillions)
Size of the US Residential Mortgage Market
Agency MBS Unsecuritized first liens Private Label Securities Second Liens
Sources: Federal Reserve Flow of Funds, Inside Mortgage Finance, Fannie Mae, Freddie Mac, eMBS and Urban Institute. Last updated September 2017. Note: Unsecuritized first liens includes loans held by commercial banks, GSEs, savings institutions, and credit unions.
$10.4
$14.7
$25.1
0
5
10
15
20
25
30
2000 2001 2002 2003 2004 2005 2006 2007 2008 2009 2010 2011 2012 2013 2014 2015 2016 2017Q2
($ trillions)Debt, household mortgages Household equity Total value
Value of the US Housing Market
Sources: Federal Reserve Flow of Funds and Urban Institute. Last updated September 2017.
2017 Q2
$0.49

7
MARKET SIZE OVERVIEWOVERVIEW
As of September 2017, debt in the private-label securitization market totaled $509 billion and was split among prime (18.2 percent), Alt-A (38.7 percent), and subprime (43.1 percent) loans. In October 2017, outstanding securities in the agency market totaled $6.32 trillion and were 43.8 percent Fannie Mae, 27.3 percent Freddie Mac, and 28.8 percent Ginnie Mae. Ginnie Mae has had more outstanding securities than Freddie Mac since May 2016.
0.220.20
0.09
0
0.2
0.4
0.6
0.8
1
1999 2000 2001 2002 2003 2004 2005 2006 2007 2008 2009 2010 2011 2012 2013 2014 2015 2016 2017
($ trillions)
Private-Label Securities by Product TypeAlt-A Subprime Prime
Sources: CoreLogic and Urban Institute. September 2017
2.8
1.7
1.8
6.3
0
1
2
3
4
5
6
7
2000 2001 2002 2003 2004 2005 2006 2007 2008 2009 2010 2011 2012 2013 2014 2015 2016 2017
($ trillions)Fannie Mae Freddie Mac Ginnie Mae Total
Agency Mortgage-Backed Securities
Sources: eMBS and Urban Institute.October 2017

8
OVERVIEW
ORIGINATION VOLUMEAND COMPOSITION
$0.390
$0.210
$0.006
$0.234
$0.0
$0.5
$1.0
$1.5
$2.0
$2.5
$3.0
$3.5
$4.0
2001 2003 2005 2007 2009 2011 2013 2015 2017 Q1-Q2
($ trillions)
First Lien Origination Volume
GSE securitization FHA/VA securitization PLS securitization Portfolio
Sources: Inside Mortgage Finance and Urban Institute. Last updated September 2017.
After a record high origination year in 2016 ($2.1 trillion), the first lien originations totaled $840 billion in the first halfof 2017, down 6 percent from the same period last year, mostly due to the elevated interest rates. The share of portfolio originations was 28 percent, down slightly from 30 percent in 2016. The GSE share stayed at about 46 percent. The FHA/VA share was slightly up: 25 percent for the first half of 2017 versus 24 percent in 2016. Origination of private-label securities was well under 1 percent in both periods.
0%
10%
20%
30%
40%
50%
60%
70%
80%
90%
100%
2001 2003 2005 2007 2009 2011 2013 2015 2017 Q1-Q2
Sources: Inside Mortgage Finance and Urban Institute. Last updated September 2017.
(Share, percent)
27.9%
0.71%25.0%
46.4%

9
MORTGAGE ORIGINATION PRODUCT
TYPEAdjustable-rate mortgages (ARMs) accounted for as much as 42 percent of all new originations during the peak of the 2005 housing bubble (top chart). The ARMs fell to an historic low of 1 percent in 2009, and then slowly grew to a high of 6 percent in April 2014. Since then, ARMs have began to decline again to 3.0 percent in August 2017. The 15-year fixed-rate mortgage (FRM), predominantly a refinance product, accounted for 15.1 percent of new originations in August 2017. If we exclude refinances (bottom chart), the share of 30-year FRMs in August 2017 stood at 89.3 percent, 15-year FRMs at 6.2 percent, and ARMs at 2.8 percent.
OVERVIEW
MORTGAGE ORIGINATION PRODUCT TYPE
0%
10%
20%
30%
40%
50%
60%
70%
80%
90%
100%
2000 2001 2002 2003 2004 2005 2006 2007 2008 2009 2010 2011 2012 2013 2014 2015 2016 2017
All Originations
Fixed-rate 30-year mortgage Fixed-rate 15-year mortgage Adjustable-rate mortgage Other
Sources: Corelogic, eMBS, HMDA, SIFMA and Urban Institute.
0%
10%
20%
30%
40%
50%
60%
70%
80%
90%
100%
2000 2001 2002 2003 2004 2005 2006 2007 2008 2009 2010 2011 2012 2013 2014 2015 2016 2017
Purchase Loans OnlyFixed-rate 30-year mortgage Fixed-rate 15-year mortgage Adjustable-rate mortgage Other
Sources: Corelogic, eMBS, HMDA, SIFMA and Urban Institute. August 2017
August 2017
10
SECURITIZATION VOLUME AND COMPOSITION
OVERVIEW
$-
$200
$400
$600
$800
$1,000
$1,200
$1,400
20
01
20
02
20
03
20
04
20
05
20
06
20
07
20
08
20
09
20
10
20
11
20
12
20
13
20
14
20
15
20
16
20
17
Q1
-Q3
($ billions) Re-REMICs and other
Scratch and dent
Alt A
Subprime
Prime
Sources: Inside Mortgage Finance and Urban Institute.
Non-Agency MBS Issuance
$3.04$23.86$4.10 $1.33$7.45
97.13%
2.87%0%
10%
20%
30%
40%
50%
60%
70%
80%
90%
100%
19
95
19
96
19
97
19
98
19
99
20
00
20
01
20
02
20
03
20
04
20
05
20
06
20
07
20
08
20
09
20
10
20
11
20
12
20
13
20
14
20
15
20
16
20
17
YT
D
Agency share Non-Agency share
Agency/Non-Agency Share of Residential MBS Issuance
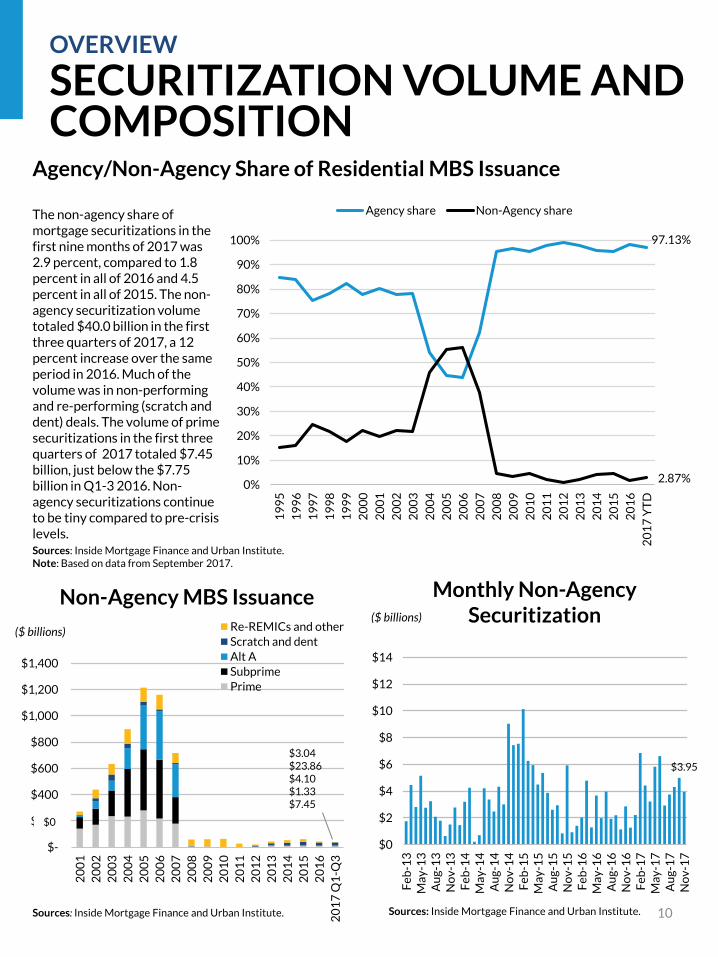
The non-agency share of mortgage securitizations in the first nine months of 2017 was 2.9 percent, compared to 1.8 percent in all of 2016 and 4.5 percent in all of 2015. The non-agency securitization volume totaled $40.0 billion in the first three quarters of 2017, a 12 percent increase over the same period in 2016. Much of the volume was in non-performing and re-performing (scratch and dent) deals. The volume of prime securitizations in the first three quarters of 2017 totaled $7.45 billion, just below the $7.75 billion in Q1-3 2016. Non-agency securitizations continue to be tiny compared to pre-crisis levels.Sources: Inside Mortgage Finance and Urban Institute.Note: Based on data from September 2017.
$3.95
$0
$2
$4
$6
$8
$10
$12
$14
Fe
b-1
3M
ay
-13
Au
g-1
3N
ov
-13
Fe
b-1
4M
ay
-14
Au
g-1
4N
ov
-14
Fe
b-1
5M
ay
-15
Au
g-1
5N
ov
-15
Fe
b-1
6M
ay
-16
Au
g-1
6N
ov
-16
Fe
b-1
7M
ay
-17
Au
g-1
7N
ov
-17
($ billions)
Monthly Non-Agency Securitization
Sources: Inside Mortgage Finance and Urban Institute.
$0

11
AGENCY ACTIVITY: VOLUMES AND PURCHASE/REFI COMPOSITION
Agency issuance totaled $1.103 trillion for the first 10 months of the year, $1.325 trillion on an annualized basis. This is down about 8.4 percent from the first 10 months of 2016. The refinance share continued to edge up slightly in October, a typical seasonal effect associated with lower purchase volume attributable to the end of the heavy summer purchase activity.
OVERVIEW
$0.53
$0.33
$0.46
0.0
0.5
1.0
1.5
2.0
2.5
2000 2001 2002 2003 2004 2005 2006 2007 2008 2009 2010 2011 2012 2013 2014 2015 2016 2017Ann.
($ trillions)
Agency Gross Issuance
Fannie Mae Freddie Mac Ginnie Mae
Sources: eMBS and Urban Institute. Note: Annualized figure based on data from October 2017.
0.00%
1.00%
2.00%
3.00%
4.00%
5.00%
6.00%
7.00%
8.00%
9.00%
0%
10%
20%
30%
40%
50%
60%
70%
80%
90%
Ap
r-0
4
Oct
-04
Ap
r-0
5
Oct
-05
Ap
r-0
6
Oct
-06
Ap
r-0
7
Oct
-07
Ap
r-0
8
Oct
-08
Ap
r-0
9
Oct
-09
Ap
r-1
0
Oct
-10
Ap
r-1
1
Oct
-11
Ap
r-1
2
Oct
-12
Ap
r-1
3
Oct
-13
Ap
r-1
4
Oct
-14
Ap
r-1
5
Oct
-15
Ap
r-1
6
Oct
-16
Ap
r-1
7
Oct
-17
Percent Refi at IssuanceFreddie Mac Fannie Mae Ginnie Mae Mortgage rate
Sources: eMBS and Urban Institute.Note: Based on at-issuance balance. Figure based on data from October 2017
Mortgage ratePercent refi

Sources: eMBS and Urban Institute Sources: eMBS and Urban Institute
Sources: eMBS and Urban Institute.
62%
53%55%
78%
0%
10%
20%
30%
40%
50%
60%
70%
80%
90%
100%
Fe
b-1
3
Ap
r-1
3
Jun
-13
Au
g-1
3
Oct
-13
De
c-1
3
Fe
b-1
4
Ap
r-1
4
Jun
-14
Au
g-1
4
Oct
-14
De
c-1
4
Fe
b-1
5
Ap
r-1
5
Jun
-15
Au
g-1
5
Oct
-15
De
c-1
5
Fe
b-1
6
Ap
r-1
6
Jun
-16
Au
g-1
6
Oct
-16
De
c-1
6
Fe
b-1
7
Ap
r-1
7
Jun
-17
Au
g-1
7
Oct
-17
Nonbank Origination Share: All Loans
All Fannie Freddie Ginnie
0%
10%
20%
30%
40%
50%
60%
70%
80%
90%
100%
Fe
b-1
3
Jun
-13
Oct
-13
Fe
b-1
4
Jun
-14
Oct
-14
Fe
b-1
5
Jun
-15
Oct
-15
Fe
b-1
6
Jun
-16
Oct
-16
Fe
b-1
7
Jun
-17
Oct
-17
All Fannie Freddie Ginnie
0%
10%
20%
30%
40%
50%
60%
70%
80%
90%
100%
Fe
b-1
3
Jun
-13
Oct
-13
Fe
b-1
4
Jun
-14
Oct
-14
Fe
b-1
5
Jun
-15
Oct
-15
Fe
b-1
6
Jun
-16
Oct
-16
Fe
b-1
7
Jun
-17
Oct
-17
All Fannie Freddie Ginnie
Nonbank Origination Share: Refi Loans
12
NONBANK ORIGINATION SHARE
OVERVIEW
Nonbank Origination Share: Purchase Loans
Though nonbank origination share has increased for all three agencies since 2013, the percentage has remained steady month-over-month. This month, Freddie and Fannie had nonbank originator shares between 53-55 percent, while Ginnie Mae’s nonbank share was at 78 percent. The nonbank originator share is higher for refinance than for purchases across all three agencies.

Sources: eMBS and Urban Institute. Sources: eMBS and Urban Institute.
729
748
717
680
690
700
710
720
730
740
750
760
770
Agency FICO: Bank vs. NonbankAll Median FICO Bank Median FICO Nonbank Median FICOFICO
Sources: eMBS and Urban Institute.
670
690
710
730
750
770
Jul-
13
Oct
-13
Jan
-14
Ap
r-1
4
Jul-
14
Oct
-14
Jan
-15
Ap
r-1
5
Jul-
15
Oct
-15
Jan
-16
Ap
r-1
6
Jul-
16
Oct
-16
Jan
-17
Ap
r-1
7
Jul-
17
Oct
-17
All Median FICO Bank Median FICO
Nonbank Median FICO
Ginnie Mae FICO: Bank vs. Nonbank
670
690
710
730
750
770
Jul-
13
Oct
-13
Jan
-14
Ap
r-1
4
Jul-
14
Oct
-14
Jan
-15
Ap
r-1
5
Jul-
15
Oct
-15
Jan
-16
Ap
r-1
6
Jul-
16
Oct
-16
Jan
-17
Ap
r-1
7
Jul-
17
Oct
-17
All Median FICO Bank Median FICONonbank Median FICO
GSE FICO: Bank vs. Nonbank
13
OVERVIEW
NONBANK CREDIT BOX
FICO FICO
Nonbank originators have played a key role in opening up access to credit. The median GSE and the median Ginnie Mae FICO scores for loans originated by nonbanks are lower than their bank counterparts. Within the GSE space, both bank and nonbank FICOs have declined since 2014 with further relaxation in FICOs in 2017. In contrast, within the Ginnie Mae space, FICO scores for bank originations have increased since 2014 while nonbank FICOs have declined. This largely reflects the sharp cut-back in FHA lending by many banks.
Sources: eMBS and Urban Institute. Sources: eMBS and Urban Institute.
66687072747678808284868890
Jul-
13
Oct
-13
Jan
-14
Ap
r-1
4
Jul-
14
Oct
-14
Jan
-15
Ap
r-1
5
Jul-
15
Oct
-15
Jan
-16
Ap
r-1
6
Jul-
16
Oct
-16
Jan
-17
Ap
r-1
7
Jul-
17
Oct
-17
GSE LTV: Bank vs. Nonbank
All Median LTV Bank Median LTV
Nonbank Median LTV
Sources: eMBS and Urban Institute.
90
91
92
93
94
95
96
97
98
99
100
Jul-
13
Oct
-13
Jan
-14
Ap
r-1
4
Jul-
14
Oct
-14
Jan
-15
Ap
r-1
5
Jul-
15
Oct
-15
Jan
-16
Ap
r-1
6
Jul-
16
Oct
-16
Jan
-17
Ap
r-1
7
Jul-
17
Oct
-17
All Median LTV Bank Median LTV
Nonbank Median LTV
Sources: eMBS and Urban Institute.
30
32
34
36
38
40
42
Jul-
13
Oct
-13
Jan
-14
Ap
r-1
4
Jul-
14
Oct
-14
Jan
-15
Ap
r-1
5
Jul-
15
Oct
-15
Jan
-16
Ap
r-1
6
Jul-
16
Oct
-16
Jan
-17
Ap
r-1
7
Jul-
17
Oct
-17
All Median DTI Bank Median DTI
Nonbank Median DTI
30
32
34
36
38
40
42
Jul-
13
Oct
-13
Jan
-14
Ap
r-1
4
Jul-
14
Oct
-14
Jan
-15
Ap
r-1
5
Jul-
15
Oct
-15
Jan
-16
Ap
r-1
6
Jul-
16
Oct
-16
Jan
-17
Ap
r-1
7
Jul-
17
Oct
-17
GSE DTI: Bank vs. Nonbank
All Median DTI Bank Median DTI
Nonbank Median DTI
14
OVERVIEW
NONBANK CREDIT BOX
Ginnie Mae LTV: Bank vs. Nonbank
Ginnie Mae DTI: Bank vs. Nonbank
LTV LTV
DTI DTI
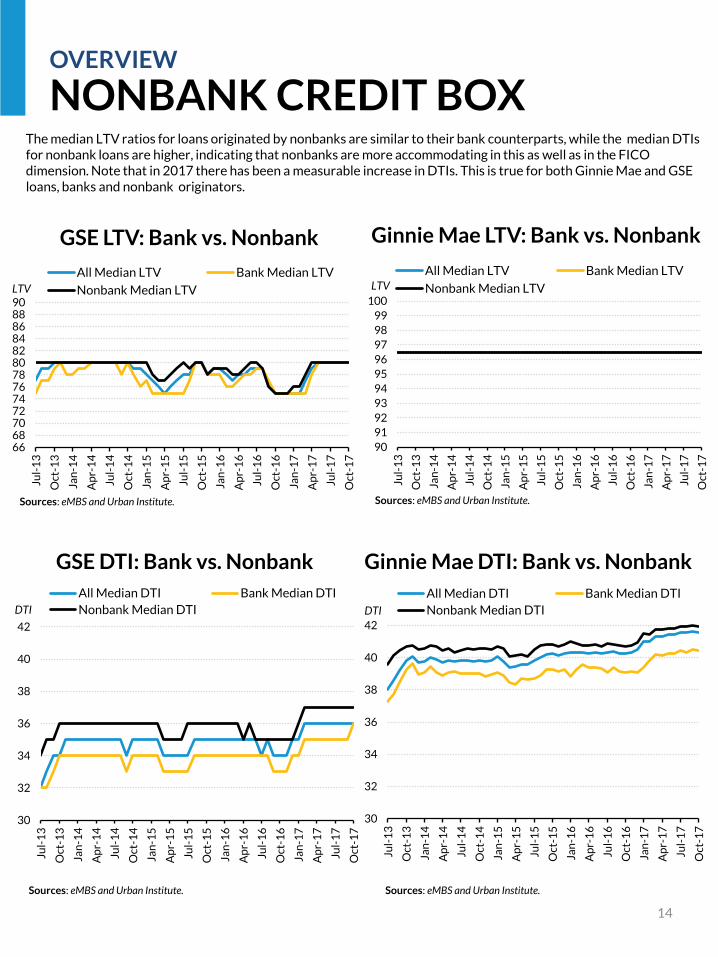
The median LTV ratios for loans originated by nonbanks are similar to their bank counterparts, while the median DTIs for nonbank loans are higher, indicating that nonbanks are more accommodating in this as well as in the FICO dimension. Note that in 2017 there has been a measurable increase in DTIs. This is true for both Ginnie Mae and GSE loans, banks and nonbank originators.
15
STATE OF THE MARKET
MORTGAGE ORIGINATION PROJECTIONS
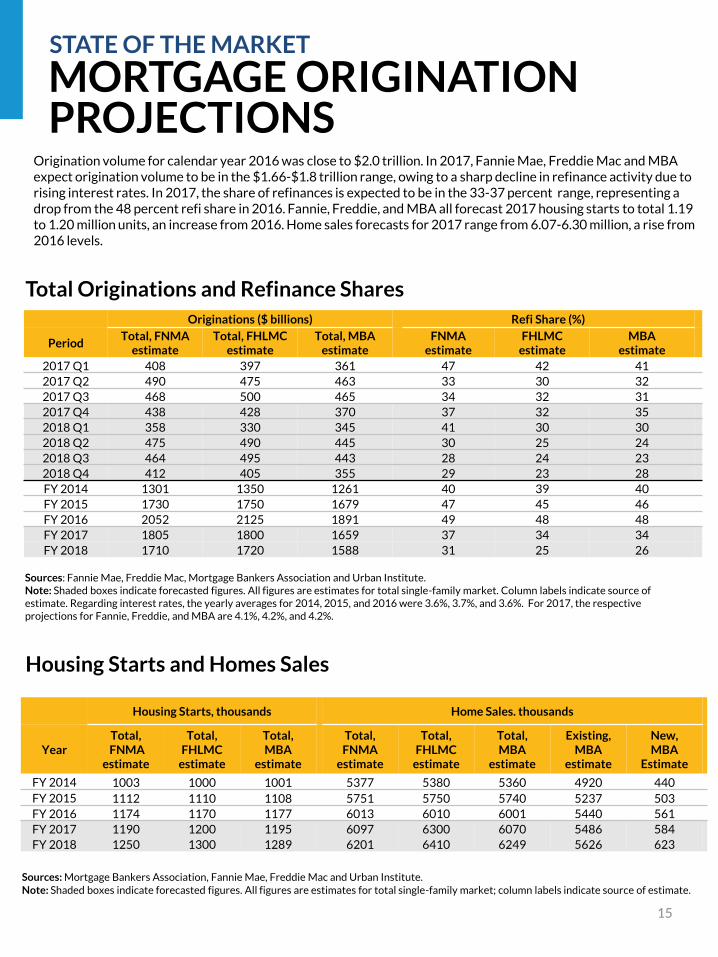
Origination volume for calendar year 2016 was close to $2.0 trillion. In 2017, Fannie Mae, Freddie Mac and MBA expect origination volume to be in the $1.66-$1.8 trillion range, owing to a sharp decline in refinance activity due to rising interest rates. In 2017, the share of refinances is expected to be in the 33-37 percent range, representing a drop from the 48 percent refi share in 2016. Fannie, Freddie, and MBA all forecast 2017 housing starts to total 1.19 to 1.20 million units, an increase from 2016. Home sales forecasts for 2017 range from 6.07-6.30 million, a rise from 2016 levels.
Total Originations and Refinance Shares
Housing Starts and Homes Sales
Originations ($ billions) Refi Share (%)
PeriodTotal, FNMA
estimateTotal, FHLMC
estimateTotal, MBA
estimateFNMA
estimateFHLMC
estimateMBA
estimate
2017 Q1 408 397 361 47 42 41
2017 Q2 490 475 463 33 30 32
2017 Q3 468 500 465 34 32 31
2017 Q4 438 428 370 37 32 35
2018 Q1 358 330 345 41 30 30
2018 Q2 475 490 445 30 25 24
2018 Q3 464 495 443 28 24 23
2018 Q4 412 405 355 29 23 28
FY 2014 1301 1350 1261 40 39 40
FY 2015 1730 1750 1679 47 45 46
FY 2016 2052 2125 1891 49 48 48
FY 2017 1805 1800 1659 37 34 34
FY 2018 1710 1720 1588 31 25 26
Sources: Fannie Mae, Freddie Mac, Mortgage Bankers Association and Urban Institute.Note: Shaded boxes indicate forecasted figures. All figures are estimates for total single-family market. Column labels indicate source of estimate. Regarding interest rates, the yearly averages for 2014, 2015, and 2016 were 3.6%, 3.7%, and 3.6%. For 2017, the respective projections for Fannie, Freddie, and MBA are 4.1%, 4.2%, and 4.2%.
Housing Starts, thousands Home Sales. thousands
YearTotal,FNMA
estimate
Total, FHLMC
estimate
Total, MBA
estimate
Total, FNMA
estimate
Total, FHLMC
estimate
Total, MBA
estimate
Existing, MBA
estimate
New, MBA
Estimate
FY 2014 1003 1000 1001 5377 5380 5360 4920 440
FY 2015 1112 1110 1108 5751 5750 5740 5237 503
FY 2016 1174 1170 1177 6013 6010 6001 5440 561
FY 2017 1190 1200 1195 6097 6300 6070 5486 584
FY 2018 1250 1300 1289 6201 6410 6249 5626 623
Sources: Mortgage Bankers Association, Fannie Mae, Freddie Mac and Urban Institute.Note: Shaded boxes indicate forecasted figures. All figures are estimates for total single-family market; column labels indicate source of estimate.
16
CREDIT AVAILABILITY AND ORIGINATOR PROFITABILITY
STATE OF THE MARKET
2.14
0
1
2
3
4
5
6
2000 2001 2002 2003 2004 2005 2006 2007 2008 2009 2010 2011 2012 2013 2014 2015 2016 2017
Dollars per $100 loan
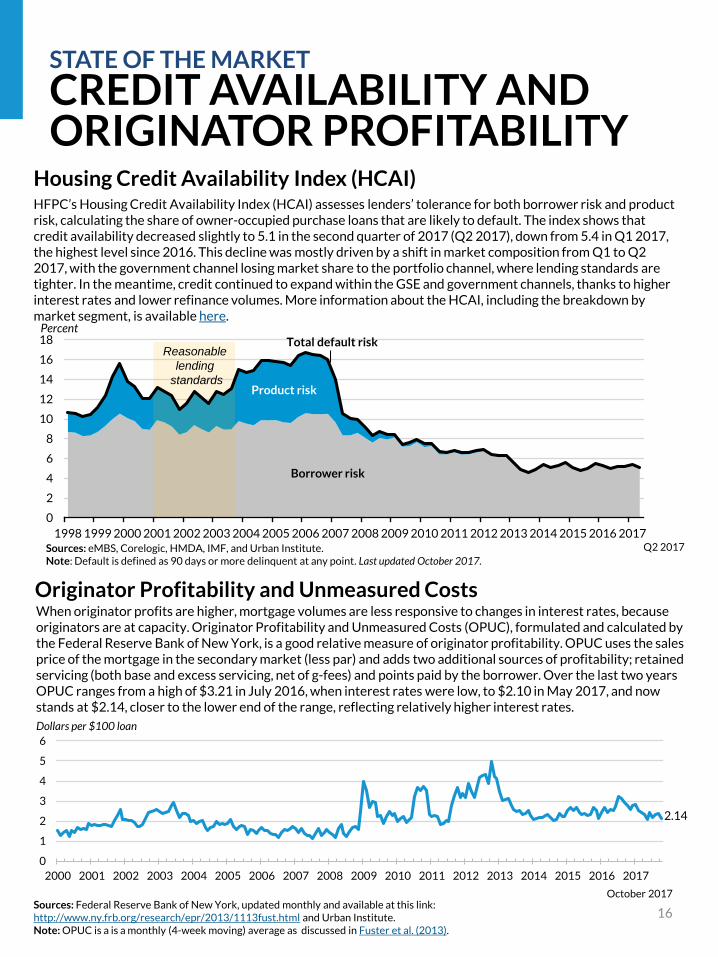
Originator Profitability and Unmeasured CostsWhen originator profits are higher, mortgage volumes are less responsive to changes in interest rates, because originators are at capacity. Originator Profitability and Unmeasured Costs (OPUC), formulated and calculated by the Federal Reserve Bank of New York, is a good relative measure of originator profitability. OPUC uses the sales price of the mortgage in the secondary market (less par) and adds two additional sources of profitability; retained servicing (both base and excess servicing, net of g-fees) and points paid by the borrower. Over the last two years OPUC ranges from a high of $3.21 in July 2016, when interest rates were low, to $2.10 in May 2017, and now stands at $2.14, closer to the lower end of the range, reflecting relatively higher interest rates.
Sources: Federal Reserve Bank of New York, updated monthly and available at this link: http://www.ny.frb.org/research/epr/2013/1113fust.html and Urban Institute. Note: OPUC is a is a monthly (4-week moving) average as discussed in Fuster et al. (2013).
Sources: eMBS, Corelogic, HMDA, IMF, and Urban Institute.Note: Default is defined as 90 days or more delinquent at any point. Last updated October 2017.
HFPC’s Housing Credit Availability Index (HCAI) assesses lenders’ tolerance for both borrower risk and product risk, calculating the share of owner-occupied purchase loans that are likely to default. The index shows that credit availability decreased slightly to 5.1 in the second quarter of 2017 (Q2 2017), down from 5.4 in Q1 2017, the highest level since 2016. This decline was mostly driven by a shift in market composition from Q1 to Q2 2017, with the government channel losing market share to the portfolio channel, where lending standards are tighter. In the meantime, credit continued to expand within the GSE and government channels, thanks to higher interest rates and lower refinance volumes. More information about the HCAI, including the breakdown by market segment, is available here.
Housing Credit Availability Index (HCAI)
Q2 2017
October 2017
0
2
4
6
8
10
12
14
16
18
19981999200020012002200320042005200620072008200920102011201220132014201520162017
PercentTotal default risk
Borrower risk
Product risk
Reasonable
lending
standards

17
CREDIT AVAILABILITY FOR
Access to credit has become extremely tight, especially for borrowers with low FICO scores. The mean and median FICO scores on new purchase originations have both drifted up about 21 and 20 points over the last decade, respectively. The 10th percentile of FICO scores, which represents the lower bound of creditworthiness needed to qualify for a mortgage, stood at 646 as of August 2017. Prior to the housing crisis, this threshold held steady in the low 600s. Mean LTV levels at origination remain relatively high, averaging 87.6, which reflects the large number of FHA purchase originations.
CREDIT AVAILABILITY FOR PURCHASE LOANS
STATE OF THE MARKET
797
726732
646
500
550
600
650
700
750
800
850
2001 2002 2003 2004 2005 2006 2007 2008 2009 2010 2011 2012 2013 2014 2015 2016 2017
FICO Score
Borrower FICO Score at Origination
90th percentile Mean Median 10th percentile
Sources: CoreLogic, eMBS, HMDA, SIFMA and Urban Institute.Note: Includes owner-occupied purchase loans only.
August 2017
100
88
95
71
30
40
50
60
70
80
90
100
110
2001 2002 2003 2004 2005 2006 2007 2008 2009 2010 2011 2012 2013 2014 2015 2016 2017
LTV
Combined LTV at Origination
90th percentile Mean Median 10th percentile
Sources: Corelogic, eMBS, HMDA, SIFMA and Urban Institute.Note: Includes owner-occupied purchase loans only.
August 2017
18
CREDIT AVAILABILITY FORCREDIT AVAILABILITY FOR PURCHASE LOANS
STATE OF THE MARKET
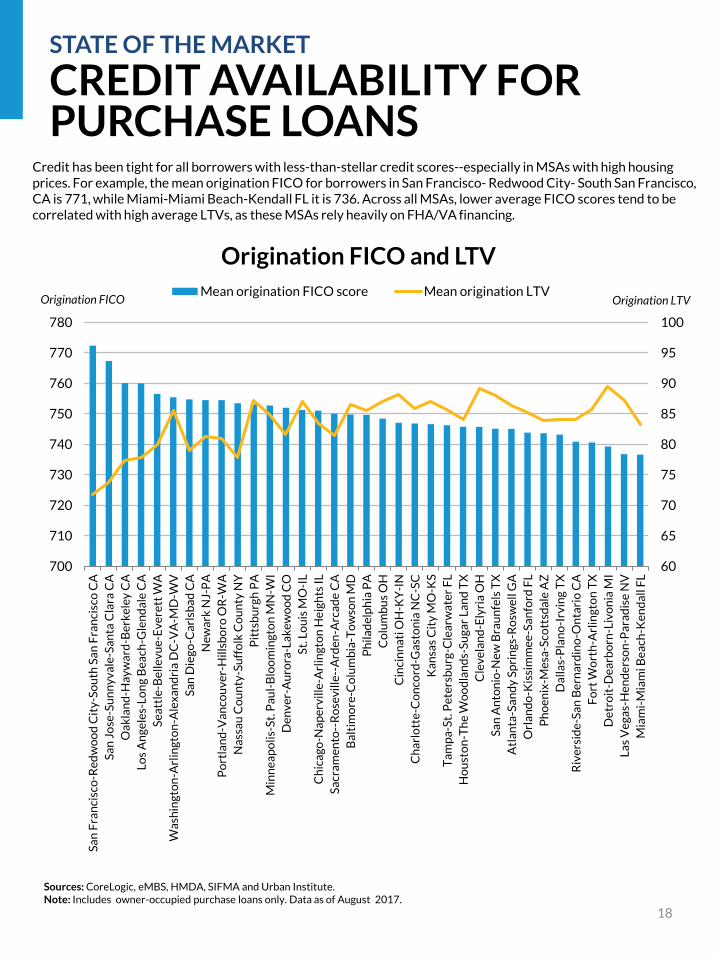
Credit has been tight for all borrowers with less-than-stellar credit scores--especially in MSAs with high housing prices. For example, the mean origination FICO for borrowers in San Francisco- Redwood City- South San Francisco, CA is 771, while Miami-Miami Beach-Kendall FL it is 736. Across all MSAs, lower average FICO scores tend to be correlated with high average LTVs, as these MSAs rely heavily on FHA/VA financing.
60
65
70
75
80
85
90
95
100
700
710
720
730
740
750
760
770
780
Sa
n F
ran
cisc
o-R
ed
wo
od
Cit
y-S
ou
th S
an
Fra
nci
sco
CA
Sa
n J
ose
-Su
nn
yv
ale
-Sa
nta
Cla
ra C
A
Oa
kla
nd
-Ha
yw
ard
-Be
rke
ley
CA
Lo
s A
ng
ele
s-L
on
g B
ea
ch-G
len
da
le C
A
Se
att
le-B
ell
ev
ue
-Ev
ere
tt W
A
Wa
shin
gto
n-A
rlin
gto
n-A
lex
an
dri
a D
C-V
A-M
D-W
V
Sa
n D
ieg
o-C
arl
sba
d C
A
Ne
wa
rk N
J-P
A
Po
rtla
nd
-Va
nco
uv
er-
Hil
lsb
oro
OR
-WA
Na
ssa
u C
ou
nty
-Su
ffo
lk C
ou
nty
NY
Pit
tsb
urg
h P
A
Min
ne
ap
oli
s-S
t. P
au
l-B
loo
min
gto
n M
N-W
I
De
nv
er-
Au
rora
-La
ke
wo
od
CO
St.
Lo
uis
MO
-IL
Ch
ica
go
-Na
pe
rvil
le-A
rlin
gto
n H
eig
hts
IL
Sa
cra
me
nto
--R
ose
vil
le--
Ard
en
-Arc
ad
e C
A
Ba
ltim
ore
-Co
lum
bia
-To
wso
n M
D
Ph
ila
de
lph
ia P
A
Co
lum
bu
s O
H
Cin
cin
na
ti O
H-K
Y-I
N
Ch
arl
ott
e-C
on
cord
-Ga
sto
nia
NC
-SC
Ka
nsa
s C
ity
MO
-KS
Ta
mp
a-S
t. P
ete
rsb
urg
-Cle
arw
ate
r F
L
Ho
ust
on
-Th
e W
oo
dla
nd
s-S
ug
ar
La
nd
TX
Cle
ve
lan
d-E
lyri
a O
H
Sa
n A
nto
nio
-Ne
w B
rau
nfe
ls T
X
Atl
an
ta-S
an
dy
Sp
rin
gs-
Ro
swe
ll G
A
Orl
an
do
-Kis
sim
me
e-S
an
ford
FL
Ph
oe
nix
-Me
sa-S
cott
sda
le A
Z
Da
lla
s-P
lan
o-I
rvin
g T
X
Riv
ers
ide
-Sa
n B
ern
ard
ino
-On
tari
o C
A
Fo
rt W
ort
h-A
rlin
gto
n T
X
De
tro
it-D
ea
rbo
rn-L
ivo
nia
MI
La
s V
eg
as-
He
nd
ers
on
-Pa
rad
ise
NV
Mia
mi-
Mia
mi B
ea
ch-K
en
da
ll F
L
Origination LTVOrigination FICO
Origination FICO and LTV
Mean origination FICO score Mean origination LTV
Sources: CoreLogic, eMBS, HMDA, SIFMA and Urban Institute.Note: Includes owner-occupied purchase loans only. Data as of August 2017.
19
HOUSING AFFORDABILITYSTATE OF THE MARKET
Credit Bubble
$120
$170
$220
$270
$320
20
00
20
01
20
02
20
03
20
04
20
05
20
06
20
07
20
08
20
09
20
10
20
11
20
12
20
13
20
14
20
15
20
16
20
17
Housing Prices ($ thousands)
National Housing Affordability Over Time
Median sales price Max affordable price
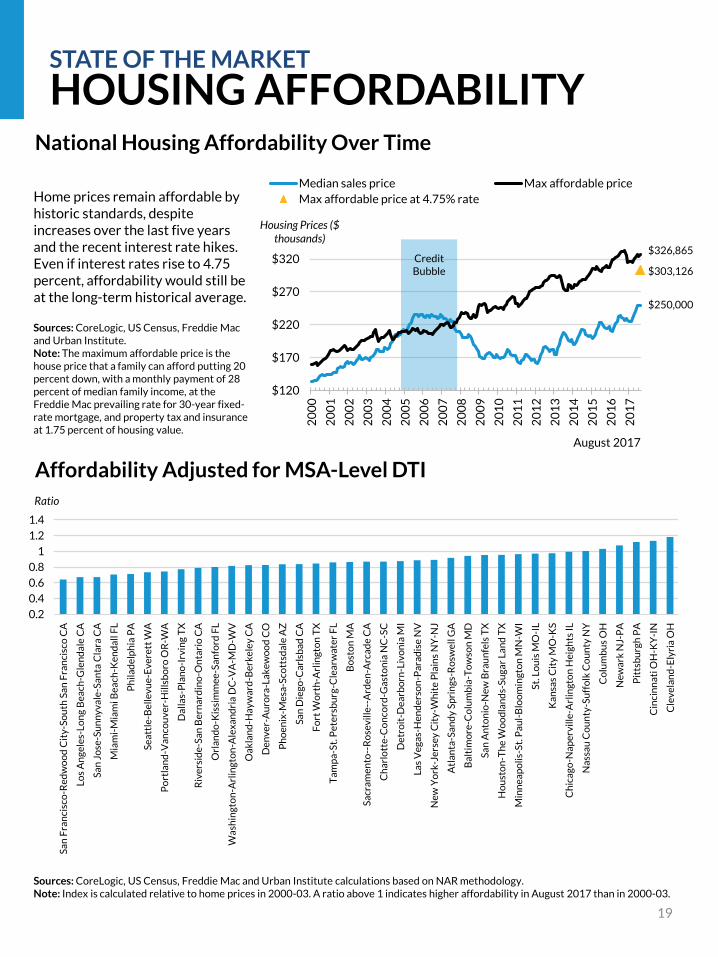
Max affordable price at 4.75% rateHome prices remain affordable by historic standards, despite increases over the last five years and the recent interest rate hikes. Even if interest rates rise to 4.75 percent, affordability would still be at the long-term historical average.
Sources: CoreLogic, US Census, Freddie Mac and Urban Institute.Note: The maximum affordable price is the house price that a family can afford putting 20 percent down, with a monthly payment of 28 percent of median family income, at the Freddie Mac prevailing rate for 30-year fixed-rate mortgage, and property tax and insurance at 1.75 percent of housing value.
August 2017
$326,865
$303,126
$250,000
0.2
0.4
0.6
0.8
1
1.2
1.4
Sa
n F
ran
cisc
o-R
ed
wo
od
Cit
y-S
ou
th S
an
Fra
nci
sco
CA
Lo
s A
ng
ele
s-L
on
g B
ea
ch-G
len
da
le C
A
Sa
n J
ose
-Su
nn
yv
ale
-Sa
nta
Cla
ra C
A
Mia
mi-
Mia
mi B
ea
ch-K
en
da
ll F
L
Ph
ila
de
lph
ia P
A
Se
att
le-B
ell
ev
ue
-Ev
ere
tt W
A
Po
rtla
nd
-Va
nco
uv
er-
Hil
lsb
oro
OR
-WA
Da
lla
s-P
lan
o-I
rvin
g T
X
Riv
ers
ide
-Sa
n B
ern
ard
ino
-On
tari
o C
A
Orl
an
do
-Kis
sim
me
e-S
an
ford
FL
Wa
shin
gto
n-A
rlin
gto
n-A
lex
an
dri
a D
C-V
A-M
D-W
V
Oa
kla
nd
-Ha
yw
ard
-Be
rke
ley
CA
De
nv
er-
Au
rora
-La
ke
wo
od
CO
Ph
oe
nix
-Me
sa-S
cott
sda
le A
Z
Sa
n D
ieg
o-C
arl
sba
d C
A
Fo
rt W
ort
h-A
rlin
gto
n T
X
Ta
mp
a-S
t. P
ete
rsb
urg
-Cle
arw
ate
r F
L
Bo
sto
n M
A
Sa
cra
me
nto
--R
ose
vil
le--
Ard
en
-Arc
ad
e C
A
Ch
arl
ott
e-C
on
cord
-Ga
sto
nia
NC
-SC
De
tro
it-D
ea
rbo
rn-L
ivo
nia
MI
La
s V
eg
as-
He
nd
ers
on
-Pa
rad
ise
NV
Ne
w Y
ork
-Je
rse
y C
ity
-Wh
ite
Pla
ins
NY
-NJ
Atl
an
ta-S
an
dy
Sp
rin
gs-
Ro
swe
ll G
A
Ba
ltim
ore
-Co
lum
bia
-To
wso
n M
D
Sa
n A
nto
nio
-Ne
w B
rau
nfe
ls T
X
Ho
ust
on
-Th
e W
oo
dla
nd
s-S
ug
ar
La
nd
TX
Min
ne
ap
oli
s-S
t. P
au
l-B
loo
min
gto
n M
N-W
I
St.
Lo
uis
MO
-IL
Ka
nsa
s C
ity
MO
-KS
Ch
ica
go
-Na
pe
rvil
le-A
rlin
gto
n H
eig
hts
IL
Na
ssa
u C
ou
nty
-Su
ffo
lk C
ou
nty
NY
Co
lum
bu
s O
H
Ne
wa
rk N
J-P
A
Pit
tsb
urg
h P
A
Cin
cin
na
ti O
H-K
Y-I
N
Cle
ve
lan
d-E
lyri
a O
H
Ratio
Affordability Adjusted for MSA-Level DTI
Sources: CoreLogic, US Census, Freddie Mac and Urban Institute calculations based on NAR methodology.Note: Index is calculated relative to home prices in 2000-03. A ratio above 1 indicates higher affordability in August 2017 than in 2000-03.

20
FIRST-TIME HOMEBUYERSSTATE OF THE MARKET
45.9
81.8
57.4
20%
30%
40%
50%
60%
70%
80%
90%
2001 2002 2003 2004 2005 2006 2007 2008 2009 2010 2011 2012 2013 2014 2015 2016 2017
First-Time Homebuyer Share
GSEs FHA GSEs and FHA
In August 2017, the first-time homebuyer share of GSE purchase loans fell for the fourth consecutive month to 45.9 percent, after hitting the highest level in recent history in April (48.1 percent). The FHA has always been more focused on first-time homebuyers, with its first-time homebuyer share hovering around 80 percent; it stood at 81.8 percent in August 2017. The bottom table shows that based on mortgages originated in August 2017, the average first-time homebuyer was more likely than an average repeat buyer to take out a smaller loan and have a lower credit score and higher LTV and DTI, thus requiring a higher interest rate.
Sources: eMBS, Federal Housing Administration (FHA ) and Urban Institute.Note: All series measure the first-time homebuyer share of purchase loans for principal residences.
Comparison of First-Time and Repeat Homebuyers, GSE and FHA Originations
GSEs FHA GSEs and FHA
Characteristics First-time Repeat First-time Repeat First-time Repeat
Loan Amount ($) 226,523 251,311 201,529 225,005 215,600 246,693
Credit Score739.4 754.7 676.1 683.3 711.7 742.1
LTV (%) 87.0 78.9 95.5 94.0 90.7 81.6
DTI (%) 34.7 35.2 42.3 43.3 38.0 36.6
Loan Rate (%) 4.20 4.07 4.22 4.13 4.21 4.08
Sources: eMBS and Urban Institute.Note: Based on owner-occupied purchase mortgages originated in August 2017.
August 2017
21
MSA
HPI changes (%) % Rise needed to achieve
peak2000 to peakPeak totrough
Trough to current
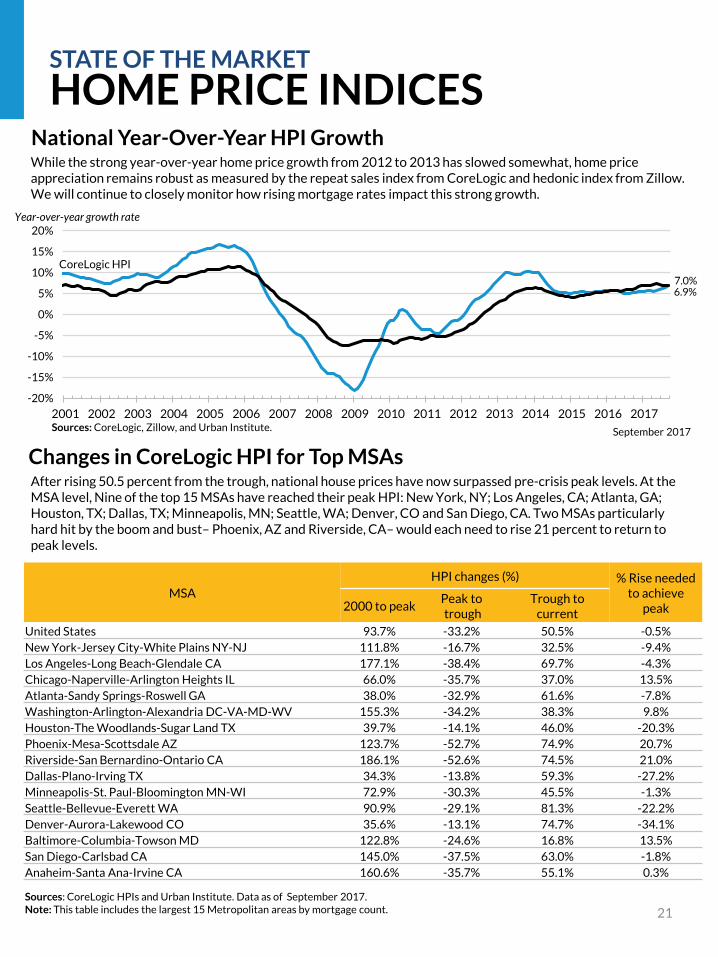
United States 93.7% -33.2% 50.5% -0.5%
New York-Jersey City-White Plains NY-NJ 111.8% -16.7% 32.5% -9.4%
Los Angeles-Long Beach-Glendale CA 177.1% -38.4% 69.7% -4.3%
Chicago-Naperville-Arlington Heights IL 66.0% -35.7% 37.0% 13.5%
Atlanta-Sandy Springs-Roswell GA 38.0% -32.9% 61.6% -7.8%
Washington-Arlington-Alexandria DC-VA-MD-WV 155.3% -34.2% 38.3% 9.8%
Houston-The Woodlands-Sugar Land TX 39.7% -14.1% 46.0% -20.3%
Phoenix-Mesa-Scottsdale AZ 123.7% -52.7% 74.9% 20.7%
Riverside-San Bernardino-Ontario CA 186.1% -52.6% 74.5% 21.0%
Dallas-Plano-Irving TX 34.3% -13.8% 59.3% -27.2%
Minneapolis-St. Paul-Bloomington MN-WI 72.9% -30.3% 45.5% -1.3%
Seattle-Bellevue-Everett WA 90.9% -29.1% 81.3% -22.2%
Denver-Aurora-Lakewood CO 35.6% -13.1% 74.7% -34.1%
Baltimore-Columbia-Towson MD 122.8% -24.6% 16.8% 13.5%
San Diego-Carlsbad CA 145.0% -37.5% 63.0% -1.8%
Anaheim-Santa Ana-Irvine CA 160.6% -35.7% 55.1% 0.3%
Sources: CoreLogic HPIs and Urban Institute. Data as of September 2017.Note: This table includes the largest 15 Metropolitan areas by mortgage count.
Changes in CoreLogic HPI for Top MSAsAfter rising 50.5 percent from the trough, national house prices have now surpassed pre-crisis peak levels. At the MSA level, Nine of the top 15 MSAs have reached their peak HPI: New York, NY; Los Angeles, CA; Atlanta, GA; Houston, TX; Dallas, TX; Minneapolis, MN; Seattle, WA; Denver, CO and San Diego, CA. Two MSAs particularly hard hit by the boom and bust– Phoenix, AZ and Riverside, CA– would each need to rise 21 percent to return to peak levels.
HOME PRICE INDICESSTATE OF THE MARKET
CoreLogic HPI
6.9%7.0%
-20%
-15%
-10%
-5%
0%
5%
10%
15%
20%
2001 2002 2003 2004 2005 2006 2007 2008 2009 2010 2011 2012 2013 2014 2015 2016 2017
Year-over-year growth rate
National Year-Over-Year HPI Growth
Sources: CoreLogic, Zillow, and Urban Institute.
While the strong year-over-year home price growth from 2012 to 2013 has slowed somewhat, home price appreciation remains robust as measured by the repeat sales index from CoreLogic and hedonic index from Zillow. We will continue to closely monitor how rising mortgage rates impact this strong growth.
September 2017

22
STATE OF THE MARKET
NEGATIVE EQUITY & SERIOUS DELINQUENCY
2.5%
1.3%
1.2%0%
2%
4%
6%
8%
10%
12%
3Q
02
1Q
03
3Q
03
1Q
04
3Q
04
1Q
05
3Q
05
1Q
06
3Q
06
1Q
07
3Q
07
1Q
08
3Q
08
1Q
09
3Q
09
1Q
10
3Q
10
1Q
11
3Q
11
1Q
12
3Q
12
1Q
13
3Q
13
1Q
14
3Q
14
1Q
15
3Q
15
1Q
16
3Q
16
1Q
17
3Q
17
Loans in Serious Delinquency/Foreclosure
Percent of loans 90days delinquent or inforeclosurePercent of loans 90days delinquent
Percent of loans inforeclosure
Sources: Mortgage Bankers Association and Urban Institute. Last updated November 2017.
Due to seasonal factors, 90 day delinquencies inched up from 1.20 to 1.29 percent in Q3 2017. The percent of loans in foreclosure continued to edge down to 1.23 percent. The combined delinquencies totaled 2.52 percent in Q3 2017, down from 2.76 percent in Q1 2017 and 2.96 percent for the same quarter a year earlier.
5.4%6.8%
0%
5%
10%
15%
20%
25%
30%
35%
3Q
09
4Q
09
1Q
10
2Q
10
3Q
10
4Q
10
1Q
11
2Q
11
3Q
11
4Q
11
1Q
12
2Q
12
3Q
12
4Q
12
1Q
13
2Q
13
3Q
13
4Q
13
1Q
14
2Q
14
3Q
14
4Q
14
1Q
15
2Q
15
3Q
15
4Q
15
1Q
16
2Q
16
3Q
16
4Q
16
1Q
17
2Q
17
Negative Equity Share Negative equity Near or in negative equity
Sources: CoreLogic and Urban Institute.Note: CoreLogic negative equity rate is the percent of all residential properties with a mortgage in negative equity. Loans with negative equity refer to loans above 100 percent LTV. Loans near negative equity refer to loans above 95 percent LTV. Last updated September 2017.
With housing prices continuing to appreciate, residential properties in negative equity (LTV greater than 100) as the share of all residential properties with a mortgage continued to decline and stood at 5.4 percent as of Q2 2017. Residential properties in near negative equity (LTV between 95 and 100) comprise another 1.4 percent..

MODIFICATIONS AND LIQUIDATIONS
23
STATE OF THE MARKET
Total modifications (HAMP and proprietary) are now roughly equal to total liquidations. Hope Now reports show 8,248,700 borrowers have received a modification since Q3 2007, compared with 8,489,913 liquidations in the same period. Modifications and liquidations have slowed significantly over the past few years. In the first eight months of 2017, there were just 202,418 modifications and 199,612 liquidations.
0
200
400
600
800
1,000
1,200
1,400
1,600
2007(Q3-Q4)
2008 2009 2010 2011 2012 2013 2014 2015 2016 2017
Number of loans (thousands)
Loan Modifications and Liquidations
HAMP mods
Proprietary mods
Liquidations
Sources: Hope Now and Urban Institute.Note: Liquidations include both foreclosure sales and short sales.
August 2017
1.7
6.5
8.5
0
1
2
3
4
5
6
7
8
9
2007 (Q3-Q4) 2009 2011 2013 2015 2017
HAMP mods
Proprietary mods
Liquidations
Number of loans (millions)
Cumulative Modifications and Liquidations
Sources: Hope Now and Urban Institute.Note: Liquidations includes both foreclosure sales and short sales.
August 2017
24
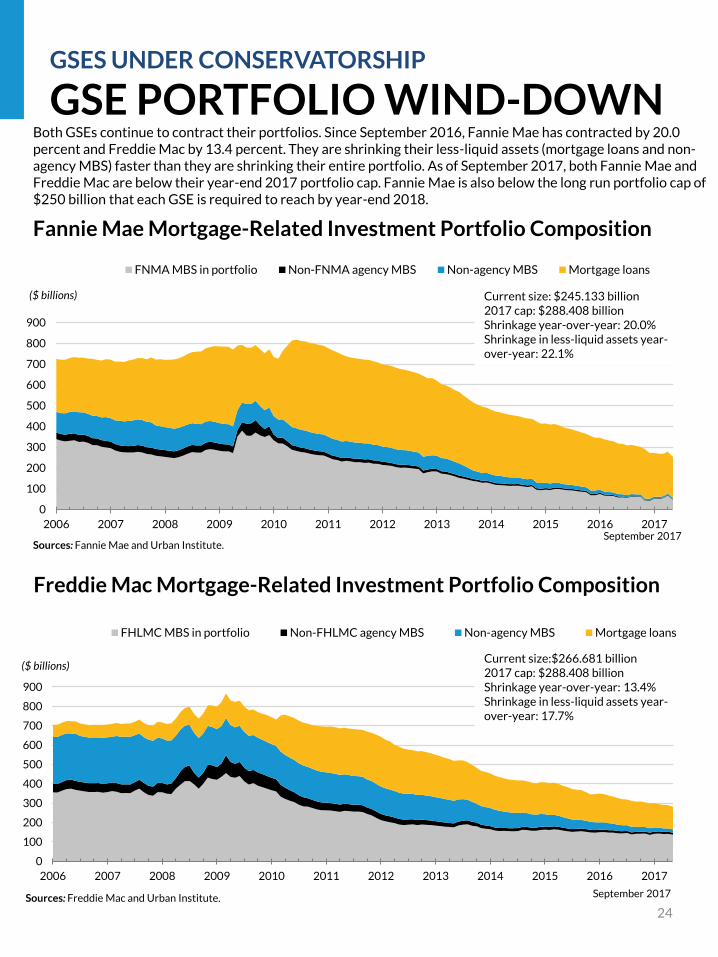
Both GSEs continue to contract their portfolios. Since September 2016, Fannie Mae has contracted by 20.0 percent and Freddie Mac by 13.4 percent. They are shrinking their less-liquid assets (mortgage loans and non-agency MBS) faster than they are shrinking their entire portfolio. As of September 2017, both Fannie Mae and Freddie Mac are below their year-end 2017 portfolio cap. Fannie Mae is also below the long run portfolio cap of $250 billion that each GSE is required to reach by year-end 2018.
GSE PORTFOLIO WIND-DOWNGSES UNDER CONSERVATORSHIP
0
100
200
300
400
500
600
700
800
900
2006 2007 2008 2009 2010 2011 2012 2013 2014 2015 2016 2017
($ billions)
FHLMC MBS in portfolio Non-FHLMC agency MBS Non-agency MBS Mortgage loans
Sources: Freddie Mac and Urban Institute.
Freddie Mac Mortgage-Related Investment Portfolio Composition
Current size:$266.681 billion2017 cap: $288.408 billionShrinkage year-over-year: 13.4%Shrinkage in less-liquid assets year-over-year: 17.7%
0
100
200
300
400
500
600
700
800
900
2006 2007 2008 2009 2010 2011 2012 2013 2014 2015 2016 2017
($ billions)
FNMA MBS in portfolio Non-FNMA agency MBS Non-agency MBS Mortgage loans
Sources: Fannie Mae and Urban Institute.
Fannie Mae Mortgage-Related Investment Portfolio Composition
Current size: $245.133 billion2017 cap: $288.408 billionShrinkage year-over-year: 20.0%Shrinkage in less-liquid assets year-over-year: 22.1%
September 2017
September 2017
25
GSES UNDER CONSERVATORSHIP
EFFECTIVE GUARANTEE FEES
Fannie Mae Upfront Loan-Level Price Adjustments (LLPAs)
LTV
Credit Score ≤60 60.01 – 70 70.01 – 75 75.01 – 80 80.01 – 85 85.01 – 90 90.01 – 95 95.01 – 97
> 740 0.00% 0.25% 0.25% 0.50% 0.25% 0.25% 0.25% 0.75%
720 – 739 0.00% 0.25% 0.50% 0.75% 0.50% 0.50% 0.50% 1.00%
700 – 719 0.00% 0.50% 1.00% 1.25% 1.00% 1.00% 1.00% 1.50%
680 – 699 0.00% 0.50% 1.25% 1.75% 1.50% 1.25% 1.25% 1.50%
660 – 679 0.00% 1.00% 2.25% 2.75% 2.75% 2.25% 2.25% 2.25%
640 – 659 0.50% 1.25% 2.75% 3.00% 3.25% 3.75% 2.75% 2.75%
620 – 639 0.50% 1.50% 3.00% 3.00% 3.25% 3.25% 3.25% 3.50%
< 620 0.50% 1.50% 3.00% 3.00% 3.25% 3.25% 3.25% 3.75%
Product Feature (Cumulative)
High LTV 0.00% 0.00% 0.00% 0.00% 0.00% 0.00% 0.00% 0.00%
Investment Property 2.125% 2.125% 2.125% 3.375% 4.125% N/A N/A N/A
Sources: Fannie Mae and Urban Institute.Note: For whole loans purchased on or after September 1, 2015, or loans delivered into MBS pools with issue dates on or after September 1, 2015.
57
52
0
10
20
30
40
50
60
70
1Q
09
3Q
09
1Q
10
3Q
10
1Q
11
3Q
11
1Q
12
3Q
12
1Q
13
3Q
13
1Q
14
3Q
14
1Q
15
3Q
15
1Q
16
3Q
16
1Q
17
3Q
17
Guarantee Fees Charged on New AcquisitionsFannie Mae single-family average charged g-fee on new acquisitions
Freddie Mac single-family guarantee fees charged on new acquisitions
Basis points
Sources: Fannie Mae, Freddie Mae and Urban Institute. Last updated November 2017.
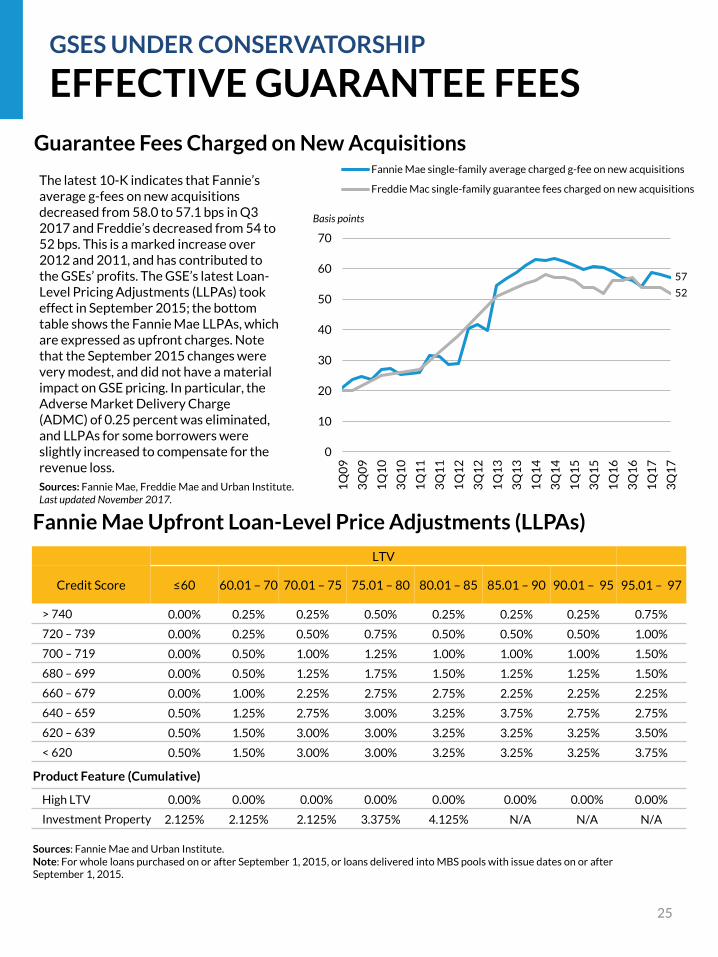
The latest 10-K indicates that Fannie’s average g-fees on new acquisitions decreased from 58.0 to 57.1 bps in Q3 2017 and Freddie’s decreased from 54 to 52 bps. This is a marked increase over 2012 and 2011, and has contributed to the GSEs’ profits. The GSE’s latest Loan-Level Pricing Adjustments (LLPAs) took effect in September 2015; the bottom table shows the Fannie Mae LLPAs, which are expressed as upfront charges. Note that the September 2015 changes were very modest, and did not have a material impact on GSE pricing. In particular, the Adverse Market Delivery Charge (ADMC) of 0.25 percent was eliminated, and LLPAs for some borrowers were slightly increased to compensate for the revenue loss.
26Sources: Fannie Mae, Freddie Mac and Urban Institute.Note: Classes A-H, M-1H, M-2H, and B-H are reference tranches only. These classes are not issued or sold. The risk is retained by Fannie Mae and Freddie Mac. “CE” = credit enhancement.
GSE RISK-SHARING TRANSACTIONSGSES UNDER CONSERVATORSHIP
Fannie Mae – Connecticut Avenue Securities (CAS)Date Transaction Reference Pool Size ($ m) Amount Issued ($m) % of Reference Pool Covered
2013 CAS 2013 deals $26,756 $675 2.5%
2014 CAS 2014 deals $227, 234 $5,849 2.6%
2015 CAS 2015 deals $187,126 $5,463 2.9%
February 2016 CAS 2016 – C01 $28,882 $945 3.3%
March 2016 CAS 2016 – C02 $35,004 $1,032 2.9%
April 2016 CAS 2016 – C03 $36,087 $1,166 3.2%
July 2016 CAS 2016 – C04 $42,179 $1,322 3.1%
August 2016 CAS 2016 - C05 $38,668 $1,202 3.1%
November 2016 CAS 2016 - C06 $33,124 $1,024 3.1%
December 2016 CAS 2016 – C07 $22,515 $702 3.1%
January 2017 CAS 2017 – C01 $43,758 $1,351 3.1%
March 2017 CAS 2017 – C02 $39,988 $1,330 3.3%
May 2017 CAS 2017 – C03 $41,246 $1,371 3.3%
May 2017 CAS 2017 – C04 $30,154 $1,003 3.3%
July 2017 CAS 2017 – C05 $43,751 $1,351 3.1%
August 2017 CAS 2017 – C06 $31,900 $1,101 3.5%
November 2017 CAS 2017– C07 $33,900 $1,200 3.5%
Total $942,272 $28,086 3.0%
Percent of Fannie Mae’s Total Book of Business 34.02%
Freddie Mac – Structured Agency Credit Risk (STACR) Date Transaction Reference Pool Size ($ m) Amount Issued ($m) % of Reference Pool Covered
2013 STACR 2013 deals $57,912 $1,130 2.0%
2014 STACR 2014 deals $147,120 $4,916 3.3%
2015 STACR 2015 deals $209,521 $6,658 3.2%
January 2016 STACR Series 2016 – DNA1 $35,700 $996 2.8%
March 2016 STACR Series 2016 – HQA1 $17,931 $475 2.6%
May 2016 STACR Series 2016 – DNA2 $30,589 $916 3.0%
May 2016 STACR Series 2016 – HQA2 $18,400 $627 3.4%
June 2016 STACR Series 2016 – DNA3 $26,400 $795 3.0%
September 2016 STACR Series 2016 – HQA3 $15,709 $515 3.3%
September 2016 STACR Series 2016 – DNA4 $24,845 $739 3.0%
October 2016 STACR Series 2016 - HQA4 $13,847 $478 3.5%
January 2017 STACR Series 2017 – DNA1 $33, 965 $802 2.4%
February 2017 STACR Series 2017 – HQA1 $29,700 $753 2.5%
April 2017 STACR Series 2017 – DNA2 $60,716 $1,320 2.2%
June 2017 STACR Series 2017 – HQA2 $31,604 $788 2.5%
September 2017 STACR Series 2017 – DNA3 $56,151 $1,200 2.1%
October 2017 STACR Series 2017 – HQA3 $21,641 $600 2.8%
Total $769,668 $23,708 2.8%
Percent of Freddie Mac’s Total Book of Business 48.15%
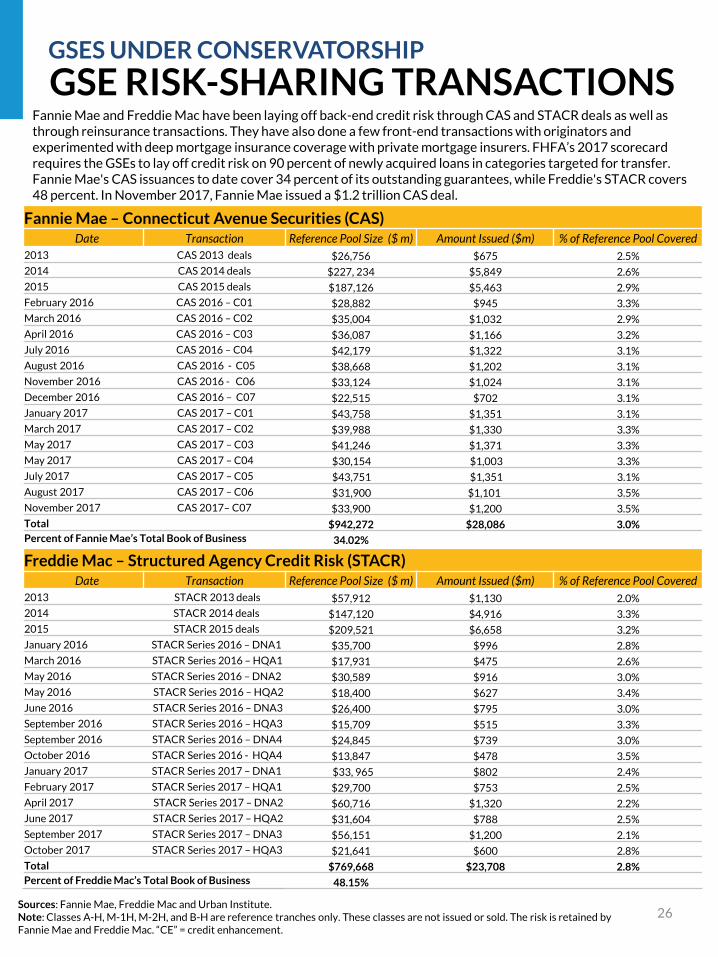
Fannie Mae and Freddie Mac have been laying off back-end credit risk through CAS and STACR deals as well as through reinsurance transactions. They have also done a few front-end transactions with originators and experimented with deep mortgage insurance coverage with private mortgage insurers. FHFA’s 2017 scorecard requires the GSEs to lay off credit risk on 90 percent of newly acquired loans in categories targeted for transfer. Fannie Mae's CAS issuances to date cover 34 percent of its outstanding guarantees, while Freddie's STACR covers 48 percent. In November 2017, Fannie Mae issued a $1.2 trillion CAS deal.

27Sources: Fannie Mae, Freddie Mac Press Releases and Urban Institute.
GSE RISK-SHARING SPREADSGSES UNDER CONSERVATORSHIP
0
200
400
600
800
1000
1200
1400
No
v-1
3
Fe
b-1
4
Ma
y-1
4
Au
g-1
4
No
v-1
4
Fe
b-1
5
Ma
y-1
5
Au
g-1
5
No
v-1
5
Fe
b-1
6
Ma
y-1
6
Au
g-1
6
No
v-1
6
Fe
b-1
7
Ma
y-1
7
Au
g-1
7
No
v-1
7
Low-LTV Pools (61 to 80 %)
0
200
400
600
800
1000
1200
1400
No
v-1
3
Fe
b-1
4
Ma
y-1
4
Au
g-1
4
No
v-1
4
Fe
b-1
5
Ma
y-1
5
Au
g-1
5
No
v-1
5
Fe
b-1
6
Ma
y-1
6
Au
g-1
6
No
v-1
6
Fe
b-1
7
Ma
y-1
7
Au
g-1
7
No
v-1
7
High-LTV Pools (81 to 95 %)
0
200
400
600
800
1000
1200
1400
Oct
-13
Jan
-14
Ap
r-1
4
Jul-
14
Oct
-14
Jan
-15
Ap
r-1
5
Jul-
15
Oct
-15
Jan
-16
Ap
r-1
6
Jul-
16
Oct
-16
Jan
-17
Ap
r-1
7
Jul-
17
Oct
-17
Low-LTV Pools (61 to 80 %)
CAS and STACR spreads have moved around considerably since 2013, with the bottom mezzanine tranche and the first loss bonds experiencing considerably more volatility than the top mezzanine bonds. Tranche B in particular has been highly volatile because of its first loss position. Spreads widened especially during Q1 2016 due to falling oil prices, concerns about global economic growth and the slowdown in China. Since then spreads have resumed their downward trend but remain volatile. Secondary market spreads, not reflected here, widened considerably post Hurricanes Harvey and Irma, but have largely snapped back to their pre-hurricane levels.
Fannie Mae CAS Spreads at-issuance (basis points over 1-month LIBOR)
Freddie Mac STACR Spreads at-issuance (basis points over 1-month LIBOR)
0
200
400
600
800
1000
1200
1400
Oct
-13
Jan
-14
Ap
r-1
4
Jul-
14
Oct
-14
Jan
-15
Ap
r-1
5
Jul-
15
Oct
-15
Jan
-16
Ap
r-1
6
Jul-
16
Oct
-16
Jan
-17
Ap
r-1
7
Jul-
17
Oct
-17
High-LTV Pools (81 to 95 %)
Tranche 1B
Tranche 1M-2
Tranche 1M-1
Tranche 2B
Tranche 2B-1Tranche 2M-2
Tranche 2M-1
Tranche B
Tranche M-3
Tranche B-2
Tranche M-2
Tranche M-1
Basis points (bps) Basis points (bps)
Tranche B-1
Tranche B-2
Tranche B
Tranche M-3 Tranche B-1
Tranche M-2
Tranche M-1
Basis points (bps) Basis points (bps)
Tranche 1B-1
28
SERIOUS DELINQUENCY RATES AT THE GSEs
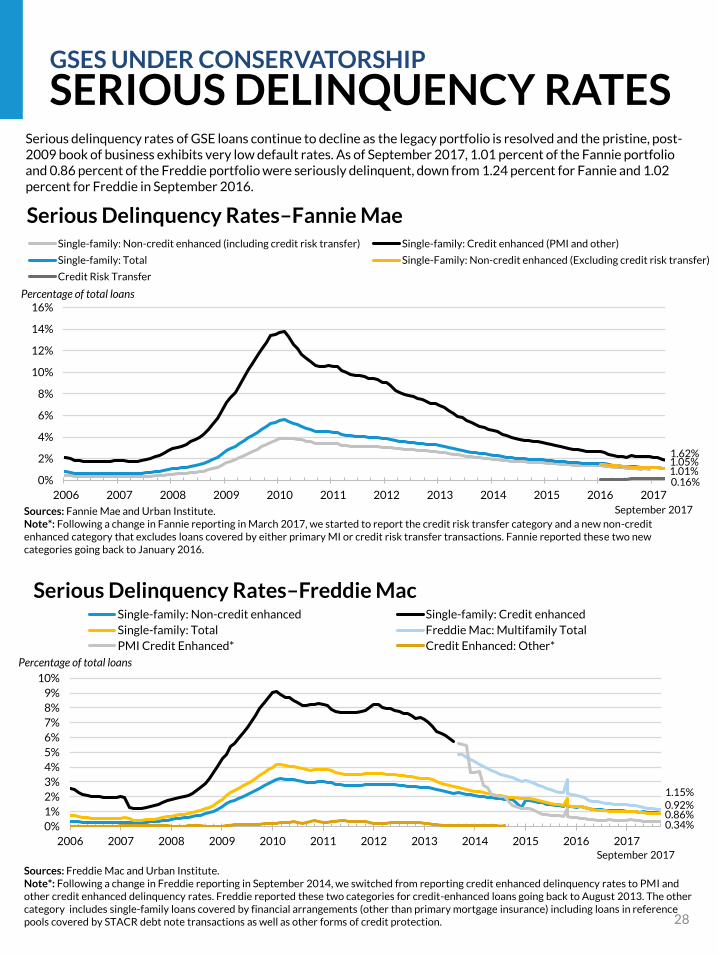
Serious delinquency rates of GSE loans continue to decline as the legacy portfolio is resolved and the pristine, post-2009 book of business exhibits very low default rates. As of September 2017, 1.01 percent of the Fannie portfolio and 0.86 percent of the Freddie portfolio were seriously delinquent, down from 1.24 percent for Fannie and 1.02 percent for Freddie in September 2016.
GSES UNDER CONSERVATORSHIP
SERIOUS DELINQUENCY RATES
1.05%1.62%
0.16%0%
2%
4%
6%
8%
10%
12%
14%
16%
2006 2007 2008 2009 2010 2011 2012 2013 2014 2015 2016 2017
Percentage of total loans
Serious Delinquency Rates–Fannie MaeSingle-family: Non-credit enhanced (including credit risk transfer) Single-family: Credit enhanced (PMI and other)
Single-family: Total Single-Family: Non-credit enhanced (Excluding credit risk transfer)
Credit Risk Transfer
Sources: Fannie Mae and Urban Institute.Note*: Following a change in Fannie reporting in March 2017, we started to report the credit risk transfer category and a new non-credit enhanced category that excludes loans covered by either primary MI or credit risk transfer transactions. Fannie reported these two new categories going back to January 2016.
1.01%
1.15%
0.34%0%
1%
2%
3%
4%
5%
6%
7%
8%
9%
10%
2006 2007 2008 2009 2010 2011 2012 2013 2014 2015 2016 2017
Percentage of total loans
Serious Delinquency Rates–Freddie MacSingle-family: Non-credit enhanced Single-family: Credit enhanced
Single-family: Total Freddie Mac: Multifamily Total
PMI Credit Enhanced* Credit Enhanced: Other*
Sources: Freddie Mac and Urban Institute.Note*: Following a change in Freddie reporting in September 2014, we switched from reporting credit enhanced delinquency rates to PMI and other credit enhanced delinquency rates. Freddie reported these two categories for credit-enhanced loans going back to August 2013. The other category includes single-family loans covered by financial arrangements (other than primary mortgage insurance) including loans in reference pools covered by STACR debt note transactions as well as other forms of credit protection.
September 2017
September 2017
0.86% 0.92%

29
SERIOUS DELINQUENCY RATESGSES UNDER CONSERVATORSHIP
Serious delinquencies for GSE single-family loans remained flat, while FHA and VA delinquencies edged up slightly to 3.86 and 2.08 percent in Q3 2017. This uptick reflects primarily seasonal factors. GSE multifamily delinquencies have declined to pre-crisis levels, although they did not reach problematic levels even in the worst years of the crisis.
0.02%0.0%
0.1%
0.2%
0.3%
0.4%
0.5%
0.6%
0.7%
0.8%
0.9%
1.0%
2005 2006 2007 2008 2009 2010 2011 2012 2013 2014 2015 2016 2017
Percentage of total loans
Serious Delinquency Rates–Multifamily GSE Loans
Fannie Mae Freddie Mac
Sources: Fannie Mae, Freddie Mac and Urban Institute.Note: Multifamily serious delinquency rate is the unpaid balance of loans 60 days or more past due, divided by the total unpaid balance.
0.03%
September 2017
1.01%0.86%
3.86%
2.08%
0%
1%
2%
3%
4%
5%
6%
7%
8%
9%
10%
1Q
05
3Q
05
1Q
06
3Q
06
1Q
07
3Q
07
1Q
08
3Q
08
1Q
09
3Q
09
1Q
10
3Q
10
1Q
11
3Q
11
1Q
12
3Q
12
1Q
13
3Q
13
1Q
14
3Q
14
1Q
15
3Q
15
1Q
16
3Q
16
1Q
17
3Q
17
Fannie Mae Freddie Mac FHA VA
Sources: Fannie Mae, Freddie Mac, MBA Delinquency Survey and Urban Institute. Note: Serious delinquency is defined as 90 days or more past due or in the foreclosure process. Not seasonally adjusted.
Serious Delinquency Rates–Single-Family Loans
30
Agency Gross Issuance Agency Net Issuance
AGENCY GROSS AND NET ISSUANCE
AGENCY ISSUANCE
Issuance Year
GSEs Ginnie Mae Total
2000 $360.6 $102.2 $462.8
2001 $885.1 $171.5 $1,056.6
2002 $1,238.9 $169.0 $1,407.9
2003 $1,874.9 $213.1 $2,088.0
2004 $872.6 $119.2 $991.9
2005 $894.0 $81.4 $975.3
2006 $853.0 $76.7 $929.7
2007 $1,066.2 $94.9 $1,161.1
2008 $911.4 $267.6 $1,179.0
2009 $1,280.0 $451.3 $1,731.3
2010 $1,003.5 $390.7 $1,394.3
2011 $879.3 $315.3 $1,194.7
2012 $1,288.8 $405.0 $1,693.8
2013 $1,176.6 $393.6 $1,570.1
2014 $650.9 $296.3 $947.2
2015 $845.7 $436.3 $1,282.0
2016 $991.59 $508.18 $1,499.77
2017 YTD $721.26 $381.61 $1,102.87
2017 YTD %Change YOY
-8.6% -7.9% -8.4%
2017 Ann $865.51 $457.93 $1,323.44
Issuance Year
GSEs Ginnie Mae Total
2000 $159.8 $29.3 $189.1
2001 $368.4 -$9.9 $358.5
2002 $357.2 -$51.2 $306.1
2003 $334.9 -$77.6 $257.3
2004 $82.5 -$40.1 $42.4
2005 $174.2 -$42.2 $132.0
2006 $313.6 $0.2 $313.8
2007 $514.9 $30.9 $545.7
2008 $314.8 $196.4 $511.3
2009 $250.6 $257.4 $508.0
2010 -$303.2 $198.3 -$105.0
2011 -$128.4 $149.6 $21.2
2012 -$42.4 $119.1 $76.8
2013 $69.1 $87.9 $157.0
2014 $30.5 $61.6 $92.1
2015 $75.1 $97.3 $172.5
2016 $135.5 $125.3 $260.8
2017 YTD $131.4 $116.5 $247.9
2017 YTD %Change YOY
34.9% 11.9% 23.0%
2017 Ann $157.7 $139.8 $297.5
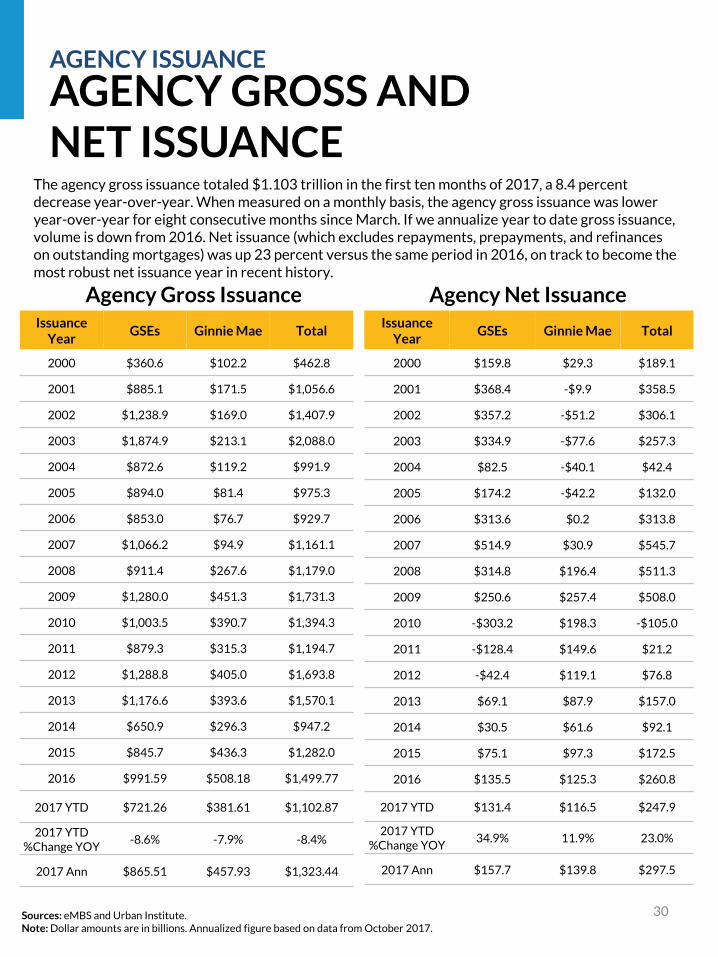
The agency gross issuance totaled $1.103 trillion in the first ten months of 2017, a 8.4 percent decrease year-over-year. When measured on a monthly basis, the agency gross issuance was lower year-over-year for eight consecutive months since March. If we annualize year to date gross issuance, volume is down from 2016. Net issuance (which excludes repayments, prepayments, and refinances on outstanding mortgages) was up 23 percent versus the same period in 2016, on track to become the most robust net issuance year in recent history.
Sources: eMBS and Urban Institute.Note: Dollar amounts are in billions. Annualized figure based on data from October 2017.

31
AGENCY GROSS AND NET ISSUANCE BY MONTH
AGENCY ISSUANCE
AGENCY GROSS ISSUANCE & FED PURCHASES
0
50
100
150
200
250
20
01
20
02
20
03
20
04
20
05
20
06
20
07
20
08
20
09
20
10
20
11
20
12
20
13
20
14
20
15
20
16
20
17
($ billions)
Monthly Gross Issuance
Fannie Mae Freddie Mac Ginnie Mae
October 2017Sources: eMBS, Federal Reserve Bank of New York, and Urban Institute.
While government and GSE lending have dominated the mortgage market since the crisis, there has been a change in the mix. The Ginnie Mae share reached a peak of 28 percent of total agency issuance in 2010, declined to 25 percent in 2013, and has bounced back sharply since then. With the elevated mortgage rates since the election, monthly agency issuance has been lower year over year for eight consecutive months since March. Less dependent on refinances, Ginnie Mae gross issuance experienced less of a drop, driving its share up to 33 percent in October 2017.
0
50
100
150
200
250
2001 2002 2003 2004 2005 2006 2007 2008 2009 2010 2011 2012 2013 2014 2015 2016 2017
($ billions)
Fed Absorption of Agency Gross Issuance
Gross issuance Total Fed purchases
In October 2014, the Fed ended its purchase program, but continued buying at a much reduced level, reinvesting funds from pay downs on mortgages and agency debentures into the mortgage market. Since then, the Fed’s absorption of gross issuance has been between 20 and 30 percent. In October 2017, the Fed began its balance sheet reduction plan. Total Fed purchases decreased sharply from $26.8 billion to $22.5 billion, yielding Fed absorption of gross issuance of 19.4 percent, the lowest level in the past five years. This is a slow wind down; initially, the Fed will continue to reinvest, but by less than their run off.
Sources: eMBS, Federal Reserve Bank of New York and Urban Institute.
October 2017
32
MORTGAGE INSURANCE ACTIVITY
AGENCY ISSUANCE
0%
10%
20%
30%
40%
50%
60%
70%
80%
90%
100%
19981999200020012002200320042005200620072008200920102011201220132014201520162017Q1
2017Q2
2017Q3
MI Market Share Total private primary MI FHA VA
Sources: Inside Mortgage Finance and Urban Institute. Last updated November 2017.
77
69
46
192
0
50
100
150
200
($ billions) Total private primary MI FHA VA Total
MI Activity
Sources: Inside Mortgage Finance and Urban Institute. Last updated November 2017.
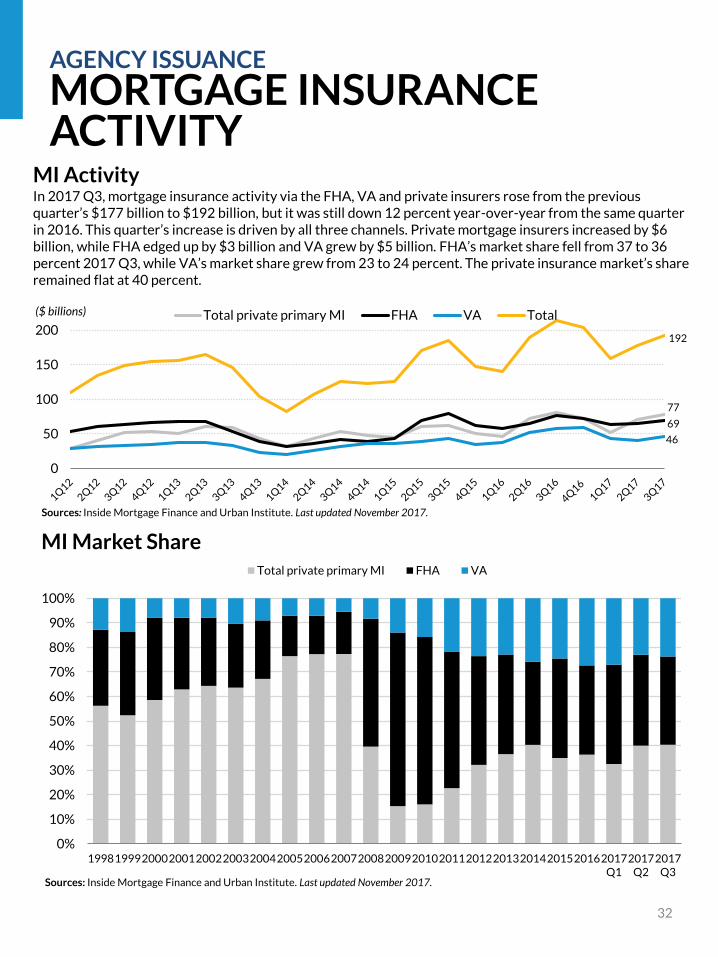
In 2017 Q3, mortgage insurance activity via the FHA, VA and private insurers rose from the previous quarter’s $177 billion to $192 billion, but it was still down 12 percent year-over-year from the same quarter in 2016. This quarter’s increase is driven by all three channels. Private mortgage insurers increased by $6 billion, while FHA edged up by $3 billion and VA grew by $5 billion. FHA’s market share fell from 37 to 36 percent 2017 Q3, while VA’s market share grew from 23 to 24 percent. The private insurance market’s share remained flat at 40 percent.

33
MORTGAGE INSURANCE ACTIVITY
AGENCY ISSUANCE
FHA MI Premiums for Typical Purchase Loan
Case number dateUpfront mortgage insurance premium
(UFMIP) paidAnnual mortgage insurance
premium (MIP)1/1/2001 - 7/13/2008 150 50
7/14/2008 - 4/5/2010* 175 55
4/5/2010 - 10/3/2010 225 55
10/4/2010 - 4/17/2011 100 90
4/18/2011 - 4/8/2012 100 115
4/9/2012 - 6/10/2012 175 125
6/11/2012 - 3/31/2013a 175 125
4/1/2013 – 1/25/2015b 175 135
Beginning 1/26/2015c 175 85
Sources: Ginnie Mae and Urban Institute.Note: A typical purchase loan has an LTV over 95 and a loan term longer than 15 years. Mortgage insurance premiums are listed in basis points. * For a short period in 2008 the FHA used a risk based FICO/LTV matrix for MI. a
Applies to purchase loans less than or equal to $625,500. Those over that amount have an annual premium of 150 bps.b
Applies to purchase loans less than or equal to $625,500. Those over that amount have an annual premium of 155 bps.c
Applies to purchase loans less than or equal to $625,500. Those over that amount have an annual premium of 105 bps.
FHA premiums rose significantly in the years following the housing crash, with annual premiums rising 170 percent from 2008 to 2013 as FHA worked to shore up its finances. In January 2015, President Obama announced a 50 bps cut in annual insurance premiums, making FHA mortgages more attractive than GSE mortgages for all borrowers. The April 2016 reduction in PMI rates for borrowers with higher FICO scores has partially offset that. As shown in the bottom table, a borrower putting 3.5 percent down will now find FHA more economical except for those with FICO scores of 740 or higher.
AssumptionsProperty Value $250,000Loan Amount $241,250LTV 96.5Base Rate
Conforming 4.12%FHA 4.02%
Initial Monthly Payment Comparison: FHA vs. PMI
FICO 620 - 639 640 - 659 660 - 679 680 - 699 700 - 719 720 - 739 740 - 759 760 +
FHA MI Premiums
FHA UFMIP 1.75% 1.75% 1.75% 1.75% 1.75% 1.75% 1.75% 1.75%
FHA MIP 0.85% 0.85% 0.85% 0.85% 0.85% 0.85% 0.85% 0.85%
PMI
GSE LLPA* 3.50% 2.75% 2.25% 1.50% 1.50% 1.00% 0.75% 0.75%
PMI Annual MIP 2.25% 2.05% 1.90% 1.40% 1.15% 0.95% 0.75% 0.55%
Monthly Payment
FHA $1,350 $1,350 $1,350 $1,350 $1,350 $1,350 $1,350 $1,350
PMI $1,730 $1,668 $1,623 $1,501 $1,451 $1,396 $1,349 $1,309
PMI Advantage ($380) ($318) ($273) ($151) ($101) ($46) $1 $41
Sources: Genworth Mortgage Insurance, Ginnie Mae and Urban Institute.Note: Mortgage insurance premiums listed in percentage points. Grey shade indicates FHA monthly payment is more favorable, while light blue indicates PMI is more favorable. The PMI monthly payment calculation does not include special programs like Fannie Mae’s HomeReady and Freddie Mac’s Home Possible (HP), both offer more favorable rates for low- to moderate-income borrowers.LLPA= Loan Level Price Adjustment, described in detail on page 21.

34
Projects
The Mortgage Servicing Collaborative
Housing Credit Availability Index (HCAI)
Access and Affordability
Home Mortgage Disclosure Act Projects
Publications
Barriers to Accessing Homeownership: Down Payment, Credit, and AffordabilityAuthors: Laurie Goodman, Alanna McCargo, Edward Golding, Bing Bai, Bhargavi Ganesh, Sarah StrochakDate: November 16, 2017
What the 2016 Survey of Consumer Finances Tells Us about Senior HomeownersAuthors: Laurie Goodman, Karan Kaul, Jun ZhuDate: November 8, 2017
Normalizing the Federal Reserve’s Balance SheetAuthors: Laurie Goodman, Bing BaiDate: November 2, 2017
Housing Profile of Storm AreasAuthors: Bing Bai, Sarah Strochak, Bhargavi GaneshDate: October 27, 2017
The Relationship between Housing and Asthma among School-Age ChildrenAuthors: Bhargavi Ganesh, Corianne Scally, Laura Skopec, Jun ZhuDate: October 16, 2017
Mortgage Insurance Data at a GlanceAuthors: Laurie Goodman, Alanna McCargo, Sheryl Pardo, Jun Zhu, Bing Bai, Karan Kaul, Bhargavi GaneshDate: August 22, 2017
Sixty Years of Private Mortgage Insurance in the United StatesAuthors: Laurie Goodman, Karan KaulDate: August 22, 2017
The Impact of Higher Interest Rates on the Mortgage MarketAuthors: Laurie GoodmanDate: August 10, 2017
Blog Posts
A tale of three cities: How Detroit, San Francisco, and Houston weathered the housing boom and bustAuthors: Bhargavi Ganesh, Bing BaiDate: November 7, 2017
How fintech innovations can help bridge the wealth gapAuthors: Sarah StrochakDate: November 6, 2017
How will Hurricanes Harvey and Irma affect housing markets in Texas and Florida?Authors: Sarah Strochak, Bhargavi GaneshDate: October 26, 2017
America isn’t in a housing bubble, but some cities might beAuthors: Bing Bai, Edward GoldingDate: October 25, 2017
Five things that may surprise you about the fastest growing segment of the housing marketAuthors: Sarah StrochakDate: October 3, 2017
The mortgage industry needs a modernized disaster recovery toolkitAuthors: Karan Kaul, Laurie GoodmanDate: September 22, 2017
How HARP saved borrowers billions and improved the housing finance systemAuthors: Jim Parrott, Laurie Goodman, Karan Kaul, Jun ZhuDate: September 20, 2017
Visualizing Hurricane Harvey’s impact on Houston’s neighborhoodsAuthors: Bhargavi Ganesh, Sarah StrochakDate: September 15, 2017
Five things every policymaker should know about nonbanks and the evolving mortgage industryAuthors: Laurie Goodman, Karan Kaul, Bing BaiDate: September 5, 2017
Why the single-family rental merger won’t hurt homebuyers or rentersAuthors: Laurie Goodman, Robert AbareDate: August 14, 2017
Upcoming events:Please check out our events page for more details.
PUBLICATIONS AND EVENTSRELATED HFPC WORK

35
Copyright © November 2017. The Urban Institute. All rights reserved. Permission is granted for reproduction of this file, with attribution to the Urban Institute. The Urban Institute is a nonprofit, nonpartisan policy research and educational organization that examines the social, economic, and governance problems facing the nation.
Acknowledgments
The Housing Finance Policy Center (HFPC) was launched with generous support at the leadership level from the Citi Foundation and John D. and Catherine T. MacArthur Foundation. Additional support was provided by The Ford Foundation and The Open Society Foundations.
Ongoing support for HFPC is also provided by the Housing Finance Innovation Forum, a group of organizations and individuals that support high-quality independent research that informs evidence-based policy development. Funds raised through the Forum provide flexible resources, allowing HFPC to anticipate and respond to emerging policy issues with timely analysis. This funding supports HFPC’s research, outreach and engagement, and general operating activities.
The chartbook is funded by these combined sources. We are grateful to them and to all our funders, who make it possible for Urban to advance its mission.
The views expressed are those of the authors and should not be attributed to the Urban Institute, its trustees, or its funders. Funders do not determine research findings or the insights and recommendations of Urban experts. Further information on the Urban Institute’s funding principles is available at www.urban.org/support.
Housing Finance Innovation Forum Members as of November 2017
OrganizationsArch MIBank of America Foundation BlackRock Caliber Home LoansDownPayment ResourceEllington Management GroupFinance of America Reverse, LLCFreddie MacGenworthHousing Policy CouncilJPMorgan ChaseMortgage Bankers Association Mr. CooperNational Association of Home BuildersNational Association of Realtors OcwenPennyMacPretium Partners PricewaterhouseCoopersProspect MortgagePulte Home Mortgage Quicken LoansTIG AdvisorsTwo Harbors Investment Corp.U.S. Mortgage Insurers (USMI)VantageScoreWells Fargo & Company400 Capital Management
Individuals Raj DateMary MillerJim Millstein Beth MlynarczykToni MossShekar Narasimhan Faith Schwartz Mark Zandi
Data Partners CoreLogicMoody’s AnalyticsZillow