housing policy and the housing system in australia: an ... · growth (see figure 1.12) , through...
TRANSCRIPT

1
Housing policy and the housing system in Australia: an overview
Report for the Shaping Housing Futures Project
Chris Martin, Hal Pawson and Ryan van den Nouwelant
June 2016
© City Futures Research Centre, Faculty of Built Environment, University of NSW Australia 2016
City Futures Research Centre

2
Contents
1. Measures of structure, outcomes and performance .................................................................. 3
1.1 Population and dwellings .............................................................................................................. 3
1.2 Housing tenure .............................................................................................................................. 5
1.3 House prices, rents and affordability ............................................................................................ 8
2. Brief narratives on key topics ................................................................................................. 14
2.1 Housing policy governance: national and sub-national level ..................................................... 14
2.2 Housing subsidy, tax and finance arrangements ........................................................................ 15
2.2.1 Housing subsidies ................................................................................................................. 15
2.2.2 Housing and tax ................................................................................................................... 17
2.2.3 Housing finance .................................................................................................................... 19
3. Key housing policy developments that shape the present policy environment ......................... 22
4. How low-cost housing is provided and funded ........................................................................ 24
5. Key contemporary challenges for housing policy and practice.................................................. 26
5.1 The house price boom – unaffordable and inaccessible home ownership ................................ 26
5.2 The house price bust? ................................................................................................................. 26
5.3 The lack of low-cost private rental housing ................................................................................ 26
5.4 The spiral of decline in public housing ........................................................................................ 26
6. Key emerging trends that will shape and impact on the future housing system ........................ 28
6.1 Population growth ...................................................................................................................... 28
6.2 Urban consolidation .................................................................................................................... 28
6.3 Disruptive technologies – Airbnb and the use of houses other than as homes ......................... 28
6.4 The land tax/value capture agenda ............................................................................................ 28
References ................................................................................................................................. 29

3
1. Measures of structure, outcomes and performance
1.1 Population and dwellings
The 2011 Census counted almost 21 million persons in Australia, housed in 9.1 million private dwellings. Over the past decade the population has grown strongly, particularly through migration (see Figure 1.1). However, following a steady decline throughout the twentieth century, average household size has been flat since 1996 (AIFS, 2016).
Figure 1.1 Annual population growth, Australia 1982-2015
Source: ABS Table 3101.0
Figure 1.2 Annual dwelling completions, Australia 1985-2014
Source: Hulse et al (2014).
The number of dwellings also has grown (see Figure 1.2) although, in the decade to 2011, at a slightly slower rate than population. During this period, annual housing approvals averaged 179,000 across Australia (ABS Table 8731). More latterly, however, largely reflecting a rental-investor-driven apartment construction boom in Sydney, Melbourne and Brisbane (see Figure 1.3), total national
0
50,000
100,000
150,000
200,000
250,000
300,000
350,000
400,000
450,000
500,000
1982
1984
1986
1988
1990
1992
1994
1996
1998
2000
2002
2004
2006
2008
2010
2012
2014
Annu
al p
opul
atio
n ch
ange
Natural increase
Net migration
Overall

4
housebuilding has risen to record levels. In the three years to 2015, building approvals rose to 208,000, reaching 236,000 in 2015 (ABS Table 8731).
Figure 1.3 Building approvals, apartments 2006-2016
Source: Shoory (2016)
The picture of housing demand and supply is complicated by two further factors. One is the recent strong demand for properties by non-residents – see Figure 1.4.
Figure 1.4 Foreign buyers’ share of new dwelling sales, Australia 2010-2015.
Source: NAB (2016).
Secondly, there is a significant and persistent stock of unoccupied dwellings: the Census counts about 935,000 unoccupied dwellings – almost 11% of the housing stock (Troy & Randolph, 2016).
As shown in Figure 1.5, most of Australia’s dwellings are separate houses (74%). However apartments (15%) and semi-detached houses (10%) grew more strongly over the intercensal period 2001-2011 (see Figure 1.6) and this is likely to have continued, especially in Sydney, Melbourne and Brisbane.

5
Figure 1.5 Dwellings, Australia 2011
Source: ABS Census of Population and Housing, 2001 and 2011
Figure 1.6 Dwellings, rate of growth, Australia 2001-11
Source: ABS Census of Population and Housing, 2001 and 2011
1.2 Housing tenure
At the 2013-14 Survey of Income and Housing, about two-thirds Australian households owned the dwelling they occupied: 31% own without a mortgage, 36% own subject to a mortgage (see Figure 1.7). Almost one-third of households were renting: 26% in the private rental sector (PRS), 4% in public housing, and 1% in community housing. Over the past two decades, the rate of homeownership – with and without a mortgage – has declined from 71% to 67%; private rental meanwhile has expanded from 18% to 25% of all households.
01,0002,0003,0004,0005,0006,0007,0008,000
Thou
sand
s
0%
10%
20%
30%
40%
50%
60%
70%
Separate house Semi-detachedhouse
Apartment (up tothree storeys)
Apartment (fourstoreys and over)

6
Figure 1.7 Housing tenures, Australia 1994/95-2013-14
Source: ABS, Housing Occupancy and Costs 2013-14. Note: in this source, ‘private landlord’ includes community housing providers
Figure 1.8 Home ownership and age, Australia 1960-2010.
Source: RBA (2015)
As shown in Figure 1.8, the decline in rates owner-occupation has been more pronounced amongst younger households (the overall owner-occupation rate has been held up by declining rates of mortality amongst older persons, who are more likely to by owner-occupiers).
The decline in owner-occupation rates is reflected in the growth of the PRS – and in the growth of higher income households in the PRS – see Figure 1.9.
0%10%20%30%40%50%60%70%80%90%
100%
1994
–95
1995
–96
1996
–97
1997
–98
1999
–00
2000
–01
2002
–03
2003
–04
2005
–06
2007
–08
2009
–10
2011
–12
2013
–14
Private landlord
State/territory housingauthority
Owner with a mortgage
Owner without amortgage
7
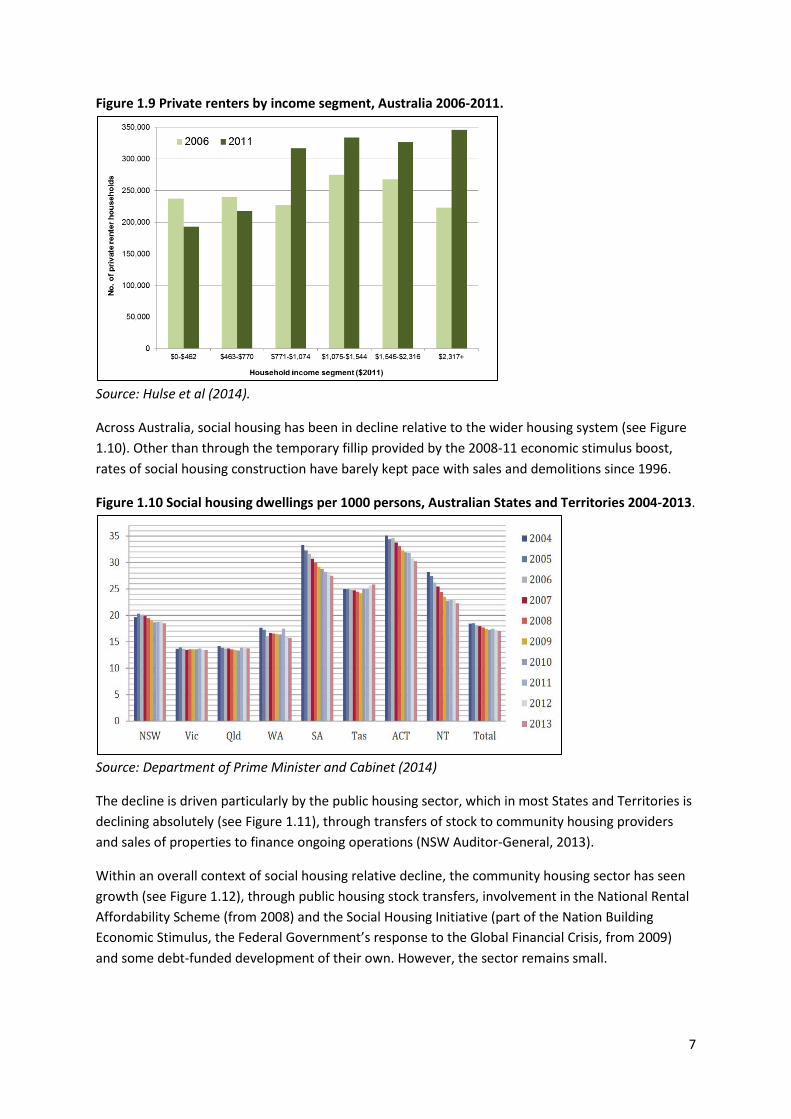
Figure 1.9 Private renters by income segment, Australia 2006-2011.
Source: Hulse et al (2014).
Across Australia, social housing has been in decline relative to the wider housing system (see Figure 1.10). Other than through the temporary fillip provided by the 2008-11 economic stimulus boost, rates of social housing construction have barely kept pace with sales and demolitions since 1996.
Figure 1.10 Social housing dwellings per 1000 persons, Australian States and Territories 2004-2013.
Source: Department of Prime Minister and Cabinet (2014)
The decline is driven particularly by the public housing sector, which in most States and Territories is declining absolutely (see Figure 1.11), through transfers of stock to community housing providers and sales of properties to finance ongoing operations (NSW Auditor-General, 2013).
Within an overall context of social housing relative decline, the community housing sector has seen growth (see Figure 1.12), through public housing stock transfers, involvement in the National Rental Affordability Scheme (from 2008) and the Social Housing Initiative (part of the Nation Building Economic Stimulus, the Federal Government’s response to the Global Financial Crisis, from 2009) and some debt-funded development of their own. However, the sector remains small.

8
Figure 1.11 Public housing per 1000 persons, Australian States and Territories 2004-2013
Source: Department of Prime Minister and Cabinet (2014).
Figure 1.12 Community housing per 1000 persons, Australian States and Territories 2004-2013.
Source: Department of Prime Minister and Cabinet (2014)
1.3 House prices, rents and affordability
House prices have risen substantially in real terms over the past two decades in all Australian capital cities and across regional Australia generally. Since 2012, however, Sydney and Melbourne prices have diverged sharply from the remainder of the country (see Figure 1.13). In part, the recent trends for cities such as Brisbane, Darwin and Perth reflect the ‘drag’ effect resulting from the end of the mining boom around 2013. Very modest price growth in Adelaide and Hobart is associated with more longstanding relative economic weakness.
House prices increases have generally outpaced increases in incomes (Figure 1.14), although low interest rates have lately reduced loan servicing costs (Figure 1.15). However, with deposit requirements continuing to rise in parallel with prices the threshold for accessing owner-occupation has become as much or more a matter of wealth rather than income (Figure 1.16).

9
Figure 1.13 House prices, Australia 2006-2015
Source: RBA (2016)
Figure 1.14 Ratio of house prices to income, Australia 1980-2014
Source: RBA (2015)

10
Figure 1.15 Repayments on new housing loans, Australia 1980-2014.
Source: RBA (2015)
Figure 1.16 Home loan deposit to income, Australia 1990-2014.
Source: RBA (2015)
One impact of rising prices has been a ballooning volume of household debt. As a proportion of national disposable income, Australia’s household debt has increased from 141% to 206% since 2000 – a rise of between a third and a half. As shown in Figure 1.17, Australia’s position lay near the top of the 2014 OECD ranking on this metric. The issue of housing-related household debt is further discussed in Section

11
Figure 1.17 2014 household debt ratios for OECD countries
Source: OECD statistics
Following a period of relative stability in the early 2000s, private rents have increased in real terms over the past decade – see Figure 1.18.
Figure 1.18 Real rents, annual growth, Australia 1985-2014
Source: Hulse et al (2014)
Closer examination of changes in the shape of the PRS – that is, the changing distribution of rental price points over time – shows a particular problem of rising rents at the lower-cost end of the market. Thus, while weekly rents were clustered around the $200 mark in 1996 and 2001, by 2011, the shape of the distribution had shifted ‘upmarket’, with rents bunched in the $350-500 per week range (see Figure 1.19).
0
50
100
150
200
250
300
HUN
SVN
CHL
POL
SVK
CZE
EST
AUT
ITA
DEU
FRA
BEL
USA
GRC
FIN
ESP
JPN
PRT
GBR
KOR
CAN
SWE
AUS
IRL
NO
RN
LDDN
K
Tota
l hou
seho
ld d
ebt a
s %
of n
et
disp
osib
le in
com
e, 2
014

12
Figure 1.19 Distribution of rents, Australia 1996-2011
Source: Hulse et al (2014)
Across the whole of the lower income cohort, rates of housing stress (that is, where housing costs exceed 30% of household income) and housing crisis (housing costs exceed 50% of household income) are highest among private renters. Among low income private tenants the median ratio of rent and other housing costs to gross household income is 35%. Comparable figures for social renters, those buying with a mortgage and those owning outright are 23%, 26% and 6%, respectively (see Figure 1.20).
Figure 1.20 Housing costs to income ratio: households in bottom two quintiles, by tenure, Australia 2013-14
Source: ABS, Housing Costs and Occupancy 2013-14 The incidence of private rental housing stress has also been growing over time. As shown in Figure 1.21, with rents rising faster than earnings at the lower end of the income scale, the proportion of lower income renters paying ‘affordable’ rents (less than 30% of incomes) fell from 53% to 46% in the five years to 2011.
0%
10%
20%
30%
40%
50%
60%
70%
80%
90%
100%
Owner withouta mortgage
Owner with amortgage
State/territoryhousing
authority
Privatelandlord
More than 50%
More than 30% to 50%
30% or less

13
Figure 1.21 Private renters in lowest 40% of income distribution, 2006 and 2011
Source: Hulse et al (2015)
53 46
38 40
10 14
0%
20%
40%
60%
80%
100%
2006 2011
% o
f all
low
er in
com
e pr
ivat
e re
nter
s
Paying severely unaffordable rentPaying unaffordable rentPaying affordable rent

14
2. Brief narratives on key topics
2.1 Housing policy governance: national and sub-national level
Australia currently has no formal national housing minister, department or policy. It does, however, have what might be called an implicit housing policy embedded in official stances on tax, monetary settings, retirement incomes and finance sector regulation. A central outcome of this implicit housing policy – high and rising house prices – is contrary to conventional housing policy objectives of greater affordability, security and dignity, but those objectives are not properly articulated or prosecuted in present housing policy governance arrangements.
For decades, Federal Governments had a ministerial-level housing portfolio that was variously connected with construction, community services, local government and regional development. From 1996, the Howard Liberal-National Coalition Government dispensed with the housing portfolio entirely, with only the Social Services Minister having a formal, narrowly defined housing brief in relation to social housing policy (conducted largely through the Commonwealth-State Housing Agreement, a long-standing tied-grant funding arrangement, much reduced by the Howard Government).
Under the three Labor Governments of 2007-2013, six persons in turn held a variously-configured housing portfolio expressly connected with social housing and homelessness. This period saw a degree of housing policy activism, with the Commonwealth-State Housing Agreement replaced by the National Affordable Housing Agreement and the implementation of the National Rental Affordability Scheme (NRAS) and, as part of the Nation Building Economic Stimulus, the Social Housing Initiative.
As from 2013, however, the Abbott Government once more dispensed with the housing portfolio, terminated further rounds of NRAS, and commenced work on a ‘Reform of the Federation White Paper’, which flagged the prospect of further retrenchment of the Federal Government from social housing policy and funding. Under the post-2015 Turnbull Government, the Reform of the Federation White Paper has not proceeded, and the Council for Federal Financial Relations has instead been tasked with developing proposal for ‘affordable housing’ policy and assistance; ‘affordable housing’ is also part of the new portfolio of the Assistant Minister for Cities and Digital Transformation.
Similar changes in policy governance can be seen at the level of the States and Territories. For decades all had a Housing Minister and a State (or Territory) housing department concerned primarily with the provision of public housing and, lately, with the regulation of the relatively small sector of community housing providers. Recently there have been some changes to the traditional arrangements: Tasmania no longer has a designated Housing Minister (the Minister for Human Services is responsible) and New South Wales has a ‘Minister for Social Housing’ only; South Australia, on the other hand, has both a Housing Minister and a Social Housing Minister. The dominant – albeit not universal – trend has been for the integration of formerly distinct housing entities within community services/human services departments.
As the housing portfolio at Federal and State levels has been redrawn and reduced, so too has capacity for housing policy development and implementation within the bureaucracies. In particular,

15
the Federal Government and, lately, the New South Wales State Government have liquidated specialist housing units and roles and have shed the vast majority of senior staff with experience and expertise in housing. Now lacking internal capacity, increasing resort is being made to large consultancy firms for housing policy development.
2.2 Housing subsidy, tax and finance arrangements
2.2.1 Housing subsidies Australian governments subsidise actors in the housing sector both through cash transfers and through preferential tax treatments (‘tax expenditures’). This section considers the former only; the latter are consider in the subsequent section on tax.
The most important cash subsidies are Rent Assistance, grants for social housing and affordable housing, and First Home Owner Grants.
Rent Assistance is a Federal social security payment to persons who receive certain other social security payments and who live in non-government rental housing. Notably, tenants of community housing and Indigenous housing providers are eligible for Rent Assistance, and the payment has become regarded an important subsidy to these parts of the social housing sector.
Rent Assistance is structured as a co-payment of 75 cents for every dollar, above a threshold, of rent payable by the tenant, subject to a maximum amount (the thresholds and maximums vary by household type). As a means of relieving rental stress, Rent Assistance has a patchy record, largely because maximum payments have not kept pace with actual rents, particularly in higher cost markets (the maximums are instead indexed to the Consumer Price Index). For example, in New South Wales, where 76% of eligible tenants receive the maximum payment, 69% of eligible tenants would be in rental stress without Rent Assistance; with Rent Assistance, 42% are still in rental stress (Shelter NSW and Welfare Rights Centre NSW, 2014). Those figures include recipients in community housing, where rents are set to not exceed 25% of (non-Rent Assistance) income, so rates of rental stress amongst Rent Assistance recipients in the PRS would be higher than the calculated estimates as cited above.
Figure 2.1 Federal Government expenditure on Rent Assistance and social housing, 1980-2008
Source: Department of Prime Minister and Cabinet (2014). Note ‘CRA’ is ‘Commonwealth Rent Assistance’, and ‘CSHA’ is ‘Commonwealth-State Housing Agreement’ social housing funding.

16
Despite the patchy record, total Rent Assistance expenditures have risen over the past three decades, overtaking the Federal Government’s expenditure on social housing grants (see Figure 2.1).
Grants for social housing and affordable housing are made by Federal and State and Territory Governments to housing providers under a number of programs. The largest is the National Affordable Housing Agreement (previously the Commonwealth-State Housing Agreement), subject to which the Federal and State and Territory Governments fund the social housing authorities in each State and Territory. As shown in Figure 2.2, there are similar tied funding agreements specifically for remote Indigenous housing (National Partnership Agreement on Remote Indigenous Housing), and homelessness services (National Partnership Agreement on Homelessness).
Since 2008, Federal and State and Territory Governments have also contributed to the National Rental Affordability Scheme (NRAS), which was established with the intention of encouraging institutional investment in affordable rental housing, through 10-year subsidy packages paid directly to providers of affordable rental housing, including community housing providers and private for-profit providers. However, no new subsidy packages have been allocated since 2014, when the Federal Government decided that there would be no further rounds of the scheme.
Figure 2.2 Federal and State housing funding shares and programs, 2012-13.
Source: Dept of Prime Minister and Cabinet (2014). Note that the ‘State and Territories’ share of funding in the figure includes rent payments made by social housing tenants.
First Home Owner Grants are funded by the Federal Government and administered – in some cases with additional funds added – by the States and Territories. The current program dates from 2000, when it was introduced ostensibly as compensation for the application of the then-new Goods and Services Tax to home construction; however, there have been various assistance schemes from time to time since 1964 (Eslake, 2011). The current program has varied considerably over time, too, particularly through occasional ‘boosts’ intended to stimulate construction and, in the case of the

17
boost during the GFC, counteract falling house prices. Presently most States and Territories have narrowed the Grant to newly constructed housing under certain price thresholds.
2.2.2 Housing and tax Australia’s implicit housing policy is effected primarily by tax settings that give preferential treatment both to housing and to investment incomes. Considered as tax expenditures, the subsidy effect of these settings are vastly greater than the cash subsidies discussed above, as Figure 2.3 from Kelly (2013) shows. The effect of these settings is to encourage leveraged speculation in housing.
Figure 2.3 Housing subsidies and tax expenditures, by tenure, Australia 2013.
Source: Kelly (2013).
Owner-occupied housing enjoys very preferential tax treatment: capital gains from owner-occupied housing are tax exempt, as are imputed rents. An owner-occupier’s principal place of residence is also exempt from the assets test (or means test) for the Age Pension, and State land tax (discussed further below). The effect is to encourage owner-occupiers with money to spare to spend it on their own housing as a store of untaxed wealth.
Rental housing is not directly subject to the same preferential treatment – but because houses can be traded between tenures, owners of rental housing benefit from the capitalisation of owner-occupiers’ preferential tax treatment. They are also subject to tax settings in relation to investment incomes that entail a different set of preferential treatments.
The first of these is the generous treatment of negative gearing, which allows investors to deduct for tax purposes interest payments and other costs of owning of an asset (e.g. a rental property) from non-asset income (e.g. wages). This makes it easier for asset owners to bear larger losses than

18
they otherwise would – and hence take on higher levels of debt than they otherwise would, and pay higher prices than they otherwise would.
The second preferential tax treatment is the 50% tax discount for income from capital gains, which means that when an investor finally is taxed – on the sale of their asset – they pay at only half the rate that would otherwise apply to their income.
These settings have made property investment hugely popular: more than two million Australian taxpayers (about 16%) declare ownership of a rental property, and about two-thirds of them operate at a loss – see Figure 2.4.
Figure 2.4 Landlords, Australia 1993/94-2013/14
Source: ATO 2016
Figure 2.5 Real effective marginal tax rates on rental properties, by gearing ratio
Source: Australia’s Future Tax System Inquiry (2010), Chapter A: Personal taxation.
The settings confer a greater advantage on those with higher incomes (therefore subject to higher marginal tax rates), and with higher levels of gearing – see Figure 2.5. This in turn means relatively more investment on higher value properties, while lower value properties are more likely to be passed over by investors and fall out of the rental sector – and the relative few remaining become less cheap to rent (Wood, Stewart & Ong, 2010: 85; Grudnoff, 2015; Martin, 2016).
0
500,000
1,000,000
1,500,000
2,000,000
2,500,000
1993
-94
1994
-95
1995
–96
1996
–97
1997
–98
1998
–99
1999
–200
0 20
00–0
1 20
01–0
2 20
02–0
3 20
03–0
4 20
04–0
5 20
05–0
6 20
06-0
720
07-0
820
08-0
920
09-1
020
10-1
120
11-1
220
12-1
320
13-1
4
Landlords with negative net rent
Landlords with positive net rent

19
Taxes levied by the States and Territories – specifically, property transfer duties (‘stamp duties’) and land tax – also influence the housing market, in different ways.
All States and Territories levy stamp duty on conveyances of property, including housing for owner-occupation and for investment. Rates, thresholds and concessions vary between jurisdictions; most also provide exemptions or concessions for first home buyers. These treatments reflect a widespread view that stamp duty adds to the cost of purchase, and hence to affordability problems; however, research indicates that while the legal obligation to pay stamp duty falls on purchasers, the economic incidence tends to fall on vendors (i.e. stamp duty comes out of the price they receive), and overall stamp duty tends to suppress prices (Leigh & Davidoff; Martin, 2015b).
All States levy land tax, as an annual charge on the unimproved value of land, subject to numerous exemptions: the largest of these is land used for the owner’s principal place of residence, (other exempt uses include primary industry). Land tax is generally levied on the total value of the owner’s land holdings in the State, at progressive rates above certain thresholds. (In contrast to the States, the Australian Capital Territory is in the process of extending land tax to owner-occupiers (and reducing stamp duty); the Northern Territory, on the other hand, levies no land tax at all.)
In principle, taxing land values has many benefits: easy to administer and impossible to avoid, it gets at unearned wealth, discourages speculative holding, encourages the bringing of land onto the market, and so contributes to improved housing affordability. Many commentators have criticised the States’ present land tax regimes for failing to realise these benefits, particularly because too much land is exempt: the principal place of residence exemption accounts for more than 60% of the potential tax base (AFTS Inquiry, 2010). The structure of rates (progressive on aggregated holdings) also treats larger scale institutional investors less favourably than small-holding individual investors.
2.2.3 Housing finance
Investment in owner-occupied and rental housing in Australia is financed largely by credit advanced to individual borrowers by retail lenders. By contrast, institutional investment in housing – whether by wholesale lending to institutional investors by other financial institutions, or equity investment by institutional investors – is mostly absent.
Engaging super funds, sovereign wealth funds and other large debt and equity investors in financing rental housing has been a longstanding goal of governments seeking innovative ways to stimulate supply. Advantages claimed for such an approach include: the potentially large volume of funds available; the scope for matching institutional investor requirements for steady cash flow returns (rather than capital gains prioritised by individual investors) to a rental product offer; and stimulation of a professionally managed and more stable rental tenure that can meet the rising need for affordable housing. While interest in this objective has been evident in Australia for some time (underpinning the introduction of the 2008 National Rental Affordability Scheme (NRAS), for example), it has yet to be achieved.
Nevertheless, a number of developments have recently created more favourable conditions for investment industry interest (Milligan et al, 2013) and it is known that some major entities were close to committing funds to NRAS bids at the point where the scheme was terminated in 2014 (Milligan et al, 2015).

20
As things stand, housing investment – in both owner occupied and market rental sectors – is overwhelmingly dominated by individual households. Over the past two decades private debt levels relative to disposable income have almost doubled, with increasing housing debt accounting for almost all of the increase – see Figure 2.6.
Figure 2.6 Household debt and housing debt to annual disposable income, Australia 1996-2015
Source: RBA, E2 Household Finance Selected Ratios.
As borrowers have increased their housing-related debt, so have Australian banks and other lenders become more exposed to housing. Almost two-thirds ($2.3 trillion) of the Australian banking sector loan book relates to housing: 40% for owner-occupied housing, and 23% for rental housing (see Figure 2.7).
Figure 2.7 Housing loans (owner-occupier and investor) to total loans, Australia 2004-2016
Source: Richards (2016). Note: ‘ADI’ is Authorised Deposit-taking Institutions.
020406080
100120140160180200
Mar
-199
6Au
g-19
97Ja
n-19
99Ju
n-20
00N
ov-2
001
Apr-
2003
Sep-
2004
Feb-
2006
Jul-2
007
Dec-
2008
May
-201
0O
ct-2
011
Mar
-201
3Au
g-20
14
Per c
ent Household debt to
annualised disposableincome
Housing debt toannualised disposableincome

21
Figure 2.8 Housing loans (owner-occupier and investor) and other loans by category, Australia (%s)
Source: APRA Monthly Banking Statistics, March 2016.
Concerns have been raised about the banking sector’s exposure to housing (see Figure 2.8), including by the 2014 Financial System Inquiry (the Murray Inquiry), which highlighted housing as a source of systemic risk, and by the heads of the Reserve Bank, the Federal Treasury and the Australian Securities and Investment Commission (Martin, 2015b). Recently the Australian Prudential Regulatory Authority (APRA) has made a number of moves to curb growth in housing-related lending, including by increasing capital requirements and issuing practice guidance to increase serviceability and other lending standards (Richards, 2016).
28
4
40
23
2 3 Non-financial corporations
Financial corporations
Housing: Owner-occupied
Housing: Investment
Credit cards
Other

22
3. Key housing policy developments that shape the present policy environment
1945-70 1945 – first Commonwealth-State Housing Agreement (CSHA). Permanent public housing sectors are developed in all States. Postwar homeownership boom, underpinned by full employment, War Service Home loans, and sales of public housing (from 1956). War-time rent and eviction controls are gradually rolled back (from 1950s). Development of strata title and multiple-owner apartment buildings (from 1960s).
1970s Initial shift of public housing towards welfare housing (Paris et al 1985). Start of trajectory towards tightly focused needs-based targeting without compensatory funding adjustment. 1975 – Poverty Inquiry sets out consumer protection model of tenancy law reform, eventually implemented by all States and Territories (by 1990s)
1980s Rent Assistance expands as Labor Government opts to support low income households to meet private rental costs rather than via expanded social rental provision. 1985 - Capital gains tax (CGT) introduced; owner-occupied housing is exempt.
1990s End of large scale new construction of public housing 1996 – CSHA reduced by 30%. 1999 - CGT 50% discount introduced – prompted landlord investment property acquisition take-off.
2000s Moves to end security of tenure in public housing, with eligibility reviews and fixed term tenancy regimes introduced in some States. Focus on how to maximise exit of ‘aspirational’ tenants from social housing; however, rate of exits actually slows.
2008-2010 ‘Comeback of housing policy’ under Rudd Labor Government. Interpreted by Milligan & Pinnegar (2010) as response to social stress resulting from sustained house price inflation over previous decade:
• New National Affordable Housing Agreement (NAHA) framework to govern Commonwealth/State relations on housing – aspiration for ‘outcomes focused’ regime in return for ongoing Commonwealth funding of State/Territory housing activity
• Launch of Commonwealth-funded National Rental Affordability Scheme (NRAS) to engage institutional finance in new construction of sub-market rental housing – initial target: 50,000 units over four years
• $5.8 billion on social housing investment included in Nation Building Economic Stimulus plan to stave off Global Financial Crisis – 19,600 homes built 2009-2012
• Shared commitment to social housing reform by Commonwealth and states/territories; supporting expansion of NFP landlords to diversify social housing towards multi-provider system. NFP sector growth plan underpinned by new National Regulatory system
2010 – Faltering of reform commitment apparent in failure to embrace housing-related recommendations of Henry Tax Review–e.g. restriction of landlord investor tax concessions; recognition of social landlord ‘community service obligation’ inherent in high needs tenants
2013 National Disability Insurance Scheme – Commonwealth Government commitment with bipartisan support for expanded funding to underpin better housing and support for people with disabilities. Possible specialist development funding opportunity for NFP landlords

23
2010-2015 Loss of affordable housing reform momentum, especially from 2013 – termination of key institutions/programs:
• National Housing Supply Council – abolished 2013 • Housing Ministers Advisory Council – abolished 2013 • Commonwealth Government housing minister designation – abolished 2013 • National Rental Affordability Scheme – terminated 2014
Faltering of national regulatory system for NFP housing – withdrawal of Commonwealth support laid ground for Victoria and WA non-participation.
2012-15 Public housing transfer programs of unprecedented scale initiated by State Governments of Queensland, South Australia and Tasmania. Queensland pledge to transfer all (or virtually all) public housing by 2020 drastically scaled back following 2015 change of government.
2015/16 Signs of renewed interest in affordable housing policy agenda – at Commonwealth level and in certain states:
• Affordable Housing Working Group – Under the Council for Federal Financial Relations (CFFR), working group set up by the Commonwealth Government in early 2016 to investigate ‘ways to boost the supply of affordable rental housing through innovative financing models’. But no associated commitment for essential public co-funding.
• 2015 establishment of Ministry for Cities and April 2016 publication of ‘Smart Cities’ discussion paper signalled Commonwealth Government re-engagement with urban policy agenda. City Deal framework intended to ramp up transport infrastructure investment – possible scope for affordable housing to be similarly construed
• State-led initiatives in NSW – public funding commitments to Social and Affordable Housing Fund (3,000 units in phase 1) and Communities Plus (public housing estate renewal program) to generate ‘up to 23,000 new and replacement social housing dwellings’ over 10 years
• Housing Policy taskforce established by Victoria State Government 2016 – linked with implementation of recommendations from Family Violence Royal Commission but with a wide brief on housing/homelessness reform.
2015/16 Curbs on landlord investor activity likely to dampen property acquisitions, especially for new build apartments; high density construction slowdown a likely result:
• APRA restrictions on investor landlord lending • More intensive Tax Office scrutiny • Increased stamp duty rates for overseas investors

24
4. How low-cost housing is provided and funded
Most of Australia’s low income households live in private housing. Only 8% of those in the lowest two quintiles of the income distribution are accommodated in social housing. This reflects the fact that social housing accounts for only 4% of all dwellings.
Figure 4.1 Households in lowest 40% of income distribution by housing tenure, Australia
Source: ABS Housing Occupancy and Costs, 2013-14.
Two thirds of low income households are home owners (see Figure 4.1), with most of these being older outright owners whose relatively low housing costs mean that their living standards are likely to be adequate, even if dependent on the Age Pension or other government benefits. This low-cost owner-occupied housing is, in a sense, provided by history – that is, it comes from an earlier period in which access to owner-occupation was wider and less costly.
Low cost rental housing is funded in a number of ways:
• Lower cost private rental housing stock is overwhelmingly in the ownership of ‘mum and dad investors’, in the main small scale owners who are effectively supported by public funding in the sense that their ‘business plan’ factors in generous tax concessions in the form of negative gearing and limited capital gains tax liability (discussed above). This will account for a proportion of the estimated $7.7 billion tax revenue forgone annually under the negative gearing rules and the CGT discount (Grudnoff, 2015). However, the part of this lost revenue attributable to investment in ‘low cost rental housing’ is likely to be moderate: one of the main criticisms of these concessions is precisely the argument that they are indiscriminate and that they effectively subsidise ‘upmarket housing’ to a large extent (Wood et al, 2009).
• Social housing accommodates some 400,000 households, most of these (317,000 in 2013/14) in ‘public housing’ dwellings managed as well as owned by state governments. The ongoing cost of public housing is funded mainly from rents (set at 25-30% of tenants’ gross income – or market rent if that is lower) and from the Commonwealth Government NAHA
41
25
21
46
8
1
26
26
5
3
0% 20% 40% 60% 80% 100%
Lower incomehouseholds
Other householdsOwned outright
Buying with mortgage
Social rent
Private rent
Other

25
funds originally intended to underwrite capital expenditure. Remaining deficits are funded by the states and territories from general taxation.
• Community housing, which accommodated 67,000 households in 2013/14 is funded from tenants rents and through Commonwealth Government resources paid through the Rent Assistance system. For the most part, community housing stock involves homes originally built and wholly funded by government.
• Some 38,000 affordable housing units have been developed under the National Rental Affordability Scheme (NRAS). Development costs for these privately provided dwellings have been subsidized through $10 000 tax offsets or cash grants, receivable annually for a 10-year period. The scheme was closed to new allocations from 2014 (existing projects will continue to receive subsidies for 10 years).

26
5. Key contemporary challenges for housing policy and practice
5.1 The house price boom – unaffordable and inaccessible home ownership
The Australian housing sector entered the 2008-09 Global Financial Crisis with high house prices, but avoided the major decline in prices experienced in other countries, and over the past three years has seen prices increase sharply again in Sydney and Melbourne. Problems of housing affordability and accessibility, particular for would-be first time owner-occupiers, have risen in prominence over the past year or two (Martin, 2015b), and have featured prominently in the 2016 Federal election, with the Labor Party proposing to reform negative gearing (net rental losses from new investments in established properties could be set against income from investments, not other sources) and the capital gains tax discount (reduced from 50% to 25%). However, the Coalition and a range of property interests are opposed to any reform of housing tax settings and have vigorously contested the reform proposals, arguing that these will result in a property price crash.
5.2 The house price bust?
The Australian housing market has defied many predictions of imminent collapse, but at the time of writing there are numerous signs of instability, particularly in the off-the-plan apartment sector (Martin, 2016d). The financial system is highly exposed to a housing bust, and so are millions of individuals with large housing debts, whether they were motivated by the prospect of speculative gains, or just their own need for secure shelter – or a combination of these motives. As well as the question of managing the economic consequences of a housing bust, there is a question of how to do justice amongst differently positioned actors in the housing sector and the distribution of liabilities between them.
5.3 The lack of low-cost private rental housing
The PRS is not merely growing; it is also changing shape. Speculation in housing has changed the stock held in the PRS – it has lost low-cost stock – and changed the profile of the households in the PRS – it has gained higher income households, who compete with lower-income households for the relatively scarce lower-cost properties (Hulse, et al, 2014). Rates of housing stress are highest amongst private renters, but the problem of rental affordability has yet to achieve the public prominence or political attention given to house purchase affordability, and the few policy initiatives in this area – notably NRAS – have recently been set back.
5.4 The spiral of decline in public housing
Across Australia the State- and Territory-based public housing systems are in a spiral of decline: the failure over decades to invest in growing the stock of housing has meant a declining market share; this in turn has meant more tightly rationed allocations to households with the highest needs and lowest incomes; this in turn has meant higher management costs and lower rent revenues; this in turn has meant fewer resources for investment in new stock and maintenance of existing stock; this in turn has meant sales of stock to recurrent expenses; this has meant further loss of market share, more tightly rationed allocations, et cetera.

27
In the New South Wales context, for example, the 2013 Auditor General report emphasized that the state’s public housing portfolio was in poor shape, with 30-40% of homes recognised as below an acceptable physical standard. Meanwhile, the financially unsustainable state of the entire system was being merely masked in the short term through routine asset sales (averaging 600 per year in the eight years to 2011/12) and through the deferral of essential maintenance (NSW Auditor General, 2013).
For some time the community housing sector has been held out by policy makers, researchers and sector representatives as the means by which social housing may be revitalised. Originally a sector of very small-scale of temporary accommodation to persons waiting for public housing, community housing has come a long way over the past decade. However, the financial advantages it enjoys by comparison with public housing (mainly by virtue of CRA entitlement for CH tenants) are decidedly modest (Pawson et al, 2013). Under the current financial framework, community housing providers lack the funding to underwrite the large scale stock upgrading and replacement program that would be implicitly required if they were to be designated the role of restoring the nation’s public housing in its entirety.

28
6. Key emerging trends that will shape and impact on the future housing system
6.1 Population growth
Australia’s population has grown substantially over the past two decades, with the larger, if more volatile, part of the increase coming from net overseas migration to Australia. Both sides of politics, when in government, have presided over high rates of immigration: there is a question as to whether one or both will continue to support high immigration in the face of presently growing development pressures on established population centres; pressures in part reflected by high house prices. There is also the question of whether potential migrants (and recently settled migrants) will continue to be attracted to Australia if high house prices persist – or if economic growth falters.
6.2 Urban consolidation
Australian governments have generally committed to policies of urban consolidation and are increasingly looking to the renewal of established sites – industrial and residential – for future housing development. Apart from the known concerns around ensuring adequate construction standards and maintaining harmonious community relations in large multi-unit buildings, urban renewal of residential buildings and areas poses major planning and public consultation challenges.
6.3 Disruptive technologies – Airbnb and the use of houses other than as homes
The short-term letting platform, Airbnb, has been adopted avidly in Australia: about 15 000 Sydney properties are listed on Airbnb, two-thirds of them listing the entire property (not just a room); in some beachside suburbs, one in five properties are listed (Ting, 2016). The operations of Airbnb and similar platforms raise a number of questions: whether they are enabling the withdrawal of properties from residential use and contributing to pressures in rental markets; whether the prospect of monetising a spare room or period of unoccupation is encouraging purchases of additional housing by those already wealthy in housing (for example, by making it more financially viable to own a flat as a pied a terre); and how to appropriately govern the effects that short-term lettings have on neighbouring residents.
6.4 The land tax/value capture agenda
Probably a weaker ‘trend’ than the other discussed above, but worthy of note: there is a growing interest in land tax reform and the contribution it may make to greater housing affordability and economic productivity. The Henry Review recommended strongly in favour of greater use of land tax; more recently, the NSW Business Chamber, the NSW Council of Social Service, and the NSW Branch of the Australian Manufacturing Workers Union have jointly supported land tax reform. Under the banner of the related concept of ‘value capture’, the Turnbull Government has also lately indicated an interest in taxing the windfall gains that otherwise accrue to landowners from economic development (Martin, 2016c).

29
References
Australia’s Future Tax System Inquiry (2010) Final Report, accessed 15 June 2016
Australian Bureau of Statistics, Census of Population and Housing, 2001 and 2011
Australian Bureau of Statistics, Housing Costs and Occupancy, 2013-14
Australian Institute of Family Studies, Households in Australia; AIFS
Department of Prime Minister and Cabinet (2014) Reform of the Federation White Paper: Roles and responsibilities in housing and homelessness – issues paper 2, accessed 15 June 2016
Davidoff, I and Leigh, A (2013) ‘How Do Stamp Duties Affect the Housing Market’, Economic Record, vol 89 no 286: 396-410.
Eslake, S (2011) ‘Billions in handouts but nothing gained’, Sydney Morning Herald, 16 March 2011, accessed 15 June 2016
Financial System Inquiry (2014) Final Report, accessed 15 June 2016
Grudnoff, M. (2015) Top Gears: How negative gearing and the capital gains tax discount benefit the top 10% and drive up house prices; Canberra: Australia Institute
Hulse, K, Reynolds, M & Yates, J 2014, Changes in the supply of affordable housing in the private rental sector for lower-income households, 2006–2011, Final Report no 235; Melbourne: AHURI
Hulse, K., Reynolds, M., Stone, W. & Yates, J. (2015) Supply shortages and affordability outcomes in the private rental sector: short and longer term trends; Final Report no 241; Melbourne: AHURI
Kelly, J F (2013) Renovating Housing Policy, Melbourne: Grattan Institute
Martin, C (2015a) ‘Get rid of stamp duty – but don’t expect improved housing affordability’, City Futures blog, 15 August 2015, accessed 15 June 2016
Martin, C (2015b) ‘Abbott, Hockey and housing’, City Futures blog, 15 June 2015, accessed 15 June 2016
Martin, C (2016a) ‘Would negative gearing reform push up rents?’ City Futures blog 3 March 2016, accessed 15 June 2016 at
Martin, C (2016b) ‘The Australian housing market is a house of cards’, City Futures blog, 6 May 2016, accessed 15 June 2016
Martin, C (2016c) ‘The tax reform right under Turnbull’s nose’, City Futures blog, 5 April 2016, accessed 15 June 2016
Martin, C (2016d) ‘Might Labor’s negative gearing policy yet save the housing market?’, The Conversation, 26 May 2016, accessed 15 June 2016

30
Milligan V; Pinnegar S, 2010, 'The comeback of national housing policy in Australia: First reflections', International Journal of Housing Policy, vol. 10, no. 3, pp. 325 – 344
Milligan, V., Yates, J., Wiesel, I. & Pawson, H. (2013) Financing Rental Housing Through Institutional Investment – Volume 1: Outcomes of an Investigative Panel, Final Report No. 202; Melbourne: AHURI
Milligan, V., Pawson, H., Williams, P. & Yates, J. (2015) Next moves? Expanding Affordable Rental Housing in Australia Through Institutional Investment; Sydney: City Futures Research Centre
National Australia Bank (2016) Quarterly Residential Property Survey: Q4 2015, accessed 15 June 2016 at http://business.nab.com.au/wp-content/uploads/2016/02/Residential-Prop-Survey-Q4-2015.pdf
NSW Auditor-General (2013) Making the Best Use of Public Housing: performance audit report, accessed 15 June 2016
Pawson, H., Milligan, V., Wiesel, I. & Hulse, K. (2013) Public Housing Transfers in Australia: Past, Present and Prospective; AHURI Final Report no. 215; Melbourne: AHURI
Paris, C., Williams, P. & Stimson, B. (1985) ‘From public housing to welfare housing?’, Australian Journal of Social Issues, 20(2): 105-117
Richards, H (2016) ‘A Prudential Approach to Mortgage Lending’, speech by Heidi Richards, General Manager, Industry Analysis, Australian Prudential Regulatory Authority, to Macquarie University Financial Risk Day, 18 March 2016, accessed 15 June 2016
Reserve Bank of Australia (2015) Submission to the House of Representative Standing Committee on Economics Inquiry into Home Ownership, accessed 15 June 2016
Reserve Bank of Australia (2016) Financial Stability Report, April 2016, accessed 15 June 2016
Shelter NSW and Welfare Rights Centre NSW (2014) The Impact of Rent Assistance on Housing Affordability for Low-Income Renters: New South Wales, Shelter NSW, Sydney.
Shoory, M (2016) The growth of Apartment Construction in Australia, Reserve Bank of Australia bulletin, accessed 17 June 2016
Ting, I (2016) ‘How Airbnb is taking over Sydney, one beach at a time’, Sydney Morning Herald, 5 January 2016, accessed 15 June 2016
Troy, L and Randolph, B (2016) ‘Housing Shortage? Empty houses, housing affordability and articifical scarcity’, City Futures blog, 29 March 2016, accessed 15 June 2016
Wood, G, Stewart, M & Ong, R (2010) ‘Housing Taxation and Transfers: final report – research study for the Review of Australia’s Future Tax System’, accessed 15 June 2016