hoveracousticcharacteristicsofthexv-15with ... · hoveracousticcharacteristicsofthexv-15with...
TRANSCRIPT

NASA-TM-1115?8
HoverAcousticCharacteristicsof the XV-15 withAdvancedTechnologyBladesD. A. Conner and J. B. Wellman
Reprinted from
JournalofAircraftVolume31,Number4, Pages737-744
A publication of theAmerican Institute of Aeronautics andAstronautics, Inc.370 L'EnfantPromenade,SW
Washington, DC20024-2518
https://ntrs.nasa.gov/search.jsp?R=19960023946 2019-04-07T14:23:58+00:00Z


J()t_RNAL OF AIR('RAt-I
Vol. 31, No. 4, July Aug. 1994
Hover Acoustic Characteristics of the XV-15 with Advanced
Technology Blades
I)avid A. Conncr*
NASA Langley Research Center, Hampton, Virginia 23681
and
J. Brent Wellman+
NASA Ames Research ('enter, M_ffett Fiehl, ('al_['ornia 94035
An experiment has been perflwmed to investigate the far-field hover acoustic characteristics of the XV-15
aircraft with advanced technology blades (ATB). An extensive, high-quality, far-field acoustics data hase _'as
obtained fiw a rotor lip speed range of 645-771 fl/s. A 12-micruphune, 500-ft radius semicircular array combinedwith two aircraft headings provided acoustic data over the full 360-deg azimuth about the aircraft with a
resolution of 15 deg. Altitude variations provided data from near in-plane to 45 deg belnw the rotor tip pathplane. Acoustic directivity characteristics in the lower hemisphere are explored through pressure time histories,narrow-band spectra, and contour plots. I)irectivity patterns were found to vary greatly with azimuth augle,especially in the fiwward quadrants. Sharp positive pressure pulses typical of blade-vortex interactions were
fimnd to propagate aft of the aircraft and were most intense at 45 deg below the rotor plane. Modes! oxerallsound pressure levels were measured near in-plane indicating that thickness mfise is nnt a major prublenl flwthis aircraft when operating in the hover mode with ATB. Rotor tip speed reductions reduced the a_erageoverall sound pressure level IdB tl).(l(HI2 dyne/era-')] by nearly 8 dB in-plane, and by ahnusl 5 dB at 12.6 degbelnw the rutnr plane.
Nomenclature
V, rotor blade tip speed, ft/s0 angle below the rotor tip path phmc, dcg
q_ - azimuth angle about the aircraft, deg (0-deg aft)
Introduction
IR traffic congestion at major airports throughout theworld is quickly reaching the saturation point. The eco-
nomic and political difficulties of constructing l-lew major air-
ports in heavily populated areas are enormous. Smaller com-muter aircraft account for approximately 31)"'_ of airport usage
w'hile carrying only 5(i of the passcngers. A civil tiltrotorcommuter transport, therefore, offers a potential solution for
relieving this air traffic congestion. A flcct of civil tiltrotor
transports, operating in a National Airspace System tailored
to perntit vcrtiport access independent of airport control, would
permit a significant increase in airport passcngcr movements.
A potential problent with operating the tiltrotor aircraft in
highly populated areas is unacceptably high noisc levels on
approach and departure and whilc performing terminal areaoperations. While operating in airphmc mode, the tiltrotoraircraft is very quiet. I towevcr, while operating m tiltrotor
modc or m helicopter mode, as would be required near ver-
tiports, the noise levels are at least comparable to helicopters
of similar gross weights.Previous noise studies on the XV-15 tiltrotor aircraft have
been limited. A brief 19b;l hover noise test conducted at Mof-
Received Feb. 16. 1992; revision rcccivcd May 27, 1993: acccptcdIor publication May 27, 1993. This paper is declared a work of theU.S. (;ovcrnmcnt and is nol subicc_ to copyright protection in theUnited States.
_Rotorcraft Acting, tics Engineer, Joint Research Program Office,AcroFlightl)ynanfics I)ircctoratc, ARDE(', AT('OM, AppliedAcoustics Branch, Acoustics Division. Senior 1Member AIAA.
;XV-15 Research l'cam l,cadcr, AcroFlighll)ynamics Directorate,ARI)E('. AT('OM, Flight Fxpcrimcnts Branch. Aircraft TechnologyDivision.
fett Field, CA, found that the noise levels radiated aft of the
aircraft were slightly higher than the forward radiated noise
levels. _ Flight tests conducted at Crow's Landing, CA, in 1982
and in 1986 obtained acoustic data for level flight conditions
and for approaches at several glideslopes, z All acoustic resultsreported from both the aforementioned tests were obtained
from microphones mounted on 4-ft stands. A 1988 flight test
conducted at Maypearl, TX, obtained acoustic measurements
for level flight conditions and for normal and noise-abatement
approaches and departures. Acoustic data from this test were
obtained from ground-board mounted microphones, _ as wellas from microphones mounted on 4-ft stands? Wind-tunnel
acoustic data were obtained during a full-scale test of the XV-
15 in the Ames 40- by 80-ft Wind Tunnel?
A limited amount of analytical noise prediction work has
been done for tiltrotors. A study of hover noise prediction
methods with emphasis on the fountain flow effect (recircu-
lation of the rotor downwash caused by wing blockage) is
presented in Ref. 6. Reference 7 reviews the state of knowl-
edge and the needed improvement in noise methodology andmeasurements for tiltrotor aircraft, while Ref. 8 reviews the
background of U.S. tiltrotor development and key issues forcivil tiltrotor applications with special attention to noise con-
siderations for civil tiltrotor operations. In addition, current
research and technology development efforts at the LangleyResearch Center are reviewed and future research needs are
identified in Ref. 8.
One important aspect of terminal area operations is hover.To obtain a better understanding of the hover acoustic char-
acteristics of a tiltrotor aircraft, acoustic hover tests were con-
ducted on a XV-15 tiltrotor aircraft with advanced technology
blades (ATB). The purpose of the test program was to obtain
a comprehensive data base of far-field hover acoustics for the
XV-15/ATB tiltrotor aircraft (tail number 703) for a range of
rotor tip speeds and wheel heights. The tests were conductedat NAS Moffett Field, CA, on December 5-7, 1990.
This article presents a description of the data systems, in-
strumentation accuracies, and experimental test techniques
utilized for this test program. The acoustic directivity char-
737
738 ('()NN|_R AND WEIJ+MAN: AI)VAN('[.[) "II:X'ItN()I.()(iY BI,AI)I S
acteristics in the lower hemisphere, from in-plane to 45 deg
below the rotor tip-path-plane, are explored using pressure
time histories, narrow-band spectra, and contour plots of the
overall sound pressure level (OASPL) and the sound pressurelevel (SPL) [dB (0.0002 dyne/cm2)] of the fundamental blade
passage frequency. In addition, the effects of rotor tip speedreductions on the level and character of the acoustic signature
are investigated through time and frequency domain analyses.
Description of Experiment
Test Aircraft
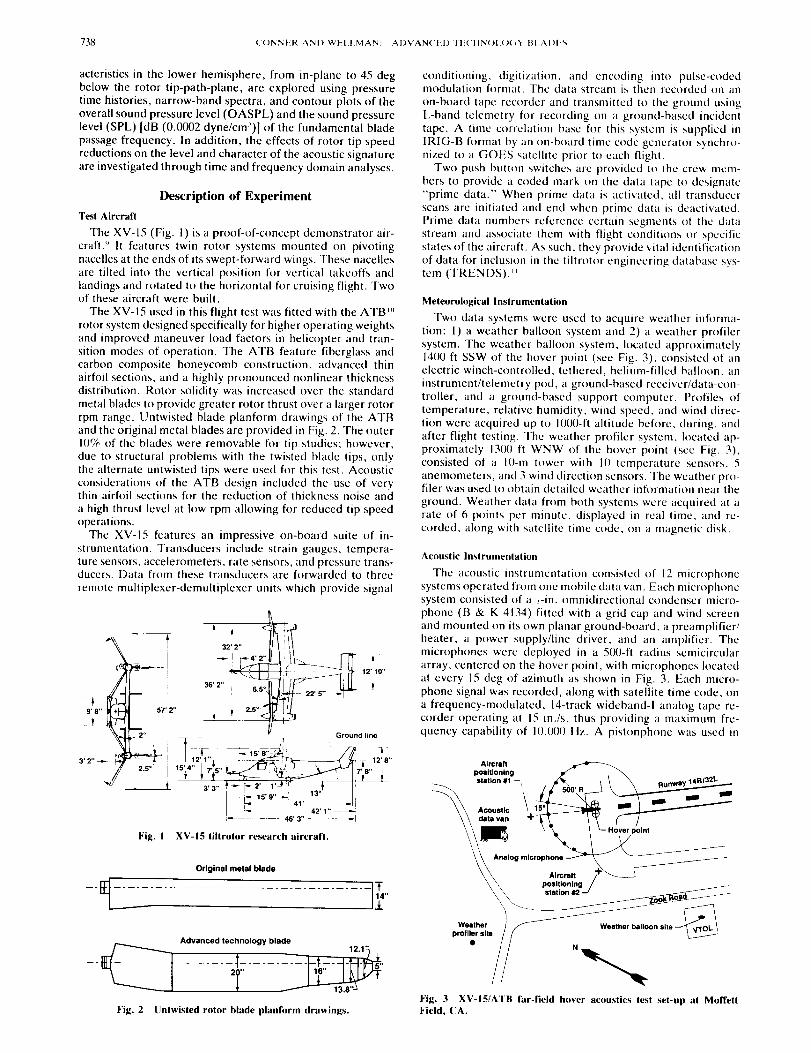
The XV-15 (Fig. 1) is a proof-of-concept demonstrator air-
craft." It features twin rotor systems mounted on pivotingnacelles at the ends of its swept-forward wings. These nacelles
are tilted into the vertical position for vertical takeoffs and
landings and rotated to the horizontal for cruising flight. Twoof these aircraft were built.
The XV-15 used in this flight test was fitted with the ATB m
rotor system designed specifically for higher operating weights
and improved maneuver load factors in helicopter and tran-
sition modes of operation. The ATB feature fiberglass andcarbon composite honeycomb construction, advanced thin
airfoil sections, and a highly pronounced nonlinear thickness
distribution. Rotor solidity was increased over the standard
metal blades to provide greater rotor thrust over a larger rotor
rpm range. Untwisted blade planform drawings of the ATBand the original metal blades are provided in Fig. 2. The outer
10% of the blades were removable for tip studies: however,
due to structural problems with the twisted blade tips, only
the alternate untwisted tips were used for this test. Acoustic
considerations of the ATB design included the use of verythin airfoil sections for the reduction of thickness noise and
a high thrust level at tow rpm allowing fl)r reduced tip speed
operations.
The XV-15 features an impressive on-board suite of in-
strumentation. Transducers include strain gauges, tempera-ture sensors, accelerometers, rate sensors, and pressure trans-ducers. Data from these transducers are forwarded to three
remote multiplexer-demultiplexcr units which provide signal
- i
T32i2
36" 2" I 6.5"
L ,_.it0..
57' 2"
2 . _ Ground llne
i /12,1,, I ........ _ _ ur_ [ 12'8"15'4" | T5" 7'8"
_ ls'9" _-' _ _ ]l {_ - 42' 1 ..... :_'_ - 46' 3"
Fig. I XV-15 tiltrotor research aircraft.
Original metal blade
.....................................11 ,.Advanced technology blade
t2.1_ ,
................._-[ 2i,,_......... __ _,7- - s"
Fig. 2 Untwisted rotor blade planform drawings.
conditioning, digitization, and encoding into pulse-codedmodulation format. The data stream is then recorded on an
on-board tape recorder and transmitted to the ground usingL-band telemetry for recording on a ground-based incident
tape. A time correlation base fi)r this system is supplied in
IRIG-B format by an on-board time code generator synchro-nized to a GOES satellite prior to each flight.
Two push button switches arc provided to the crew mem-
bers to provide a coded mark on the data tape to designate
"prime data." When prime data is activated, all transducer
scans arc initiated and end when prime data is deactiwtted.
Prime data numbers reference certain segments of the data
stream and associate them with flight conditions or specificstates of the aircraft. As such, they provide vital identification
of data for inclusion in the tiltrotor engineering database sys-
tem (TRENDS). _L
Meteorological Instrumentation
Two data systems were used to acquire weather infl)rma-
tion: 1) a weather balloon system and 2) a weather profiler
system. The weather balloon system, located approximately1400 ft SSW of the hover point (sec Fig. 3), consisted of anelectric winch-controlled, tethered, helium-filled balloon, an
instrument/telemetry pod, a ground-based receiver/data-con-
troller, and a ground-based support computer. Profiles of
temperature, relative humidity, wind speed, and wind direc-
tion were acquired up to 1000-ft altitude before, during, and
after flight testing. The weather profiler system, located ap-
proximately 1300 ft WNW of the hover point (see Fig. 3),
consisted of a 10-m tower with 10 temperature sensors, 5
anemometers, and 3 wind dircction sensors. The weather pro-filer was used to obtain detailed weather information near the
ground. Weather data from both systems were acquired at a
rate of 6 points per minute, displayed in real time, and re-
corded, along with satellite time code, on a magnetic disk.
Acoustic Instrumentation
The acoustic instrumcntation consisted of 12 microphone
systems operated from one mobile data van. Each microphonesystem consisted of a '-in. omnidirectional condenser micro-
phone (B & K 4134) fitted with a grid cap and wind screenand mounted on its own phmar ground-board, a preamplifier/
heater, a power supply/line driver, and an amplifier. The
microphones were deployed in a 500-ft radius semicircular
array, centered on the hover point, with microphones located
at every 15 deg of azimuth as shown in Fig. 3. Each micro-
phone signal was recorded, ahmg with satellite time code, on
a frequency-modulated, 14-track wideband-I analog tape re-
corder operating at 15 in./s, thus providing a maximum fre-
quency capability of 10,()00 ltz. A pistonphone was used in
Aircraft
poaltlonlng _ _ _ t.
\\ da ,v., r---7\ \ _I_ \ "_. 1 k._ Hover point
:Y _-J
\ _ Alrcrelt /'1"_
Weather / _ Weather balloon site "-_,r,rnt. t
profiler site//
Fig. 3 Xv-Ig/ATB far-field hover acoustics test set-up at MolTen
Field, CA.

('()NNt';R ANI) \VI';I.I.MAN: AI)VAN('I-I) II'('ttN()I.()(;'_ lu /\I)F% 739
the fiehJ each day before and after flight testing for soundlevel calibration.
Flight Test Procedures and Stationkeeping
At the time of tile test, the ATB initial envelope expansion
program had not been completed. The XV-15 was, thereflwe,
confined to the airspace of the Naval Air Station, Moffett
Field, contiguous with Ames Research ('enter. When con-ducting acoustic tests, it is desirable to have low ambient noise
levels: therefore, much effort was cxpended to coordinate
with the U.S. Navy, NASA, arid several surrounding :igen-
cies, companies, and local governments to establish a "'quiet
time" during the test periods when high level noise sources
were silenced and activity was kept to a minimum.
The specific location for the test was at the end of the
shorter of two parallel runways. The acoustic array was cen-
tered on the apex of a chevron mark on the north end of the
runway apron. The runway centerline provided a good align-ment cue for the crew while hovering. Additional positioning
was provided by two positioning stations (Fig. 4) located on
the extended centerline of the runway and at right :ingles to
the eenterline. Team engineers equipped with surveyors" transits
radioed correction inlk)rmation to the crew. By sighting on
the aircraft's main landing gear and keeping it within thetransit stadia marks, the team was assured that the aircraft
was within + fl ft of the intended point in space m ill[ direc-lions. Acoustic data about thc entire azimuth of the aircraft
were obtained by hovering the aircraft above the center ofthe semicircular microphone array with a heading of 14(l deg
arid then immediately repeating the run with an aircraft head-
ing of 3211 deg. For this article. O is calculated :is the arc tan-
gent of the prescribed altitude plus 12 ft (to account for the
distance from the landing gear to the rotor planc), divided
by the array radius.
Each of these 40 spectra was then averaged to provide a
spectrum that has a 90(:i confidence level in the amplitudeestimates with an interval of - 1.4 to I.;4 dB based on a chi-
square distribt.tion. The bandwidth of the narrow-band anal-
ysis was 2 t iz.
Results and Discussion
Acoustic data were obtained on 3 consecutive days between
the hours of 0700 (dawn) and 0;400, due to the optimal (min-
imum) wind conditions which typically occur at this time ofday. Soon after dawn the winds generally increase due to the
temperature reversion which develops as the sun heats the
ground. During this test program, the winds were generally
less than 2 mph :it ground level and increased to 5 mph tit5()()-ft altitude. Above 500 ft, the winds increased to as much
as 20 mph at I(R){l-ft altitude. The wind direction was typically
out of the NNW at ground level and shifted to thc N to NNE
tit 500-ft altitude. Examples of weather profiles obtained dur-
ing this test program are presented in Fig. 5.
Data Repeatability
To determine the repeatability of data obtained during this
test program, thc first data run each morning was conducted
at identical aircraft operating conditions of 10(i-ft altitude and
9;4cI rpm (V_ - 771 ft/s). Polar plots of the OASPL and the
SPL of the fundanlenta.I blade passage frequency, (BPF) as
a function of q' fl)r these three runs are presented in Fig. 6.Figure 6a shows thai the maximum difference in the OASPI,
tit any azimuth angle is 3 dB. The maximum difference in the
SPLs of the fundamental BPF {Fig. 6b), with the exceptionof 5 of the 24 measurement locations (_ - 75, 165, 195,225,
and 345 deg), is also less than 3 dB. This is within the spectral
Data Reduction and Analysis
Acoustic data were processed into pressure time histories
and narrow-band spectra. Initial inspection of narrow-band
spectra for the full l(I-kllz bandwidth availahle showed that
the vast majority of the acoustic energy was contained below
2 kllz. In addition, most data obtained beyond 2 kllz were
significantly below the maximum levels, approaching the max-imum dynamic range of the recording system (ideally 48 dB).
For these reasons, and to more closely study the lower fre-
quency tonal content of the measured acoustic signals, eachacoustic record was low-pass filtered :it 2 kllz and digitized
at a rate of 4[)96 samples per second. For the narrow-band 10oo
analysis, the data were divided into 40 consecutive, nonover-
lapping blocks of 2048 points each, a [lamming data window ,, tsowas applied, and a spectrtun was calculated for each block. •
i°
leo0deg. F
_, 750 !50Q
46
250 43
41
400
a) 0too Tlme o8oo
0
b) ore0 Time oooo
k_
1715
a
i 11
8
e
4
2
0
Fig. 4 Aircraft posilioning station no. I.
t0OO eking.
nagnetlc119
51
-16
20
c) otoo Time oeoo
Fig. 5 Weather profiles at Muffett Field, CA, December 6, 1990: a)temperature, b) wind speed, and e) wind direction.

740 ('()NNI{R ANI) Wt_I.I.MAN: AI)VAN('t(1) I F('HN()I.()(;'_ H,I.AI)t'S
¥ = 270
V = 180 ....... Day 1
.- - if/._ ..................Day 2
/_ " - ......... Day 3
,_ ¥=90
¥=0
¥= 180T_
_,i'_"'-_/-_I_-"C' _,,<-
I 7 B 7 I • '_1
-:I': ".'..>+/
b) ¥=0
Fig. 6 Data repeatability sludy; 0 = 12.6 deg, V_ = 771 It/s: a)OASPL and h} rundamental BPi,'.
estimate error bounds of -1.4 to 1.8 dB. The maximum
difference in the SPL of the fundamental BPF was approxi-
mately 5 dB and occurred at _ = 225 deg. This figure in-
dicates that the data obtained during this flight test program,
though highly variable with azimuth angle, are very repeatable
and lends confidence that the data are of high quality.
Acoustic Characteristics
Pressure time histories and narrow-band spectra about the
aircraft longitudinal or roll axis at • - 9(1 and 27(I deg fi)r arotor tip speed of 771 ftts and a gross weight range of 13,000-
13,5011 lb are presented in Fig. 7. All data were corrected to
a 715-ft distance (assuming spherical spreading), which is the
distance from the aircraft to the microphone array for the
5(M)-ft altitude runs. Data are presented at 1.6, 7. I, 12.6, 23.0,
and 45.7 deg below the rotor tip path plane. The pressure
time histories of Fig. 7a present 120 ms of data, or slightly
more than one rotor revolution. The pressure time historieson either side of the aircraft are very similar in waveform and
magnitude. The effect of changes in the relative phase angles
of the acoustic signals for the two rotor systems with altitude
due to changes in the rell,tive rotor-to-microphone distances
is evident in the waveforms as the two signals combine con-
structively and destructively (i.e., 6 humps at 0 - 7.1 deg, 3
humps at O = 23 deg). The narrow-band spectra presented
in Fig. 7b show a richer harmonic content h)r the in-plane
acoustic data, probably due to the dominance of rotor thick-
ness noise. The OASPL increases by slightly more than 3 dB
as # increases from 1.6 to 45.7 deg with the greatest increase
(approximately 1.5 dB) occurring as 0 increases from 12.6 to
23 deg. The OASPL for the out-of-phme data are dominated
by the lower harmonics (loading noise), whereas the higher
harmonic content typical of thickness noise contributes moreto the OASPL fi)r the in-phme data. Inspection of ambient
noise data obtained immediately prior to and following the
lest periods showed that the background noise levels were
significantly less than the recast, red aircraft noise levels for
a)
SP, dy/sqcm
1;_.......;-IOO L
100
-lo0
loo
-lOO
lO0r ],,,'
-100 L0 60 120
Time, ms
$PL, dB
100[" OASPL=90,edB _
6O
Time, ms
- I. I
! L !
!I [
III , '_'¢'_]I
120 0 80 120 60 1120
Time, ms Time, ms
OASPL=92.0dB ]
I
100 OASPL=91,BdB OASPL=92.0dB _
'\,
1__/ _ __/ r OASPL=g5.4dB '/I_ OASPL=93.5dB
0 1 2 0 1 2 0 1 2 0 1 2
b) Frequency, kHz Frequency, kHz Frequency, kHz Frequency, kHz
_'ig. 7 n()'¢er acoustic characteristics about the XV-15 aircrafl lateralaxis; !,"_= 771 fl/s, efrective unicrophune distance = 715 fl: a) pressuretime histories and b) narro_-hand spectra.
all frequencies. The background noise levels were typicallybetween 55 60 dB at about 20 t lz and fall off rapidly to below30 dB above 200 ttz.
All acoustic data presented in this article were obtained
with the aircraft operating out of ground effects with the
exception of the data presented for0 - 1.6deg, whichwere
obtained with the aircraft operating at a rotor height of 14 ft.
In addition to the increased lift provided by ground effects,
a change in the recirculation characteristics may also be oc-
curring near the ground. Increased lift due to ground effects
should not significantly alter the data presented for 0 - 1.6
deg since these in-phme data are dominated by blade thicknessnoise. Also, aircraft state data show that the rotor collective
settings did not change significantly when hovering in and out
of ground effects. ('hanges in the recirculation characteristics,however, tire not known tit this time and the reader needs to
consider this unknown factor when interpreting these results.
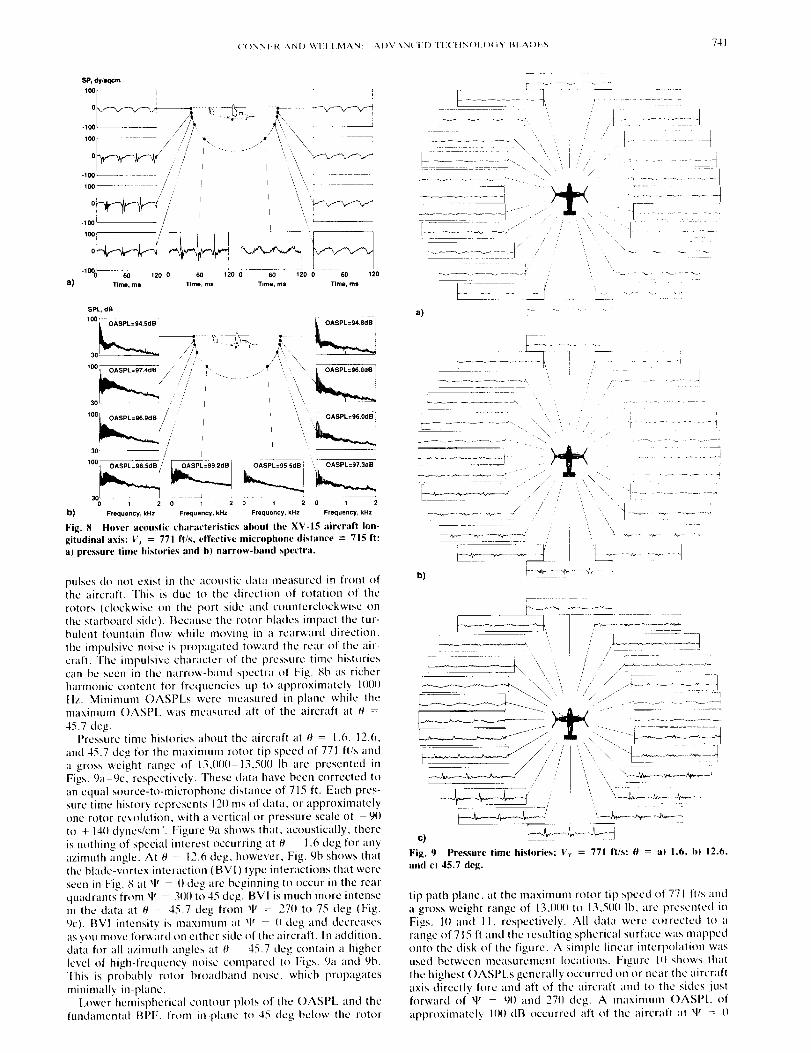
Pressure time histories and narrow-band spectra about the
aircraft lateral or pitch axis at g' = 0 and 180 deg h)r the
same rotor tip speed of 771 ft/s and gross weight range of
13,000-13,500 Ih are presented in Fig. 8. As with the data of
Fig. 7, these data have been corrected to a distance of 715
ft. The phase angles for the acoustic data from the two rotor
systems are equal at all altitudes for the azimuth angles pre-sented in this figure: therefore, only 3 humps per rotor rev-
olution are present. ]'he pressure time histories of Fig. 8a
show a drastic difference in the waveforms propagated for-ward and aft (if the aircraft. The sharp positive pressure pulses
which exist in the acoustic data aft of the aircraft are typical
of a blade-w_rtex interaction type noise. It is believed thatthis is due to rotor interaction with the turbulent "hmntain
flow" (see Ref. 6) created as the rotor downwash impacts the
wing and is recirculated back through the rotors over the
inboard portion of the wing. These sharp positive prcsst, re
('()NNI.R AND 'A t(I I.MAN: /',,.])VAN('i.I) [ |{('t|N()I+()(iY U,I AD].S 74]
SP, dytlqcm
-1 O0 .... ,"/
100 .... / ,,// ,,
- 1001 /
160 120 6o
Time, ms Time, ms
\/
. +120 0 60 120 0 60 120
Time, ms Time, ms
30 / I
30_I_:==O.OUDI, OASPL=99:2dB _ ; OASPL=95.SdB ',_ OASPL=97.3dB1
0 1 2 0 1 2 0 1 2 0 1 2
b) Frequency, kHz Frequency, kHz Frequency, kHz Frequency, kHz
Fig. 8 Hover acuustic characteristics ahoul the XV-I5 aircraft hm-gitudinal axis; V/ = 771 It�s, effective microphone distance = 715 It:
at pressure lime histories and b) narrow-band spectra.
pulses do not exist in the acoustic data measured it] front ofthe aircraft. This is due to thc direction of rotation of the
rotors (clockwise on the port side and countcrclockvdsc onthe starboard side). Because the rotor blades impact tile tur-
bulent flmntain flt)_ r while moving it] a rearward direction,
the impulsive noise is propagated toward tile rear of the air-
craft. "['he impulsive character of the pressure time historiescan be seen in thc narrow-band spectra of Fig. 8b as richer
harmonic content for frequencies up to approxmmtely 10011[tz. Mininmm OASPLs were measured m-phme while the
maxinmm OASPL was measured aft of the aircraft at O --
45.7 dug.Pressure time histories about the aircraft tit 0 -- 1+6, 12.6,
and 45.7 deg for the maximum rotor tip speed of 771 ft/s and
a gross weight range of 13,1101)-13,500 lb are presented inFigs. 9a-9c, respectively. These data have been corrected to
an equal source-to-microphone distance of 715 ft. Each pres-sure time history represents 1211ms of data, or approximately
one rotor revolution, with a vertical or pressure scale of - 90
to + 14(I dynes/cm'. Figure 9a shows that, acoustically, there
is nothing of special interest occt, rring at 0 - 1.6 deg for any
azimuth _,ngle. At 0 - 12.6 deg, however, Fig. 9b shows thatthe blade-w+rtex interaction (BVI) type interactions that ,,','ere
seen in Fig. 8 at xl" - 0 deg arc beginning to occur in the rear
quadrants from 'P 3110 to 45 deg. BVI is much more intensein the data at # - 45.7 deg from W = 270 to 75 deg (Fig,
9c). BVI intensity is maxinrum at _[_ (I deg and decreases
as you move forward on either side of the aircraft. In addition,data for all azimuth angles at O - 45.7 deg contain a highcr
level of high-frequency noise compared to Figs, 9a and 9h.
This is probably rotor broadband noisc, which propagates
minimally in-plane.Lower hemispherical contour plots of the OASPL and the
fundamental BPF, from in-phme to 45 deg below the rotor
E .....7: ..... ::::]", L
r " ! , ,
I -+- J" t :- - 7:
/
a) _-----_" + !I _ ..... 7:]-U:
........ 4. i ...... !
b)
i// /' I i
......++ ....-:+-:I
tip path phme, at the maximum rotor tip speed of 771 ft/'s anda gross weight range of 13,000 to 13,500 Ib, are presented in
Figs. 10 and 11, respectively. All data were corrected to a
range of 715 ft and tile resulting spherical surfacc was mapped
onto the disk of the figure. A simple [incar intcrpolation wasused between nle;.tstlremcnt h)cati(ms. Figure I() shows that
the highest OASPI.s generally occurred on or ncar the aircraft
axis directly, forc and aft of the aircraft and to the sMes justforward of q_ 911 and 27(1 deg. A nlaxinltnn ()ASF'[+ of
approximately 10(1 dB occurred aft of the aircraft at qr - 0

742 ('()NNER AND WEIAAIAN: AI)VAN('I_I) [ [{('tlN()IA)(IY BI.AI)ES
_:270 °
_F=270 °
Fig. I I
Fig. 10
_=180 °
OASPL, dB
100
98
96
94
92
9O
88
'_=90° 86
84
82
8O
78
76
74
72
70
_IJ=0 °
OASPI, contours; V r = 771 ft/s, effective microphone distance = 715 ft.
• =180 °
_=90 °
SPL, dB
100
98
96
94
92
9O
88
86
84
82
80
78
76
74
72
7O
_F=0 °
SPL contours of fundamental BPF; V_ = 771 ft/s. effective microphone distance = 715 It.
deg between 40-45 deg below the rotor plane. Overall levelsin the rear quadrants were higher than in the forward quad-rants, probably due to the interaction of the rotors with theturbulent fountain flow. Minimum OASPLs of less than 90dB occurred in much of the front quadrants and in a smallpocket to the starboard side of the aircraft at g-' = 75 degbetween 10- 15 deg below the rotor plane. The modest noiselevels which propagate from the aircraft near in-phme indicate
that thickness noise, which can dominate in-plane noise levels,is not a major contributor to the overall noise levels emittedby this aircraft when operating in hover.
The lower hemispherical contour plot of the fundamentalBPF presented in Fig. 11 shows similar trends as were seenfor the OASPL of Fig. 10, with the exception that the soundpressure levels are reduced and the area of high levels aft ofand near 45 deg beneath the rotor does not exist. The max-
('()NNER ANI) \VfH,I.MAN: AI)";AN('I_I) If-('ttN{)I _)(;_ lq,/',l)l S 743
¥= 180
0.';, :_ '_ %0 ';".:.., '_: ..
_I _ G,: ,i'
a) 14/= 0
Ave Rotor tip Ave ¥ = 180SPL speed, SPL •
ft/sec96.1 ....... 771 ....... 90.6 ,-," ,,
93.9 ..................740 ..................89.3 _:'_ _ ¥=90
¥=90 91.1 ......... 708 ......... 85.5 W=270 _,_!!'][''_°,_'_?3!i,,!(7! _!i I!!89.8 ..... 677 ..... 85.8 1 "* :"
88.3 -- 645 _ 83.3 '___/""
b) lq/= 0
¥ = 180
,-_ _. :, ,,
:.p _,>
........ "!-@5""
c) ¥= 0
Fig. 12
Ave Rotor tip Ave ¥ = 180SPL speed, SPL -_
ft/sec /--i_. ......
,-'"";2__[. _"" -- \85.8 ....... 771 ....... 81.6 ,' --:.; • :.:- '
,*.'._ _ _ "Q-.,,,_,
=o ..................,,o..................= 90 80.5 ......... 708 ......... 74.8 ¥ = 270 _ 4;_ _ .__,ii,_ ¥ = 90'i, '_ ".._A.._r,, 3 ' :
77.7 ..... 677 72.1 ::::_>__i _---:
75.3 _ 645 _ 70.3 " ....... "_.=. "
d) ¥= 0
Effect of V run SPL at # = 1.6 deg: a) OASPL, b) fundamental BPF, c) Isl harmonic of BPF, and d) 2nd harmonic of BPE.
¥ = 270
a)
¥ = 270
c)
Fig. 13
¥= 180
," C,
_: _':,_, v:.J ,
'0, _ ,'
¥--0
= 9O
Ave Rotor tip AveSPL speed, SPL
ft/sec
96.2 ....... 771 ....... 90.8
94.7 ..................740 ..................90.3
93.9 ......... 708 ......... 88.0
92.8 ..... 677 ..... 88.5
91.5 _ 645 -- 86.4
11/= 180
=270,.o • =
b) W= 0
90
¥ = 180 Ave Rotor tip Ave
. .;_-_._., ..... SPL speed, SPL_- x/,---_ _ : ft/sec
-,]{ +_,', 83.6 ....... 771 ....... 79.3
83.1..................740..................76.8,;,,(......_: _ ..... /,,_ 80.7 ......... 708 ......... 74.2
,<.,....... , 79,2 ..... 677 ..... 72.2
.... :_t_"" 76.8 -- 645 _ 70.2
¥=0
¥ = 270
d)
¥= 180
' +, -::> -=:c•"1 ,:"
• '''> ...... :""",,_% _.//_:÷, ........
¥=0
_=90
Effect of Vr on SPL at O = 12.6 deg: a) OASPI,, h) fundamental BPF, c) 1st harmonic of BPF, and d) 2nd harmonic ofBPF.
imum SPL was about 95 dB and occurred in the forward
quadrants at xp" l(15, 180, and 255 deg. Simihtr levels were
measured in the aft quadrants between W - 300-60 deg from
near in-plane to about 20 deg below the rotor phme.
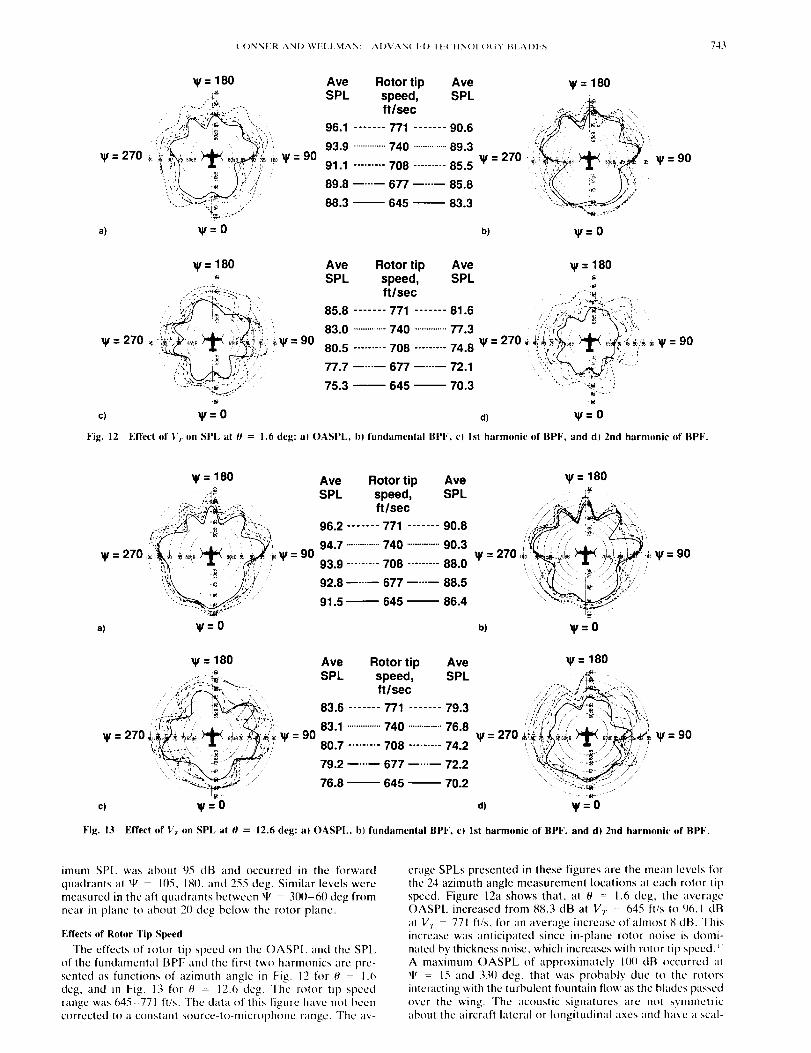
Effects of Rotor Tip Speed
The effects of rotor tip speed on the OASPL and the SPL
of the fundamental BPF and the first two harmonics are pre-
sented as functions of azimuth angle in Fig. 12 for O - 1.6deg, and in Fig. 13 for # - 12.6 deg. The rotor tip speed
range was 645-771 ft/s. The data of this figure have not heen
corrected to a constant source-to-microphone range. The av-
erage SPLs presented in these figures are the mean levels for
the 24 azimuth angle measurement locations at each rotor tip
speed. Figure 12a shows that, at 0 = 1.6 deg, the average
OASPL increased from 88.3 dB at V._ = 645 ft/s to 96.1 dB
at V, - 771 ftls, for an average increase of almost 8 dB. This
increase was anticipated since in-plane rotor noise is domi-nated by thickness noise, which increases with rotor tip speed. *_
A maximum OASPL of approximately 1{)0 dB occurred at
'F 15 and 330 deg, that was probably due to the rotors
interacting with the turbulent fountain flow its the blades passed
over the wing• The acoustic signatures are not symmetric
about the aircraft lateral or hmgitudinal axes and have. scaF

744 ('()NN_;R. ANt) _V[.I[.I._|AN: AI)\rANC'EI) IE('IIN()I.()(IY BLAI)IS.'S
loped shape in the forward quadrants ('-P" - 90 to 270 deg).
It has been shown that this scalloped shape is caused by phase
differences of as much as 180 deg between the acoustic signals
from the two rotor systems at each microphone position re-
sulting from changes in their relative source-to-microphonedistances with _._3
The average SPL of the fundamental blade passage fre-
quency at 0 = 1.6 deg (Fig. 12b) increased from 83.3 dB atV.; - 645 ft/s to 90.6 dB at V; = 771 ft/s, or an increase of
7.3 dB. The overall shape of the noise contours and the lo-
cations of maximum SPL are very similar to that for the OASPL
with the exception that nodes have devcloped in the forward
quadrants near q_ = 90 and 270 deg where the rotor tip speed
has little effect on the SPL. The maximum SPL decreases by
5 dB for each progressively higher harmonic of the funda-mental BPF, whercas the locations of thc maximum SPL re-
main relatively unchanged (Figs. 12c and 12d). The noise
contours for the second harmonic of Fig. 12d exhibit signif-
icantly higher levels on the starboard side of the aircraft com-
pared to the port side,The level and shape of the directivity patterns for the OASPL
at 0 = 12.6 deg (Fig. 13a) change less with rotor tip speed
than was seen at 0 = t.6 deg (Fig. 12a). For the increase in
0 from 1.6 to 12.6 deg, the average OASPL for thc maximum
rotor tip speed of 771 ft/s remained essentially constant at 96dB. However, for all other tip speeds, the average OASPLincreased for this incremental increase in 0. The difference
in the average OASPL for the two 0 can be seen to increaseas the tip speed is decreased. The maximum increase was 3.2
dB at the lowest tip speed of 645 ft/s. The maximum OASPLalso remained constant at t00 dB, however, the locations of
the maximum OASPL have shifted to • - I), 110, and 250
deg, and the maximum levels in the forward quadrants have
increased by 1-3 dB compared to the data at O - 1.6 deg.
Rotor tip speed reductions had little effect on the OASPL
around q' - 90 and 270 deg, and the noise levels were some-what higher in the rear port quadrant as compared to the rear
starboard quadrant. The fundamental BPF and the first twoharmonics for O - 12.6 deg (Figs. 13b- 13d) exhibit the same
trends as seen at 0 - 1.6 deg, with the exception that the
maximum levels generally occurred in the forward quadrants.
In summary, a reduction in rotor tip speed from 771 to 645
ft/s reduced the average OASPL by 7.8 dB at 0 - 1.6 dcg,
and by 4.7 dB at 0 - 12.6 deg. Lateral directivity varies with
q_, suggesting that the acoustic signals from the two rotorsystems are combining constructively and destructively due
to phase differences between the two sigmds caused by theirrelative rotor-to-microphone distance, which varies with q_.
Conclusions
An extensive, high-quality, far-field acoustics data base has
been obtained for the XV-15 with advanced technology blades
operating in hover. Data were obtained for a rotor tip speedrange of 645-771 ft/s, an altitude range of 2-500 ft, and a
gross weight range of 13,1X)0-14,000 lb. A 12-microphone,
500-ft radius semicircular array combined with two aircraft
hcadings provided acoustic data over the full 360-deg azimuth
about the aircraft with a resolution of 15 deg. Altitude vari-
ations provided data from near in-plane to 45 deg below the
rotor tip path plane.
An investigation of rotor tip speed reductions found that a
reduction in rotor tip speed from 771 to 645 ft/s reduced the
average OASPL for the 24 measurement locations about the
aircraft azimuth by 7.8 dB in-plane and by 4.7 dB at 12.6 degbelow the rotor plane.
Acoustic directivity studies show that the directivity pattern
is highly variable with azimuth angle, suggesting that the acoustic
signals from the two rotor systems are combining construc-
tively and destructively due to phase differences caused by
changes in their relative rotor-to-microphone distance. The
acoustic signals propagated off the port and starboard sides
of the aircraft are very similar, but a significant difference
exists in the signals propagated forward and aft. Sharp positive
pressure pulses typical of blade-vortex interactions are present
in the data acquired aft of the aircraft only, probably becauseof the rotors interacting with the turbulent recirculated air
from the fountain flow. This impulsive noise is strongest 45
deg under the rotor at an azimuth angle of II deg; it decreases
moving forward in azimuth on either side of the aircraft and
with decreasing angle under the rotor. For the maximum rotor
tip speed of 771 ft/s and a range of 715 ft, maximum OASPLs
of approximately 100 dB were measured between 40-45 dcg
under the rotor directly aft of the aircraft at _ - 0 dcg.
Larger areas of high noise levels were measured aft of the
aircraft in the rear quadrants as compared to the forwardquadrants. The modest OASPLs measured near in-plane in-
dicate that thickness noise should not bc a major causc ofconcern for this aircraft.
References
LMaiscl, M. D., and Harris, D. J., "ttover Tests of the XV-15
Tiltrotor Research Aircraft," AIAA Paper 81-2501, Nov. 1981.-'Bricger, J. T., Maisel, M. D., and Gcrdes, R., "Exlernal Noise
Evaluations of the XV-15 Tiltrotor Aircraft," Proceedings q[ the AtlSNational Specialists' Meeting on Aerodyuamics and Aeroacot_vth',s (Ar-lington, TX). American Helicopter Society, Alexandria, VA, 1987.
_Golub, R. A., Booker, L. E., Rutledge, C. K., Smith, R. A., andConner, D. A., "'Some Far-Field Acoustics (Tharaclcristics of theXV-15 Tiltrolor Aircraft," AIAA Paper 9t1-3971, Oct. 1990.
_Edwards, B. D., "External Noise of the XV-15 'l'iltrotor Air-
craft," NASA CR 187463, May 1991.'Lee, A., and Mosher, M., "An Acoustical Study of the XV-15
Tiltrotor Research Aircraft," AIAA Paper 79-0612, March 1979."Coffcn, C. D, and Gcorge, A. R.. -Analysis and Prediction of
Tiltrotor Hover Noise," Proceedings _[ the 46th /Dmual k?_rum andTechnology Display _)[ the American ttelicopter Society (Washington,DC), American ttclicoptcr Socicty, Alexandria, VA, 1990.
7George, A. R., Smith. ('. A., Maiscl, M. D., and Bricgcr, J. "I'.,"Tilt Rotor Aircraft Aeroacoustics,'" Proceeding.s of the 45th AJmualForum and Technology lkzwlay of the American Ih'licopWr ,S'o_'ieO,( Bos-ton, MA), American Ilclicopter Socicty, Alexandria, VA, [999.
_Huston, R. J., and Golub, R. A., "Noise Considerations [k)rTilt-
rotor," AIAA Paper 89-2359, July 1989."Tilt Rotor Research Aircraft Familiarization Docurnent," NASA
TMX-62,407, Jan. 1975."'Alexander, H. R., Maiscl, M. D., and Giulianclti, D..I., "The
Development of Adwmecd Techm)h)gy Blades for Tilt-Rotor Air-craft," Vertica, Vol. Ill, Nos. 3/4, 1986, pp. 315-339.
_Bjorkman, W, S., and Bondi, M. J., "TRENt)S: The Aeronau-
tical Post-Test Databasc Management System,'" NASA TM-101025,Jan. 199(I.
_2Schmitz, F. H., Boxwcll, D. A., and Vausc, C. R., "High-SpeedHelicopter Impulsive Noise," Proceedings of the 32nd Ammal Na-tional Forum o]the American Helicopter Society, American Itelicop-ter Society, Alexandria, VA, 1976.
E_Rutledge, C. K., ('often, C. D., and George, A. R., "A ('om-parative Analysis of XV-15 Test Data and WOPWOP PredictionsIncorporating the Fountain Effect," Proceedings of the AHS/RAeSTechnical Speciah'.sts Meeting on RotorcraJt AcousticA and Fhdd Dy-
narnics (Philadelphia, PAL American ttclicoptcr Socicty, Alexan-dria, VA, 1991.

