how a large german transport company uses … lafourcade...how a large german transport company uses...
TRANSCRIPT

How a large German Transport company uses Function Points for Estimating
Dominique Lafourcade
QuantiMetrics GmbH
Gustav-Stresemann-Ring 1, 65189 Wiesbaden, Germany
Agenda
• Introduction
• The company & it‘s figures
• History & evolution of metrics, FP‘s and Estimating within the company
• FP Governance: how is the FP counting organized?
• Projects: How are FP‘s used in estimating
• Benchmarking: what role does it play
2
Introduction
• My story, our company, our customers (briefly)
• Why present a positive example
• Large companies, big problems, complex solutions
3
The company & it‘s figures
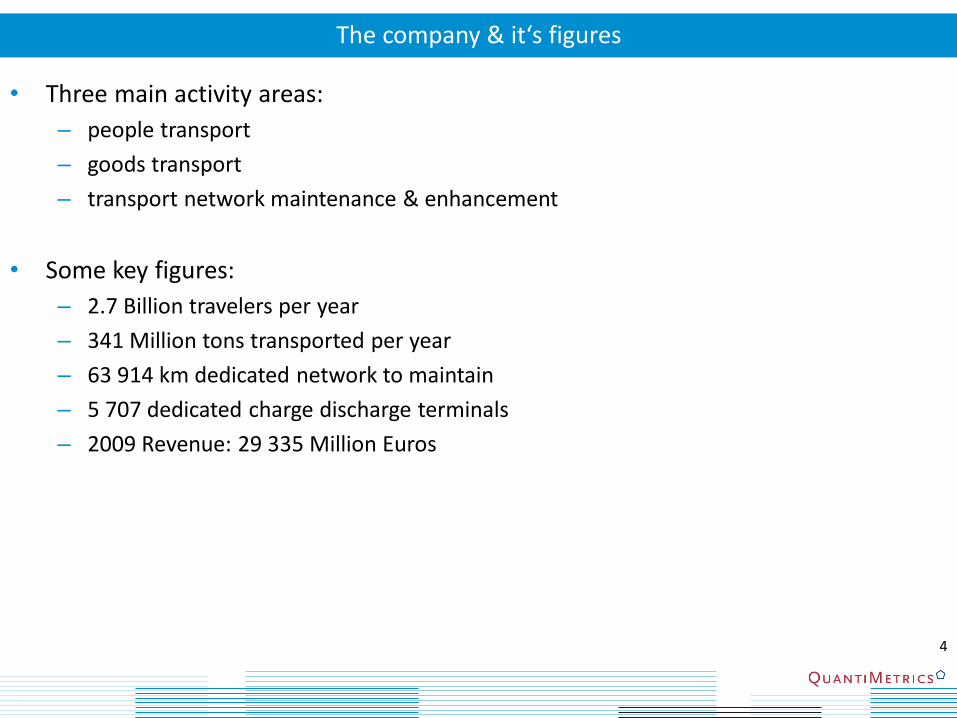
§ main branches: • Three main activity areas:
– people transport
– goods transport
– transport network maintenance & enhancement
• Some key figures:
– 2.7 Billion travelers per year
– 341 Million tons transported per year
– 63 914 km dedicated network to maintain
– 5 707 dedicated charge discharge terminals
– 2009 Revenue: 29 335 Million Euros
4

The company & it‘s figures : the IT Department
• Over 500 systems supported
• 240 000 man days effort expended in application development during 2007
• 71 000 Desktops
• 1,2 Petabyte Disk Storage / 3,2 Petabyte Backup capacity (1 PB is approx 1 M GB)
• 300 Million visitors on Internet Portal during 2008
• Main systems supported: – Passenger Reservations (quote some volumes…)
– POS ticket terminals (145 M tickets in 2008)
– Logistics
– Scheduling
5

IT Delivery is organized by Functional areas
-Project Managers -Functional Architects -Business Analysts
People Transport
Functional Areas
-Project Managers -Functional Architects -Business Analysts
Logistics
-Project Managers -Functional Architects -Business Analysts
Goods Transport
Process Management Guidelines, Repository, Benchmarking, Gate reviews
Technical Architects Technical Analysts Developers
Platform 1
Technical Resource pool
-Test Managers
Testing Technical Architects Technical Analysts Developers
Platform 2
6
Key Success Factors in the Introduction of Functional Metrics
• Focus on the simple implementation
– Have one steering group for Functional Counting
– Gather count results into a centralized repository
– Comparison amongst groups should have a limited audience
– Counting and data gathering should take place in the functional team
– Effort expended in counts should be commensurate with the value of the results
• Reduce the counting effort by using average values (“Rapid”)
• Training and Communication
– Training at different levels and depths (management, analysts, technicians, counters)
– Correct common misconceptions through accurate and recurrent communications
• Functional metrics are used as one of parameters in estimating, however an estimating tool/method needs to be used in order to produce an estimate
7
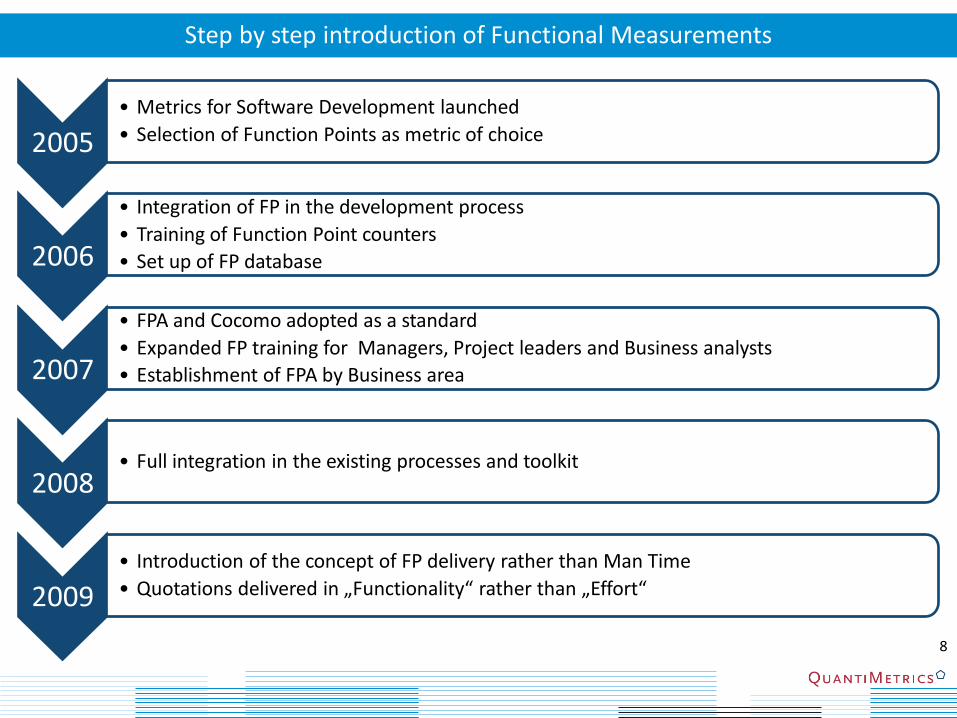
Step by step introduction of Functional Measurements
2005
• Metrics for Software Development launched
• Selection of Function Points as metric of choice
2006
• Integration of FP in the development process
• Training of Function Point counters
• Set up of FP database
2007
• FPA and Cocomo adopted as a standard
• Expanded FP training for Managers, Project leaders and Business analysts
• Establishment of FPA by Business area
2008 • Full integration in the existing processes and toolkit
2009
• Introduction of the concept of FP delivery rather than Man Time
• Quotations delivered in „Functionality“ rather than „Effort“
8
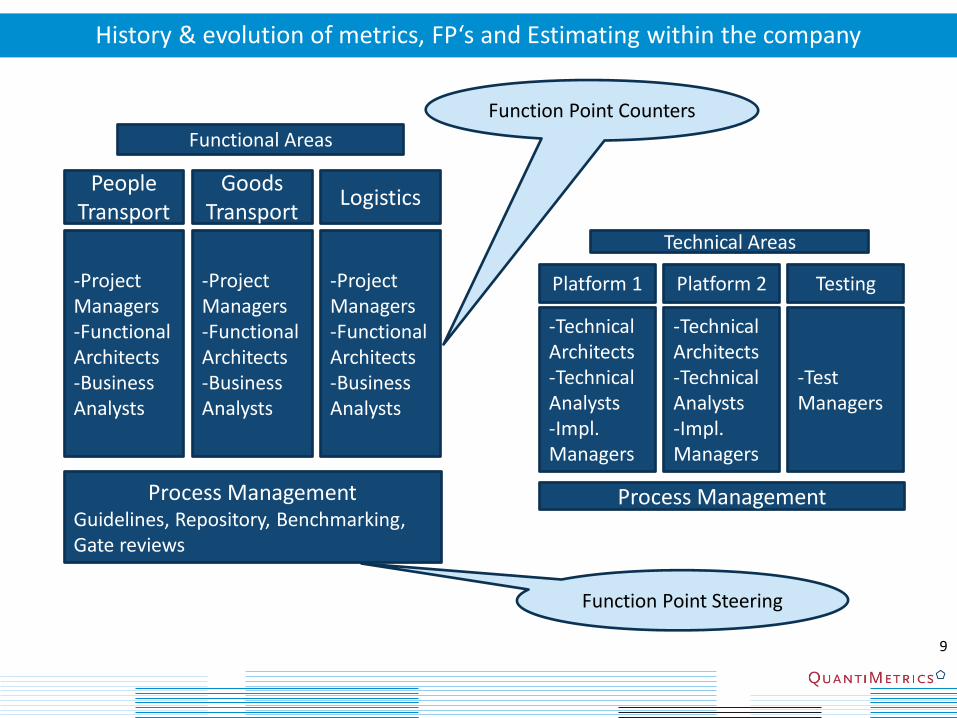
Function Point Counters
History & evolution of metrics, FP‘s and Estimating within the company
-Project Managers -Functional Architects -Business Analysts
People Transport
Functional Areas
-Project Managers -Functional Architects -Business Analysts
Logistics
-Project Managers -Functional Architects -Business Analysts
Goods Transport
Process Management Guidelines, Repository, Benchmarking, Gate reviews
-Technical Architects -Technical Analysts -Impl. Managers
Platform 1
Technical Areas
-Test Managers
Testing
-Technical Architects -Technical Analysts -Impl. Managers
Platform 2
Process Management
Function Point Steering
9

FP enhancement counts per release
FP Baseline count
Gate review Requires FP count
and Cocomo Estimate
Projects: How are FP‘s used in estimating
Define Project
Functional Requirements
Technical Design
Implement Test Deploy Maintain
Cost: effort/FP Time : time/FP Quality : time , scope , budget , defects
As agreed
16% of total 13% of
total 40% of total
15% of total
5% of total
% of total
The Cocomo Model calibration: how the estimate is broken down
Estimates pre RFQ to support negotiations 10
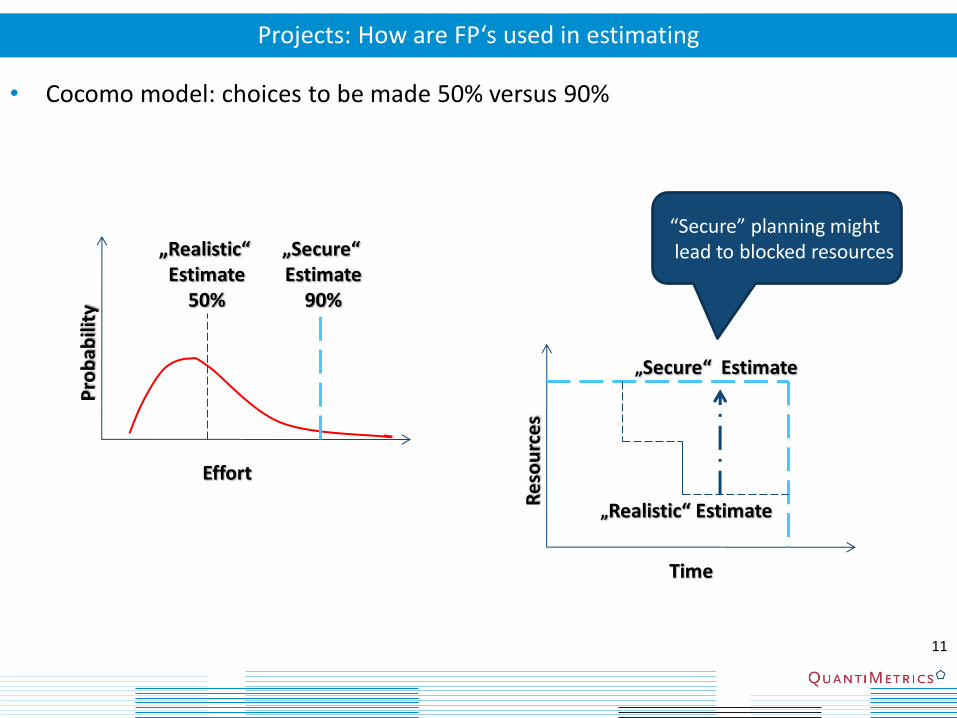
Projects: How are FP‘s used in estimating
• Cocomo model: choices to be made 50% versus 90%
Effort
Pro
bab
ility
„Realistic“ Estimate
50%
„Secure“ Estimate
90%
Re
sou
rce
s „Realistic“ Estimate
„Secure“ Estimate
Time
“Secure” planning might lead to blocked resources
11
History & evolution of metrics, FP‘s and Estimating within the company
• Frame contracts with IT suppliers now (since 2009) include Function point productivity requirements
• Estimating for projects is done using multiple techniques and merging them:
– Avoid “common sense errors” that may result from a model
– Use available experience & resources
– Provide more accuracy in the estimate
12
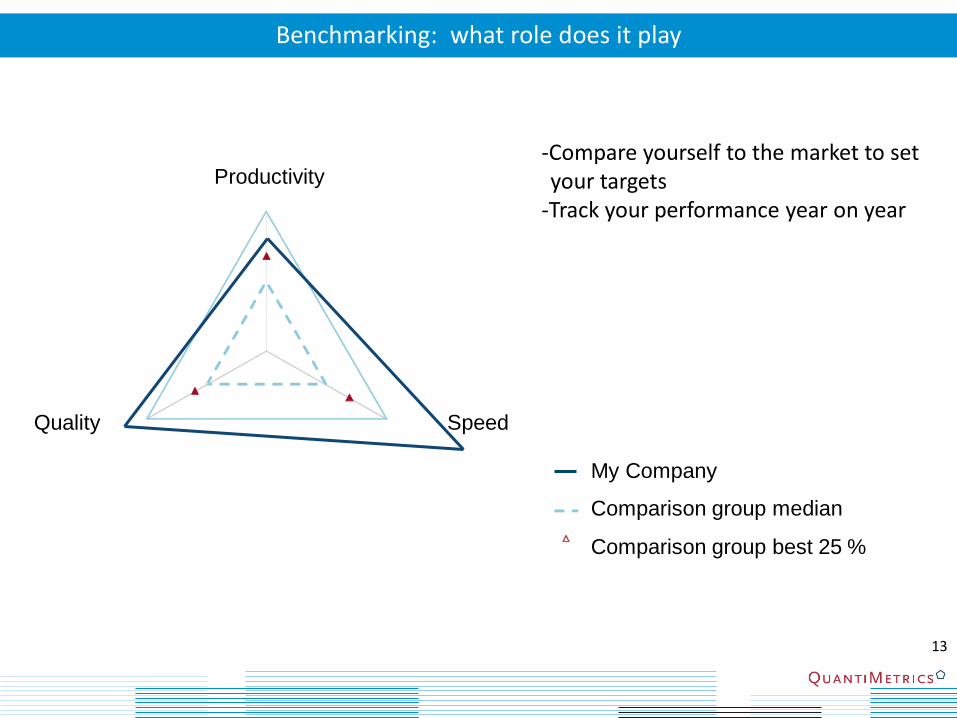
Benchmarking: what role does it play
Productivity
Speed Quality
Comparison group best 25 %
Comparison group median
My Company
-Compare yourself to the market to set your targets
-Track your performance year on year
13

Questions?
14
Many thanks for your attention!
15