how are earth’s spheres interacting? es0103 · among earth's spheres. answers will vary. ......
TRANSCRIPT

Cha
pter
1In
tern
et In
vest
igat
ion
Name Date
Internet Investigations Guide 7Earth Science
Use another sheet of paper if you need extra space to write complete answers.
How Are Earth’s Spheres Interacting? ES0103
●1 Looking at the image, what are the majorparts of our planet that can interact as asystem? Answers will vary. Land, water, clouds, ice, plants, and
air are possible answers.
●2 Describe each of Earth's four spheres. Listseveral examples of features in each sphere.The geosphere is made of rock. It includes all Earth's
layers, continents, mountains, rocks, sand, and dirt. The
hydrosphere is water. It include the oceans, lakes, rivers,
and ice. The atmosphere is all the gas on and around
Earth. It includes oxygen, nitrogen, and water vapor.
The biosphere is life. It includes plants, animals, and
microbes.
●3 Do you think clouds should be classified aspart of the atmosphere, or part of thehydrosphere? Explain why. Answers will vary. Look for sound reasoning in student
justifications.
●4 In each image, look for evidence of materialsand energy moving among the spheres.• List the major features in the image and tell
which sphere each one represents.• Describe sphere interactions you can infer
from the scene.• Whenever possible, follow the results of an
interaction through all four spheres.Answers will vary. These are sample responses.
A. Suez Canal The canal is cut through the geosphere (land). It
shows that the biosphere (humans) changed the
geosphere (land) to connect two parts of the
hydrosphere (ocean).
B. Tropical Island Where geosphere (land) is above the hydrosphere
(sea), the biosphere (plants) is able to thrive.
●4 continuedC. Forest fire Burning of the biosphere (forest) is adding energy
and materials to the atmosphere and returning
materials to the geosphere (land).
D. Oil wells burning “Fossilized” biosphere material (oil) drilled from the
geosphere (land) reacts with the atmosphere,
releasing energy and materials into the atmosphere.
E. Wind farm Biosphere (humans) use geosphere materials
(metal, plastics) to harness energy from the
atmosphere.
F. Mount Etna, a volcano on Sicily Geosphere (lava and ash) materials and heat energy
are released into the atmosphere.
●5 List some Earth sphere interactions fromyour own daily activities. Answers will vary. Students may cite an example like
this for their daily trasportation: The biosphere
(humans) uses geosphere (metal) to manufacture
vehicles. Engines use energy from the biosphere (oil)
stored in the geosphere (underground) and add
pollutants to the atmosphere.
●6 Describe some human activities that arecontributing to global-scale interactionsamong Earth's spheres. Answers will vary. Students may mention global
warming, depletion of ozone, deforestation, or urban
sprawl.
Answers will vary. Look for evidence of students
considering the entire Earth system rather than
focusing on single spheres.

Cha
pter
1In
tern
et In
vest
igat
ion
●1 For each location, tell how you think thecrops get their water. What Earth systemprocesses can be inferred at each location?Crops in Argentina are watered by rain. This indicates
that the hydrosphere is available at Earth’s surface for
the biosphere to thrive.
In Saudi Arabia, water is pumped from underground to
water crops. This indicates the hydrosphere is scarce at
Earth’s surface and humans need to use energy to
provide crops with water.
●2 Which of the two images more closelyrepresents how crops receive water nearyour home? Is the hydrosphere abundant orscarce at your location? Answers will vary. For areas where irrigation is
necessary, Saudi Arabia is the representative image. For
areas where farmers depend on rain, the image of
Argentine fields represents their region.
●3 How does the geosphere affect the biospherein each of these places? Describeinteractions between the geosphere and thebiosphere for each image.At Popocatépetl, the geosphere is destructive to the
biosphere. Neither plants nor animals can live easily on
this part of the geosphere. On the islands, the geosphere
provides nutrients for the biosphere. Plants are
abundant.
●4 Describe interactions between humans andthe geosphere illustrated by the images. At mines, humans remove geosphere materials. At
landfills, they return materials to the geosphere.
●5 In your region, what materials do humanstake from the geosphere? What materials arereturned to it?Answers will vary. Students may be aware of mines and
landfills in your region.
●6 Describe differences in interactions betweenthe hydrosphere and the geosphereillustrated by these images. At Capitol Reef, brief periods of contact with liquid rain
wash sediments downhill. At Mount Rainier, frozen
water grinds against rocks constantly. Differences in
erosional processes result in varied landforms.
●7 Based on temperatures near the equator andthe poles, describe how the hydrosphere andthe atmosphere interact at each location. Near the equator, the hydrosphere transfers large
amounts of water vapor to the atmosphere. Near the
poles, less water evaporates.
●8 Think about how quickly or slowlyevaporation occurs at your location. (Forinstance, consider how long it takes a damptowel to dry out.) Describe interactionsbetween the hydrosphere and atmosphereyou can infer for your location. Answers will vary. Complete responses should include a
general description of the evaporation rate in your
region.
●9 What is the Leaf Area Index for your ownregion in the image? Answers will vary with your location.
●10 Describe interactions among the biosphere,hydrosphere, and atmosphere indicated foryour region by this image.Answers will vary. For areas with abundant leaf
coverage, the biosphere is actively transferring
materials from the hydrosphere into the atmosphere.
For areas with little leaf coverage, interactions are less
active.
Name Date
8 Internet Investigations Guide Earth Science
How Do Interactions among Earth’s Spheres VaryRegionally?Use another sheet of paper if you need extra space to write complete answers.
ES0108
Cha
pter
2In
tern
et In
vest
igat
ion
●1 Brainstorm with a couple of other students:Make a list of the kinds of information youwould want to gather to help you predictwhere wildfires might break out. Answers will vary. Students may list the dryness of
vegetation, the length of time since it last rained, or the
number of careless campers in a region
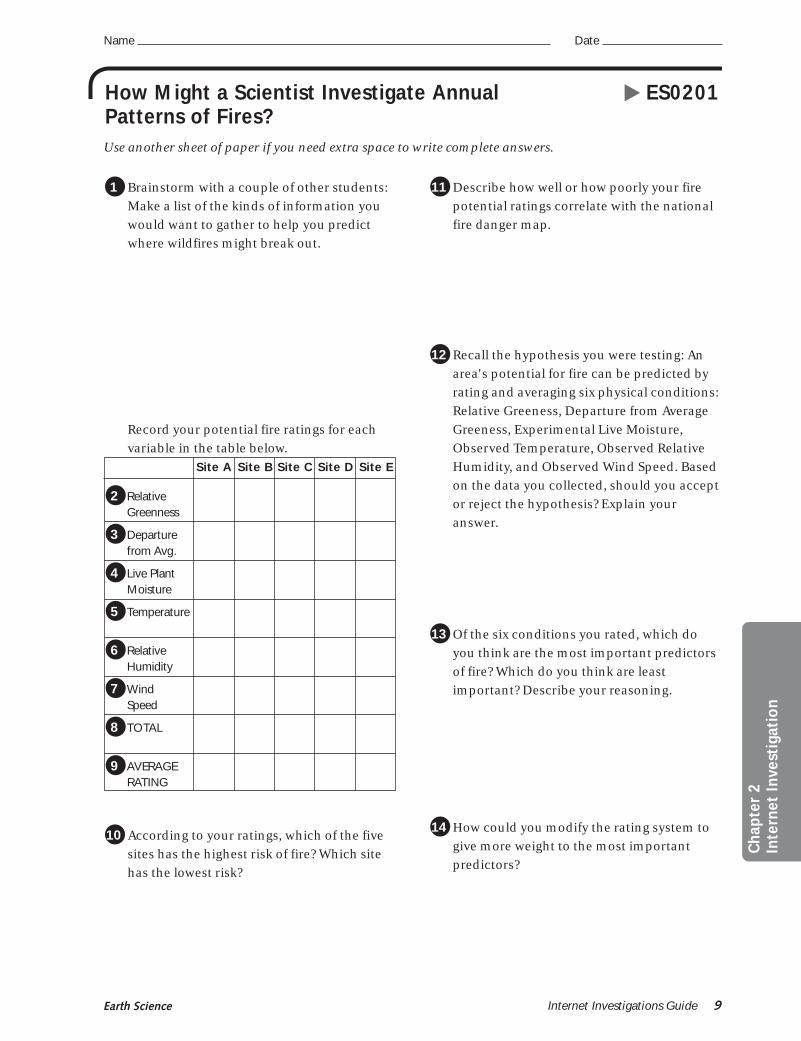
Record your potential fire ratings for eachvariable in the table below.
●10 According to your ratings, which of the fivesites has the highest risk of fire? Which sitehas the lowest risk? Answers will vary depending on students’ rating system.
The national fire danger map shows that Site A has the
highest fire danger and Site E has the lowest.
●11 Describe how well or how poorly your firepotential ratings correlate with the nationalfire danger map. Answers will vary depending on student ratings. With
this simplified rating system, it is possible to calculate
ratings very similar to the national fire danger map.
●12 Recall the hypothesis you were testing: Anarea's potential for fire can be predicted byrating and averaging six physical conditions:Relative Greeness, Departure from AverageGreeness, Experimental Live Moisture,Observed Temperature, Observed RelativeHumidity, and Observed Wind Speed. Basedon the data you collected, should you acceptor reject the hypothesis? Explain youranswer. Answers will vary. In most cases, data should support
the hypothesis.
●13 Of the six conditions you rated, which doyou think are the most important predictorsof fire? Which do you think are leastimportant? Describe your reasoning.Answers will vary. Students may suggest wind speed is
most important because it blows sparks or that relative
greeness is least important because plants are not yet
mature.
●14 How could you modify the rating system togive more weight to the most importantpredictors? Answers will vary. Students may suggest assigning a
mathematical weighting factor to each condition to
indicate their relative importance in the final rating.
Name Date
Internet Investigations Guide 9Earth Science
Use another sheet of paper if you need extra space to write complete answers.
How Might a Scientist Investigate AnnualPatterns of Fires?
ES0201
Site A Site B Site C Site D Site E
●2 Relative Students’ tables will vary. Students use
Greenness their own relative rating system to
●3 Departure characterize fire potential. The average
from Avg. ratings (number 9) should be a number
●4 Live Plant between 1 and 5. Ratings near 1 indicate
Moisture a low fire potential; ratings close to 5
●5 Temperature indicate a high risk of fire.
●6 Relative Humidity
●7 WindSpeed
●8 TOTAL
●9 AVERAGERATING

Cha
pter
2In
tern
et In
vest
igat
ion
●1 Describe some of the specific changes youobserve in the animations. Answers will vary. Students may mention seasonal
changes of temperature.
●2 Record the vegetation index values forOctober, November, and December.
●3 Describe the trend of vegetation levels overthe course of the year. Vegetation steadily rises from January through May,
then holds steady until July. After July, it decreases until
September, then holds steady through November, at
which point it drops again.
●4 Describe the general relationship betweenvegetation index and UV level, shown in theX-Y plot of the data. In general, as UV levels increase, so do the vegetation
levels.
●5 Describe the trends in the levels of UVradiation over the course of the year. UV level rises steadily from January through June. It
holds steady through July, then decreases fairly steadily
through December.
●6 Based on the information presented here,would you accept or reject the hypothesisthat the density of green vegetation isdirectly related to the amount of UV lightthat an area receives? Explain your answer. Students should accept the hypothesis. There is a strong
correlation between the two variables. The two graphs
are very similar in shape.
Plans for Conducting a Scientific InvestigationI. Observing
Answers will vary
II. Ask QuestionsAnswers will vary
III. Form a HypothesisAnswers will vary
IV. Design a research methodAnswers will vary
V. Data CollectionAnswers will vary
VI. Hypothesis TestingAnswers will vary
VII. Sharing your findingsAnswers will vary
Name Date
10 Internet Investigations Guide Earth Science
How Might You Investigate ScientificPhenomena?Use another sheet of paper if you need extra space to write complete answers.
ES0205
Mo. Jan Feb Mar Apr May Jun Jul Aug Sep Oct Nov Dec
UV Level 1000 2000 3000 4000 5000 6000 6000 5000 3000 2000 2000 1000
Veg.Index 0.1 0.2 0.3 0.4 0.5 0.5 0.5 0.4 0.3 0.3 0.3 0.2

Cha
pter
3In
tern
et In
vest
igat
ion
●1 Write a detailed description of thetopography that you encounter during thisflyby.Answers will vary.
●2 Compare the photo to the topographic map.Describe the pattern of the contour linesaround features on the photo.Answers will vary. Students may notice that contour
lines surround hills and are more closely spaced when
the topography is steep.
●3 Which part of this land is the last to flood asthe water rises?The flat top of the cliff is the last part to flood.
●4 What is the elevation of the lines marked atA, B, and C?The elevation at A is 6320 feet. The elevation at B is 6440
feet. The elevation at C is 6700 feet.
●5 Describe the overall shape of the landscape. This map shows a cliff with steep sides and a flat top.
●6 What do closely spaced contour linesindicate about the shape of a feature? Inother words, when the lines are closetogether, does the feature have gentle slopesor steep sides?When contour lines are spaced closely on a map, the
structure represented by the lines is very steep.
●7 What is the pattern of the contour linesaround a simple hill?Contour lines around a hill form closed, nested loops
that are round or oval.
●8 Make a sketch of the pattern of the contourlines moving up the valley. Draw an arrow toindicate the direction in which water flowsacross the lines.
●9 What landform feature does the model show,and what do hachures on contour linesindicate?The model shows a volcano. The hachures show where
the contour lines decrease in elevation. On the volcano,
this occurs at the depression on its top.
●10 Describe the structure inside the box on themap.The structure is a valley descending from Mount Shasta.
●11 Identify the features marked at A and B.Where is the elevation highest on this map?Where is it lowest?A is a peak, B is a valley. The elevation is highest at the
top of the northernmost peak, and lowest in the
southwestern corner of the map.
●12 Which of the landforms was easiest torecognize from its topographic map?Answers will vary.
Name Date
Internet Investigations Guide 13Earth Science
Use another sheet of paper if you need extra space to write complete answers.
How Are Landforms Represented on Flat Maps? ES0307

Cha
pter
4In
tern
et In
vest
igat
ion
●1 Which continents are experiencing day inthe image?North America, South America, Antarctica, and some of
Africa
●2 Which continents are experiencing night?Eurasia, Australia, and most of Africa
●3 In what direction does Earth rotate?Earth rotates from west to east. Viewed from above the
North Pole, the direction of Earth’s rotation is
counterclockwise.
●4 From what direction does the sun appear torise each day?The sun appears to rise in the east.
●5 In what direction does the sun appear to seteach day?The sun appears to set in the west.
●6 When the east coast of the United States isexperiencing sunrise, where on Earth is thesun setting?Eurasia
●7 When the west coast of Africa is experiencingsunrise, approximately what time is it inIndia?Noon
●8 Describe how you think the direction of ashadow cast by a flagpole at your locationwould change through the daylight hours.Answers will vary. Generally, shadows point to the west
in the morning, then arc around to the north (in the
northern hemisphere), then point to the east in the
evening.
●9 Sketch a map view of a flagpole area andshow the times that the flagpole's shadowwould indicate when it pointed west, north,and east.
●10 Write a simple equation to convert UniversalTime to local time for the time zone whereyou live.Answers will vary with location. For Eastern Time Zone,
Time = UT minus 5 hours.
●11 How many time zones (hours) apart are St.Louis, Missouri, U.S.A. and Kyoto, Japan?Nine hours separate the two cities counting from St.
Louis west to Japan; fifteen hours separate them
counting from St. Louis east to Japan.
●12 During the hours you are normally awake,when could you call your friend in Japan toreach them when they are normally awake?When it is between 4:00 p.m. and 10:00 p.m. in St. Louis,
it is 7:00 a.m. to 1:00 p.m. in Japan.
●13 What time is it in Reno (Pacific StandardTime) when you call?Noon
●14 If a plane departed at 4:00 p.m. on October24 from Tokyo, Japan (approximately 135degrees E), and the flight takes 9 hours and30 minutes, what time and date would theplane arrive in Los Angeles (approximately120 degrees west)?Landing time would be approximately 8:30 a.m. on
October 24.
●15 Use the information in the description andon the graphic to calculate the boat'slongitude.The boat's longitude is 45 degrees West.
Name Date
Internet Investigations Guide 19Earth Science
Use another sheet of paper if you need extra space to write complete answers.
What Time Is It? ES0405

Name Date
Cha
pter
10
Inte
rnet
Inve
stig
atio
n
Internet Investigations Guide 39Earth Science
Use another sheet of paper if you need extra space to write complete answers.
Where Was That Earthquake? ES1003
●1 What do you notice about the time intervalbetween the arrival of P and S waves at thethree different seismograph stations? Whatcauses these differences?The difference between P and S wave arrival time is
larger for stations farther from the epicenter. This is
due to the difference in velocity between P and S waves.
●2 Record the distance to the epicenter fromLancaster, Victorville, and Los Angeles.Victorville 133 km to epicenter
Lancaster 71 km to epicenter
Los Angeles 42 km to epicenter
●3 For each location, draw circlescorresponding to the distances you recordedin question 2. Sketch the circles on your mapand mark the epicenter location.Epicenter is at 34° 15’ N, 118°7.5’ W
●4 Describe three different examples of damagethat occurred as a result of the Northridgeearthquake.Answers will vary. Answers might include fallen
buildings, fires, cracked roads, and broken bridges.
Cha
pter
10
Inte
rnet
Inve
stig
atio
nName Date
40 Internet Investigations Guide Earth Science
Which Fault Moved in the NorthridgeEarthquake?Use another sheet of paper if you need extra space to write complete answers.
ES1010
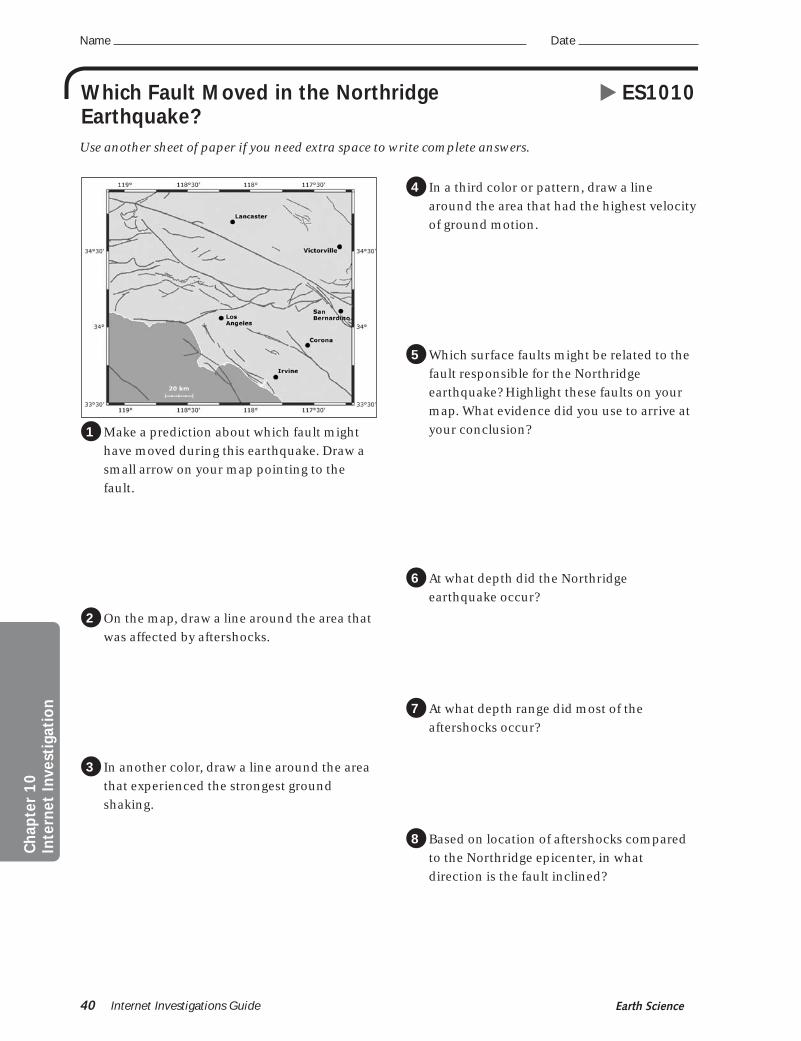
●1 Make a prediction about which fault mighthave moved during this earthquake. Draw asmall arrow on your map pointing to thefault.Answers will vary. Students should choose a fault
somewhere near the epicenter.
●2 On the map, draw a line around the area thatwas affected by aftershocks. Aftershocks were concentrated in an oval-shaped area
near the Northridge epicenter.
●3 In another color, draw a line around the areathat experienced the strongest groundshaking. The strongest ground shaking was concentrated in an
oval-shaped area near the Northridge epicenter.
●4 In a third color or pattern, draw a linearound the area that had the highest velocityof ground motion.The highest ground velocity occurred right around the
epicenter.
●5 Which surface faults might be related to thefault responsible for the Northridgeearthquake? Highlight these faults on yourmap. What evidence did you use to arrive atyour conclusion?Answers will vary. The Northridge Thrust Fault, (marked
with an arrow) just north of the epicenter, is the closest
surface fault to the area of greatest ground motion,
velocity, and location of aftershocks.
●6 At what depth did the Northridgeearthquake occur?Around 18 km
●7 At what depth range did most of theaftershocks occur? 0-10 km
●8 Based on location of aftershocks comparedto the Northridge epicenter, in whatdirection is the fault inclined? Fault is inclined to the southwest.

●1 Write three observations about the soil inthis photo. The soil is very dark, probably fertile because of the
existence of crops, well broken-up, and not in big clods.
●2 Identify and describe as many differentlayers (horizons) as you see in this soilprofile.
There seem to be four layers—a dark layer at the
top with plants, a light gray layer which is thinner than
the top dark layer, a very thick red-brown layer, and a
bottom layer that is rocky and slightly darker.
●3 List several similarities and differencesacross these soils.
The soils have different colors; some have defined
layers; some have large pebbles included; some seem to
be finer-grained.
●4 What relationship do you think might existbetween average annual precipitation andtopsoil depth?
Answers will vary. Students may suggest that more
precipitation relates to deeper topsoil, or vice versa, or
that there is no relationship at all.
●5 Measure and record the topsoil depth in yourtable.
●6 Sketch the graph on your worksheet.
●7 Describe any pattern that exists betweentopsoil depth and average annualprecipitation.
Some of the data points appear to form a trend
(shown on the graph) of increasing topsoil depth with
increasing precipitation.
●8 Go to the Web site for your state soil andestimate its depth.
Answers will vary with location. For example, the
topsoil depth in Maryland is approximately 9 inches.
●9 Go to the Web site for the United Statesprecipitation map and find the averageannual precipitation in your state.
Answers will vary with location. For example, the
average annual precipitation in Maryland is 45 inches.
●10 Plot the point for your state on the graph oftopsoil depth versus precipitation. How doesyour state’s soil compare to the others?
z
●11 Do average precipitation amounts appear tobe related to the depth of topsoil in an area?If so, describe how. If you see no evidence forthe relationship, suggest another factor youcould plot versus topsoil depth to look for arelationship.Answers will vary. Students may describe a relationship
or suggest another factor for plotting.
Cha
pter
12
Inte
rnet
Inve
stig
atio
n
Name Date
Internet Investigations Guide 49Earth Science
Use another sheet of paper if you need extra space to write complete answers.
How Does Soil Vary from Place to Place? ES1206
Topsoil depth Average Annualin images Precipitation(inches) (inches)
Arizona 1 7
Montana 2 12
Pennsylvania 6 48
Massachusetts 8 43
Georgia 9 47
Hawaii 10 150

Uni
t 5
Inte
rnet
Inve
stig
atio
n
Name Date
Internet Investigations Guide 75Earth Science
Use another sheet of paper if you need extra space to write complete answers.
How Might Global Climate Change AffectLife on Earth?
ESU501
●1 Why do you think the error bars becomesmaller in the more recent part of the graph?Accuracy in reconstructing temperatures decreases
farther back in time.
●2 When did concentrations of thesegreenhouse gases start increasing rapidly?What might have caused these increases?Around 1800, when the industrial revolution brought
heavy reliance on fossil fuels.
●3 Which gas affects global warming most?Which gas has the least effect?Most effect—CO2. Least effect—NO2.
●4 Predict how continued increases inatmospheric carbon dioxide will affect globaltemperatures.Increasing CO2 concentrations will cause increasing
global temperature.
●5 Why do scientists develop numerous modelsrather than rely on just one?Models are only best guesses, so using just one model
might be inaccurate. Also, many models can be
compared to each other.
●6 Based on all the models, what are theminimum and maximum temperatureincreases expected to occur by 2100?Average surface temperature is projected to increase by
1.4 to 5.8oC by 2100.
●7 Which hemisphere (north or south) appearsto have experienced the most significanttemperature changes? Hypothesize aboutwhy this is so.Northern hemisphere. Water moderates temperature
changes and there is more ocean area in the southern
hemisphere.
●8 Of the global climate change impactsconsidered, which one do you think posesthe greatest risk to humanity? Cite evidencefor your answer.Answers will vary.
●9 Suggest two actions that people might taketo decrease human influence on globalclimate change.Answers will vary.
Climate Change Impact Assessment TableImpact Category Description of Most Vulnerable Ability of Humans to
Expected Impacts Locations Adapt to Impact
Health
Agriculture
Water Resources
Forests
Species and Natural Areas
Coastal Areas
Make a table like this on a full sheet of paper, and fill it in as you explore the links.

●1 Describe some of the general patterns youobserve for temperature and salinity.Higher salinity is generally found with warmer sea
temperatures, especially those in the subtropics, and in
secluded areas. Lower salinity is generally found with
colder temperatures and along the continents,
especially near river mouths.
●2 Describe the location of at least three placesin the world’s oceans that have hightemperatures but low salinity.Answers will vary. Possibilities include the west coast of
Africa at the equator, the north coast of Australia, the
east coast of India, the coast around Southeast Asia, the
northeast coast of South America, and along the west
coast of Central America.
●3 What do you think might cause low salinityin these areas of warm ocean water?Answers may vary. Heavy rainfall or addition of fresh
water from rivers might decrease salinity.
●4 Determine the temperature, salinity, anddensity of ocean water at the followinglocations: a. 0º, 50ºW b. 20ºN, 90ºE0º, 50ºW: Temperature = 27ºC, Salinity = below 33‰,
Density = 1.021 g/cm3
20ºN, 90ºE: Temperature = 28ºC, Salinity = below 33‰,
Density = 1.021 g/cm3
●5 What is responsible for the unusually lowsalinity of these warm waters?These locations are at the mouths of the Amazon and
the Ganges rivers. They receive enormous amounts of
fresh water, which lowers salinity.
●6 Determine the temperature, salinity, anddensity of water on the Mediterranean andthe Atlantic sides of the Strait of Gibraltar.Mediterranean side: Temperature = 19ºC, Salinity =
above 37‰, Density = 1.027 g/cm3
Atlantic side: Temperature = 19ºC, Salinity = 36.4‰,
Density = 1.026 g/cm3
●7 Predict what would happen to water thatmoves from the Mediterranean Sea into theAtlantic Ocean.It would sink because it is more dense.
●8 Determine the temperature, salinity, anddensity of the water on the Caribbean andthe Pacific sides of the Panama Canal.Caribbean side: Temperature = 28ºC, Salinity = 35.8‰,
Density = 1.023 g/cm3
Pacific: Temperature = 28ºC, Salinity = 33.6‰, Density =
1.021 g/cm3
●9 Predict what would happen to water thatmoves from the Caribbean Sea into thePacific Ocean.It would sink because it is more dense.
●10 Find waters near Antarctica with thecombination of the lowest sea temperaturesand highest salinity. Extrapolate (extend theinformation on the graph) to determine theapproximate density of these watersTemperature = -1ºC, Salinity = 34.4‰, Density = 1.028
g/cm3
●11 At what level in the ocean will these watersmove away from Antarctica?They would move along the bottom of the oceans, as
Name Date
Cha
pter
22
Inte
rnet
Inve
stig
atio
n
Internet Investigations Guide 79Earth Science
Use another sheet of paper if you need extra space to write complete answers.
How Do Temperature and Salinity Affect Mixingin the Ocean?
ES2202

●1 What evidence did you look for to predictthe location of each feature?Answers will vary. The lowest sea depths indicate the
deepest parts of the ocean where the ocean floor and
trenches could exist. Shallower sea depths are closer to
the surface and could indicate the presence of features
such as ridges or seamounts. The shallowest waters
would be over areas very close to the surface, such as
the continental shelves.
●2 Describe at least three observations from theanimation.Answers will vary. Water immediately drains off islands
and the shelves that extend from the continent. The
area of the continents increases and the area covered by
the ocean decreases. As the water drains, it exposes a
long ridge down the middle of the ocean. Water drains
from the continents toward the middle of the ocean and
from the ridge toward the continents. Water drains last
from deepest part of the ocean on either side of the
ridge.
●3 Describe the sequence of how the waterdrains. Which features are exposed first?...last? Why does the water drain in this way?Draining exposes the continental shelves and islands
first, then the ridges. The water drains in toward the
middle of the ocean along the basins and finally out of
the fracture zones and trenches. It drains this way
because shallowest areas empty first and deepest areas
last.
●4 Imagine that you could travel across theocean floor from Casablanca, Morocco, toNorfolk, Virginia, to Caracas, Venezuela.Narrate a brief "tour" of this path, describingthe ocean floor features you wouldencounter. Use a map of this area to helpyou locate islands and distinguish themfrom seamounts.After moving down the continental shelf, we pass
several islands. We cross a deep abyssal plain until we
come to the middle of the Atlantic where we encounter
many seamounts. We cross many fracture zones and
ascend up the side of the Mid-Atlantic Ridge. After we
come down the other side of the ridge, we cross an
abyssal plain and pass another group of seamounts. We
climb a relatively steep shelf just before we arrive at
Norfolk, Virginia. Leaving Norfolk, we descend the shelf
and go across a plain. We cross a very deep trench near
Puerto Rico. We then cross a ridge between Puerto Rico
and the Dominican Republic. We descend to a deep
plain then climb over another ridge before ascending
the shelf to Caracas.
Name Date
Cha
pter
23
Inte
rnet
Inve
stig
atio
n
Internet Investigations Guide 81Earth Science
Use another sheet of paper if you need extra space to write complete answers.
What Does the Ocean Floor Look Like? ES2301

●1 Make two observations about temperatureand salinity on the Caribbean and Pacificsides of Panama. The Caribbean side is warmer and saltier. The Pacific
side is cooler and less salty.
●2 Interpret the processes shown in the imageto explain your observations from question 1.Strong winds and plenty of sunshine evaporate
Caribbean sea water , making it saltier. Trade winds,
coming east from the Atlantic, carry evaporated water
over to the Pacific side. This water condenses and
provides abundant rainfall on the Pacific side. The
abundance of fresh water, in the form of rain, lowers
the salinity on the Pacific side.
●3 Describe the changes in salinity in theCaribbean Sea and Pacific Ocean from six totwo and a half million years ago. The salinity of both sides was similar, and was relatively
low from 6 to 5 mya. At about 4.8 mya, the salinity in the
Caribbean and Pacific became very different. Salinity
generally increased in the Caribbean and decreased in
the Pacific.
●4 Why do you think the ocean chemistrychanged? Answers will vary. The formation of a land bridge
occurred. Isolated waters led to a change in climate
that, in turn, caused changes in ocean chemistry.
●5 How do you think this marine species couldhave spread to both sides of the isthmus?At some time, the two bodies of water must have been
connected, allowing these species to pass from one
body to the other and exist on both sides.
●6 In which layers was Pulleniatina present?Complete the chart below.
●7 How would you explain the presence orabsence of Pulleniatina only on the PacificOcean side?This was a new species that developed when
populations of microorganisms were isolated by the
formation of a land bridge between North and South
America
●8 How many years ago was the Isthmus ofPanama formed? Explain how you used thedata to determine this. About 5 million years ago. This is about the time the
new species, Pullentiatina, started to appear only in the
Pacific, indicating that from that time after, it was cut off
from the Caribbean. The graph showing the ratios
between O-16 and O-18 also reveals a change occurred
5 mya.
●9 Summarize the changes that have occurredin the Earth’s spheres on either side of theIsthmus of Panama from six to three millionyears ago. At 6 mya, the Caribbean and Pacific were connected.
The salinity was very similar, and the same species of
microorganisms were found on both sides. At about 4.8
mya, a land bridge was formed by the collision of the
Nazca and Caribbean plates. This cut off the two bodies
of water. From this time on, the salinity of water on both
sides has diverged. The land bridge isolates populations
of microorganisms, and a new species evolved on the
Pacific side.
Cha
pter
23
Inte
rnet
Inve
stig
atio
nName Date
82 Internet Investigations Guide Earth Science
When Were the Atlantic and Pacific OceansSeparated by Land?Use another sheet of paper if you need extra space to write complete answers.
ES2307
Pacific Caribbean
Sample Age Present Present # (mya) (Yes/No) (Yes/No)
1 6 No No
2 5.6 No No
3 5 No No
4 4.8 Yes No
5 4.3 Yes No
6 3.5 Yes No
Uni
t 8
Inte
rnet
Inve
stig
atio
n
●1 What biological findings have been reportedat the K-T boundary? The fossil record indicates that more than half of all
plants and animals living on Earth became extinct.
These include the dinosaurs, the pterosaurs, many
species of plants, and marine organisms such as the
ammonites, marine reptiles, and several species of
bivalves.
●2 What geological findings have been reportedat the K-T boundary?The K-T layer is characterized by the presence of
iridium, tektites, and shocked quartz.
●3 What is significant about the discovery ofiridium at the K-T boundary?The discovery of unusually high levels of iridium
suggests an extraterrestrial origin of the clay layer,
perhaps caused by an asteroid or a comet.
●4 What are the Deccan traps, and what theorydo they help support?The Deccan traps are large basalt flows that flooded
India 65 million years ago. They provide evidence that
intense volcanism may have contributed to widespread
environmental changes at the K-T boundary.
●5 How has discovery of the Chicxulub impactcrater shifted the debate?Most researchers now accept that an impact occurred 65
million years ago. Current research is still investigating
the mechanism by which such an impact could have
induced the types of losses recorded in the fossil record.
●6 Describe how Earth's systems might interactafter an asteroid impact. Refer to the Earth System Interactions listed in the
teacher's guide for this investigation.
●7 Write at least one question about massextinction that this investigation has raisedfor you.Answers will vary. Refer to the sample research
questions in the Questions for Discovery section of the
teacher's guide.
●8 How might you investigate this question? Answers will vary.
Name Date
106 Internet Investigations Guide Earth Science
Use another sheet of paper if you need extra space to write complete answers.
What Caused the Mass ExtinctionRecorded at the K-T Boundary?
ESU801