how are the kids doing? how do we know?*
TRANSCRIPT
June 10, 2009
HOW ARE THE KIDS DOING? HOW DO WE KNOW?*
Recent Trends in Child and Youth Well-Being in the United States
and Some International Comparisons
Kenneth C. Land, Duke University
Vicki L. Lamb, North Carolina Central University and Duke University
and Hui Zheng, Duke University
*Prepared for the International Conference on Human Development and the Environment: Advances in Quality of Life Studies, December 12-13, 2008. The Child and Youth Well-Being Index Project is supported by grants from the Foundation for Child Development. Address all correspondence to Kenneth C. Land, Center for Population Health and Aging and Department of Sociology, Duke University, Durham, NC 27708-0088, USA; email: [email protected]
2
HOW ARE THE KIDS DOING? HOW DO WE KNOW?
Recent Trends in Child and Youth Well-Being in the United States
and Some International Comparisons
Abstract
With a focus on the United States, this paper addresses the basic social indicators
question: How are we doing? More specifically, with respect to children, how are our
kids (including adolescents and youths) doing? These questions can be addressed by
comparisons: 1) to past historical values, 2) to other contemporaneous units (e.g.,
comparisons among subpopulations, states, regions, countries), or 3) to goals or other
externally established standards. The Child and Youth Well-Being Index (CWI), which
we have developed over the past decade, uses all three of these points of comparison.
The CWI is a composite index based on 28 social indicator time series of various aspects
of the well-being of children and youth in American society that date back to 1975, which
is used as a base year for measuring changes (improvements or deterioration) in
subsequent years. The CWI is evidence-based not only in the sense that it uses time
series of empirical data for its construction, but also because the 28 indicators are
grouped into seven domains of well-being or areas of social life that have been found to
define the conceptual space of the quality of life in numerous studies of subjective well-
being. Findings from research using the CWI reported in the paper include: (1) trends in
child and youth well-being in the United States over time, (2) international comparisons,
and (3) best-practice analyses.
3
HOW ARE THE KIDS DOING? HOW DO WE KNOW?
Recent Trends in Child and Youth Well-Being in the United States
and Some International Comparisons
Every generation of adults, and American adults in particular, is concerned about
the well-being of their children and youth (Moore 1999). From the stagflation and
socially turbulent days of the 1970s through the decline of the rust belt industries and
transition to the information age in the 1980s to the relatively prosperous e-economy and
multicultural years of the late-1990s followed by the economically uncertain and
politically anxious early years of the 21st century, Americans have fretted over the
material circumstances of the nation’s children, their health and safety, their educational
progress, and their moral development. Are their fears and concerns warranted? How do
we know whether circumstances of life for children in the United States are bad and
worsening, or good and improving? On what basis can the public and its leaders form
opinions and draw conclusions?
Since the 1960s, researchers in social indicators/quality-of-life measurement have
argued that well-measured and consistently collected social indicators provide a way to
monitor the condition of groups in society, including children and families, today and
over time (Land 2000). The information thus provided can be strategic in forming the
ways we think about important issues in our personal lives and the life of the nation.
Indicators of child and youth well-being, in particular, are used by child advocacy groups,
policy makers, researchers, the media, and service providers to serve a number of
purposes. In three instances:
4
� to describe the condition of children,
� to monitor or track child outcomes, and
� to set goals,
the use of indicators is well within the long-established “public enlightenment” function
of social indicators. And while there are notable gaps and inadequacies in existing child
and family well-being indicators in the United States (Ben-Arieh 2000; Moore 1999),
there also are literally dozens of data series and indicators from which to form opinions
and draw conclusions (see, e.g., Brown 1997).
THE BASIC SOCIAL INDICATORS QUESTIONS
The term social indicators was born and given its initial meaning in an attempt,
undertaken in the early 1960s by the American Academy of Arts and Sciences for the
National Aeronautics and Space Administration, to detect and anticipate the nature and
magnitude of the second-order consequences of the space program for American society
(Land 1983, p. 2; Noll and Zapf 1994, p. 1). Frustrated by the lack of sufficient data to
detect such effects and the absence of a systematic conceptual framework and
methodology for analysis, some of those involved in the Academy project attempted to
develop a system of social indicators with which to detect and anticipate social change as
well as to evaluate specific programs and determine their impact. The results of this part
of the Academy project were published in a volume bearing the name Social Indicators
and the following definition:
“… social indicators – statistics, statistical series, and all other forms of evidence

5
– that enable us to assess where we stand and are going with respect to our
values and goals…” (Bauer 1966, p. 1)
In brief, the basic social indicators question is: How are we doing? Focused more
specifically on children, the fundamental question is: How are our kids (including
adolescents and youths) doing? Land (2000) noted that social indicators approaches to
answering these questions have taken the form of comparisons:
� to past historical values,
� to other contemporaneous units (e.g., comparisons among subpopulations, states,
regions, countries), or
� to goals or other externally established standards.
These comparisons can be made for specific social indicators as well as for global or
composite well-being indices.
In addition, as Land, Lamb, Meadows, and Taylor (2007) noted, the traditions of
social indicators (Bauer 1966) and quality-of-life/subjective well-being research
(Andrews and Withey 1976; Campbell, Converse, and Rodgers 1976) initiated in the
1960s and 1970s, have led to two major lines of development over the past 30-plus years:
1) objective social indicators, and 2) subjective well-being indicators. Land et al. (2007)
then posed the question: Can the empirical findings from subjective well-being studies
about domains of well-being be used to inform the construction of summary quality-of-
life indices? In other words, rather than relying solely on the opinions of expert panels,
can we use the accumulated body of empirical findings from subjective well-being
studies in a manner similar to the use of research findings or best evidence to inform
decisions in clinical and public health in modern evidence-based medicine (see, e.g.,

6
Jenicek 2003)? The question thus is: Can subjective well-being studies be used to make
composite or summary quality-of-life indices more evidence-based not only in the use of
empirical data, but also in the selection of the domains of well-being and indicators used
in their construction? The work of Land et al. (2007; see also Land, Lamb, and Mustillo
2001; Land 2004; Meadows, Land, and Lamb 2005) on the development of a composite
index of child and youth well-being is illustrative of how this can be done.
THE CHILD AND YOUTH WELL-BEING INDEX
The Child and Youth Well-Being Index is:
� a composite measure of trends over time in the well-being of America’s children
and young people,
� that consists of several interrelated summary indices of annual time series of
numerous social indicators of the well-being of children and youth in the United
States.
The general objective of the CWI summary indices is to:
� give a sense of the overall direction of change in the well-being of children and
youth in the U.S. as compared to two base years, 1975 and 1985.
The CWI is designed to address questions such as the following:
� Overall, on average, how did child and youth well-being in the U.S. change in the
last quarter of the 20th century and beyond?
� Did it improve or deteriorate?
� By approximately how much?
7
� In which domains of social life?
� For specific age groups?
� For particular race/ethnic groups?
� For each of the sexes?
� And did race/ethnic group and sex disparities increase or decrease?
Methods of Construction
Annual time series data (from vital statistics and sample surveys) have been
assembled on some 28 national-level Key Indicators in seven quality-of-life domains:
• Family economic well-being,
• Health,
• Safety/behavioral concerns,
• Educational attainment (productive activity),
• Community connectedness (participation in schooling or work institutions),
• Social relationships (with family and peers), and
• Emotional/spiritual well-being.
With some variations in labels and content, these seven domains of quality of life have
been well-established as recurring time after time in over two decades of empirical
research in numerous subjective well-being studies (Cummins 1996, 1997). Furthermore,
while the model of subjective well-being and life satisfaction initially was developed on
samples of adults, it has been found to be applicable to children and adolescents aged
eight and above (Huebner 1997, 2004). And these seven domains of well-being also have
been found, in one form or another, in studies of the well-being of these younger persons.
8
The 28 Key Indicators used in the construction of the CWI are identified with
brief descriptions in Table 1. A full description and justification for the use of the Key
Indicators in the construction of the CWI is given in Land et al. (2001).
To calculate the CWI, each of the 28 time series of the Key Indicators is indexed
by a base year (1975 or 1985). The base year value of the indicator is assigned a value of
100 and subsequent values of the indicator are taken as percentage changes in the index.
The directions of the indicators are oriented so that a value greater (lesser) than 100 in
subsequent years means the social condition measured has improved (deteriorated). The
28 indexed Key Indicator time series are grouped into the seven domains of well-being
(as indicated in Table 1; for a full description of the Key Indicators and their groupings
into the seven domains, see Land et al. 2001) by equal weighting to compute the domain-
specific Index values for each year. The seven domain-specific Indices then are grouped
into an equally-weighted Child and Youth Well-Being Index value for each year. In the
absence of a set of unequal weights that achieves high consensus among the members of
a society, Hagerty and Land (2007) show that an equal-weighting strategy for
composite/summary indicators of well-being is privileged in the sense that it is a
minimax estimator – it minimizes extreme disagreements among all possible individuals’
weights.
Since it builds on the subjective well-being empirical research base in its
identification of domains of well-being to be measured and the assignment of Key
Indicators to the domains as well as in the use of empirical observations on the values of the indicators for each year, the CWI can be viewed as evidence-based well-being

9
Table 1. Twenty-Eight Key National Indicators of Child Well-Being in the United States. Family Economic Well-Being Domain
1. Poverty Rate (All Families with Children) 2. Secure Parental Employment Rate 3. Median Annual Income (All Families with Children) 4. Rate of Children with Health Insurance
Health Domain
1. Infant Mortality Rate 2. Low Birth Weight Rate 3. Mortality Rate (Ages 1-19) 4. Rate of Children with Very Good or Excellent Health (as reported by parents) 5. Rate of Children with Activity Limitations (as reported by parents) 6. Rate of Overweight Children and Adolescents (Ages 6-19)
Safety/Behavioral Domain
1. Teenage Birth Rate (Ages 10-17) 2. Rate of Violent Crime Victimization (Ages 12-19) 3. Rate of Violent Crime Offenders (Ages 12-17) 4. Rate of Cigarette Smoking (Grade 12) 5. Rate of Alcohol Drinking (Grade 12) 6. Rate of Illicit Drug Use (Grade 12)
Educational Attainment Domain
1. Reading Test Scores (Ages 9, 13, and 17) 2. Mathematics Test Scores (Ages 9, 13, and 17)
Community Connectedness
1. Rate of Persons who have Received a High School Diploma (Ages 18-24) 2. Rate of Youths Not Working and Not in School (Ages 16-19) 3. Rate of Pre-Kindergarten Enrollment (Ages 3-4) 4. Rate of Persons who have Received a Bachelor’s Degree (Ages 25-29) 5. Rate of Voting in Presidential Elections (Ages 18-20)
Social Relationships Domain
1. Rate of Children in Families Headed by a Single Parent 2. Rate of Children who have Moved within the Last Year (Ages 1-18)
Emotional/Spiritual Well-Being Domain:
1. Suicide Rate (Ages 10-19) 2. Rate of Weekly Religious Attendance (Grade 12) 3. Percent who Report Religion as Being Very Important (Grade 12)
Note: Unless otherwise noted, indicators refer to children ages 0-17.

10
measure of trends in averages of the social conditions encountered by children and youth
in the United States across recent decades.
SOME FINDINGS ON TRENDS IN CHILD AND YOUTH WELL-BEING
Some significant empirical findings regarding trends in child and youth well-
being in the United States across the past three decades are summarized in Figures 1 and
2. Figure 1 displays the overall composite CWI for the period 1975 to 2006 with
projections for 2007. Figure 2 shows the corresponding trends in the seven domain-
specific indices of well-being.
85
90
95
100
105
110
Per
cent
of B
ase
Yea
r
1975
1977
1979
1981
1983
1985
1987
1989
1991
1993
1995
1997
1999
2001
2003
2005
2007
Year
Figure 1: Child Well-Being Index, 1975-2006, with Projections for 2007
11
Figure 1 shows that:
� After an oscillating period of ups and downs in the late-1970s, child and youth
well-being in the U.S. went into a long “recession” from 1981 to 1994.
� This was followed by a “recovery” during the years 1994 to 2002.
� But improvements in the CWI essentially slowed and stalled in the early years of
this first decade of the 21st century.
In brief, construction and analysis of trends in child and youth well-being via the CWI
allowed us be the first to signal that the steady increases in numerous Key Indicators in
the period 1994-2002 were indicative not just of isolated trends, but rather of an overall
improvement in well-being (Land et al. 2001). More recently, the CWI allowed us to
signal that this trend of overall improvement has come to an end (Land et al. 2007).
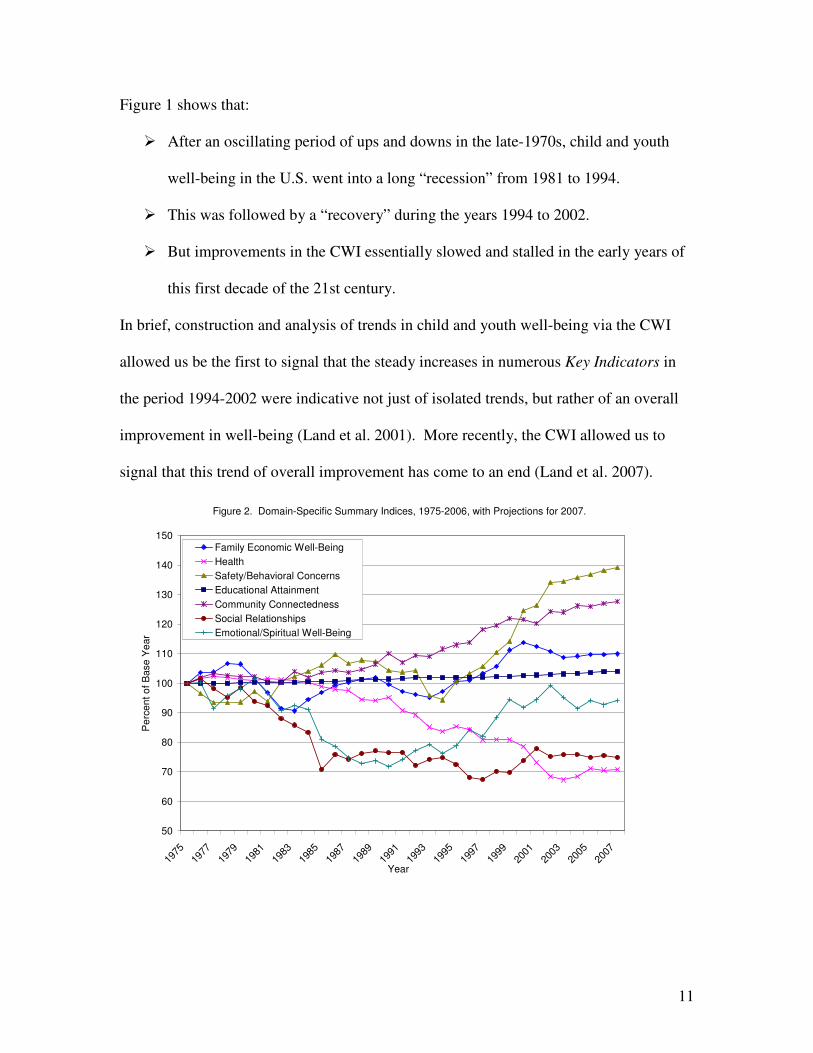
Figure 2. Domain-Specific Summary Indices, 1975-2006, with Projections for 2007.
50
60
70
80
90
100
110
120
130
140
150
1975
1977
1979
1981
1983
1985
1987
1989
1991
1993
1995
1997
1999
2001
2003
2005
2007
Year
Per
cent
of B
ase
Yea
r
Family Economic Well-BeingHealthSafety/Behavioral ConcernsEducational AttainmentCommunity ConnectednessSocial RelationshipsEmotional/Spiritual Well-Being

12
As noted earlier, the CWI is composed of seven quality-of-life domains that are
important indicators of the well-being of children and youths. Analysis of the trends,
shown in Figure 2, in the domain-specific indices that comprise the CWI have led to the
identification of:
� domains of well-being in which improvements have been dramatic over two
decades – safety/behavioral concerns and community connectedness/attachment
to community institutions;
� domains that have shown some improvements – family economic well-being and
educational attainments;
� one domain – emotional/spiritual well-being – that declined and then increased;
� and two domains that have deteriorated quite substantially – health and social
relationships.
The improvements in the safety/behavioral concerns are due to reductions in all of
the domain indicators. Students in the last year of high school were less likely to smoke
cigarettes, drink alcoholic beverages, or use illicit drugs. In addition, there has been a
reduction in both the commission of violent crimes and being victims of violent crimes,
and teen birth rates have declined. The community connectedness domain indictors have
improved in preschool attendance and the confirmation of baccalaureate degrees, and the
decline in teenagers who are not working or in school.
There are concerns about the overall declines in health and social relationships
domains. The health domain has been particularly affect by the increase in overweight
children. The 1975 rate doubled by 1989 and tripled by 2000. Fortunately it appears this
13
trend is leveling off with the most recent data. Social relationships have been affected by
the increase in the proportion of children in single parent households.
One domain that merits close attention is family economic well-being. There are
macroeconomic changes since 2005, especially for the years 2007 and 2008 (and likely
2009 as well) that could adversely affect the well-being of U.S. children and adolescents.
If this period of economic duress is sufficiently deep and long, it also will impact public
finances and, through that, publicly financed childcare, health, and education programs.
INDEX VALIDATION
The preceding section described the evidenced-based foundations for the Child
and Youth Well-Being Index. Not only does the CWI use empirical observations on the
values of the component indicators for each year in its computation, but the
theoretical/conceptual rationale for the Index is based on the subjective well-being
research literature. As noted, it is in this sense that the CWI can be viewed as evidence-
based well-being measure of trends in averages of the social conditions encountered by
children and youth in the United States across recent decades.
To fully support the claim that the CWI is an evidence-based measure of changes
in subjective well-being, it would, of course, be desirable to have at hand a more
complete database. Specifically, it would be preferable to have annual, nationally
representative sample survey-based responses by children and youth to questions
concerning life satisfaction and happiness with life overall as well as in the several
domains of well-being that have been identified in numerous studies over the years.

14
Changes in the CWI over time then could be compared to those in the subjective well-
being data in order to provide validating support for the former as a measure of the latter.
While such a database is not available, the Monitoring the Future (MTF) Survey
Project (Johnston, Bachman, O'Malley, and Schulenberg 2003), which began in 1975 as
the High School Senior Survey, provides a continuous time series of observations on the
subjective well-being of 12th graders that Land et al. (2007) used as a criterion against
which to validate the CWI. The MTF question (variables number V1652 in the MTF
codebook) is of the conventional global satisfaction with life form:
"How satisfied are you with your life as a whole these days?"
The answer range is a seven-point Likert rating scale: Completely Dissatisfied, Quite
Dissatisfied, Somewhat Dissatisfied, Neither Satisfied or Dissatisfied, Somewhat
Satisfied, Quite Satisfied, and Completely Satisfied. For comparisons with the CWI, we
first combined the last two response categories to compute the percent of the 12th graders
who respond that they either are Quite or Completely Satisfied in each year from 1975 to
2003.
In order to produce a graph of changes in the responses that reduces year-to-year
variability in the percents and shows the main directions of changes over time, Land et al.
(2007) used a moving-average statistical procedure. Specifically, a three-point moving
average was applied two times to the MTF life satisfaction data series. The resulting
smoothed series is plotted in Figure 3 alongside the composite CWI with the scale for the
CWI series on the left margin and that for the smoothed MTF life satisfaction responses
on the right.
15
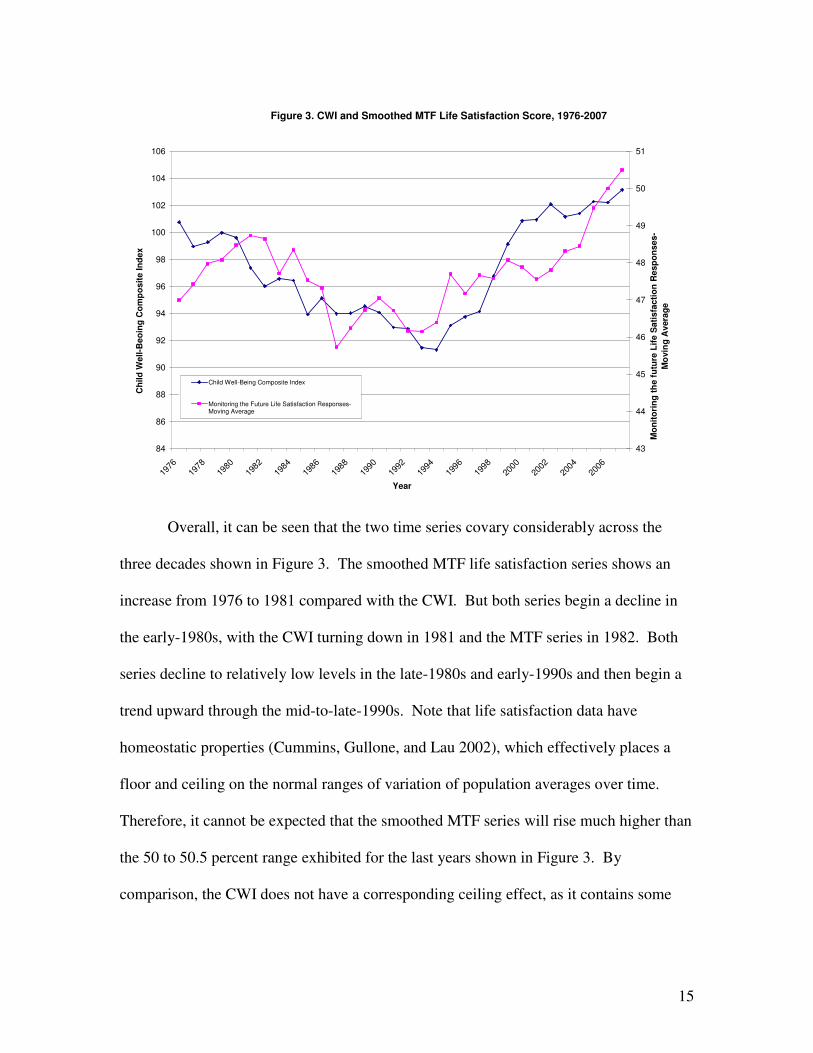
Figure 3. CWI and Smoothed MTF Life Satisfaction Score, 1976-2007
84
86
88
90
92
94
96
98
100
102
104
106
1976
1978
1980
1982
1984
1986
1988
1990
1992
1994
1996
1998
2000
2002
2004
2006
Year
Chi
ld W
ell-B
eoin
g C
omp
osite
Inde
x
43
44
45
46
47
48
49
50
51
Mon
itori
ng th
e fu
ture
Life
Sat
isfa
ctio
n R
espo
nses
-M
ovi
ng
Ave
rage
Child Well-Being Composite Index
Monitoring the Future Life Satisfaction Responses-Moving Average
Overall, it can be seen that the two time series covary considerably across the
three decades shown in Figure 3. The smoothed MTF life satisfaction series shows an
increase from 1976 to 1981 compared with the CWI. But both series begin a decline in
the early-1980s, with the CWI turning down in 1981 and the MTF series in 1982. Both
series decline to relatively low levels in the late-1980s and early-1990s and then begin a
trend upward through the mid-to-late-1990s. Note that life satisfaction data have
homeostatic properties (Cummins, Gullone, and Lau 2002), which effectively places a
floor and ceiling on the normal ranges of variation of population averages over time.
Therefore, it cannot be expected that the smoothed MTF series will rise much higher than
the 50 to 50.5 percent range exhibited for the last years shown in Figure 3. By
comparison, the CWI does not have a corresponding ceiling effect, as it contains some
16
indicators such as the median family income of families with children ages 0 to 17 that
potentially can continue to rise indefinitely.
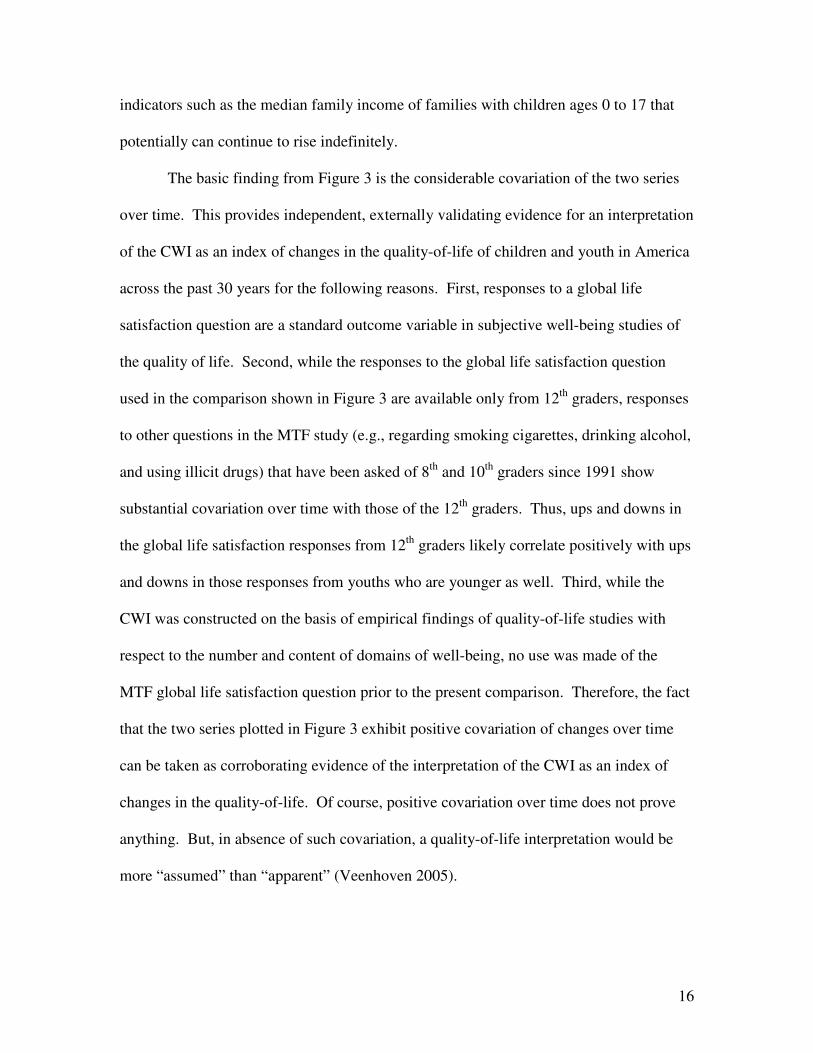
The basic finding from Figure 3 is the considerable covariation of the two series
over time. This provides independent, externally validating evidence for an interpretation
of the CWI as an index of changes in the quality-of-life of children and youth in America
across the past 30 years for the following reasons. First, responses to a global life
satisfaction question are a standard outcome variable in subjective well-being studies of
the quality of life. Second, while the responses to the global life satisfaction question
used in the comparison shown in Figure 3 are available only from 12th graders, responses
to other questions in the MTF study (e.g., regarding smoking cigarettes, drinking alcohol,
and using illicit drugs) that have been asked of 8th and 10th graders since 1991 show
substantial covariation over time with those of the 12th graders. Thus, ups and downs in
the global life satisfaction responses from 12th graders likely correlate positively with ups
and downs in those responses from youths who are younger as well. Third, while the
CWI was constructed on the basis of empirical findings of quality-of-life studies with
respect to the number and content of domains of well-being, no use was made of the
MTF global life satisfaction question prior to the present comparison. Therefore, the fact
that the two series plotted in Figure 3 exhibit positive covariation of changes over time
can be taken as corroborating evidence of the interpretation of the CWI as an index of
changes in the quality-of-life. Of course, positive covariation over time does not prove
anything. But, in absence of such covariation, a quality-of-life interpretation would be
more “assumed” than “apparent” (Veenhoven 2005).

17
SOME INTERNATIONAL COMPARISONS
In brief, the CWI rests on conceptual foundations that are based on over three
decades of research on subjective well-being. Its compilation and analysis leads to a
number of substantive insights into trends in child and youth well-being in the United
States over the three decades from the mid-1970s to the early 2000s. And the CWI
shows some degree of external validation in the sense that trends therein are consistent
with the limited time series data available on trends in the subjective well-being of
America’s adolescents. But the question remains: How well are America’s children and
youth doing in recent years as compared to the children and youth of other nations?
To address this question, we compare U.S. data on a number of child and youth
well-being indicators with those of four other English-speaking counties, specifically:
Australia, Canada, New Zealand, and the United Kingdom. These four nations were
chosen for comparison with the United States for a number of reasons:
� all share a common language;
� Australia, Canada, New Zealand, and the U.S. are former colonies of the United
Kingdom;
� all five nations are liberal democracies that have representative democratic forms
of government;
� all five also place considerable emphasis on the use of economic markets for the
production and distribution of goods and services; and
� because of all the above, all share some common elements of culture.

18
To compare these five nations with respect to measures of child and youth well-being, we
assembled data on 19 Key International Indicators that were measured around the year
Table 2. Comparison of Child and Youth Well-Being in US and Four English Speaking Countries: Canada, UK, Australia and New Zealand Countries Domains
Canada
United
Kingdom
Australia
New
Zealand 1/2 1/2 1/2 1/2 W W W W
Family Economic Well-Being • Poverty Rate: All Children (Age 0-17) • Percentage of Working Age Households
with Children Without An Employed Parent
B B B B
0/1 1/1 0/1 Social Relationships • Percent of All Children Ages 0-17
Living in Single Mother Families W B W
0/5 1/5 0/3 0/3 W = W W W W W W W W W = W W
Health • Low Birth Weight • Infant Mortality • Child and Youth Mortality (Age 1-19) • Overweight (Age 13 and 15) • Self rated "poor or fair health" (Age
11, 13 and 15 ) W B
3/4 3/4 0/1 0/1 W W W W B B B B
Safety and Behavior
• Teenage Birth Rate (Age 15-19) • Smoking Daily (Age 11, 13, and 15) • Drunk Twice or More (Age 11, 13, and
15) • Having Used Cannabis (Age 15)
B B
0/2 0/2 0/2 0/2 W W W W
Educational Attainment • Reading (Age 15) • Math (Age 15) W W W W
2/4 3/4 3/4 2/3 = B B B = B W B B B B
Community Connectedness • High School Completion (Age 25-34) • Not Working or In School (Age 15-19) • Bachelor’s Degree (Age 25-34) • Preschool Enrollment Rate (Age 3-4) B W B W
1/1 0/1 1/1 1/1 Emotional Well Being • Suicide Rate (Age 15-24) B W B B
Overall Tally 7/19 9/19 5/14 4/12

19
2000. The 19 Key International Indicators can be classified into the seven domains of
well-being used in the CWI.
Table 2 presents a “report card” comparison of child and youth well-being by
domain for the United States and the four English-speaking countries. The table identifies
the specific indicators used within each domain. The B [W] indicates the rates for the
U.S. are better [worse] than for the comparison country. An = means the rates are
equal. A blank cell indicates no country-level Key International Indicator was
available. The tallies for each domain of well-being and the overall tally at the bottom of
the table give the numbers of indicators for each country for which the U.S. values are
better. Thus, the overall tallies show that the U.S. does better on 9 of 19 indicators in
comparison with the United Kingdom, 7 of 19 for Canada, 4 of 14 for Australia, and 4 of
12 for New Zealand.
Table 3 presents a different perspective on these international comparisons that
takes into account the ordinal positions of the countries on the indicators. It presents a
summary of the relative ranking of the five Anglophone countries based on each of the
seven child and youth well-being domains and indicators. The domain-specific rankings
are based on the averages of the rankings of the indicators within each domain. They
range from ‘1’, the highest ranking of child well-being, down to ‘5’ (or ‘4’ for social
relationships), which indicates the lowest ranking among the five countries. Two
composite rankings for each country are given at the bottom of the table: 1) the average
rank across the seven domains, and 2) the average rank across all 19 indicators (or as
many as are available). Both on the basis of average ranks across the domains and the
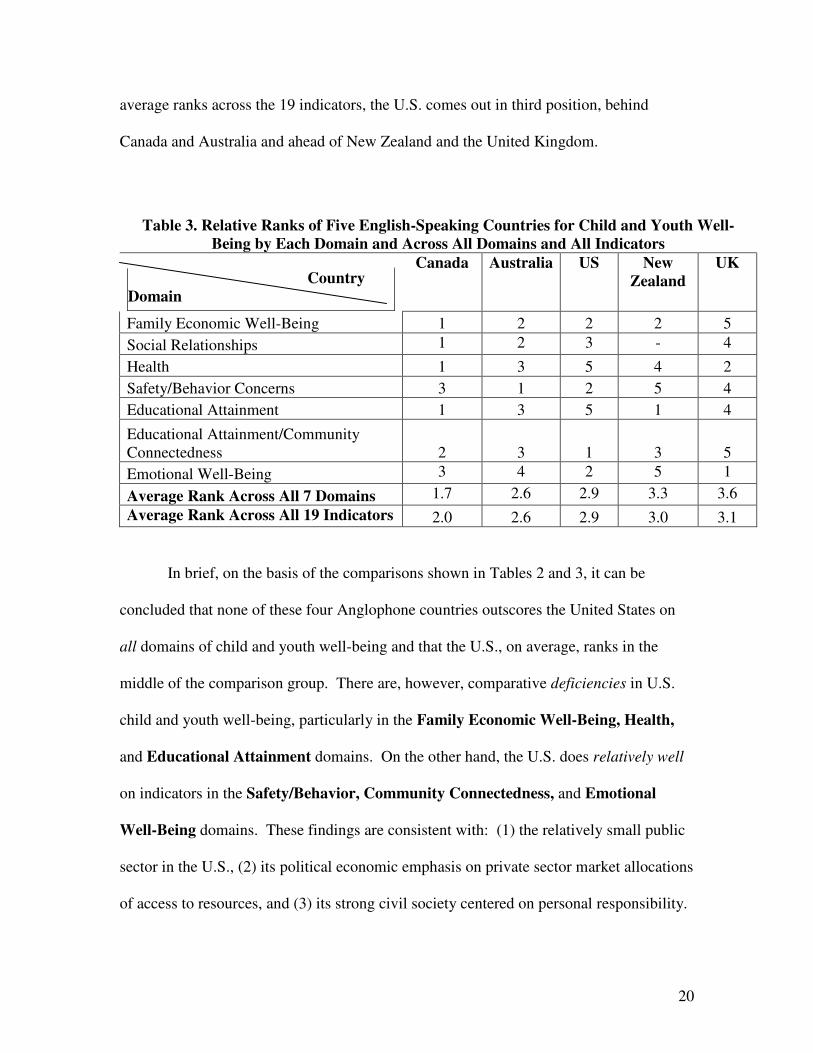
20
average ranks across the 19 indicators, the U.S. comes out in third position, behind
Canada and Australia and ahead of New Zealand and the United Kingdom.
Table 3. Relative Ranks of Five English-Speaking Countries for Child and Youth Well-Being by Each Domain and Across All Domains and All Indicators
Country Domain
Canada Australia US New Zealand
UK
Family Economic Well-Being 1 2 2 2 5 Social Relationships 1 2 3 - 4
Health 1 3 5 4 2 Safety/Behavior Concerns 3 1 2 5 4 Educational Attainment 1 3 5 1 4
Educational Attainment/Community Connectedness 2 3 1 3 5 Emotional Well-Being 3 4 2 5 1
Average Rank Across All 7 Domains 1.7 2.6 2.9 3.3 3.6 Average Rank Across All 19 Indicators 2.0 2.6 2.9 3.0 3.1
In brief, on the basis of the comparisons shown in Tables 2 and 3, it can be
concluded that none of these four Anglophone countries outscores the United States on
all domains of child and youth well-being and that the U.S., on average, ranks in the
middle of the comparison group. There are, however, comparative deficiencies in U.S.
child and youth well-being, particularly in the Family Economic Well-Being, Health,
and Educational Attainment domains. On the other hand, the U.S. does relatively well
on indicators in the Safety/Behavior, Community Connectedness, and Emotional
Well-Being domains. These findings are consistent with: (1) the relatively small public
sector in the U.S., (2) its political economic emphasis on private sector market allocations
of access to resources, and (3) its strong civil society centered on personal responsibility.
21
To further interpret these findings, the work of Epseng-Andersen (1990) can be
invoked. In a statistical analysis of characteristics of countries, he created a model of
three worlds of welfare capitalism: Liberalism, Conservatism, and Socialism. In this
classification, Liberal States were characterized by relief for the poor with strict
entitlement rules, and private pensions in old age. All of the five countries in our study
scored low on the Conservatism scale, which is characterized by the maintenance of
traditional levels of power and stratification. Socialist States had universalism and/or
egalitarianism traits. Australia, Canada, New Zealand, and the United Kingdom received
medium scores in the Socialism scale, whereas the United States scored low due to
having few universal welfare plans.
All of these characteristics are consistent with the findings reported above
concerning those domains of child well-being in which the U.S. scores relatively well
compared to the other Anglophone countries – Safety/Behavior, Community
Connectedness, and Emotional Well-Being – domains in which non-public sector
initiatives by families, religious, and civil society groups can be effective in producing
positive outcomes as well as findings concerning those domains in which the U.S. scores
relatively poorly – Family Economic Well-Being, Health, and Educational Attainment –
domains in which the role of the public sector is relatively more important. Indeed,
Epseng-Andersen’s ranking of states by Degree of Liberalism shows the following
ordering of the five nations considered here from highest to lowest: Australia, Canada,
United States, United Kingdom, and New Zealand. This ordering is very similar to that
based on the average ranks in Table 3.

22
BEST PRACTICE ANALYSES
As noted earlier, the basic social indicators question of how are we doing can be
answered in three ways. In addition to comparisons with how we are doing in
comparison to the past and in comparison to other countries or social units, we can
address this question in terms of comparisons to goals or other externally-constructed
standards. There is no “gold standard” for indictors of child and youth well-being, thus it
may be difficult to evaluate the numerical values in the CWI. Because the metric of a
composite index like the CWI is somewhat arbitrary, it is impossible to know how to
interpret its numerical values. That is, for example, with recent values of the CWI just
above 100, the question remains as to whether the index could be much larger.
An externally-constructed standard that we have used for the CWI (Land et al.
2001) is a “best practice” standard, where best practice refers either to the
� “best historical value” of each indicator ever observed in the U.S., (or the goals
for Health 2010) or to the
� “best internationally observed” value of each indicator among countries for which
data on the indicator are available.
The intent is to see how much improvement could be gained if the “best” values could
occur compared with the 1975 base year values. Recent calculations of the best values the
CWI would obtain if all of the 28 indicators were at their best values are:
� 126.53 for historical best-practice U.S. values, and
� 147.36 for international best-practice values.

23
These best-practice values of the CWI indicate that, as compared to recent CWI
values just over 100, the CWI could be approximately 25 percent higher if all of the 28
indicators in the Index were at their best values ever recorded in the U.S. The
international best-practice value is an even more stringent external standard by which to
assess recent levels of the CWI. This is due to the fact that no nation is at the best
internationally observed valued on all 28 indicators. At the same time, however, it
presents an extremely exacting criterion by which to assess the recent performance of the
CWI in the sense that it indicates that, if the U.S. were at the best internationally
observed values on all 28 indicators in the Index, then it recent values would be close to
50 percent higher than they have been. Suffice it to say that by either external standard
there remains much room for improvement in child and youth well-being in the U.S.
DISCUSSION AND CONCLUSIONS
The Child Well-Being Index is a useful tool for examining the well-being of
children and youth and has been used in a variety of ways to examine this topic. In
addition to the work described in this paper, other topics have been explored. We have
focused on gender differences and disparities in CWI (Meadows et al., 2005) and found
that both boys and girls well-being had improved since 1985 and that their disparities had
decreased. Both girls and boys had domains in which they excelled and domains in
which there needs to be improvement. Hernandez and Macartney (2008) examined racial
and ethnic-specific well-being indices as well as disparities. Black, white, and Hispanic
CWIs increased between 1985 and 2004, however there were great black-white and
24
Hispanic-white disparities over that period. Fortunately, both sets of disparities were
decreasing by the end of the period under study.
The overall CWI uses indicators that date back to 1975. New indicators,
particularly tapping well-being domains of younger children, have been developed since
that time. We have created an expanded CWI (Land et al., 2007), which incorporated
more recent indicators. The trends were very similar to that of the original CWI. Other
uses of the CWI can be to compare the well-being of age groups or to focus on a
particular geographical area or the 50 United States (O’Hare and Lamb, 2004).
In sum, this paper commenced with the basic social indicators question: How are
the kids doing? It has described the approach taken to answering this question in the
work we have done on the Child and Youth Well-Being Index and its empirical
applications to the United States. The following overall conclusions are based on these
analyses:
• Trends: The composite CWI revealed a substantial recession in overall child and
youth well-being in the late-1980s and early-1990s. This was followed by
substantial improvements in the 1994 to 2002 period to levels just above those of
a generation ago. Since 2002, the CWI indicates a period of stagnation-slight
decline in well-being.
• International Comparisons: Among English-speaking nations, child well-being
in the U.S. appears to be in the middle of the pack—ahead of New Zealand and
the U.K. but behind Canada and Australia.
• Best-Practice Analyses: These show that there is much room for additional gains
in the well-being of America’s children and youth.

25

26
References
Andrews, Frank M. and Stephen B. Withey. 1976. Social Indicators of Well-Being:
Americans’ Perceptions of Life Quality. New York: Plenum.
Bauer, Raymond A., ed. 1966. Social Indicators. Cambridge, Mass.: MIT Press.
Ben-Arieh, Asher. 2000. “Beyond Welfare: Measuring and Monitoring the State of
Children – New Trends and Domains.” Social Indicators Research 52:235-257.
Brown, Brett V. 1997. “Indicators of Children’s Well-Being: A Review of Current
Indicators Based on Data from the Federal Statistical System.” In Indicators of
Children’s Well-Being edited by R. M. Hauser, B. V. Brown, and W. R. Prosser New
York: Russell Sage Foundation.
Campbell, Angus, Philip E. Converse, and Willard L. Rodgers. 1976. The Quality of
American Life: Perceptions, Evaluations, and Satisfactions. New York: Russell Sage
Foundation.
Cummins, Robert A. 1996. “The Domains of Life Satisfaction: An Attempt to Order
Chaos.” Social Indicators Research 38:303-328.
_______. 1997. “Assessing Quality of Life.” In Quality of Life for Handicapped People
edited by R. I. Brown. London: Chapman & Hall.
Cummins, Robert A., Eleonora Gullone, and Anna L. D. Lau. 2002. “A Model of
Subjective Well-Being Homeostasis: The Role of Personality.” Pp. 7-46 in The
Universality of Subjective Wellbeing Indicators edited by Eleonora Gullone and
Robert A. Cummins. Boston: Kluwer.

27
Epsing-Andersen, Gosta. 1990. The Three Worlds of Welfare Capitalism. Princeton, N.J.:
Princeton University Press.
Hagerty, Michael R. and Kenneth C. Land. 2007. “Constructing Summary Indices of
Quality of Life: A Model for the Effect of Heterogeneous Importance Weights.”
Sociological Methods and Research 35: (May):455-496.
Hernandez, Donald J. and Suzanne E. Macartney. 2008. "Child Well-Being 1985-2004:
Black-White and Hispanic-White Gaps Narrowing, but Persist." Report presented at
the New America Foundation, Washington, DC, January 29, 2008.
Huebner, E. Scott. 1991. “Correlates of Life Satisfaction in Children.” School
Psychology Quarterly 6:103-111.
_______. 1997. “Life Satisfaction and Happiness.” Pp. 271-278 in Children’s Needs II:
Development, Problems, and Alternatives edited by G. G. Bear, K. M. Minke, and A.
Thomas. Bethesda, MD: National Association of School Psychologists.
_______. 2004. “Research on Assessment of Life Satisfaction of Children and
Adolescents.” Social Indicators Research 66:3-33.
Janicek, Milos. 2003. Foundations of Evidence-Based Medicine. New York:
Parthenon/CRC Press.
Johnston, Lloyd D., Jerald G. Bachman, Patrick M. O'Malley, and John E. Schulenberg.
2003. Monitoring The Future: A Continuing Study Of American Youth (12TH-
GRADE SURVEY), 2003 [Computer file]. Conducted by University of Michigan,
Institute for Social Research, Survey Research Center. ICPSR ed. Ann Arbor, MI:
Inter-university Consortium for Political and Social Research [producer and
distributor], 2004.

28
Land, Kenneth C. 1983. “Social Indicators.” Annual Review of Sociology 9:1-26.
________. 2000. “Social Indicators.” Pp. 2682-2690 in Encyclopedia of Sociology
edited by Edgar F. Borgatta and Rhonda V. Montgomery. Revised Edition. New
York: Macmillan.
_______. 2004. “An Evidence-Based Approach to the Construction of Summary
Quality-Of-Life Indices.” Pp. 107-124 in Challenges for Quality of Life in the
Contemporary World edited by Wolfgang Glatzer, Susanne von Below, and Matthias
Stoffregen. New York: Springer.
Land, Kenneth C., Vicki L. Lamb, and Sarah Kahler Mustillo. 2001. “Child and Youth
Well-Being in the United States, 1975-1998: Some Findings from a New Index.”
Social Indicators Research 56:241-320.
Land, Kenneth C., Vicki L. Lamb, Sarah O. Meadows, and Ashley Taylor. 2007.
“Measuring Trends in Child Well-Being: An Evidence-Based Approach,” Social
Indicators Research, 80(January):105-132.
Meadows, Sarah O., Kenneth C. Land, and Vicki L. Lamb. 2005. “Assessing Gilligan
Versus Sommers: Gender-Specific Trends in Child and Youth Well-Being in the
United States, 1985-2001.” Social Indicators Research 70:1-52.
Moore, Kristen A. 1999. “Indicators of Child and Family Well-Being: The Good, the
Bad, and the Ugly.” Bethesda, MD: National Institutes of Health, Office of
Behavioral and Social Sciences, 1999 Seminar Series.
Noll, Heinz-Herbert and Wolfgang Zapf. 1994. “Social Indicators Research: Societal
Monitoring and Social Reporting.” In I. Borg and P. P. Mohler, eds., Trends and
Perspectives in Empirical Social Research. New York: Walter de Gruyter.
29
O’Hare, William P. and Vicki L. Lamb. 2004. Ranking States Based on Improvement in
Child Well-Being During the 1990s. KIDS COUNT Working Paper. Annie E. Casey
Foundation.
Veenhoven, Ruut. 2005. “Apparent Quality-of-Life in Nations: How Long and Happy
People Live.” Social Indicators Researc71:61-86.