how bad were british prison hulks in the napoleonic wars ... · the revolutionary and napoleonic...
TRANSCRIPT
Economic History Working Papers
No: 232/2016
Economic History Department, London School of Economics and Political Science, Houghton Street, London, WC2A 2AE, London, UK. T: +44 (0) 20 7955 7084. F: +44 (0) 20 7955 7730
How bad were British prison hulks in the Napoleonic wars? Evidence
from captured Danish and Norwegian seamen
Tim Leunig London School of Economics
Jelle van Lottum
University of Birmingham
Bo Poulsen
Aalborg University
LONDON SCHOOL OF ECONOMICS AND POLITICAL SCIENCE
DEPARTMENT OF ECONOMIC HISTORY
WORKING PAPERS
NO. 232- JANUARY 2016
How bad were British prison hulks in the Napoleonic wars?
Evidence from captured Danish and Norwegian seamen
Tim Leunig London School of Economics
Jelle van Lottum
University of Birmingham
Bo Poulsen Aalborg University
Abstract
This article uses a novel data source to test whether British Napoleonic prison hulks were as bad as many claim, and whether they were perceived to be bad by seamen who risked ending up in them. We find that they were not so bad: death rates of imprisoned Danish and Norwegian seamen were low. We test the perceptions of seamen by seeing whether those with the most options in the labour market (tall people) continued to choose to go to sea after war was declared. We find that they do. We therefore conclude that Danish and Norwegian seamen were not scared of the British Navy or British prison hulks, and that they were right not to be scared. We also provide the first modern estimates for the change in heights over time in Denmark and Norway, finding no change in living standards for those born from 1720 to 1800.
JEL Codes: N01, N34, C59.
1
How bad were British prison hulks in the Napoleonic wars? Evidence from captured
Danish and Norwegian seamen
Tim Leunig (London School of Economics, UK), Jelle van Lottum (University of Birmingham,
UK), Bo Poulsen (Aalborg University, DK)
Abstract
This article uses a novel data source to test whether British Napoleonic prison hulks were as
bad as many claim, and whether they were perceived to be bad by seamen who risked ending
up in them. We find that they were not so bad: death rates of imprisoned Danish and
Norwegian seamen were low. We test the perceptions of seamen by seeing whether those with
the most options in the labour market (tall people) continued to choose to go to sea after war
was declared. We find that they do. We therefore conclude that Danish and Norwegian seamen
were not scared of the British Navy or British prison hulks, and that they were right not to be
scared. We also provide the first modern estimates for the change in heights over time in
Denmark and Norway, finding no change in living standards for those born from 1720 to 1800.
I
The Revolutionary and Napoleonic wars lasted from 1792 until 1815, with a year of peace in
the middle, following the Treaty of Amiens. These were major wars, pitting the French against
various coalitions. The wars were larger in many senses than even the major conflicts that had
gone before. The armies were larger than ever before – the French army, for example, peaked
at 2,500,000 soldiers.1 The French also introduced universal conscription, whereby all men of a
certain age were liable to be called up.2 The extension of the state into all aspects of life took
different forms in different places. In Britain, for example, conscription was not introduced, but
taxes and borrowing rose to unprecedented levels. British national debt rose to be more than
twice national income, and that money was used to finance the navy, as well as her Austrian
and Russian allies.3 Whether by conscription or taxation, the war touched far more families
than earlier wars, and proved surprisingly popular. Nationalism and militarism became
1 Kennedy, Rise and Fall, pp. 128-9.
2 Stoker et al., ed., Conscription in the Napoleonic Era.
3 Roger Knight, Britain Against Napoleon.
2
common, and sowed the seeds for the creation of nation states such as Germany and Italy, and
for future major conflicts culminating in two world wars.4
These were wars in which many were captured. Hundreds of thousands were captured
by Napoleon’s lightning strikes into Italy, Prussia and ultimately Russia, and conversely
hundreds of thousands of French soldiers and seamen (most of them ordinary sailors) fell into
the hands of their adversaries. There were, for example, over 100,000 French prisoners of war
in England alone.5 Being captured was a potentially nasty experience. The 1648 Peace of
Westphalia established the principle that prisoners of war should be released without ransom
and allowed to return to their home country at the end of a war. In contrast, the conventions
covering the treatment of prisoners of war are twentieth century creations. The exception was
the tradition of ‘parole’, whereby officers would surrender their swords and be allowed to live
in the community, rather than in prison. In some cases they were allowed to return to their
country, having pledged not to take up arms for the duration of the war.
In this context it would seem rational to try to avoid capture, most obviously by taking
a job that kept you out of the way of foreign forces. Avoiding joining the army itself would be
the most obvious action, albeit one not available to the French. But there are other professions
that increase your chance of coming into contact with a foreign power. One such is going to
sea, whether on a military or merchant vessel. This is an era in which all powers captured
enemy ships of all sorts, encouraged by a system of ‘prizes’ which could make a captain a rich
man.
This article looks at whether people did try to avoid professions in which capture was
possible. In particular, it asks whether Danish and Norwegian seamen opted for alternative
careers once Britain declared war on their countries, opening up the possibility that they could
be captured on the high seas. It also uses the same evidence base to answer two other
questions. First, was the standard of living improving for those born between the 1720s and the
end of the eighteenth century in these two places? And second, just how bad was it to be
captured by the British in the Napoleonic Wars?
The article proceeds as follows. We begin with a brief history of Denmark and Norway,
noting why Britain decided to attack, and setting out what happened to prisoners. We then go
on to explain how anthropometric history can be used to answer our questions of interest. Next
we describe our data, and show that it is fit for purpose. We then analyse it, answering three
distinct questions. First we set out the implications for the standard of living for those born at
4 Bell, The First Total War.
5 Daly, ‘Napoleon’s Lost Legions’.
3
different points in the eighteenth century. Second, we assess whether seamen were scared of
being captured. And finally we use death rates in the prison hulks to assess whether they
should have been scared of capture.
II
Eighteenth century Danish Kings presided over a surprisingly far reaching empire. From his
capital in Copenhagen, the king could look north to Norway, the Faroe Islands, Iceland and
Greenland, west to the Danish West Indies, east to Tranquebar in India, and south not only to
Schleswig-Holstein, but also to a small section of present day Ghana. Denmark and Norway
constituted the core of the empire, and were economically well-integrated, with Denmark
producing grain, and Norway timber and fish. This in turn required a substantial maritime
sector, shipping goods back and forth across the Skagerrak and Kattegat seas. The absence of
warfare in the Baltic after 1720 ushered in a period of economic stability. Following the
outbreak of the revolutionary wars, the neutral Danish-Norwegian state experienced an
unprecedented economic boom. Freight rates soared and Denmark successfully traded with
everyone, supported by the Danish navy upholding a policy of armed neutrality.
The French conquest of Prussia led England to fear that Denmark – and with it sea
access to the Baltic, crucial for grain and timber – would fall to Napoleon. The British offered
Denmark an alliance, and Napoleon threatened to invade unless Denmark joined the alliance
against England. The Danes did neither, and England attacked. The two countries remained
formally at war until 1814.
The state of war meant that British ships could and did seize Danish military and
mercantile shipping over the following seven years. British ship commanders had an incentive
to capture vessels, owing to the ‘prize rules’ which made them and their crew rich from the
value of the captured ships. These rules were detailed and well known.6 The effects were
particularly problematic for the Norwegians, who depended on shipments of Danish grain for
survival. Norwegian historiography sees the war years 1807-1814 as uniquely bad, with people
starving in some areas. By 1830, army recruits were shorter than had hitherto been the case,
with height deficits strongest among cottagers in imported grain dependent areas.7 Similarly,
the Danish-Norwegian king issued 574 privateer licences to those wishing to capture British
vessels, who employed almost 9,000 men in total in this era. These small gun boats could
6 Petrie, The prize game.
7 Kiil, Stature and Growth of Norwegian Men, pp. 126-135.
4
easily capture a lone British merchant ship, but convoys of merchant ships were much safer. 8
A Danish privateer’s crew could become very rich if successful, but took not only the regular
risks of the sea, but also the risk of death or capture and imprisonment.9
Capture of a ship by the British involved capture of a crew, who became Prisoners of
War. In this era, Prisoners of War held in Britain were the responsibility of the Admiralty
Transport Office. The system was bureaucratic and highly regulated. At the top were the
Commissioners, characterised by one British historian as ‘firm but fair’.10
More or less all
Danish and Norwegian prisoners were held on prison ships, commonly known as ‘hulks’.11
Prison ships were each commanded by a lieutenant and had a standard complement of staff.
These were mainly Royal Marines, many recruited from among the prisoners of war.12
All
ships had a surgeon, who was also responsible for inspecting food, sanitary conditions, and
ensuring sufficient clothing, blankets, etc.13
Prison ships were usually stationed in groups, with
at least one hospital ship per group.14
Captured naval surgeons usually volunteered to act as
surgeons in the prisons. The Transport Office ensured that medical knowledge was shared
across sites, so that, for example, successful approaches to treating pneumonia in Stapleton
Prison were passed to all prisons in 1807.15
For all that, there would have been variation in the
ability and diligence of surgeons in attending to their duties.16
Whatever their defects,
conditions were clearly far superior to those of Spanish prison hulks: only 1 in 7 of General
Dupont’s troops who capitulated to the Spanish in 1808 survived 18 months.17
Prisons had formal rights to form committees to monitor food and other basics.18
Physical punishment of prisoners was discouraged,19
although those who killed another
prisoner would be subject to the full force of standard English Law. In contrast Marines
guarding prisoners were subject to physical punishment, in line with standard Naval
approaches to discipline.
Rations were good, at least on paper. Each week a prisoner was entitled to 2.5lbs of
beef (just over 1kg) and 2lb of fish (just under 1kg). This was supplemented by 10.5 lbs of
bread, 2lbs of potatoes, 2.5lbs of cabbage, as well as smaller amounts of scotch barley, onions,
8 Bloksgaard, ’Kapervæsenet’; Feldbæk, Dansk Søfartshistorie.
9 Bloksgaard, ’Kapervæsenet’.
10 Chamberlain, Hell upon water, p. 31.
11 Ibid., pp. 58-60, 81.
12 Ibid., p. 45.
13 TNA, ADM 104/8 and ADM 88/261 quoted in Chamberlain, Hell upon water, pp. 33-4.
14 TNA, ADM105/44, quoted in Chamberlain, p. 34.
15 TNA, ADM 105/44, quoted in Chamberlain, Hell upon water, p. 31.
16 Chamberlain, Hell upon water, p. 68.
17 The Pescott Frost Collection, volume 1, p. 61, quoted in Chamberlain, p. 69.
18 TNA ADM 105/44, Chamberlain, Hell upon water, p. 38.
19 TNA ADM 98/229, Chamberlain, Hell upon water, p. 44.
5
and salt. They were also given 14 pints (8 litres) of beer.20
Prisoners frequently complained
about the quality and quantity of food, but eating meat or fish every day would not have been
routine for the general population in England, Denmark or Norway in this era. Mutton bones
were often carved, and sold locally to raise money to buy food or other items. Prisoners were
also given a hammock, palliasse, blanket, jacket, waistcoat, trousers, two shirts, one pair of
stocking and a hat. All were bright yellow, to make both escape and sale harder.21
The experience of such prisoners is an important part of Norwegian self-identity. For
example, Henrik Ibsen’s 1862 poem, Terje Vigen, tells the story of Vigen, who rowed to
Denmark to buy grain for his starving wife and young child, only to be captured and thrown
into a prison hulk. When he returns, crooked and with grey hair, he find that his wife and child
are both dead and that he is forgotten. He takes a job as a pilot and one day he rescues an
English yacht. The captain recognizes Terje as the man he had captured in the war. Vigen
threatens to take revenge and kill the English captain and his family, but changes his mind and
forgives them.22
The focus on the deeds of the privateers, heroic and otherwise, also feature
heavily in Kay Larsen’s book on Danish privateers.23
Other commentators have followed a more biographical approach, and have focused on
the differences in conditions for officers and common sailors. Feldbæk, for example, tells the
story of skipper Chresten Hansen Mikkelsen, who sketched his cell.24
This showed him to have
fine clothes, decent cutlery, decorative sketches on the walls and even a teapot. An umbrella
suggests that he went outside fairly often. This is in stark contrast with conditions for
imprisoned common sailors, for whom conditions were characterised by one Norwegian writer
as ‘suffering, hunger, assaults from wardens, illnesses, crowdedness, idleness and longing.’25
Bloksgaard’s recent work notes that the English treated the privateers less favourably than
other sailors, seeing them as dishonourable.26
That said, even critics note that many inmates
learned to read and write in English, were taught navigation or learned a craft, while charitable
funds collected in Denmark were successfully distributed to prisoners.27
Around a third of
those captured ‘escaped’ by joining the English Merchant Fleet, typically travelling to the East
Indies. 5 per cent joined the British Navy, which, unlike joining the merchant fleet was
20
TNA, ADM 105/44, Chamberlain, Hell upon water, p. 64-5, 62. 21
Chamberlain, Hell upon water, p. 62. 22
Roos, Danske og norske krigsfanger, p. 8; Johnsen, Han sad i Prisonen, p. 7. 23
Larse, Danmarks Kapervæsen. 24
Feldbæk, Storhandelens tid, p. 200. 25
Johnsen, ’Norske sjøfolk i prisonen’; Bloksgaard, ’Kapervæsenet’, p. 261 26
Bloksgaard, ’Kapervæsenet’. 27
Feldbæk, Storhandelens tid, pp. 199-201.
6
considered treason in Denmark.28
Some were exchanged for British prisoners in Danish
prisons.29
Our study provides the first quantitative study of the prison experience of Danish and
Norwegian seamen imprisoned in England 1807-1814. This gives us the opportunity to
examine whether or not the English treated these Scandinavian seamen poorly, and whether
privateers were treated differently from other seamen.
III
Anthropometric history – the use of heights as a proxy for living standards – dates back to the
1970s, but has really taken off in the last twenty years. The basic premise is that the body is a
biological machine, in which a child’s growth is a function of net nutritional status. Broadly
speaking, if calories, protein and nutrients exceed the demands of basic metabolism plus work,
the child will grow. Clearly there are diminishing marginal returns – once a child is growing to
its maximum potential, additional food will not result in any additional height. The final
heights of our Danish and Norwegian prisoners suggest that this was rarely the case.
Anthropometric historians usually seek to explain height. In that context, they have
looked at heights by country over time, as well as at the experiences of sub-groups, such as
slaves,30
coalminers,31
and sailors.32
They have also looked at the effect of labour,33
and
disease.34
Steckel provides an excellent survey of this literature.35
As well as seeking to explain height, height can also be used as an explanatory variable.
This approach dates back to an important article by Fogel, Engerman and Trussell, 36
in which
they argue that social scientists should look at the effect of heights on social and economic
behaviour. Height is correlated with strength, and strength was an important labour market
characteristic well into the era of industrialisation. ‘A vast amount of wheeling, dragging,
hoisting, carrying, lifting, digging, tunnelling, draining, trenching, hedging, embanking,
blasting, breaking, scouring, sawing, felling, reaping, mowing, picking, sifting, and threshing
28
Johnsen, ’Norske sjøfolk i prisonen’. 29
Ibid. 30
Steckel, ‘A peculiar population’. 31
Kirby, ‘Causes of short stature’. 32
Humphries and Leunig, ‘Dick Whittington’. 33
Voth, ‘Height, nutrition and labor’; Komlos and Ritschl, ‘Holy days, work days, and nutrition’. 34
Leunig and Voth, ‘Stature and the standard of living’; Oxley, ‘Pitted but not pitied’. 35
Steckel, ‘Heights and human welfare’. 36
Fogel et al., ‘Changes in American and British stature’.
7
was done by sheer muscular effort, day in, day out’.37
Brawn made finding work – and
particular well-paid work – easier.38
As such, we can deduce the desirability of a particular
type of job, or place of work, from the average height of people engaged in that occupation.
Humphries and Leunig use this approach to show that London was a desirable place to live in
the mid-nineteenth century.39
Put simply, if taller people migrate to London disproportionately
often, we can conclude that London was a desirable place to live and work.
We use the same argument here. If taller people disproportionately stop going to sea,
we can conclude that the attractiveness of going to sea has fallen. We will look specifically at
the heights of Danish and Norwegian seamen before and after the British declaration of war. Is
it the case, as we might expect, that being a merchant sailor is a less appealing job in war than
in peace? If so, all seamen might seek work on land instead, but since taller seamen have a
stronger position in the labour market, they will be disproportionately successful in doing so.
The result will be a decline in the average height of seamen.
IV
Before we analyse our data, we need to establish that they are fit for purpose. The data are
British administrative records held in the National Archives.40
They cover Danish and
Norwegian seamen captured by the British during the Napoleonic Wars. They give each
sailor’s name, birth place, age, physical characteristics (height, build, face shape, hair and eye
colour), the ship on which they served, the type of ship (man of war, privateer, merchant), their
rank, where and when they were captured, the name of the prison and date of arrival there, and
the date and reason for leaving prison.
Genealogists transcribed the Danish data; we added the Norwegian heights to the
dataset.41
The stata code used is given in the appendix. The total number of observations is
4,261, made up of 1,425 Danes and 2,836 Norwegians. Not all records are complete. They are
all men. They vary in age between 8 and 80, with half being aged between 22 and 35. They
were born between 1728 and 1805, with half born 1780-1790. 2,409 were captured from
merchant navy vessels, 784 from privateers, 665 from ‘men of war’, and the remainder from
other, including not recorded. We can deduce that 18 per cent of the sample were measured to
37
Harrison, The early Victorians, p. 35. 38
Humphries, Childhood and child labour. 39
Humphries and Leunig, ‘Dick Whittington’. 40
Norwegians: TNA, ADM 103/60, 103/61, 103/62, 103/63, 103/64, 103/376 41
We would like to thank Danish genealogist Bruno Ansbjerg, who kindly lend us his database consisting of a
complete transcription of Danes in English prisons 1807-1814 and Aske Brock for coding the initial dataset.
8
the nearest quarter of an inch, 45 per cent to the nearest half inch, and the remaining 37 per
cent to the nearest whole inch.42
A Dane or Norwegian giving their name and place of birth orally to a British person in
1810 does not guarantee an accurate written record of Danish names, or places of birth.
Thankfully numbers are much more reliable: the British would have measured the prisoners,
and so there are no Danish-English communication issues. Similarly, old English handwriting
is not always straightforward to read, especially as words were often abbreviated. Again,
heights are easier to transcribe, as there are no abbreviations or translation issues.
We can test the likely accuracy of the data in four ways. First, we know that the height
of children should rise with age, and that children are shorter than adults. We also know that
there are unlikely to be large variations in average height by age for people aged c. 22 and
over, although older people may be a fraction shorter. We can see whether our data conform to
these reasonable expectations.
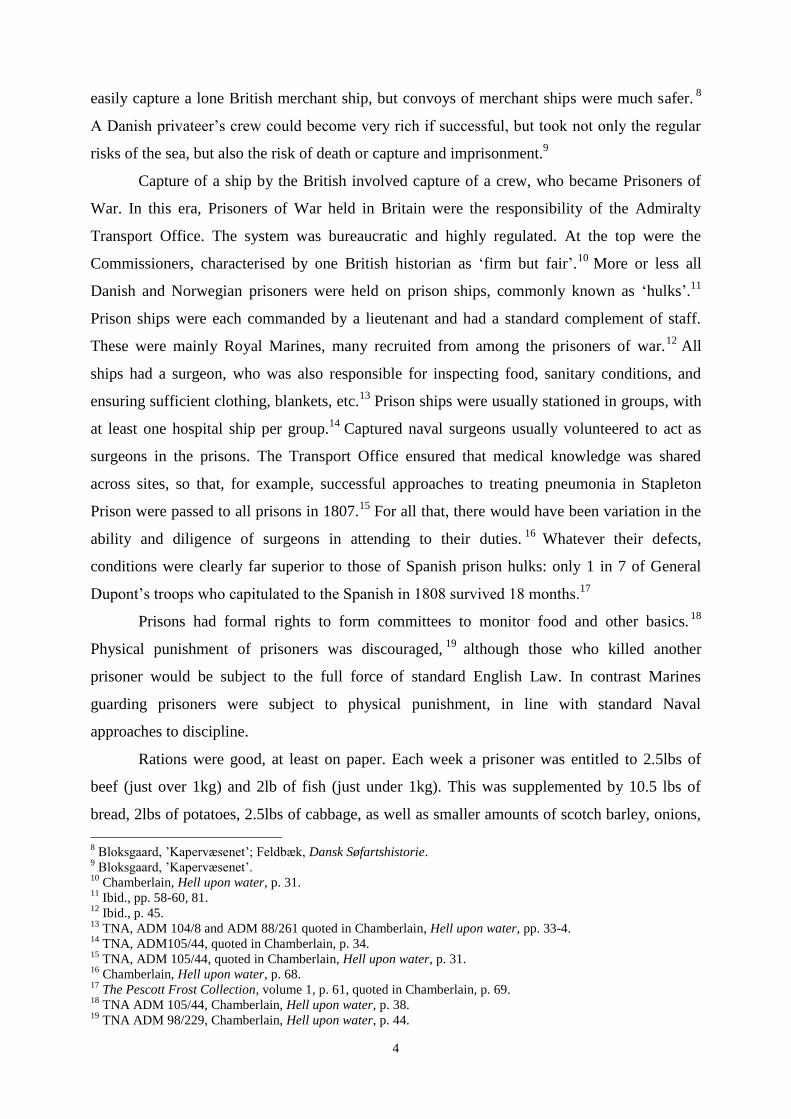
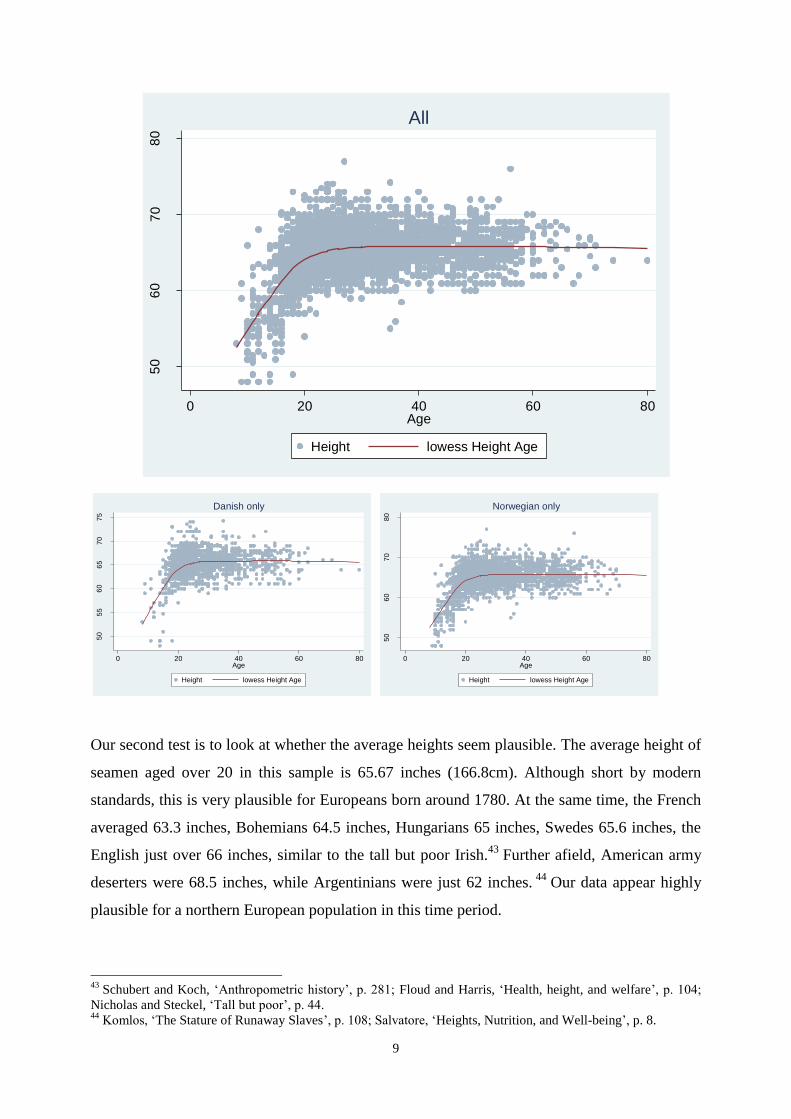
Figure 1 gives height by age, for the whole sample, and included a stata ‘lowess’ line of
best fit. As we would expect, children grow as they age, and adults are taller than children.
There is no discernible difference in adult heights from the early 20s and up, save only that
those aged 60 and over are slightly shorter than adults who have not reached that age.
Figure 1. Height by age
42
Of the Danish and Norwegian sailors 9 per cent have a height ending in either x.25 or x.75 inches. This implies
that 18 per cent of the sample were measured to the nearest quarter inch, of which 4.5 per cent were each of x.0,
x.25, x.5 and x.75. 27 per cent of heights end in x.5 inches. Of these, 4.5 per cent were measured to the nearest
quarter, with the remaining 22.5 per cent to the nearest half. This implies that 45 per cent of measurements were to
the nearest half inch, with 22.5 per cent each of x.0 and x.5. The remaining 37 per cent were measured to the
measured whole inch, such that a total of 67 per cent (4.5 per cent, 22.5 per cent and 37 per cent) appear in the
sample as an integer number of inches tall.
9
Our second test is to look at whether the average heights seem plausible. The average height of
seamen aged over 20 in this sample is 65.67 inches (166.8cm). Although short by modern
standards, this is very plausible for Europeans born around 1780. At the same time, the French
averaged 63.3 inches, Bohemians 64.5 inches, Hungarians 65 inches, Swedes 65.6 inches, the
English just over 66 inches, similar to the tall but poor Irish.43
Further afield, American army
deserters were 68.5 inches, while Argentinians were just 62 inches. 44
Our data appear highly
plausible for a northern European population in this time period.
43
Schubert and Koch, ‘Anthropometric history’, p. 281; Floud and Harris, ‘Health, height, and welfare’, p. 104;
Nicholas and Steckel, ‘Tall but poor’, p. 44. 44
Komlos, ‘The Stature of Runaway Slaves’, p. 108; Salvatore, ‘Heights, Nutrition, and Well-being’, p. 8.
50
60
70
80
0 20 40 60 80Age
Height lowess Height Age
All
50
55
60
65
70
75
0 20 40 60 80Age
Height lowess Height Age
Danish only
50
60
70
80
0 20 40 60 80Age
Height lowess Height Age
Norwegian only
10
These estimates are also in line with other work on Denmark and Norway. A 1845
study of heights in the Danish region of North Zealand found that heights averaged 164.3 cm
(64.7 inches) in 1815. Boldsen used conscript assessment rolls to find that Danes averaged
165.4 cm or 63.21 inches in 1852-1856.45
More recently, Thomsen found that rural heights in
1750-1850 varied between 166 and 169cm, varying with the size of the household.46
His
sample size is, however, quite small. Kiil found small rises in stature in Norwegian men, 1761-
1855, with heights of those joining the army rising from 165.3 cm to 168.6 cm in this period.47
Army minimum height standards mean we need to be careful interpreting these results. Again,
our averages are very much in line with this literature.
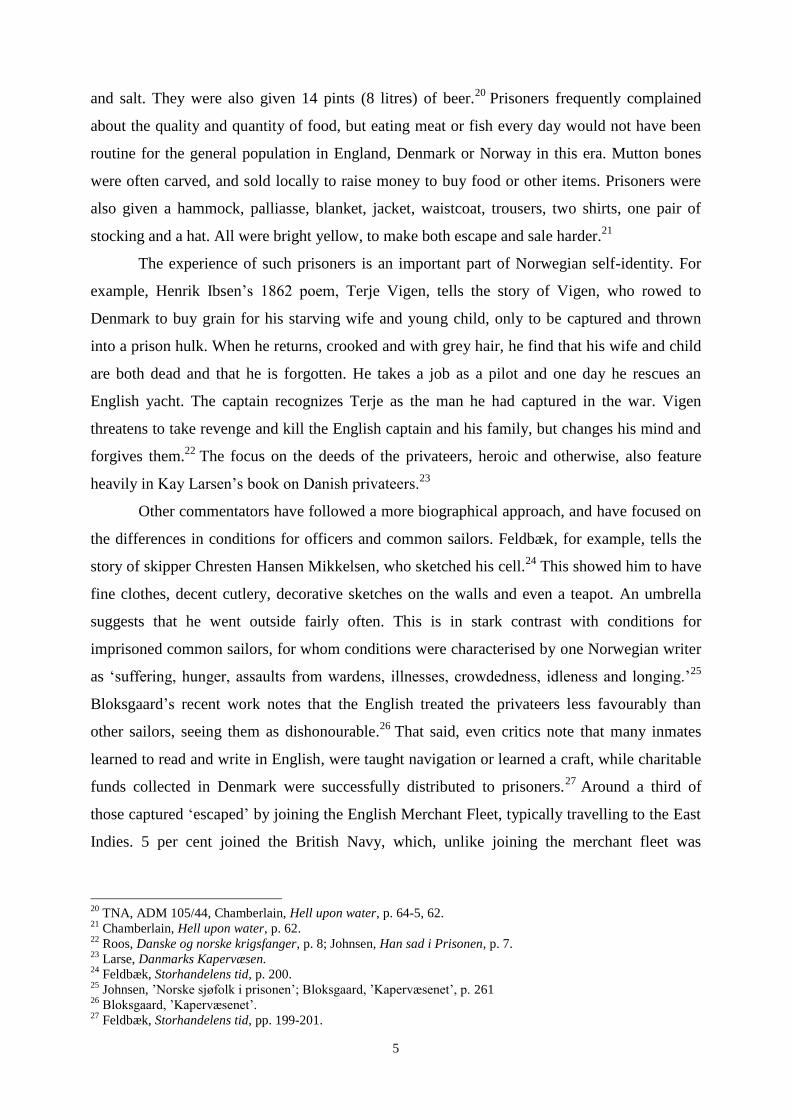
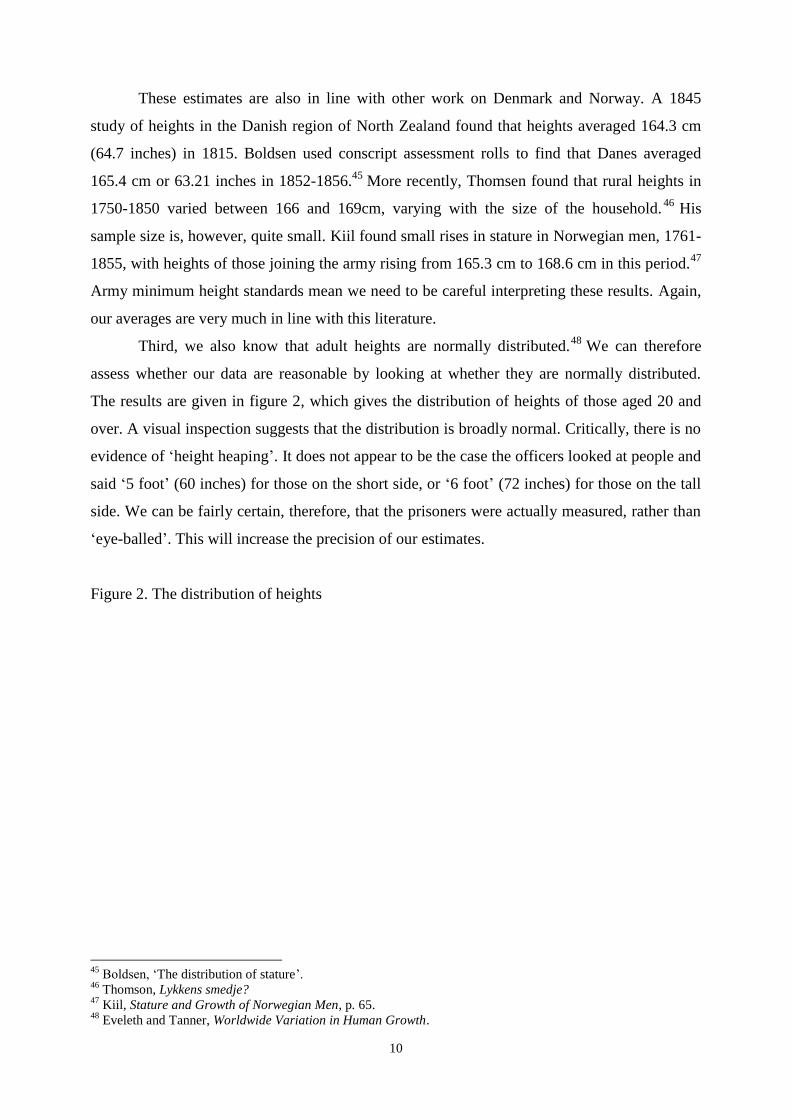
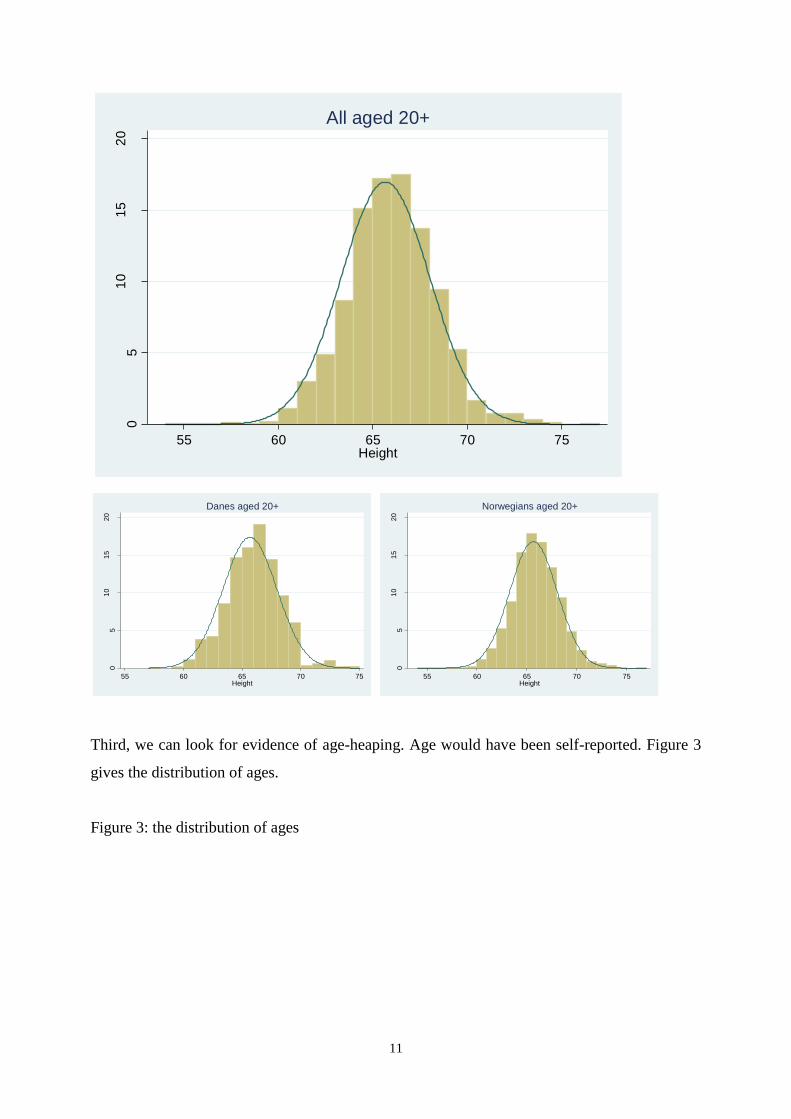
Third, we also know that adult heights are normally distributed.48
We can therefore
assess whether our data are reasonable by looking at whether they are normally distributed.
The results are given in figure 2, which gives the distribution of heights of those aged 20 and
over. A visual inspection suggests that the distribution is broadly normal. Critically, there is no
evidence of ‘height heaping’. It does not appear to be the case the officers looked at people and
said ‘5 foot’ (60 inches) for those on the short side, or ‘6 foot’ (72 inches) for those on the tall
side. We can be fairly certain, therefore, that the prisoners were actually measured, rather than
‘eye-balled’. This will increase the precision of our estimates.
Figure 2. The distribution of heights
45
Boldsen, ‘The distribution of stature’. 46
Thomson, Lykkens smedje? 47
Kiil, Stature and Growth of Norwegian Men, p. 65. 48
Eveleth and Tanner, Worldwide Variation in Human Growth.
11
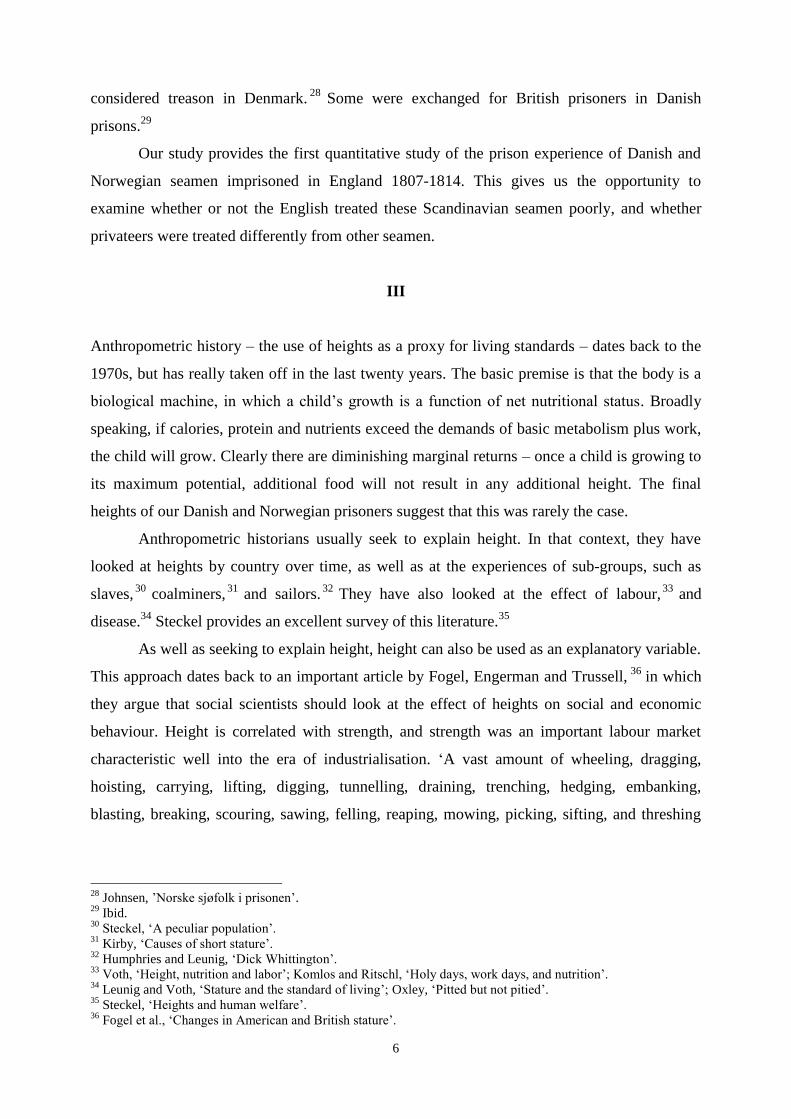
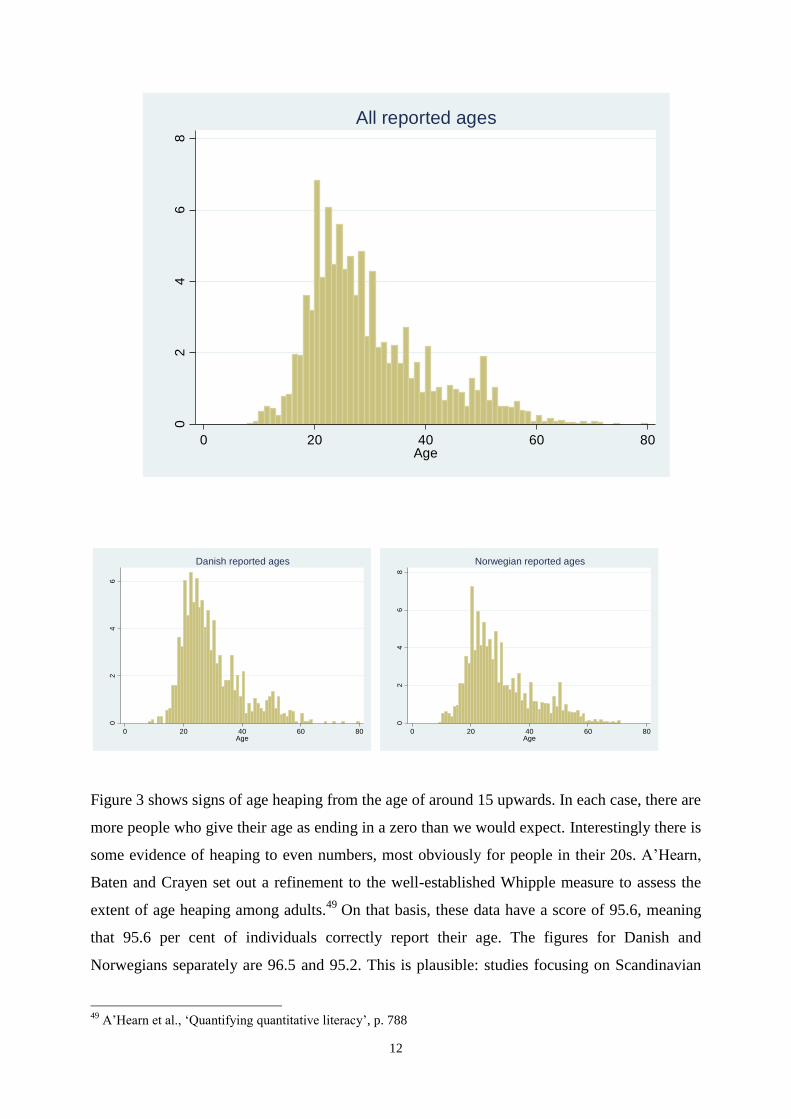
Third, we can look for evidence of age-heaping. Age would have been self-reported. Figure 3
gives the distribution of ages.
Figure 3: the distribution of ages
05
10
15
20
Pe
rcen
t
55 60 65 70 75Height
All aged 20+0
51
01
52
0
Pe
rcen
t
55 60 65 70 75Height
Danes aged 20+
05
10
15
20
Pe
rcen
t
55 60 65 70 75Height
Norwegians aged 20+
12
Figure 3 shows signs of age heaping from the age of around 15 upwards. In each case, there are
more people who give their age as ending in a zero than we would expect. Interestingly there is
some evidence of heaping to even numbers, most obviously for people in their 20s. A’Hearn,
Baten and Crayen set out a refinement to the well-established Whipple measure to assess the
extent of age heaping among adults.49
On that basis, these data have a score of 95.6, meaning
that 95.6 per cent of individuals correctly report their age. The figures for Danish and
Norwegians separately are 96.5 and 95.2. This is plausible: studies focusing on Scandinavian
49
A’Hearn et al., ‘Quantifying quantitative literacy’, p. 788
02
46
8
Pe
rcen
t
0 20 40 60 80Age
All reported ages0
24
6
Pe
rcen
t
0 20 40 60 80Age
Danish reported ages
02
46
8
Pe
rcen
t
0 20 40 60 80Age
Norwegian reported ages
13
seamen in the same period report similar values.50
The exact age of a person is not critical for
our research: rather, this test is part of a general assessment of data quality.
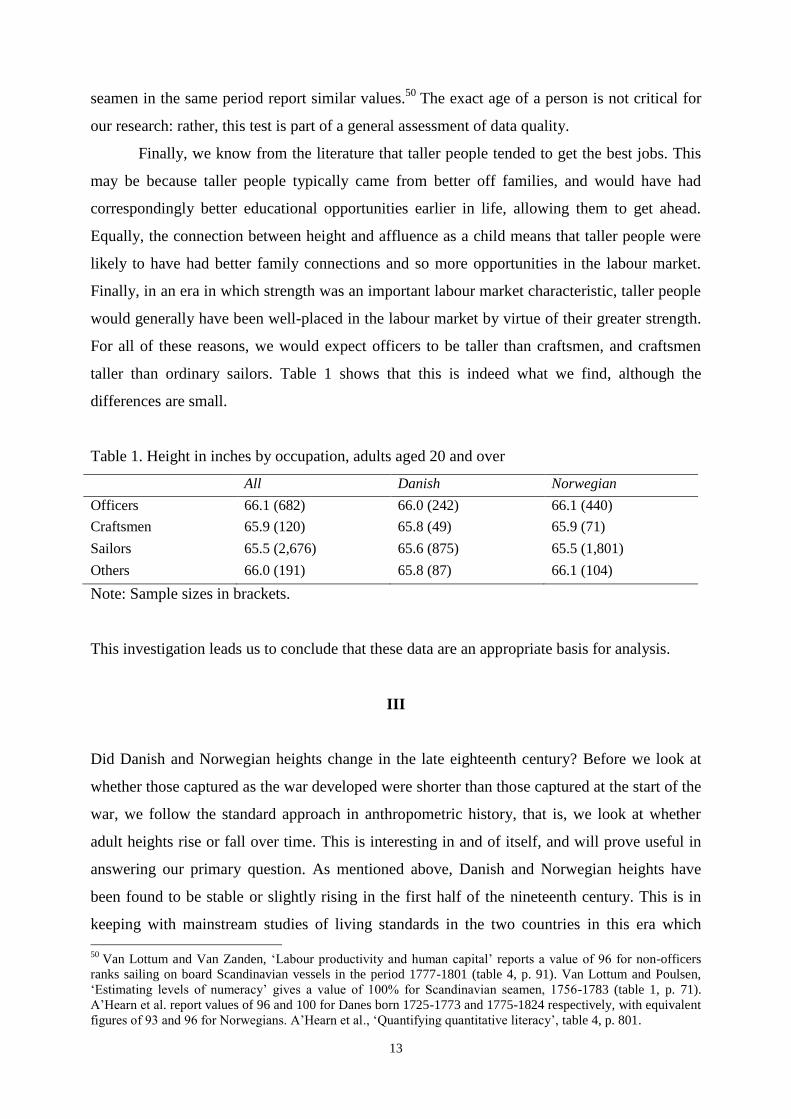
Finally, we know from the literature that taller people tended to get the best jobs. This
may be because taller people typically came from better off families, and would have had
correspondingly better educational opportunities earlier in life, allowing them to get ahead.
Equally, the connection between height and affluence as a child means that taller people were
likely to have had better family connections and so more opportunities in the labour market.
Finally, in an era in which strength was an important labour market characteristic, taller people
would generally have been well-placed in the labour market by virtue of their greater strength.
For all of these reasons, we would expect officers to be taller than craftsmen, and craftsmen
taller than ordinary sailors. Table 1 shows that this is indeed what we find, although the
differences are small.
Table 1. Height in inches by occupation, adults aged 20 and over
All Danish Norwegian
Officers 66.1 (682) 66.0 (242) 66.1 (440)
Craftsmen 65.9 (120) 65.8 (49) 65.9 (71)
Sailors 65.5 (2,676) 65.6 (875) 65.5 (1,801)
Others 66.0 (191) 65.8 (87) 66.1 (104)
Note: Sample sizes in brackets.
This investigation leads us to conclude that these data are an appropriate basis for analysis.
III
Did Danish and Norwegian heights change in the late eighteenth century? Before we look at
whether those captured as the war developed were shorter than those captured at the start of the
war, we follow the standard approach in anthropometric history, that is, we look at whether
adult heights rise or fall over time. This is interesting in and of itself, and will prove useful in
answering our primary question. As mentioned above, Danish and Norwegian heights have
been found to be stable or slightly rising in the first half of the nineteenth century. This is in
keeping with mainstream studies of living standards in the two countries in this era which
50
Van Lottum and Van Zanden, ‘Labour productivity and human capital’ reports a value of 96 for non-officers
ranks sailing on board Scandinavian vessels in the period 1777-1801 (table 4, p. 91). Van Lottum and Poulsen,
‘Estimating levels of numeracy’ gives a value of 100% for Scandinavian seamen, 1756-1783 (table 1, p. 71).
A’Hearn et al. report values of 96 and 100 for Danes born 1725-1773 and 1775-1824 respectively, with equivalent
figures of 93 and 96 for Norwegians. A’Hearn et al., ‘Quantifying quantitative literacy’, table 4, p. 801.
14
emphasise agricultural reform and the introduction of the potato from the beginning of the
nineteenth century.51
The basic methodology is well known. Adult heights appear on the left hand side of a
regression, and the date of birth (in this case, the decade) on the right. This allows us to test
whether or not date of birth affects heights. We restrict ourselves to those aged 20 or over, with
dummy variables for ages 20-25 inclusive to control for any late developers. We also include
dummy variables for the person being Danish, born in Copenhagen, age heaping, the person’s
status on the ship (e.g. officer vs sailor) and the type of vessel (e.g. merchant vs military). The
use of decadal dummies, rather than a time trend, avoids imposing an assumption of linearity
on any changes in heights over time. We run the regression for the combined sample, and for
Danes and Norwegians separately. The results are shown in Table 2.
51
Feldbæk, Danmarks økonomiske historie; Boserup et al.,‘Debat’; Johansen, ‘The Standard of Living in
Denmark’.
15
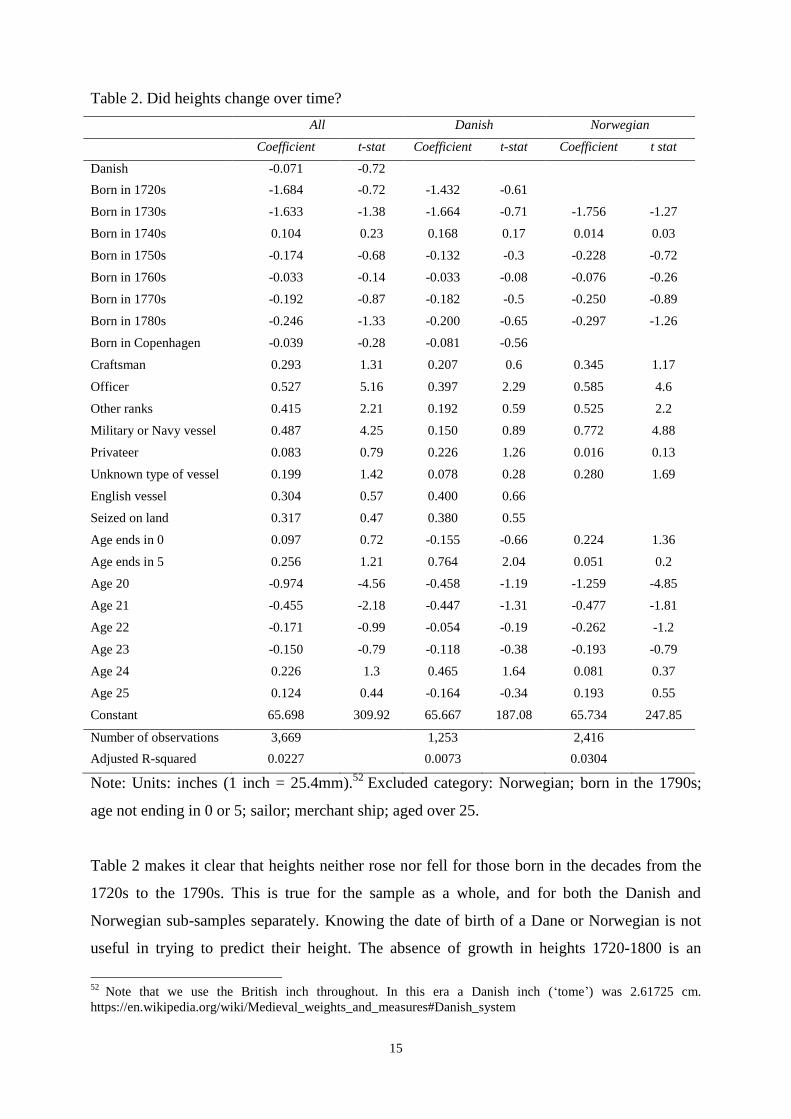
Table 2. Did heights change over time?
All Danish Norwegian
Coefficient t-stat Coefficient t-stat Coefficient t stat
Danish -0.071 -0.72
Born in 1720s -1.684 -0.72 -1.432 -0.61
Born in 1730s -1.633 -1.38 -1.664 -0.71 -1.756 -1.27
Born in 1740s 0.104 0.23 0.168 0.17 0.014 0.03
Born in 1750s -0.174 -0.68 -0.132 -0.3 -0.228 -0.72
Born in 1760s -0.033 -0.14 -0.033 -0.08 -0.076 -0.26
Born in 1770s -0.192 -0.87 -0.182 -0.5 -0.250 -0.89
Born in 1780s -0.246 -1.33 -0.200 -0.65 -0.297 -1.26
Born in Copenhagen -0.039 -0.28 -0.081 -0.56
Craftsman 0.293 1.31 0.207 0.6 0.345 1.17
Officer 0.527 5.16 0.397 2.29 0.585 4.6
Other ranks 0.415 2.21 0.192 0.59 0.525 2.2
Military or Navy vessel 0.487 4.25 0.150 0.89 0.772 4.88
Privateer 0.083 0.79 0.226 1.26 0.016 0.13
Unknown type of vessel 0.199 1.42 0.078 0.28 0.280 1.69
English vessel 0.304 0.57 0.400 0.66
Seized on land 0.317 0.47 0.380 0.55
Age ends in 0 0.097 0.72 -0.155 -0.66 0.224 1.36
Age ends in 5 0.256 1.21 0.764 2.04 0.051 0.2
Age 20 -0.974 -4.56 -0.458 -1.19 -1.259 -4.85
Age 21 -0.455 -2.18 -0.447 -1.31 -0.477 -1.81
Age 22 -0.171 -0.99 -0.054 -0.19 -0.262 -1.2
Age 23 -0.150 -0.79 -0.118 -0.38 -0.193 -0.79
Age 24 0.226 1.3 0.465 1.64 0.081 0.37
Age 25 0.124 0.44 -0.164 -0.34 0.193 0.55
Constant 65.698 309.92 65.667 187.08 65.734 247.85
Number of observations 3,669 1,253 2,416
Adjusted R-squared 0.0227 0.0073 0.0304
Note: Units: inches (1 inch = 25.4mm).52
Excluded category: Norwegian; born in the 1790s;
age not ending in 0 or 5; sailor; merchant ship; aged over 25.
Table 2 makes it clear that heights neither rose nor fell for those born in the decades from the
1720s to the 1790s. This is true for the sample as a whole, and for both the Danish and
Norwegian sub-samples separately. Knowing the date of birth of a Dane or Norwegian is not
useful in trying to predict their height. The absence of growth in heights 1720-1800 is an
52
Note that we use the British inch throughout. In this era a Danish inch (‘tome’) was 2.61725 cm.
https://en.wikipedia.org/wiki/Medieval_weights_and_measures#Danish_system
16
important result. There is a controversy in the Danish economic history literature on the
standard of living for this period. On the one hand, Kjærgaard has claimed that Denmark was
heading for a Malthusian trap in the late eighteenth century, and was only saved by new
institutions such as enclosure, and new technology such as clover.53
The more mainstream
interpretation is that there were no signs of overpopulation, and instead the enclosures should
be interpreted as a sign of increased wealth and commodification.54
These height data support
the latter interpretation: there is no sign of increased nutritional stress in the population of
either country.
Various other aspects of the results are noteworthy. First, Danes and Norwegians are
not statistically different in height. Both had the same kings, laws, regulations and culture, but
different economic specialities. We also find that those born in Copenhagen were not shorter
than those born elsewhere in Denmark. This is perhaps surprising, because Copenhagen was a
large city in this era, reaching 100,000 c 1800. That said, diets were clearly improving, with
average calories rising from c. 2900 in 1730 to c. 3200 in 1800, while consumption of fruit,
vegetables and meat almost doubled in the same period.55
We might expect those whose ages end in a 0 or 5 to be shorter. These groups are more
likely to include those who do not know their ages (‘age-heaping’). This is turn is evidence of
lower human capital, which may indicate a tougher, less-calorific upbringing. We do not find
this. The fact that 95 per cent of people know their age precisely means that the group of
people with an age ending in 0 will be made up largely of people whose ages genuinely end in
0. It is therefore not surprising that we find no effect.
We find that officers were taller, by around half an inch, confirming the descriptive
statistic given earlier in table 1. The result on craftsman is not statistically significant, and the
magnitude is small. Seamen on military vessels manned with Norwegians were taller than
those on non-military ships, but this does not hold true for Danes. Finally, those who aged 20
and 21 were shorter, indicating the late age at which men stopped growing in this era.
IV
We now turn to our main question of interest: just how scary was the British Navy? Economic
historians have long been interested in issues related to war. There are standard authoritative
53
Kjærgaard, Den danske revolution. 54
Feldbæk, Danmarks økonomiske historie; Boserup et al.,‘Debat’; Johansen, ‘The Standard of Living in
Denmark’.Johansen, ‘The Standard of Living in Denmark’. 55
Thestrup, ‘The standard of living’, pp. 258-259.
17
volumes on major conflicts such as the First World War and the Second World War.56
There is
also work that looks at more specific aspects, such as the role of agriculture, finance, and
medicine.57
Others have written about the costs and effects of war.58
This paper looks at whether the Anglo-Danish conflict was perceived by seamen as
making the job of being a sailor distinctly worse. If so, this is a fall in the standard of living
that would not be captured by conventional measures of economic well-being. It is easy to
imagine that the prospect of being captured and serving time in a British prison hulk could
have reduced the materially reduced the attractiveness of going to sea. If this is the case we
would expect to see a decline in the heights of those on board ships. This would be because
taller people who had become seamen in peacetime had good outside options in other labour
markets and would be more likely to choose other options once war began.
The research design is simple: we test whether there is evidence of falling heights after
war was declared, and as the war went on. Those captured initially would have been at sea
prior to hostilities being declared and so represent our peacetime height benchmark. The form
of the regression follows that of our earlier regressions. The results are given in table 3.
56
Broadberry and Harrison, eds., The Economics of World War I; Harrison, ed., The Economics of World War II. 57
Offer, An agrarian interpretation; Bordo and White, British and French finance; Harrison, Medicine and
victory. 58
Goldin and Lewis, ‘The economic cost of the American Civil War’; O’Rourke, ‘The worldwide economic
impact’.
18
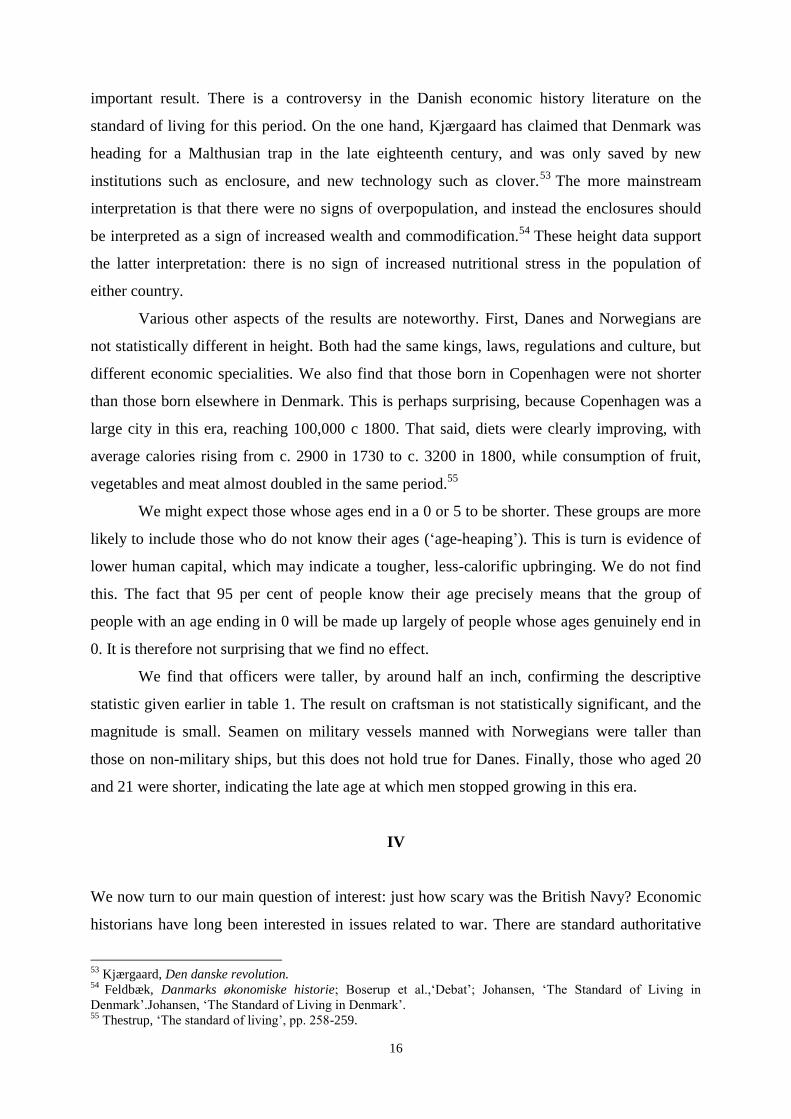
Table 3. Do heights decline after war is declared?
All Danish Norwegian
Coefficient t-stat Coefficient t-stat Coefficient t-stat
Danish 0.362 0.53 0.405 0.59
Captured in 1808 0.291 2.46 0.519 2.73 0.108 0.68
Captured in 1809 0.203 1.44 0.357 1.44 0.160 0.93
Captured in 1810 0.037 0.21 0.542 1.66 -0.249 -1.19
Captured in 1811 -0.082 -0.48 -0.111 -0.41 0.072 0.32
Captured in 1812 0.003 0.01 -0.337 -0.72 0.062 0.22
Captured in 1813 0.460 2.75 0.814 2.73 0.270 1.3
Captured in 1814 1.174 1.01 1.070 0.91
Born in Copenhagen -0.216 -1.22 -0.214 -0.76 -0.236 -1.04
Craftsman -0.092 -0.65 -0.139 -0.97
Officer 0.371 1.68 0.318 0.93 0.381 1.32
Other ranks 0.519 5.07 0.439 2.55 0.559 4.36
Military or Navy vessel 0.424 2.24 0.305 0.94 0.503 2.11
Privateer 0.378 2.83 0.099 0.5 0.674 3.55
Unknown type of vessel -0.010 -0.08 -0.041 -0.19 -0.026 -0.17
English vessel 0.142 0.95 -0.040 -0.15 0.318 1.72
Seized on land 0.115 0.21 -0.139 -0.22
Age ends in 0 0.085 0.65 -0.195 -0.86 0.227 1.41
Age ends in 5 0.085 0.65 -0.195 -0.86 0.227 1.41
Aged 20 0.273 1.96 0.549 2.35 0.126 0.72
Aged 21 -0.952 -5.18 -0.422 -1.29 -1.217 -5.48
Aged 22 -0.447 -2.43 -0.430 -1.43 -0.431 -1.85
Aged 23 -0.214 -1.39 -0.112 -0.44 -0.273 -1.41
Constant -0.060 -0.6
Number of observations 3,669 1,253 2,416
Adjusted R-squared 0.0319 0.0381 0.0389
Note: Units: inches (1 inch = 25.4mm); age >20.
Table 3 does not show any evidence of a decline in heights among Danish or Norwegian
seamen after the outbreak of war, or over the course of the war. The variable on year of capture
is never significant for Norwegian seamen. In contrast it is significant for Danish seamen (and
for the combined sample), but in the opposite direction. Danish seamen captured in 1808 and
1813 were 0.5 and 0.8 of an inch taller than those captured in 1807, or in the years 1809-1812.
There is no evidence that Danish or Norwegian seamen tried to evade the British Navy by
picking other occupations during the war.
V
19
Were the Danes and Norwegians rational to be so sanguine? There are two logical possibilities
consistent with our finding that there is no decline in heights. The first is that Danish and
Norwegian seamen were rational, because the chances and consequences of being captured by
the British were indeed minor. The alternative is that Danish and Norwegian seamen
underestimated at least one of the risks or consequences of capture.
We know nothing about the chance of capture, since we have no good evidence as to
how many days Danish and Norwegian seamen spent at sea in any given year. The British
would certainly have wanted to capture Danish merchant naval vessels, since each captured
ship earned the captain a prize.59
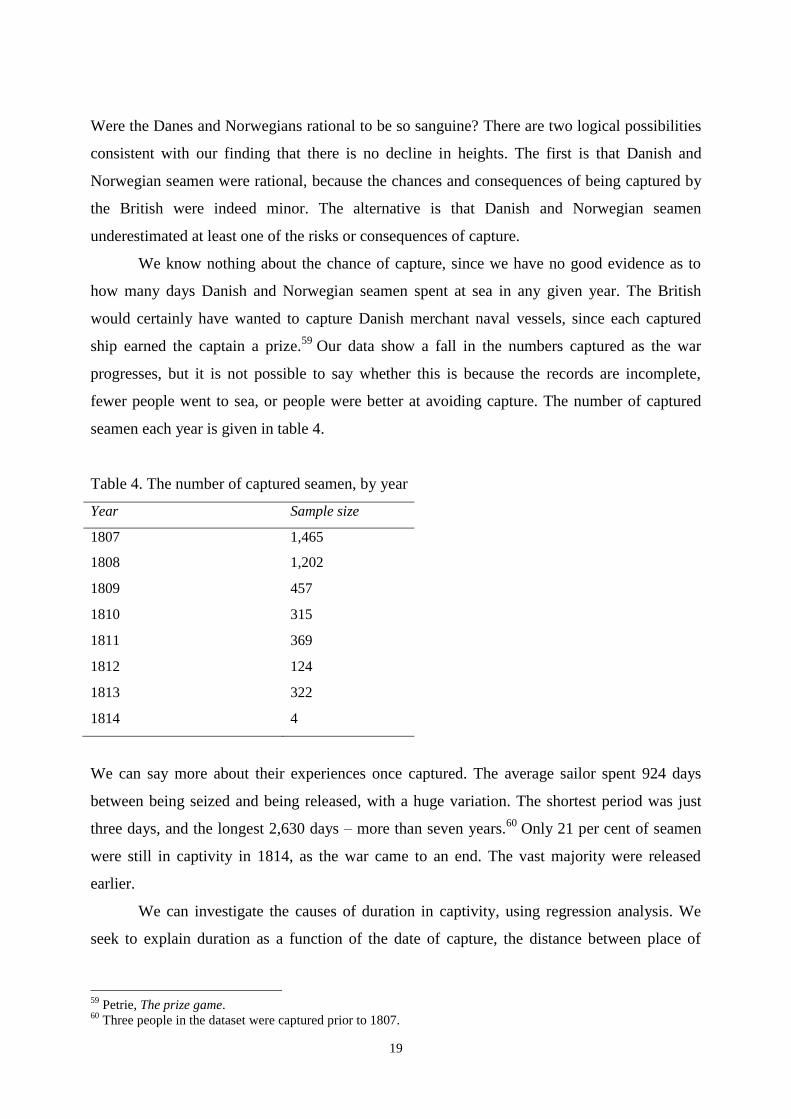
Our data show a fall in the numbers captured as the war
progresses, but it is not possible to say whether this is because the records are incomplete,
fewer people went to sea, or people were better at avoiding capture. The number of captured
seamen each year is given in table 4.
Table 4. The number of captured seamen, by year
Year Sample size
1807 1,465
1808 1,202
1809 457
1810 315
1811 369
1812 124
1813 322
1814 4
We can say more about their experiences once captured. The average sailor spent 924 days
between being seized and being released, with a huge variation. The shortest period was just
three days, and the longest 2,630 days – more than seven years.60
Only 21 per cent of seamen
were still in captivity in 1814, as the war came to an end. The vast majority were released
earlier.
We can investigate the causes of duration in captivity, using regression analysis. We
seek to explain duration as a function of the date of capture, the distance between place of
59
Petrie, The prize game. 60
Three people in the dataset were captured prior to 1807.
20
capture and prison, the status of the sailor, the type of ship, age, age heaping, height,
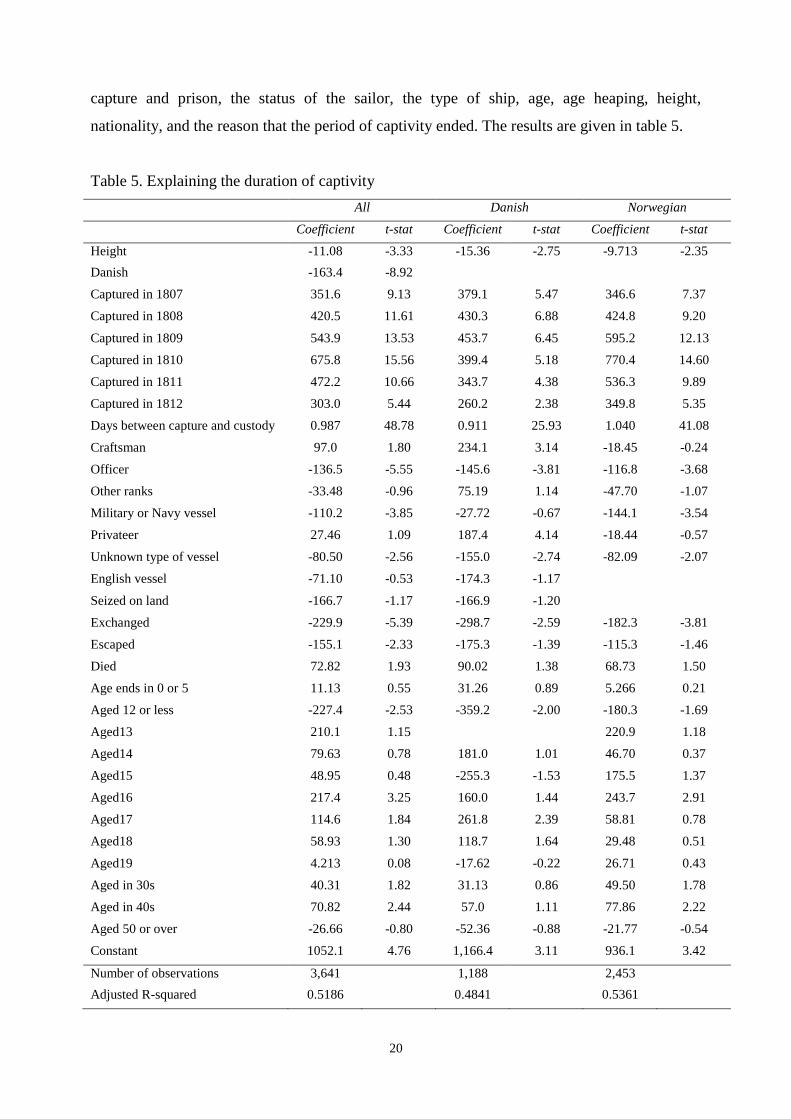
nationality, and the reason that the period of captivity ended. The results are given in table 5.
Table 5. Explaining the duration of captivity
All Danish Norwegian
Coefficient t-stat Coefficient t-stat Coefficient t-stat
Height -11.08 -3.33 -15.36 -2.75 -9.713 -2.35
Danish -163.4 -8.92
Captured in 1807 351.6 9.13 379.1 5.47 346.6 7.37
Captured in 1808 420.5 11.61 430.3 6.88 424.8 9.20
Captured in 1809 543.9 13.53 453.7 6.45 595.2 12.13
Captured in 1810 675.8 15.56 399.4 5.18 770.4 14.60
Captured in 1811 472.2 10.66 343.7 4.38 536.3 9.89
Captured in 1812 303.0 5.44 260.2 2.38 349.8 5.35
Days between capture and custody
.
0.987 48.78 0.911 25.93 1.040 41.08
Craftsman 97.0 1.80 234.1 3.14 -18.45 -0.24
Officer -136.5 -5.55 -145.6 -3.81 -116.8 -3.68
Other ranks -33.48 -0.96 75.19 1.14 -47.70 -1.07
Military or Navy vessel -110.2 -3.85 -27.72 -0.67 -144.1 -3.54
Privateer 27.46 1.09 187.4 4.14 -18.44 -0.57
Unknown type of vessel -80.50 -2.56 -155.0 -2.74 -82.09 -2.07
English vessel -71.10 -0.53 -174.3 -1.17
Seized on land -166.7 -1.17 -166.9 -1.20
Exchanged -229.9 -5.39 -298.7 -2.59 -182.3 -3.81
Escaped -155.1 -2.33 -175.3 -1.39 -115.3 -1.46
Died 72.82 1.93 90.02 1.38 68.73 1.50
Age ends in 0 or 5 11.13 0.55 31.26 0.89 5.266 0.21
Aged 12 or less -227.4 -2.53 -359.2 -2.00 -180.3 -1.69
Aged13 210.1 1.15 220.9 1.18
Aged14 79.63 0.78 181.0 1.01 46.70 0.37
Aged15 48.95 0.48 -255.3 -1.53 175.5 1.37
Aged16 217.4 3.25 160.0 1.44 243.7 2.91
Aged17 114.6 1.84 261.8 2.39 58.81 0.78
Aged18 58.93 1.30 118.7 1.64 29.48 0.51
Aged19 4.213 0.08 -17.62 -0.22 26.71 0.43
Aged in 30s 40.31 1.82 31.13 0.86 49.50 1.78
Aged in 40s 70.82 2.44 57.0 1.11 77.86 2.22
Aged 50 or over -26.66 -0.80 -52.36 -0.88 -21.77 -0.54
Constant 1052.1 4.76 1,166.4 3.11 936.1 3.42
Number of observations 3,641 1,188 2,453
Adjusted R-squared 0.5186 0.4841 0.5361
21
Note: Units: days in captivity. Excluded: sailor, aged 20-29, no heaping, merchant vessel,
captured 1813.
Table 5 shows that we can explain the duration of capture relatively well – the adjusted R2
value is typically around 0.5. The results are broadly stable across the three different
regressions.
Taking the sample as a whole, the simple average duration of custody was 924 days. As
we would expect, those captured at the end of the war were held in custody for the shortest
period, with those taken prisoner in 1813 being held for 273 days. If all prisoners were held
until the end of the war, the dummy variables on year of capture would rise by 365 for each
year prior to 1813, less some allowance for deaths and escapes, and some statistical noise to
reflect the fact that prisoners are not captured evenly throughout the year. This would mean
that 1812 would take a value of around 365, 1811 a value of around 730, and so on. The value
for 1812 – 303 – broadly reflects this pattern. Those captured in 1812 were largely held until
the end of the war. This pattern does not hold for earlier years, however. Those captured in
1811, for example, served six rather than twelve months more in prison than those captured the
following year. Those captured earlier in the war did particularly well – being captured in 1807
led to a spell in prison just 48 days longer than being captured in 1813. Thus we can see a
change in policy: initially prisoners were released, but as time went on it was more likely that
they would be held for the duration of the war.
One powerful determinant of duration in captivity was the place of capture, and
specifically its distance from Britain. Those who were captured far away, say in the Caribbean
or the Bay of Bengal, had to be transferred to Britain. This created a large lag between their
being seized and their formal entry into prison custody. That transit period barely reduced their
time in prison having arrived. A coefficient of around 0.99 means that for every day in transit,
a prisoner served just 0.01 of a day less in the actual prison, so that the overall period between
capture and release was larger by 0.99 of a day. Those in charge of prisons, who decided who
to release from time to time, did not give any weight to the time spent in captivity prior to
arriving in the prison itself.
Various other characteristics affected a sailor’s likely stay in captivity. Children –
defined as those aged 12 or under – were more likely to be released early, but there is little
evidence of any other form of age discrimination. The coefficient on the over 50s is negative,
but nowhere near statistically significant. Other definitions of seniority yield the same result.
22
Officers were likely to stay less long in prison, typically spending 137 days fewer in
captivity. This goes back to the notion that officers were gentlemen, whose word was their
bond. The tradition, followed for many years by all sides, was that an officer would be asked to
swear that they would not take up arms again, and, subject to making such a promise, would be
released. That system began to decline during the Napoleonic Wars, with French officers being
given parole within England instead of being allowed to return to France. Craftsmen, in
contrast, typically spent 97 days more in prison – perhaps because they were seen as useful by
the authorities. Those captured on military vessels also fared better, typically being released
110 days earlier than those with equivalent characteristics on merchant ships. Danes were also
released more quickly than Norwegians, by 163 days. The tall also served (slightly) less time in
prison – each extra inch was associated with 11 fewer days inside. Conditional on being
captured it was therefore helpful to be a tall, Danish captain of a military vessel, and to be
captured early on, and close to England.
Finally, we can compare the effect of different forms of exit. Most people were simply
released, but some were exchanged, some escaped, and some died. Lucky were those who were
exchanged, for they were imprisoned for 230 fewer days than would otherwise have been the
case. This tells us something important about the exchange system: the British authorities
exchanges were real, that is, the prisoners they released on exchange were not those who would
have been released at the time in any case. The number of prisoners exchanged was low,
reflecting the post-French Revolution decline of the previous system whereby prisoner were
exchanged routinely and rapidly.61
The case for escaping seems weak. The coefficient is 155, meaning that escaping
reduced the duration of imprisonment by around 17 per cent. It is statistically significant. What
we do not know, however, is what happened to the escapees. Escaping from a prison hulk,
whether by climbing over the top and jumping into the water, or sawing through the side, is
one thing, finding your way home to Denmark or Norway is another. Escapees would have
needed to swim to land, or seize a small boat in the vicinity of the prison ship. Even if they
reached land safely, they would have spoken little if any English, and almost all would have
had little money or other assets. It is difficult to be optimistic about their chances. Those
recaptured would be put in the prison ‘black hole’, a room typically 6 feet square, on half
rations, until the costs of their capture had been made up from the savings on rations. They
were also made ineligible for exchange.62
Nonetheless, one particular Danish officer, Hans von
61
Daly, ‘Napoleon's Lost Legions’ 62
Chamberlain, Hell upon water, p. 38.
23
Dahlerup was captured no less than three times during the course of the conflict, before
continuing a successful naval career, rising to be admiral of the Austrian fleet fighting
Garibaldi in the Adriatic Sea in 1849.63
Finally the coefficient on dying is positive, rather than negative, although it is not
(quite) statistically significant. This would only occur causally if the very sick were detained
for longer, being too sick to release. This seems implausible. Instead we turn now to look in
more detail at deaths in custody.
First off, relatively few prisoners died in custody: 194 of the 3,655 seamen whose
reason for custody ending is known to us. Given an average 924 day stay, this is a death rate of
2.06 per cent per year.64
As mentioned earlier, this is a radically lower death rate than for
Spanish prison hulks. We have no good data on age specific mortality rates in Denmark or
Norway with which to compare this number. The average age of prisoners on arrival was 29,
and life expectancy of English men at age 30 in 1750-99 was 32.1 years,65
implying a mortality
rate of around 2.2 per cent.66
Given the age profile of prisoners, we can be certain that the age
adjusted prisoner death rate exceeded that of free English men in this era, but the death rates do
not seem large enough to support the description of these ships as ‘floating tombs’.67
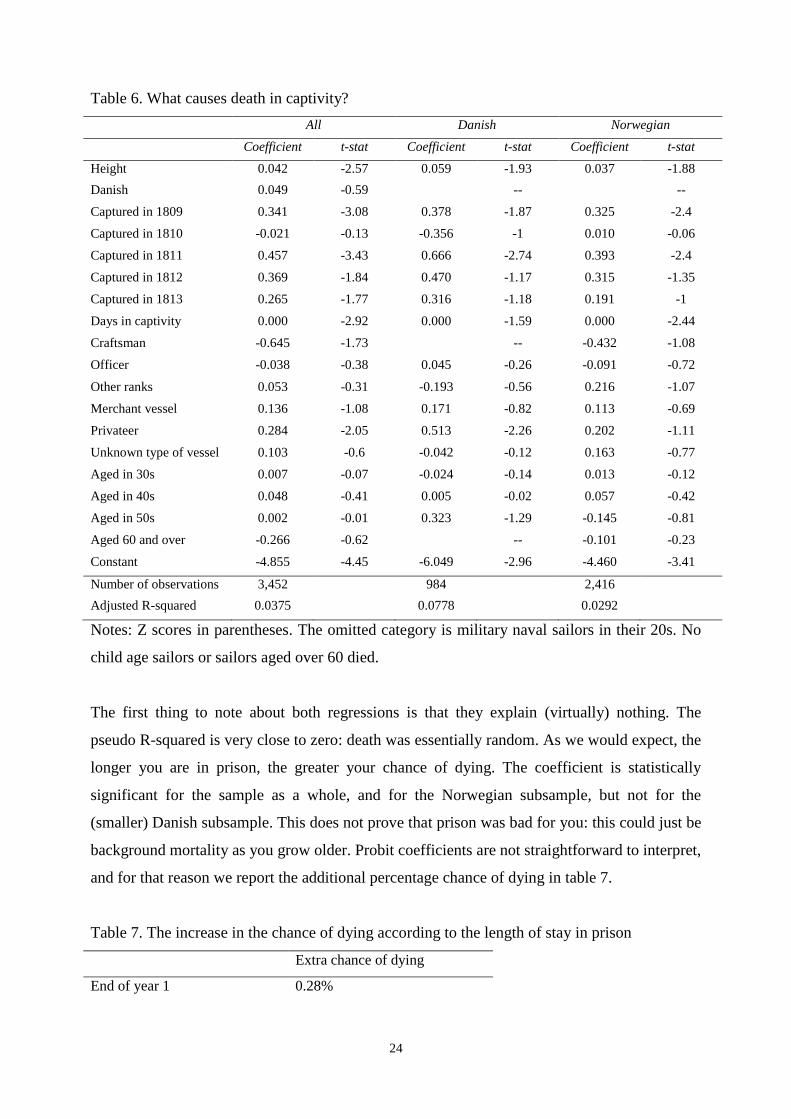
We can analyse the determinants of dying via regression analysis. Since dying in
captivity is a binary variable – you either die or you don’t – we use a probit analysis. The
results are given in table 6.
63
Jørgensen, ’Hans Birch Dahlerup i Danmark’. 64
(1+194/3655)^(365/924) 65
Wrigley and Schofield, Population history of England, p. 252, table 7.21. 66
1/(1.0218^32.1) = 0.5 67
Chamberlain, Hell upon water, chapter 3.
24
Table 6. What causes death in captivity?
All Danish Norwegian
Coefficient t-stat Coefficient t-stat Coefficient t-stat
Height 0.042 -2.57 0.059 -1.93 0.037 -1.88
Danish 0.049 -0.59 -- --
Captured in 1809 0.341 -3.08 0.378 -1.87 0.325 -2.4
Captured in 1810 -0.021 -0.13 -0.356 -1 0.010 -0.06
Captured in 1811 0.457 -3.43 0.666 -2.74 0.393 -2.4
Captured in 1812 0.369 -1.84 0.470 -1.17 0.315 -1.35
Captured in 1813 0.265 -1.77 0.316 -1.18 0.191 -1
Days in captivity 0.000 -2.92 0.000 -1.59 0.000 -2.44
Craftsman -0.645 -1.73 -- -0.432 -1.08
Officer -0.038 -0.38 0.045 -0.26 -0.091 -0.72
Other ranks 0.053 -0.31 -0.193 -0.56 0.216 -1.07
Merchant vessel 0.136 -1.08 0.171 -0.82 0.113 -0.69
Privateer 0.284 -2.05 0.513 -2.26 0.202 -1.11
Unknown type of vessel 0.103 -0.6 -0.042 -0.12 0.163 -0.77
Aged in 30s 0.007 -0.07 -0.024 -0.14 0.013 -0.12
Aged in 40s 0.048 -0.41 0.005 -0.02 0.057 -0.42
Aged in 50s 0.002 -0.01 0.323 -1.29 -0.145 -0.81
Aged 60 and over -0.266 -0.62 -- -0.101 -0.23
Constant -4.855 -4.45 -6.049 -2.96 -4.460 -3.41
Number of observations 3,452 984 2,416
Adjusted R-squared 0.0375 0.0778 0.0292
Notes: Z scores in parentheses. The omitted category is military naval sailors in their 20s. No
child age sailors or sailors aged over 60 died.
The first thing to note about both regressions is that they explain (virtually) nothing. The
pseudo R-squared is very close to zero: death was essentially random. As we would expect, the
longer you are in prison, the greater your chance of dying. The coefficient is statistically
significant for the sample as a whole, and for the Norwegian subsample, but not for the
(smaller) Danish subsample. This does not prove that prison was bad for you: this could just be
background mortality as you grow older. Probit coefficients are not straightforward to interpret,
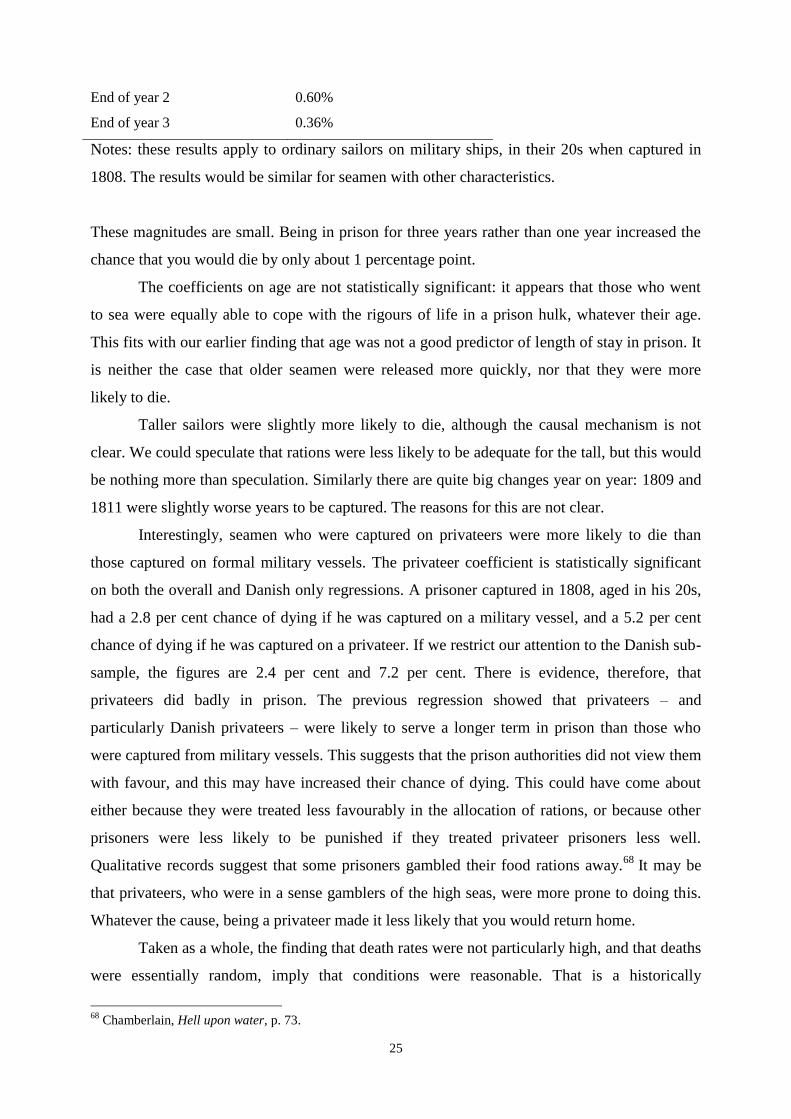
and for that reason we report the additional percentage chance of dying in table 7.
Table 7. The increase in the chance of dying according to the length of stay in prison
Extra chance of dying
End of year 1 0.28%
25
End of year 2 0.60%
End of year 3 0.36%
Notes: these results apply to ordinary sailors on military ships, in their 20s when captured in
1808. The results would be similar for seamen with other characteristics.
These magnitudes are small. Being in prison for three years rather than one year increased the
chance that you would die by only about 1 percentage point.
The coefficients on age are not statistically significant: it appears that those who went
to sea were equally able to cope with the rigours of life in a prison hulk, whatever their age.
This fits with our earlier finding that age was not a good predictor of length of stay in prison. It
is neither the case that older seamen were released more quickly, nor that they were more
likely to die.
Taller sailors were slightly more likely to die, although the causal mechanism is not
clear. We could speculate that rations were less likely to be adequate for the tall, but this would
be nothing more than speculation. Similarly there are quite big changes year on year: 1809 and
1811 were slightly worse years to be captured. The reasons for this are not clear.
Interestingly, seamen who were captured on privateers were more likely to die than
those captured on formal military vessels. The privateer coefficient is statistically significant
on both the overall and Danish only regressions. A prisoner captured in 1808, aged in his 20s,
had a 2.8 per cent chance of dying if he was captured on a military vessel, and a 5.2 per cent
chance of dying if he was captured on a privateer. If we restrict our attention to the Danish sub-
sample, the figures are 2.4 per cent and 7.2 per cent. There is evidence, therefore, that
privateers did badly in prison. The previous regression showed that privateers – and
particularly Danish privateers – were likely to serve a longer term in prison than those who
were captured from military vessels. This suggests that the prison authorities did not view them
with favour, and this may have increased their chance of dying. This could have come about
either because they were treated less favourably in the allocation of rations, or because other
prisoners were less likely to be punished if they treated privateer prisoners less well.
Qualitative records suggest that some prisoners gambled their food rations away.68
It may be
that privateers, who were in a sense gamblers of the high seas, were more prone to doing this.
Whatever the cause, being a privateer made it less likely that you would return home.
Taken as a whole, the finding that death rates were not particularly high, and that deaths
were essentially random, imply that conditions were reasonable. That is a historically
68
Chamberlain, Hell upon water, p. 73.
26
important finding. There are many contemporary claims to the contrary, particularly from
French authors. For example, Captain Charles Dupin described the prison hulks as ‘floating
tombs’, while Baron de Bonnefoux said that ‘It is difficult to imagine a more severe
punishment’.69
But as Chamberlain argues, these authors should not be seen as unbiased: they
had a motive to portray the British as the villains, and the French (and others) as ‘the innocent
victims of the fortune of war.’70
He also argues that many historians have confused conditions
on the prison hulks with those on the convict hulks, ‘whose conditions were indeed
horrendous’. This research supports his contention that conditions on prison hulks were not
unreasonable for this era.
VI
This paper provides evidence for three claims. First, there was no secular rise in Danish or
Norwegian heights for those born from the 1720s to the 1790s, and by implication no rise in
the standard of living for Danes in this era. We find no evidence that these societies were close
to a Malthusian crisis. Second, the Danes and Norwegians show no signs of being worried
about being captured by the British Navy, and held on a prison hulk. There is no fall in the
average height of seamen after war breaks out, nor as the war continues. Third, conditions on
prison hulks do not appear to have been awful. Death rates – unless you were captured on a
privateer – were low, suggesting that disease was not rife, and that nutrition was adequate for at
least survival. Many prisoners were released before the end of the war, with Danes, officers,
those captured at the start of the war and children more likely to be released after a shorter time
in captivity. Given the evidence that conditions were not too bad, we conclude that Danish and
Norwegian seamen were right not to be scared of the British Navy, or the consequences of
being caught. There were many risks for people making a living on the sea in the early 1800s,
and the risk of capture and confinement does not seem to have materially increased those risks.
69
Chamberlain, Hell upon water, p. 55. 70
Ibid.
27
Bibliography
A’Hearn, B. J., Baten, J. and Crayen, D., ‘Quantifying Quantitative Literacy: Age Heaping and
the History of Human Capital’, Journal of Economic History, 69 (2009), pp. 783–808.
Bell, The First Total War: Napoleon's Europe and the Birth of Modern Warfare (2008).
Bloksgaard, A., ‘Kapervæsenet 1807-1814’, in E. S. Christensen, K. Knudsen, H. Gjøde
Nielsen, E. Helmer Pedersen, V. Petersen, S. Sørensen and P. Ussing, eds., Nordjylland under
Englandskrigen 1807-1814 (Aalborg, 2009), pp. 247-278.
Boldsen, J. L. and Kronborg, D., ‘The distribution of stature among Danish conscripts in 1852-
56’, Annals of Human Biology, 11 (1984), pp. 555-565
Bordo, M. D. and White, E. N., ‘A Tale of Two Currencies: British and French Finance During
the Napoleonic Wars’, Journal of Economic History, 51 (1991), pp. 303-316.
Boserup, E., Frandsen, K., Aaby, B., Busck, S., Christensen, S., Christensen, D. C., Løgstrup,
B., Holmgård, J., Henriksen, I. and Busck, S., ‘Debat i anledning af Thorkild Kjærgaards Den
Danske Revolution: En økohistorisk tolkning’, Fortid og Nutid, 1 (1992), pp. 16-57.
Broadberry, S. and Harrison, M., eds., The Economics of World War I (Cambridge, 2005).
Chamberlain, P., Hell Upon Water: Prisoners of War in Britain 1793-1815 (Staplehurst, 2008).
Daly, G., ‘Napoleon's Lost Legions: French Prisoners of War in Britain, 1803–1814’, History,
89 (2004), pp. 361-380.
Eveleth, P. B. and Tanner, J. M., Worldwide Variation in Human Growth (Cambridge, 1991).
Feldbæk, O., Danmarks økonomiske historie 1500-1840 (Copenhagen, 1993)
Feldbæk, O., Storhandelens tid. Dansk Søfartshistorie. 3. 1720-1814 (Copenhagen, 1997).
Floud, R. and Harris, B., ‘Health, height, and welfare’, in R. H. Steckel and R. Floud, Health
and welfare during industrialization (Chicago, 1997).
Fogel, R. W., Engerman, S. L., Floud, R., Steckel, R. H. and Trussell, J., ‘Changes in
American and British stature since the mid-eighteenth century: A preliminary report on the
28
usefulness of data on height for the analysis of secular trends in nutrition, labor productivity,
and labor welfare’, NBER Working Paper, 890 (1982).
Goldin, C. D. and Lewis, F. D. ‘The economic cost of the American Civil War: Estimates and
implications’, Journal of Economic History, 35 (1975), pp. 299-326.
Harrison, J. C. F., The early Victorians, 1832-51 (1971).
Harrison, M., ed., The Economics of World War II. Six great powers in international
comparison (Cambridge, 2000).
Harrison, M., Medicine and Victory. British Military Medicine in the Second World War
(Oxford, 2004).
Humphries and Leunig, ‘Was Dick Whittington taller than those he left behind?
Anthropometric measures, migration and the quality of life in early nineteenth century
London’, Explorations in Economic History 46 (2009), pp. 120-131.
Humphries, J., Childhood and Child Labour in the British Industrial Revolution (Cambridge,
2010).
Johansen, H. C., ‘The Standard of Living in Denmark in the Eighteenth and Early Nineteenth
Centuries'’ in R. C. Allen, T. Bengtsson and M. Dribe, eds., Living standards in the past
(2005), pp. 307-318.
Johnsen, B. E., ‘Norske sjøfolk i prisonen’, in E. S. Christensen, K. Knudsen, H. Gjøde
Nielsen, E. Helmer Pedersen, V. Petersen, S. Sørensen and P. Ussing, eds., Nordjylland under
Englandskrigen 1807-1814 (Aalborg, 2007), pp. 285-296.
Johnsen, B. E., Han sad i Prisonen...Sjøfolk i engelsk fangenskap 1807-1814 (Oslo, 1993).
Jørgensen, A., ‘Hans Birch Dahlerup i Danmark og Østrig. Mellem Enevælde og Demokrati’,
CØNK Småskrifter, 6 (2002).
Kennedy, P. M., The rise and fall of British Naval Mastery (2004).
Kiil, V., Stature and growth of Norwegian men during the past two hundred years (Oslo,
1939).
Kjærgaard, T., Den danske revolution 1500-1800. En økohistorisk tolkning (Copenhagen,
1991).
29
Knight, R., Britain Against Napoleon. The organization of victory, 1793-1815 (2013).
Komlos, J., ‘The Stature of Runaway Slaves in Colonial America’, in J. Komlos, ed., Stature,
Living Standards, and Economic Development: Essays in Anthropometric History (Chicago,
1994), pp. 93-116.
Komlos, J., and Ritschl, A., ‘Holy Days, Work Days, and the Standard of Living in the
Habsburg Monarchy’, Journal of Interdisciplinary History, 26 (1995), pp. 57–66.
Larse, K., Danmarks Kapervæsen 1807-1814 (Copenhagen, 1972).
van Lottum, J. and Poulsen, B., ‘Estimating numeracy and literacy levels in the maritime
labour market of the North Atlantic of the late eighteenth century’, Scandinavian Economic
History Review, 59 (2011), pp. 65-80.
van Lottum, J. and van Zanden, J. L., ‘Labour productivity and human capital in the European
maritime sector of the eighteenth century’, Explorations in Economic History, 53 (2014), pp.
83-100.
Nicholas, S., and Steckel, R. H., ‘Tall but poor: Nutrition, health and living standards in pre-
famine Ireland’, NBER Historical Working Papers, 39 (1992).
O’Rourke, K., ‘The worldwide economic impact of the French Revolutionary and Napoleonic
Wars, 1793-1815’, Journal of Global History 1 (2006), pp. 123-149.
Offer, A., The First World War: An Agrarian Interpretation (Oxford, 1991).
Oxley, D., ‘‘Pitted but not pitied’ or, does smallpox make you small?’, Economic History
Review, 59 (2006), pp. 617-635.
Petrie, D. A., The prize game: lawful looting on the high seas in the days of fighting sail
(Annapolis, 1999).
Roos, C., Prisonen. Danske og norske krigsfanger i England 1807-1814 (Copenhagen, 1953).
Salvatore, R. C., ‘Heights, nutrition, and well-being in Argentina, ca. 1850–1950. Preliminary
results’, Revista de Historia Económica / Journal of Iberian and Latin American Economic
History, Second Series, 25 (2007), pp. 53-85
Schubert, H. and Koch, D., ‘Anthropometric history of the French Revolution in the province
of Orleans’, Economics and Human Biology, 9 (2011), pp. 277-283.
30
Steckel, R. H., ‘A Peculiar Population: The Nutrition, Health, and Mortality of American
Slaves from Childhood to Maturity’, Journal of Economic History, 46 (1986), pp. 721-741.
Steckel, R. H., ‘Heights and human welfare: Recent developments and new directions’,
Explorations in Economic History, 46( 2009), pp. 1-23.
Stoker, D. Schneid, F. C. and Blanton, H. D., ed., Conscription in the Napoleonic Era: A
Revolution in Military Affairs? (2014).
Thestrup, P., The Standard of Living in Copenhagen 1730-1800: Some Methods of
Measurement (Copenhagen, 1971).
Thomsen, A. R., Lykkens smedje?: Social mobilitet og social stabilitet over fem generationer i
tre sogne i Salling 1750-1850 (Viborg, 2011).
Voth, H.-J. and Leunig, T., ‘Did Smallpox Reduce Height? Stature and the Standard of Living
in London, 1770-1873’, Economic History Review, XLIX (1996), pp. 541-560.
Voth, H.-J.,‘Height, Nutrition, and Labor: Recasting the ‘Austrian Model’’, Journal of
Interdisciplinary History, 25 (1995), pp. 627-636.
Wrigley, E. A. and Schofield, R. S., The population history of England 1541-1871 (Cambridge,
1989).
31
Appendix
Stata codes:
twoway scatter Height Age, mcolor(*.4) title(All) || lowess Height Age,
name(height_by_age_all,replace)
tw sc Height Age if danish, mcolor(*.4) title(Danish only) || lowess Height Age,
name(height_by_age_D, replace)
tw sc Height Age if danish==0, mcolor(*.4) title(Norwegian only) || lowess Height Age,
name(height_by_age_N, replace)
mean Height if A20andover
mean Height if A20andover & danish
mean Height if A20andover & danish==0
histogram Height, width(1) percent normal title(All aged 20+), if A20andover,
name(height_all_20over, replace)
histogram Height, width(1) percent normal title(Danes aged 20+), if A20andover & danish,
name(height_D_20over, replace)
histogram Height, width(1) percent normal title(Norwegians aged 20+), if A20andover &
danish==0, name(height_N_20over, replace)
histogram Age, width(1) percent title(All reported ages)
histogram Age, width(1) percent title(Danish reported ages), if danish
histogram Age, width(1) percent title(Norwegian reported ages), if danish==0
mean Height if A20andover & Officer
mean Height if A20andover & Officer & danish
mean Height if A20andover & Officer & danish==0
mean Height if A20andover & Craftsman
mean Height if A20andover & Craftsman & danish
mean Height if A20andover & Craftsman & danish==0
mean Height if A20andover & Sailor
mean Height if A20andover & Sailor & danish
mean Height if A20andover & Sailor & danish==0
mean Height if A20andover & other
mean Height if A20andover & other & danish
mean Height if A20andover & other & danish==0
32
regress Height danish A1720s A1730s A1740s A1750s A1760s A1770s A1780s Hx0 Hx5
Kopenhagen Craftsman Officer other Military_Navy Privateer unknown_vessel_type
English_vessel seized_on_land A20 A21 A22 A23 A24 A25 if A20andover
regress Height danish A1720s A1730s A1740s A1750s A1760s A1770s A1780s Hx0 Hx5
Kopenhagen Craftsman Officer other Military_Navy Privateer unknown_vessel_type
English_vessel seized_on_land A20 A21 A22 A23 A24 A25 if A20andover & danish
regress Height danish A1720s A1730s A1740s A1750s A1760s A1770s A1780s Hx0 Hx5
Kopenhagen Craftsman Officer other Military_Navy Privateer unknown_vessel_type
English_vessel seized_on_land A20 A21 A22 A23 A24 A25 if A20andover & danish==0
regress Height C1808 C1809 C1810 C1811 C1812 C1813 C1814 A20 A21 A22 A23 Hx0 Hx5
Kopenhagen Craftsman Officer other Military_Navy Privateer unknown_vessel_type
English_vessel seized_on_land danish if A20andover
regress Height C1808 C1809 C1810 C1811 C1812 C1813 C1814 A20 A21 A22 A23 Hx0 Hx5
Kopenhagen Craftsman Officer other Military_Navy Privateer unknown_vessel_type
English_vessel seized_on_land danish if A20andover & danish
regress Height C1808 C1809 C1810 C1811 C1812 C1813 C1814 A20 A21 A22 A23 Hx0 Hx5
Kopenhagen Craftsman Officer other Military_Navy Privateer unknown_vessel_type
English_vessel seized_on_land danish if A20andover & danish==0
regress Days_in_captivity Height danish C1807 C1808 C1809 C1810 C1811 C1812
Days_between_capture_and_custody Craftsman Officer other Military_Navy Privateer
unknown_vessel_type English_vessel seized_on_land exchanged escaped died A12andless
A13 A14 A15 A16 A17 A18 A19 A30s A40s A50plus Hx05 if transferred ==0 & C1814==0
& danish
regress Days_in_captivity Height danish C1807 C1808 C1809 C1810 C1811 C1812
Days_between_capture_and_custody Craftsman Officer other Military_Navy Privateer
unknown_vessel_type English_vessel seized_on_land exchanged escaped died A12andless
A13 A14 A15 A16 A17 A18 A19 A30s A40s A50plus Hx05 if transferred ==0 & C1814==0
& danish==0
33
probit died Days_in_captivity A30s A40s A50s A60_ Height Craftsman Officer other
Merchant Privateer unknown_vessel_type danish C1809 C1810 C1811 C1812 C1813 if
A20andover
probit died Days_in_captivity A30s A40s A50s A60_ Height Craftsman Officer other
Merchant Privateer unknown_vessel_type danish C1809 C1810 C1811 C1812 C1813 if
A20andover & danish
probit died Days_in_captivity A30s A40s A50s A60_ Height Craftsman Officer other
Merchant Privateer unknown_vessel_type danish C1809 C1810 C1811 C1812 C1813 if
A20andover & danish==0
mean(Height) if A20andover
* gives 65.66871
mean(danish) if A20andover
* gives 0.3415099
*takes the regression for all obs and inserts mean Height, mean Danish variables, and the
relevant number of days, to work out effect of being on the hulk for another year
*assumes captured in 1808, seaman, military ship
display -4.854959+ .0419273*65.66871+ .0490206 *0.3415099+ 0.0001609*365*0
* gives -2.0849063
display -4.854959+ .0419273*65.66871+ .0490206 *0.3415099+ 0.0001609*365*1
* gives -2.0261778
display -4.854959+ .0419273*65.66871+ .0490206 *0.3415099+ 0.0001609*365*2
* gives -1.9674493
display -4.854959+ .0419273*65.66871+ .0490206 *0.3415099+ 0.0001609*365*3
* gives -1.9087208
display normal(-2.0849063)
* gives .0185389
display normal(-2.0261778)
* gives .02137328
display normal(-1.9674493)
* gives .02456572
display normal(-1.9087208)
*gives .02814906
*to get the change in the chance of dying, do a subtraction of the results of the display normal.
*0 to 1:
34
display (normal(-2.0261778) - normal(-2.0849063))
*1 to 2
display (normal(-2.0849063) - normal(-1.9674493))
*2 to 3
display (normal(-1.9674493) - normal(-1.9087208))
*nb a result of 0.001 means 0.1%
* Now does likewise to find effect of privateer variable, on all, and then on Danes.
* Assumptions as per last, assumes 3 year stay
* ALL sailors:
display -4.854959+ .0419273*65.66871+ .0490206 *0.3415099+ 0.0001609*365*3
display normal(-1.9087208)
* gives .02814906, i.e. 2.8% chance of a military ship sailor dying
display -4.854959+ .0419273*65.66871+ .0490206 *0.3415099+ 0.0001609*365*3 +
0.2841024
display normal(-1.6246184)
* gives .05212195 - i.e. a ~5% chance of death for privateers
display (normal(-1.6246184) - normal(-1.9087208))
* gives .02397289, i.e. a 2.4 %pp increase in death rate for privateers cf military sailors.
* Danes only:
display -6.048599 + .0590138 *65.66871 + .0001799 * 365 *3
* gives -1.9762484
. display normal(-1.9762484)
* gives .02406333, i.e. 2.4% chance of military sailors dying
. display -6.048599 + .0590138 *65.66871 + .0001799 * 365 *3 + .5130807
* gives -1.4631677
. display normal(-1.4631677)
* gives .07171075, i.e a ~7% chance of privateer sailor dying
. display (normal(-1.4631677) - normal(-1.9762484))
* gives .04764742, i.e. a 4.8%pp increase in death rate for privateers cf military sailors