how can we make public transportation more efficient in
TRANSCRIPT
Across the Spectrum of Socioeconomics Volume 1 Issue 4 DOI: 10.5281/zenodo.4740623
_____________________________________________________________________________________
_____________________________________________________________________________________
International Socioeconomics Laboratory Pages 1-27 2021. All Rights Reserved Page 1
How can we make public transportation more efficient in the
United States for workers over 16?
Alan Shnir, Maya Dunayer, Hasib Shaif, Vishal Kothari, Eri Dumesh, Renee Fishler, Josie
Nakatani, Alan Goldengur
Affiliation: International Socioeconomics Laboratory and Northeastern University
______________________________________________________________________________
Abstract There is a long history of American transport, for the most significant parts of history, such as the
transcontinental railroad, marks an important change that would change society forever. Railroads
and public transport have aided civilians to travel, trade, and spread religions, contributing to
continual advanced and revolutionary changes regarding modern technology. After collecting
data from two cities in each of the fifty states, we utilized an equation to derive the efficiency of a
city’s transportation system by examining the variables of a number of passengers transported
daily, total working population, and the median commute time. The budget per capita for each
city’s transportation system and the annual snowfall was also examined, and all data was
collected from the United States Census and public transit authority records. Throughout the data,
the researched variables have proven their significance to the efficiency of transit systems across
the country. The research shows that there is little correlation to total working population and
budget of transit systems. Another variable that does not affect the efficiency is average snowfall
per city. However, there are proven effects of spending per person and efficiency; the research
shows a large correlation.There are several different correlations that the variables have with one
another. These relationships play a major part in the efficiency of the public transportation system
of these cities.
______________________________________________________________________________
Categories: Public transportation, MTA, Economy
Key Words: MTA, Economy, Optimization
Across the Spectrum of Socioeconomics Volume 1 Issue 4 DOI: 10.5281/zenodo.4740623
_____________________________________________________________________________________
_____________________________________________________________________________________
International Socioeconomics Laboratory Pages 1-27 2021. All Rights Reserved Page 2
Background/Literature Review
American transportation was revolutionized by the invention of the steam-powered
locomotive, allowing Americans to build massive railroad networks. These American
steam powered locomotives were pioneered by John Stevens, who received the first
charter for a railroad in North America in 1815. Initial railroad systems were no more
than horse drawn cars running on tracks that transported freight for short distances. It
was not until 1830 that the first mechanical passenger train was completed, setting off a
period of rapid railroad expansion that transformed the transportation industry in the
United States. By 1850, over 9,000 miles of track had been laid across the United States,
and companies adapted a standardized locomotive model and track that allowed railroads
to be connected easily. As the railroad industry boomed in conjunction with the steel and
oil industries, many smaller railroad companies began to conglomerate into large
corporations that dominated the industry. Railroads played an essential role during the
Civil War as well, helping to shuttle supplies and reinforcements to faraway armies.
After the war was over and the country was united, at the very least in name, again, the
need for a railroad system that spanned the country was readily apparent. The
Transcontinental Railroad, completed in 1869, was not only a symbol of the newly united
nation, but an enabler of trade that allowed goods and passengers to be moved across the
country faster than ever before. This ushered in a new age of industrialization that
fundamentally altered the American economy. With every new decade, new
technological advances made railroad systems more advanced, and labor unions and
corporations grappled with terms of employment and new regulations. In 1897, the
Tremont Street Subway opened in Boston, making it the first subway system in North
America. An effective solution to congestion on the streets, cities across the United
States began building subways of their own, slowly replacing the above ground railroads
until the modern-day subway systems in use today were developed.
History of the MTA
The MTA is the leading public transport system in the state of New York. Up until the early
1950s, New York was facing an economic crisis that took a toll on its public transportation
system, as they had to manage a system with a annual budget of $50 million, which would be
$500 million today. With no legislation on the public transport system, many conflicts arose in
the industry, with independent subway lines competing with private companies. All in all, until
the formation of an official transit authority, the state of public transport was in disarray (Gelinas,
2019). The original New York City Transit Authority, referred to as the NYCTA, or the TA for
short), was founded in 1953.A public corporation, the TA took full responsibility for public travel
in New York City, including all city-owned buses, trains, and trolleys in use at the time (Cook,
2016). However, the modern-day Metropolitan Transit Authority did not emerge for another
decade and a half. Within this fifteen-year period, many advancements were made to improve the
New York public transportation structure, including new track connections in the subway,
Across the Spectrum of Socioeconomics Volume 1 Issue 4 DOI: 10.5281/zenodo.4740623
_____________________________________________________________________________________
_____________________________________________________________________________________
International Socioeconomics Laboratory Pages 1-27 2021. All Rights Reserved Page 3
discontinuation of trolley cars, air conditioning in trains and buses, and extensions for both the
subway and city buses (Cook, 2016). Despite these accomplishments, the fiscal deficit had hardly
improved. The TA was able to borrow against future revenues and purchase any needed
equipment for public transit. The TA’s independence was intended to introduce a sense of “fiscal
discipline” to create a fare rate that would be self-sustaining for the subway. Despite these
measures, this authoritative structure of the TA ultimately failed. With maintenance costs rapidly
escalating, the fare that the TA originally hoped to be “self-sustaining” was unable to cover the
costs of running the system. In fact, the significant gap between the costs and the profits
continued to grow. In order to salvage the situation, the New York state government needed to
step in (Gelinas, 2019). In 1968, the MTA was finally created by Governor Nelson Rockefeller
and the New York Legislature. This newly created organization oversaw twelve New York
counties, and was identified as the parent agency to the New York City Transit Authority (Cook,
2016).
Although the MTA was created to help the New York transportation system reach financial
stability, public transportation ridership decreased drastically when the MTA was first
introduced. The initial plan of action was to increase the fare from twenty cents to thirty cents, as
the previous “self-sustaining” fare plan was deemed ineffective. Immediately after the fare
increase, the MTA saw a drop in public transport ridership. The fare increase was designed to
help shrink the large financial gap between the MTA’s expenditures and revenue. . . However,
the increase did not have the effects its proprietors hoped for. The fare discouraged ridership, and
New York public transport hit its darkest point. The subway in the 1970s was underfunded and
under maintained, as it was very dirty, covered in graffiti, and had a high crime rate. Many
upgrades and maintenance arrangements that were established in the 1960s under the TA were
suspended during the 1970s. In 1979, persuaded by the high rate of crime in the New York City
subways, Mayor Ed Koch organized a panel to discuss solutions to the rapidly worsening transit
crisis. In the coming decade, the MTA was able to make drastic improvements. The corporation
was able to create graffiti-free, stainless steel train cars, an improved lighting system, and a new
force of police officers to ensure fewer crimes on the subway. As a result of these improvements,
ridership began to increase. In the 1990s, the MetroCard was introduced, discontinuing the
subway tokens that had been used up to the point; this made riding the subway and other
transportation services more efficient. Many further improvements were made to MTA t services,
with new technological improvements, more attentive law enforcement, safety measures, subway
line expansions, and new subway routes created (Ormsbee, 2004). Today, the MTA has evolved
to be the leading state-wide transit system, carrying an average of 5.5 million New Yorkers every
weekday.
MTA Budget in the Past
In the past, the MTA budget has been severely criticized, with increased spending correlating to
increased debt. Back in 2007, a projected $800 million deficit was on course to reach $1.1 billion
in total losses by 2010. Yet, after the economic crash of 2008, this “expected-dent” in financial
planning skyrocketed. Since then, many efforts have been made to restore the workforce and
transport system. In 2008, plans were made to increase the retirement age, allowing for less MTA
workers to be employed.
Across the Spectrum of Socioeconomics Volume 1 Issue 4 DOI: 10.5281/zenodo.4740623
_____________________________________________________________________________________
_____________________________________________________________________________________
International Socioeconomics Laboratory Pages 1-27 2021. All Rights Reserved Page 4
Similarly, over $200 million in pension payments were given out as soon as possible, with risks
of inflation looming. While pre-purchase agreements for fuel and metallic parts were able to save
over $300 million that year alone, the situation only got worse by 2010. Two years later, the
MTA budget began taking more hits alongside revenue losses. To compensate for this, EZ
created fines, bus subsidy reductions and utilized Inter-Agency loans.
However, no improvements were made. By 2017, national federal aid to the MTA reached over
$4 billion, yet layoffs alongside severe service cuts were made. In 2019, Long Island RailRoad
President Phil Eng even defended service cuts, which saved only $15 million yet offended all 4
counties. In the last 2 decades, what has become most intriguing though is the supply chain of the
MTA’s money. Now, dedicated taxes make up approximately 40% of the budget, when they only
accounted for 31% in 2013. The same goes for local and state subsidies, which have greatly risen
since farebox revenue has lessened. Over 15% of the MTA’s total budget, or $675 million, went
into debt payroll as of 2020. The developing issue of paying off this debt is a persistent issue in
any MTA financial decision, hence the impractical and delays of multiple vehicles across New
York City. While more money goes to overtime wages and pension plans, it seems as if labor and
production is on the decline.
Present Day Situation/Present Day Budget
Currently, the MTA system, like all businesses, follows COVID-19 regulations to keep citizens
nationwide healthy. The MTA schedule remains the same, but following the coronavirus
regulations, the MTA suggests that riders should keep their mask on at all times, use hand
sanitizer frequently, social distance from other riders, and, if possible, travel during less busy
times. Additionally, New Yorkers and public transportation users in North America can find what
the MTA does to follow coronavirus regulations on their side from reading the MTA service
website. The website states that the MTA continues to deep clean all stations and vehicles,
reminds riders to be precautionary towards the pandemic, and has available masks and hand
sanitizers at each station to ensure all passengers are healthy and safe (MTA Service during the
Coronavirus Pandemic, 2021). When the pandemic hit, the MTA suffered many losses and had
to change the system, budget, and policies altogether. From the beginning, some of the most
significant problems were a lack of precaution for the coronavirus and an increase in delays. For
instance, a New York Times article from April 2020 discusses a vast number of MTA workers
who died or got sick due to the virus. Specifically, due to the pandemic's sudden hit, 41 transit
workers died, and at least 6,000 fell ill. This led to an unexpected crew shortage for the MTA.
That same month, there were over 800 subway delays, and over 40 percent of train trips were
canceled in a single day (Goldbaum, 2020). Now, the delays have decreased since last year, and
there are many more precautions and safety regulations that followed, unlike the previous year.
However, one major conflict currently discussed is the MTA's interchanging and conflicting
budget that has been contested for many years. For the past year, the MTA was set on increasing
the fee for passengers to ride trains and buses from $2.75 to $3.00, as well as hiking up the price
for purchasing a MetroCard from $1.00 to up to $3.00 (Chung, 2021).
As mentioned previously, there currently exists massive budgetary and cost inefficiencies within
the MTA. First, we see these massive inefficiencies when looking at the lack of adaptability for
adjusting to various situations. We saw this firsthand for 2020 and the impacts of coronavirus on
ridership in the MTA. The average daily ridership for the MTA in 2019 was at around 5.8 million
Across the Spectrum of Socioeconomics Volume 1 Issue 4 DOI: 10.5281/zenodo.4740623
_____________________________________________________________________________________
_____________________________________________________________________________________
International Socioeconomics Laboratory Pages 1-27 2021. All Rights Reserved Page 5
passengers per day. However, in 2020, the average daily ridership for the public transport system
had plummeted to only around 1.5 million daily passengers (MTA Info, 2021). Despite this
massive fall, the MTA budget did not decrease at all to account for this. In 2019, the budget for
the MTA was $16.7 billion. In 2020, the budget was $16.9 billion. In 2021, the proposed budget
is $18.4 billion. We see that even through a nearly 70% decline in ridership, the actual cost of the
MTA has only increased (MTA Budget, 2021). Decreased ridership would indicate decreased
maintenance costs, as less people would be using the public transportation system. However, we
did not see a decrease in non-labor related expenses, although they were not the main factor that
contributed to a rise in MTA cost. The 10% increase in MTA expenditures from 2019 to 2021
were due to a nearly $1.5 billion increase in labor costs. Overtime costs experienced an increase
of nearly 50 percent, white payroll costs had only seen a 3.5 percent increase. Health related costs
saw a ten percent increase, and other labor related costs saw a 50% increase as well. This massive
upsurge in labor costs and lack of ability to adjust to outside events has played a large role in the
many inefficiencies of the New York City Public Transit system.
Labor Situation
Issues of labor and maximizing the efficiency of MTA workers has also become a prevalent
issue. The Transport Workers Union is responsible for ensuring that the rights of urban transit
workers are protected across the country, but the Local 100 is specifically responsible for
ensuring that MTA workers are fairly compensated for their work. Under pressure of the Local
100, the MTA often hires many more workers than is needed for certain maintenance jobs,
causing the costs of labor to skyrocket. In addition, the MTA’s train system still relies on an
Automatic Block Signaling (ABS) system, which essentially divides the train tracks into
“blocks”. When a train is in a “block”, no other train can be in the same one, slowing down trains
significantly. Opting into a Communications Based Train Control (CBTC) system, which makes
use of telecommunications between the train and track equipment to allow trains to move faster,
would greatly improve the efficiency of the MTA system. Looking into semi-automated train
systems, which would allow the MTA to hire less workers and therefore cut down on exorbitant
labor costs, may also be a solution to the MTA’s massive debt problem.
Modern Day Problems
Among many economic issues, the MTA system in New York City suffers from pollution and
unintentionally provides shelter for the homeless population. Intensified by the coronavirus
pandemic, these problems affect the everyday lives of commuters in the city. Littered trash
contributes to about 700 fire-related incidents every year on the tracks. The trash also causes
flooding in the water system, where water flows because of the sewer system. The water build-up
can affect train signals and can even impair the electrical system used to keep trains running.
These problems cause major delays and can even stop an entire line for up to days at a time for
repairs. This does not include the lack of sanitation in the cars and between. The cold
temperatures force many homeless into the ventilated subway cars as a place to sleep and even
ride endlessly. Not only do people sleep on the trains, but some use the tracks in place of a toilet.
This is dangerous not only for passengers but MTA workers as well. As of October 25th, 2020,
126 MTA workers have died from the coronavirus. Rats have also been forced to seek a new
Across the Spectrum of Socioeconomics Volume 1 Issue 4 DOI: 10.5281/zenodo.4740623
_____________________________________________________________________________________
_____________________________________________________________________________________
International Socioeconomics Laboratory Pages 1-27 2021. All Rights Reserved Page 6
food source in the subway stations because of the closed restaurants. According to ABC7NY,
New York City is the “3rd rattiest city”. This lack of hygiene and close proximity is not only
dangerous but affects the number of people who want to use public transportation over other
modes.
The MTA also deals with financial problems within the system. They have required emergency
funding and need billions of more dollars to keep running, which includes major changes to the
existing schedules. In order to keep the system running, an estimated 7200 people would lose
their jobs amid the pandemic. Bus service would need to be cut by up to 40% and wait times for
subways could drastically rise. This economic crisis also stands to affect commuters from outside
the city. Specific routes would need to close entirely. The pandemic has not helped the transit
system, as the number of people needing to commute plummeted leading to a loss in fare dollars.
A whopping 93% of usual riders stopped using the subways at the beginning of the pandemic. As
of September 2020, only a quarter of riders are back; however, riders are hesitant about even
going back to the subways after the pandemic. Violence and crime have risen, and dozens of
MTA workers have been harassed. Murders have taken place on ordinary train lines like the A
train that stretches between 2 boroughs. Hundreds of more police officers are said to facilitate
everyday travel, but many still do not feel safe. These modern-day problems only pose more need
for change in the question of “How can we make public transportation more efficient in the
United States?”
Comparison to other US transit systems
Past research has often focused on supply-side efficiency when measuring the efficiency of a
system like the MTA or other worldwide and U.S. public transits. However, by focusing on the
demand-side efficiency, researchers can produce more accurate results for multiple reasons. For
example, the United States Bureau of Labor Statistics gives an illustrating example by saying “an
outside observer would likely consider a bus full of passengers to be producing more output than
an empty bus. However, a measure of output based on vehicle hours in service would count them
the same (Chansky, 2018). New York City may have the largest transit system, but that does not
necessarily mean it has the most efficient system. A worldwide comparison of efficiency that
compared overarching urban mobility using five measures of success found that only two U.S.
cities made the top ten list. In a measure of “Availability, Affordability, Efficiency, Convenience
and Sustainability”, the researchers found that Chicago and New York make the worldwide top
ten with Chicago edging New York out by 1.1% (Knupfer 2018). This study showed that New
York’s system is lacking in efficiency in comparison to the rest of the world and is not even the
most efficient in the United States.
A study by the Mineta Transportation Institute triangulated New York’s public transit system to a
ranking in comparison with other states. A transport system is present in almost every densely
populated city in America, and each one has differences in its operating technique. Public
transport systems around the United States have different amounts of privatization, different
operating budgets, and different goals. Privatization has been heavily suggested as an
improvement in many public transport systems, and the subject of many research studies and
debates, but there has not been a significant correlation between the amount privatized and
Across the Spectrum of Socioeconomics Volume 1 Issue 4 DOI: 10.5281/zenodo.4740623
_____________________________________________________________________________________
_____________________________________________________________________________________
International Socioeconomics Laboratory Pages 1-27 2021. All Rights Reserved Page 7
efficiency. Other factors that go into a public transport system’s efficiency are if the system is
state-owned or city-owned, the types of transportation vehicles it uses, and the size of its
workforce. McKinsey approached their experiment by finding a value for the Super Efficiency of
each state. “Super Efficiency” was calculated by dividing the Technical Efficiency of the public
transport system by the Pure Technical Efficiency. New Hampshire had the highest by far, with
1.875. The scores slump down after with Wyoming having 1.225, Mississippi having 1.009, and
then finally New York having a score of 1.003. The results showed that mass transit systems that
made use of van-pooling services or Ride-Share programs tended to perform better, whereas
mass transit systems that used light-rail heavily tended to perform poorly (Hokey, 2017). All of
the top performers also tended to be open to partnerships with private enterprises. Commuter rail
and demand response taxis tended to create greater efficiencies than other modes of public
transportation such as trolley bus and light rail. The study further showed that privatization of
mass transit systems did not necessarily improve efficiency. The study showed that the efficiency
of a public transport system is often attributed to the vehicle types used.
The MTA is the leading public transport system in the state of New York. Founded in 1965 by
Nelson Rockefeller, the MTA continues to carry an average of 5.5 million New Yorkers every
weekday, helping them commute to their homes, school, work, or anywhere else (Zhang, 2015).
Despite the accolade of being the top transit authority in one of the most densely populated cities
in the world, the MTA is still very far from reaching its potential for maximum efficiency. The
average commute time in New York City averages 53 minutes, taking the place as the city with
the longest average commute time, while San Diego has the shortest average commute time in
the United States, with an average of 26 minutes (Metro Magazine Staff, 2019). New York is also
identified as the least reachable city in the United States, with only 4% of commuters being able
to reach the city in less than thirty minutes due to the incredible traffic from regulars and tourists
and 6% of public transportation riders being able to reach the city in under thirty minutes (Metro
Magazine Staff, 2019). Compared to Minneapolis, identified as the most reachable city in the
United States with 31% of public transport riders being able to reach the city in under thirty
minutes, New York seemingly can improve significantly. The costs of building and maintaining
this transit system are staggeringly high compared to other major cities around the world. The
Second Avenue Subway took $1.7 billion per kilometer to build, while the MetroSur line in
Madrid, Spain, took $58 million per kilometer, a much lower cost than the construction of the
Second Avenue Subway (Sisson, 2017). With these various other large cities being able to
incorporate their public transport array so efficiently, it raises the question: How can the MTA
learn from this and make public transportation more efficient?
Material & Methods
We will collect data from two cities in each of the fifty states in the United States. In order to
determine the efficiency of a city’s public transportation system, the number of passengers
transported daily by the system will be divided by the overall number of commuters. This
number will then be divided by the median commute time in that city in order to determine an
efficiency rating for that city. We will also collect data on average snowfall, total budget, and
average spending per capita in order to determine whether weather conditions and a city’s
funding have an effect on that transportation system’s efficiency. All data will be compiled using
Across the Spectrum of Socioeconomics Volume 1 Issue 4 DOI: 10.5281/zenodo.4740623
_____________________________________________________________________________________
_____________________________________________________________________________________
International Socioeconomics Laboratory Pages 1-27 2021. All Rights Reserved Page 8
records from the United States census, as well as records from each city’s transportation authority
and weather data from each region.
Efficiency= (number of passengers transported daily/total working population)/median
commute time
E=(P/W)/M
P=Number of passengers transported daily
W=Working population
M= Median commute time
New York City is only one of many cities across the world that use public transportation systems.
This research study will choose other cities to compare to base on similar population sizes. New
York City has a population of about 8.5 million across the 5 boroughs, which is significantly
more than most cities with public transportation in the US. The cities with the closest consumer
usage to New York, which is 56 percent, are Jersey City, Washington, Boston, and San
Francisco. Out of these 19 cities, only some are useful for accurate testing because some have
spent more on public transportation than others, and typically those that spend more are better.
These cities must be close to or less than that 15 billion dollars per year that the MTA spends on
transportation.
Public transportation has been around for a very long time and is very beneficial to millions of
Americans to the point where it has become a lifeline for them. With public transportation,
civilians from all over the world are able to connect with people and places. As well as bringing
connections and transporting individuals to their desired destinations, public transportation eases
traffic congestion and promotes a cleaner environment, according to a publication made by the
American Public Transportation Association. However, since transport systems are so important
to society, how many commuters are there that use public transportation such as trolleys, trains,
buses, cable cars, etc? Statistics show that in 2019, 9.9 billion trips were made by Americans,
using public transportation. Additionally, since there are many ways, we can utilize public
transportation in our lives, our statistics will show the main transit systems used by American
workers, students, and others. For instance, according to a Bloomberg CityLab report, only five
percent of American commuters use transit daily to get to work. There are many statistics shown
on a vast range of websites, reports, and publications, this will help us conduct our survey as well
as ask around how beneficial public transportation is for you.
In order to compare the efficiencies of cities around the country, there are many factors we need
to consider. One of these factors is the distribution of public transportation throughout a given
city. For example, New York City consists of 5 boroughs and reaches out further into the tri-state
area. However, the availability of stations is much larger in Manhattan. This inequality between
areas is not uncommon when considering major cities. The layout of stations also affects
minority communities directly. Because of this, we will be using maps of bus, train, subways,
and other modes of public transportation in different cities to evaluate the number of passengers
that need more resources in order to get from place to place. This will include the lines and stops
and the percentage of land that is covered in the specific city. Across the United States, different
transit systems have countless variables that influence efficiency and differentiate their systems
Across the Spectrum of Socioeconomics Volume 1 Issue 4 DOI: 10.5281/zenodo.4740623
_____________________________________________________________________________________
_____________________________________________________________________________________
International Socioeconomics Laboratory Pages 1-27 2021. All Rights Reserved Page 9
from others. A transit system has the choice of using countless different modes of transport. New
York City, for example, has buses, railroads, subways, e-bikes, and ferries. Other systems like
San Francisco and Boston have light-rail trolley or tram systems. The combination of choices of
different modes of transport is a vital variable in changing the efficiency of a transit system.
Light-Rail has been shown to have a strong correlation with lowering the efficiency of a transport
system. This can be attributed to their low speed and low capacity. Railroads and subways, in
comparison, are considerably faster and make less stops while transporting more people. Light-
Rail also brings risks and setbacks, as there is always a risk of a pedestrian being in the way of or
hit by a tram or trolley. This risk is much greater in trolleys/trams than in railroads and subways,
as they are incorporated into pedestrian walkways. This directly brings a higher risk in delay
time, thus lowering efficiency. Meanwhile, ridesharing means of public transport has been shown
to correlate with increased efficiency. While the public bus is the most common ride-sharing
method, there are other methods such as vanpooling that has been incorporated in cities across
the world. Measuring the most common mode of transport of a transit system produces valuable,
usable data. We can compare our measured efficiency with the most common mode of transport
and see if we find patterns across different cities. If the least efficient transit systems all have the
same primary mode of transport, we can suggest increases based on this data.
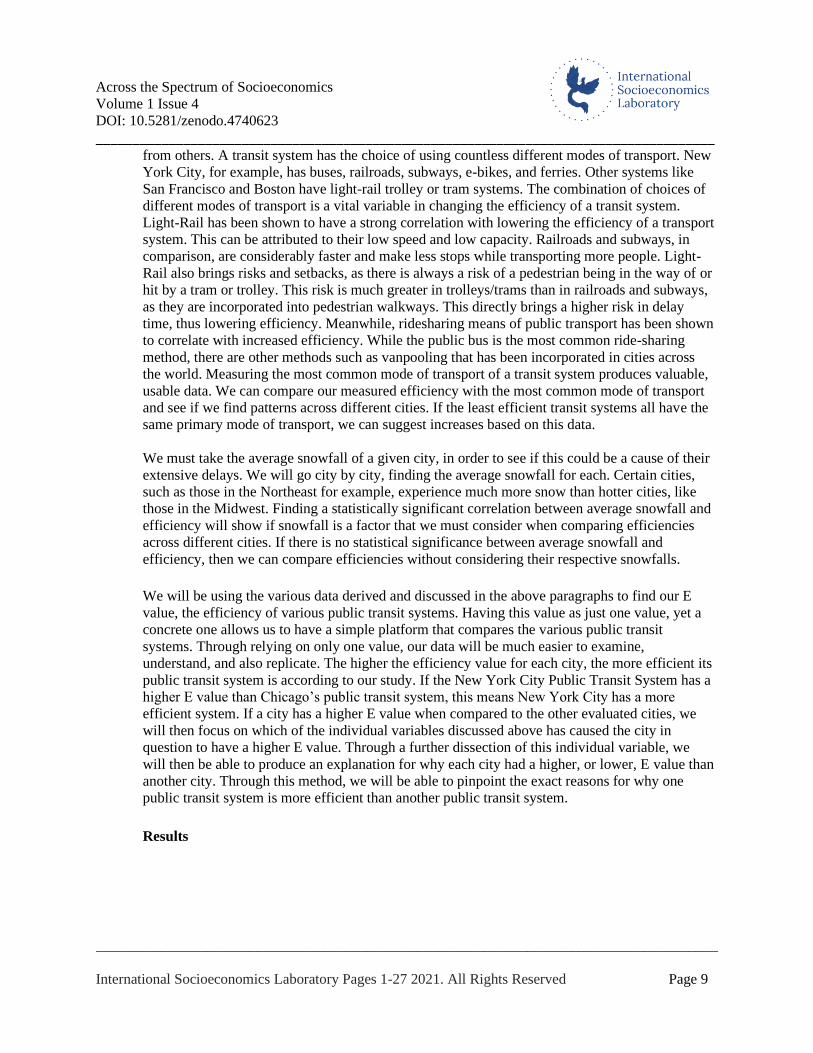
We must take the average snowfall of a given city, in order to see if this could be a cause of their
extensive delays. We will go city by city, finding the average snowfall for each. Certain cities,
such as those in the Northeast for example, experience much more snow than hotter cities, like
those in the Midwest. Finding a statistically significant correlation between average snowfall and
efficiency will show if snowfall is a factor that we must consider when comparing efficiencies
across different cities. If there is no statistical significance between average snowfall and
efficiency, then we can compare efficiencies without considering their respective snowfalls.
We will be using the various data derived and discussed in the above paragraphs to find our E
value, the efficiency of various public transit systems. Having this value as just one value, yet a
concrete one allows us to have a simple platform that compares the various public transit
systems. Through relying on only one value, our data will be much easier to examine,
understand, and also replicate. The higher the efficiency value for each city, the more efficient its
public transit system is according to our study. If the New York City Public Transit System has a
higher E value than Chicago’s public transit system, this means New York City has a more
efficient system. If a city has a higher E value when compared to the other evaluated cities, we
will then focus on which of the individual variables discussed above has caused the city in
question to have a higher E value. Through a further dissection of this individual variable, we
will then be able to produce an explanation for why each city had a higher, or lower, E value than
another city. Through this method, we will be able to pinpoint the exact reasons for why one
public transit system is more efficient than another public transit system.
Results
Across the Spectrum of Socioeconomics Volume 1 Issue 4 DOI: 10.5281/zenodo.4740623
_____________________________________________________________________________________
_____________________________________________________________________________________
International Socioeconomics Laboratory Pages 1-27 2021. All Rights Reserved Page 10
Average snowfall per region according to our data
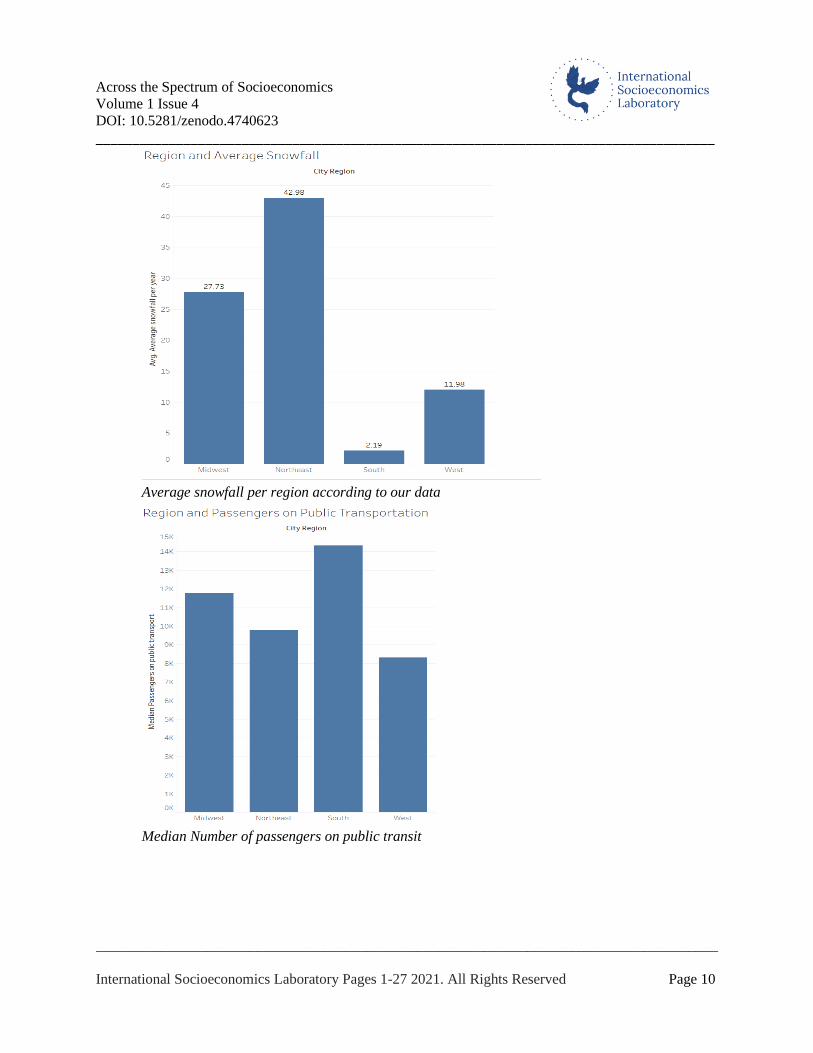
Median Number of passengers on public transit
Across the Spectrum of Socioeconomics Volume 1 Issue 4 DOI: 10.5281/zenodo.4740623
_____________________________________________________________________________________
_____________________________________________________________________________________
International Socioeconomics Laboratory Pages 1-27 2021. All Rights Reserved Page 11
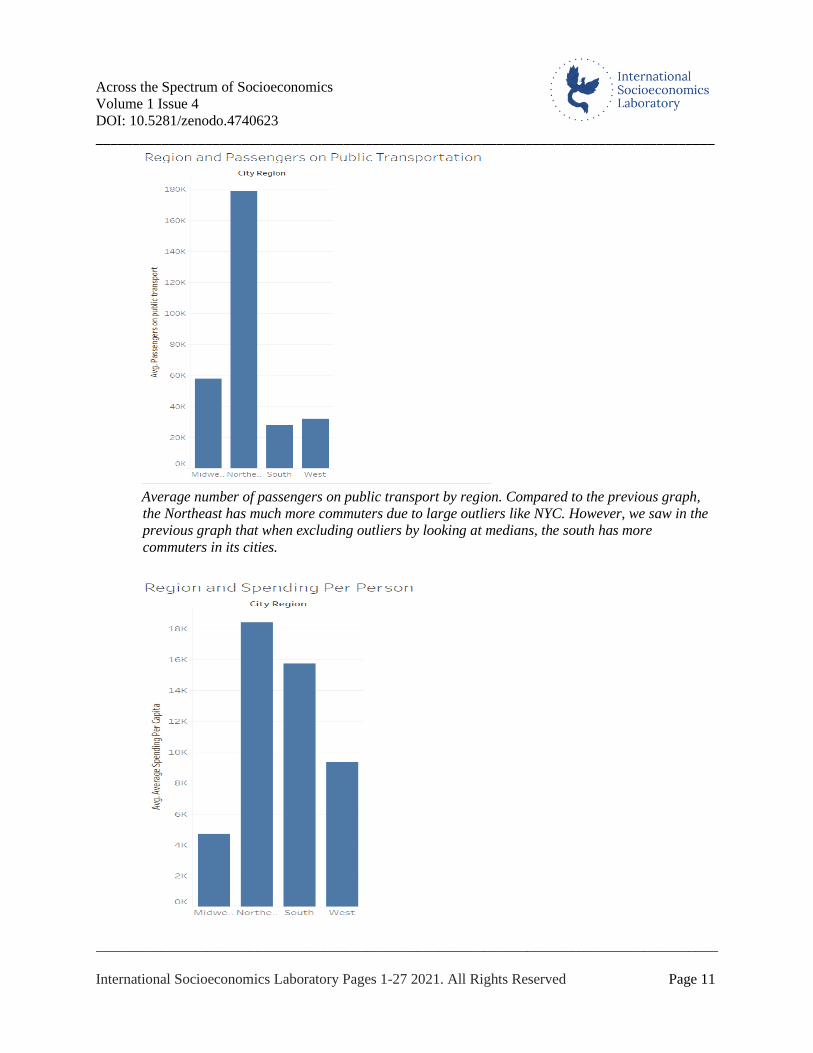
Average number of passengers on public transport by region. Compared to the previous graph,
the Northeast has much more commuters due to large outliers like NYC. However, we saw in the
previous graph that when excluding outliers by looking at medians, the south has more
commuters in its cities.
Across the Spectrum of Socioeconomics Volume 1 Issue 4 DOI: 10.5281/zenodo.4740623
_____________________________________________________________________________________
_____________________________________________________________________________________
International Socioeconomics Laboratory Pages 1-27 2021. All Rights Reserved Page 12
Spending per person for public transport by region.
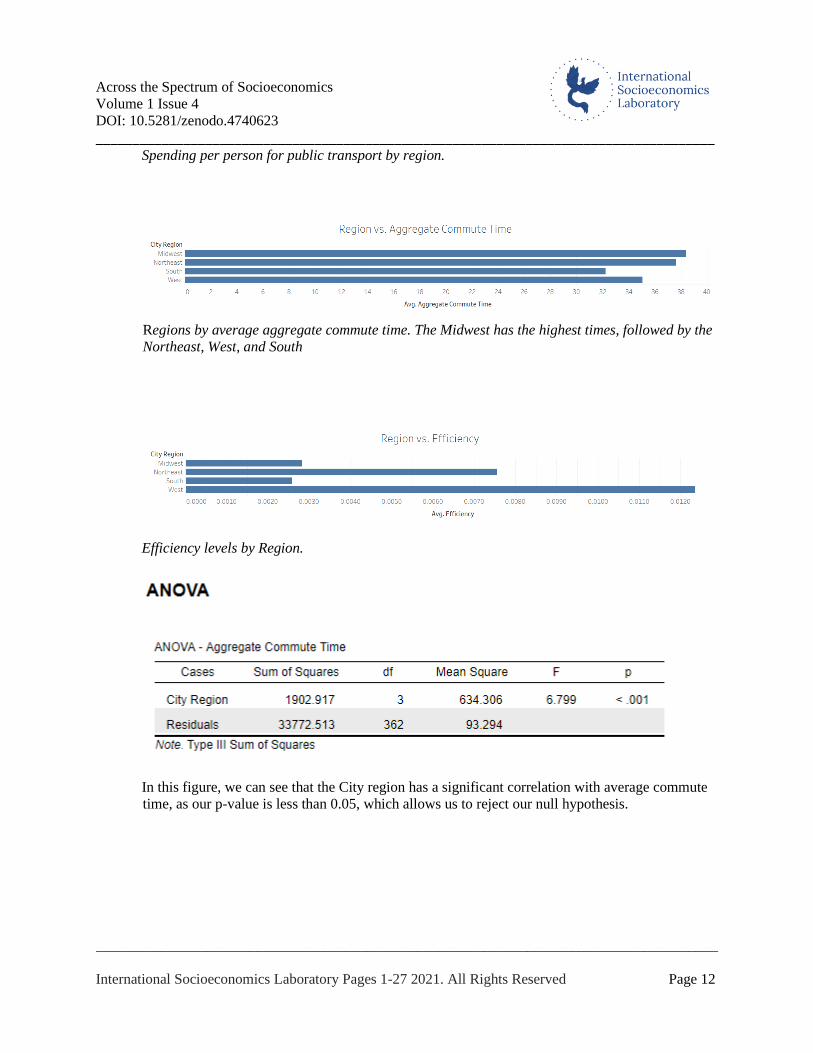
Regions by average aggregate commute time. The Midwest has the highest times, followed by the
Northeast, West, and South
Efficiency levels by Region.
In this figure, we can see that the City region has a significant correlation with average commute
time, as our p-value is less than 0.05, which allows us to reject our null hypothesis.

Across the Spectrum of Socioeconomics Volume 1 Issue 4 DOI: 10.5281/zenodo.4740623
_____________________________________________________________________________________
_____________________________________________________________________________________
International Socioeconomics Laboratory Pages 1-27 2021. All Rights Reserved Page 13
We see in this figure the average snowfall and commute time per region. The regions in order of
most snowfall to least was Northeast, Midwest, West, and South. The regions by order of average
commute time from greatest to least were Midwest, Northeast, West, and South.
The regions by most Efficient to least are the West, Northeast, and South tied with Midwest.
Regions with highest average working population in cities from greatest to least are South, West,
Northeast, and Midwest.
Across the Spectrum of Socioeconomics Volume 1 Issue 4 DOI: 10.5281/zenodo.4740623
_____________________________________________________________________________________
_____________________________________________________________________________________
International Socioeconomics Laboratory Pages 1-27 2021. All Rights Reserved Page 14
Regions from greatest to least spending per public transportation use were South, West,
Northeast, and Midwest. By public transportation mean users from greatest to least, the regions
are West, Northeast, Midwest, South (the Northeast and West are much larger here due mainly to
large outliers such as Los Angeles and New York City).
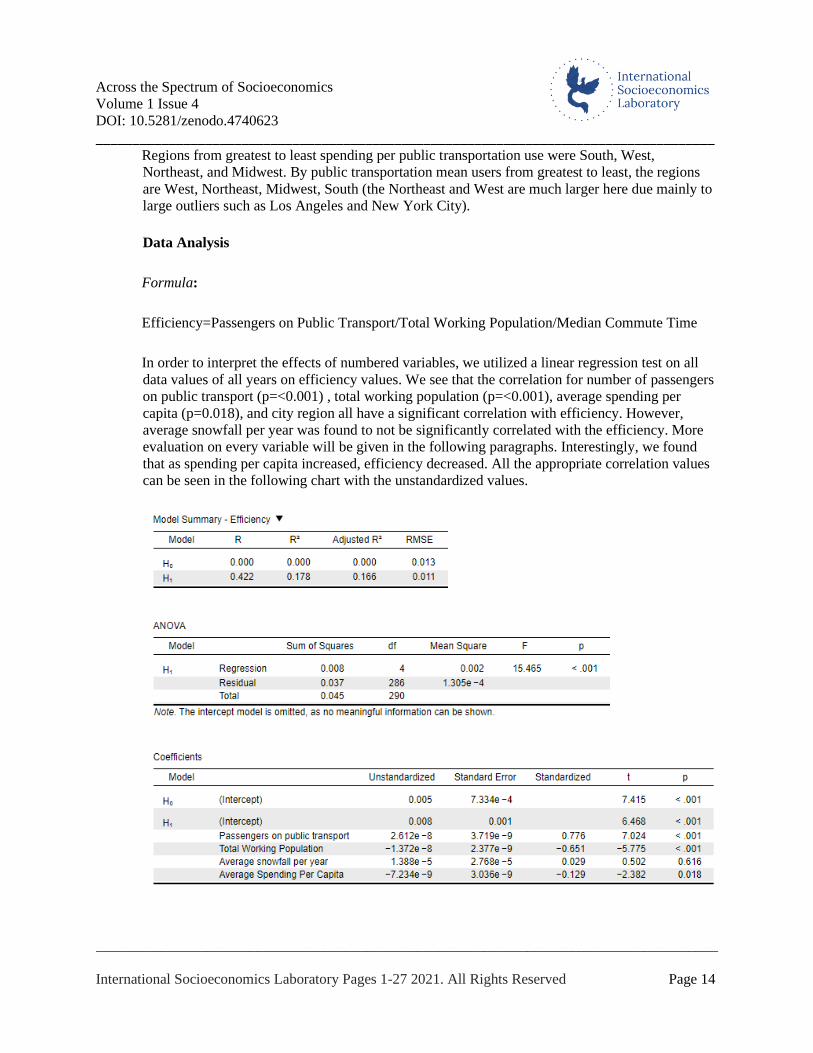
Data Analysis
Formula:
Efficiency=Passengers on Public Transport/Total Working Population/Median Commute Time
In order to interpret the effects of numbered variables, we utilized a linear regression test on all
data values of all years on efficiency values. We see that the correlation for number of passengers
on public transport (p=<0.001) , total working population (p=<0.001), average spending per
capita (p=0.018), and city region all have a significant correlation with efficiency. However,
average snowfall per year was found to not be significantly correlated with the efficiency. More
evaluation on every variable will be given in the following paragraphs. Interestingly, we found
that as spending per capita increased, efficiency decreased. All the appropriate correlation values
can be seen in the following chart with the unstandardized values.
Across the Spectrum of Socioeconomics Volume 1 Issue 4 DOI: 10.5281/zenodo.4740623
_____________________________________________________________________________________
_____________________________________________________________________________________
International Socioeconomics Laboratory Pages 1-27 2021. All Rights Reserved Page 15
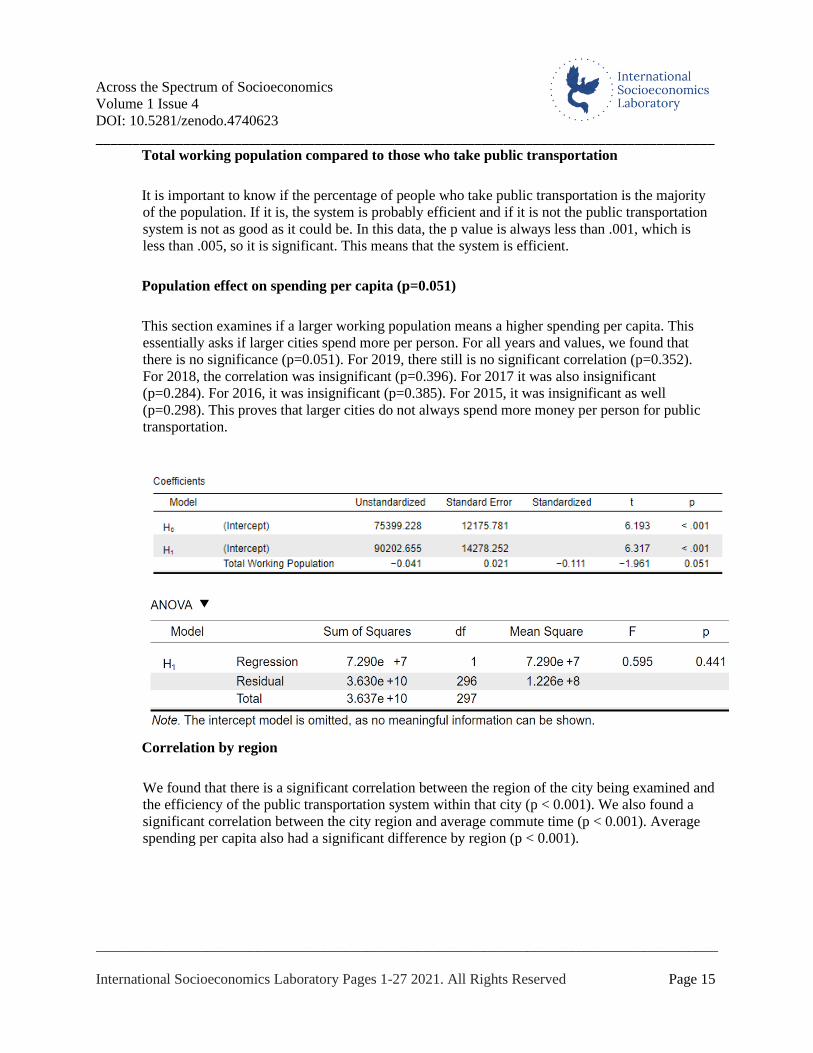
Total working population compared to those who take public transportation
It is important to know if the percentage of people who take public transportation is the majority
of the population. If it is, the system is probably efficient and if it is not the public transportation
system is not as good as it could be. In this data, the p value is always less than .001, which is
less than .005, so it is significant. This means that the system is efficient.
Population effect on spending per capita (p=0.051)
This section examines if a larger working population means a higher spending per capita. This
essentially asks if larger cities spend more per person. For all years and values, we found that
there is no significance (p=0.051). For 2019, there still is no significant correlation (p=0.352).
For 2018, the correlation was insignificant (p=0.396). For 2017 it was also insignificant
(p=0.284). For 2016, it was insignificant (p=0.385). For 2015, it was insignificant as well
(p=0.298). This proves that larger cities do not always spend more money per person for public
transportation.
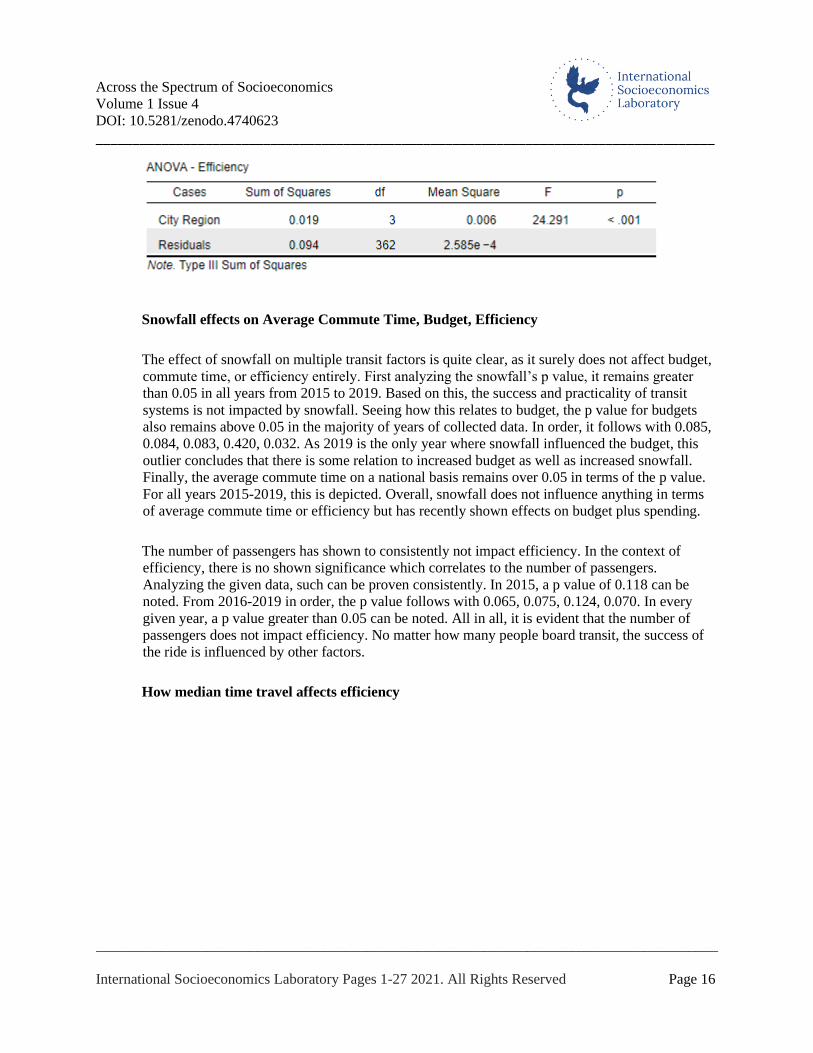
Correlation by region
We found that there is a significant correlation between the region of the city being examined and
the efficiency of the public transportation system within that city (p < 0.001). We also found a
significant correlation between the city region and average commute time (p < 0.001). Average
spending per capita also had a significant difference by region (p < 0.001).
Across the Spectrum of Socioeconomics Volume 1 Issue 4 DOI: 10.5281/zenodo.4740623
_____________________________________________________________________________________
_____________________________________________________________________________________
International Socioeconomics Laboratory Pages 1-27 2021. All Rights Reserved Page 16
Snowfall effects on Average Commute Time, Budget, Efficiency
The effect of snowfall on multiple transit factors is quite clear, as it surely does not affect budget,
commute time, or efficiency entirely. First analyzing the snowfall’s p value, it remains greater
than 0.05 in all years from 2015 to 2019. Based on this, the success and practicality of transit
systems is not impacted by snowfall. Seeing how this relates to budget, the p value for budgets
also remains above 0.05 in the majority of years of collected data. In order, it follows with 0.085,
0.084, 0.083, 0.420, 0.032. As 2019 is the only year where snowfall influenced the budget, this
outlier concludes that there is some relation to increased budget as well as increased snowfall.
Finally, the average commute time on a national basis remains over 0.05 in terms of the p value.
For all years 2015-2019, this is depicted. Overall, snowfall does not influence anything in terms
of average commute time or efficiency but has recently shown effects on budget plus spending.
The number of passengers has shown to consistently not impact efficiency. In the context of
efficiency, there is no shown significance which correlates to the number of passengers.
Analyzing the given data, such can be proven consistently. In 2015, a p value of 0.118 can be
noted. From 2016-2019 in order, the p value follows with 0.065, 0.075, 0.124, 0.070. In every
given year, a p value greater than 0.05 can be noted. All in all, it is evident that the number of
passengers does not impact efficiency. No matter how many people board transit, the success of
the ride is influenced by other factors.
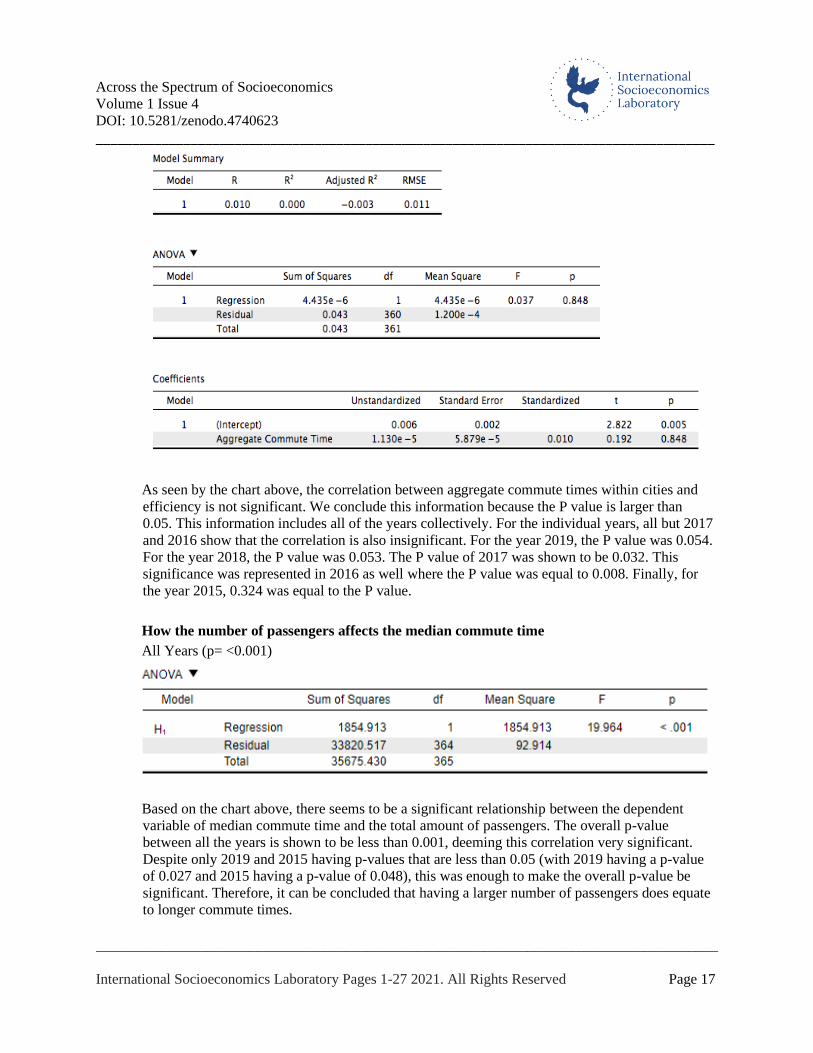
How median time travel affects efficiency
Across the Spectrum of Socioeconomics Volume 1 Issue 4 DOI: 10.5281/zenodo.4740623
_____________________________________________________________________________________
_____________________________________________________________________________________
International Socioeconomics Laboratory Pages 1-27 2021. All Rights Reserved Page 17
As seen by the chart above, the correlation between aggregate commute times within cities and
efficiency is not significant. We conclude this information because the P value is larger than
0.05. This information includes all of the years collectively. For the individual years, all but 2017
and 2016 show that the correlation is also insignificant. For the year 2019, the P value was 0.054.
For the year 2018, the P value was 0.053. The P value of 2017 was shown to be 0.032. This
significance was represented in 2016 as well where the P value was equal to 0.008. Finally, for
the year 2015, 0.324 was equal to the P value.
How the number of passengers affects the median commute time
All Years (p= <0.001)
Based on the chart above, there seems to be a significant relationship between the dependent
variable of median commute time and the total amount of passengers. The overall p-value
between all the years is shown to be less than 0.001, deeming this correlation very significant.
Despite only 2019 and 2015 having p-values that are less than 0.05 (with 2019 having a p-value
of 0.027 and 2015 having a p-value of 0.048), this was enough to make the overall p-value be
significant. Therefore, it can be concluded that having a larger number of passengers does equate
to longer commute times.
Across the Spectrum of Socioeconomics Volume 1 Issue 4 DOI: 10.5281/zenodo.4740623
_____________________________________________________________________________________
_____________________________________________________________________________________
International Socioeconomics Laboratory Pages 1-27 2021. All Rights Reserved Page 18
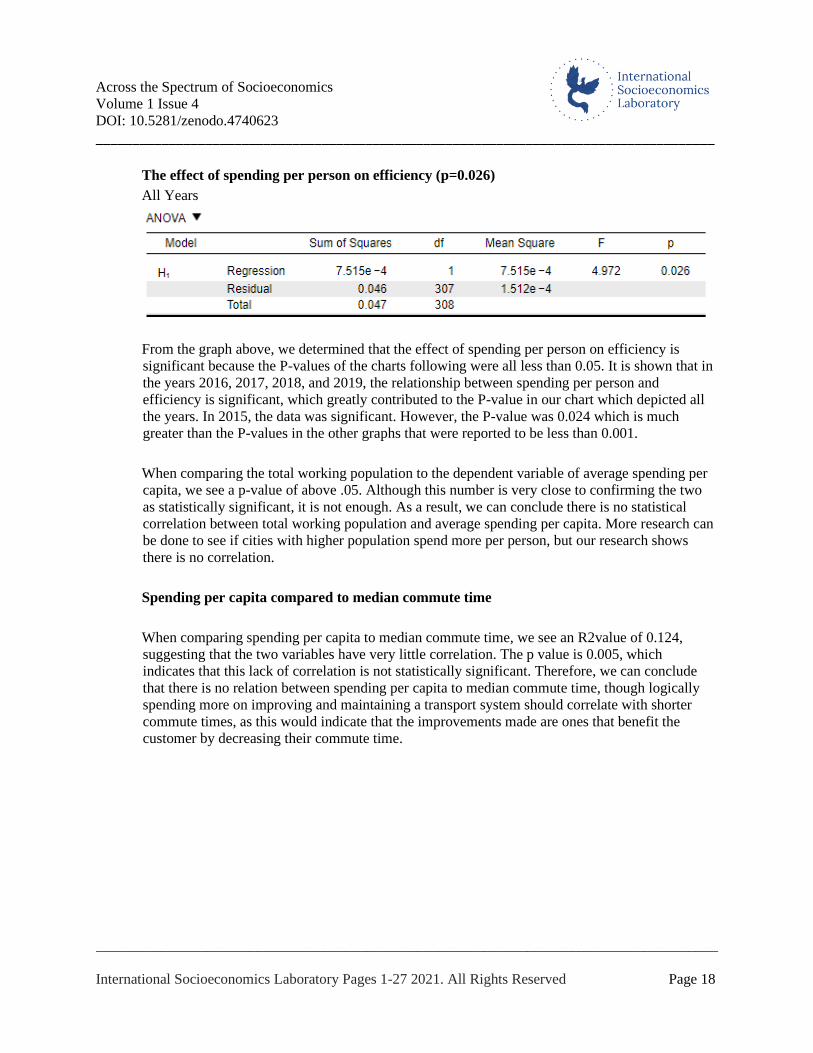
The effect of spending per person on efficiency (p=0.026)
All Years
From the graph above, we determined that the effect of spending per person on efficiency is
significant because the P-values of the charts following were all less than 0.05. It is shown that in
the years 2016, 2017, 2018, and 2019, the relationship between spending per person and
efficiency is significant, which greatly contributed to the P-value in our chart which depicted all
the years. In 2015, the data was significant. However, the P-value was 0.024 which is much
greater than the P-values in the other graphs that were reported to be less than 0.001.
When comparing the total working population to the dependent variable of average spending per
capita, we see a p-value of above .05. Although this number is very close to confirming the two
as statistically significant, it is not enough. As a result, we can conclude there is no statistical
correlation between total working population and average spending per capita. More research can
be done to see if cities with higher population spend more per person, but our research shows
there is no correlation.
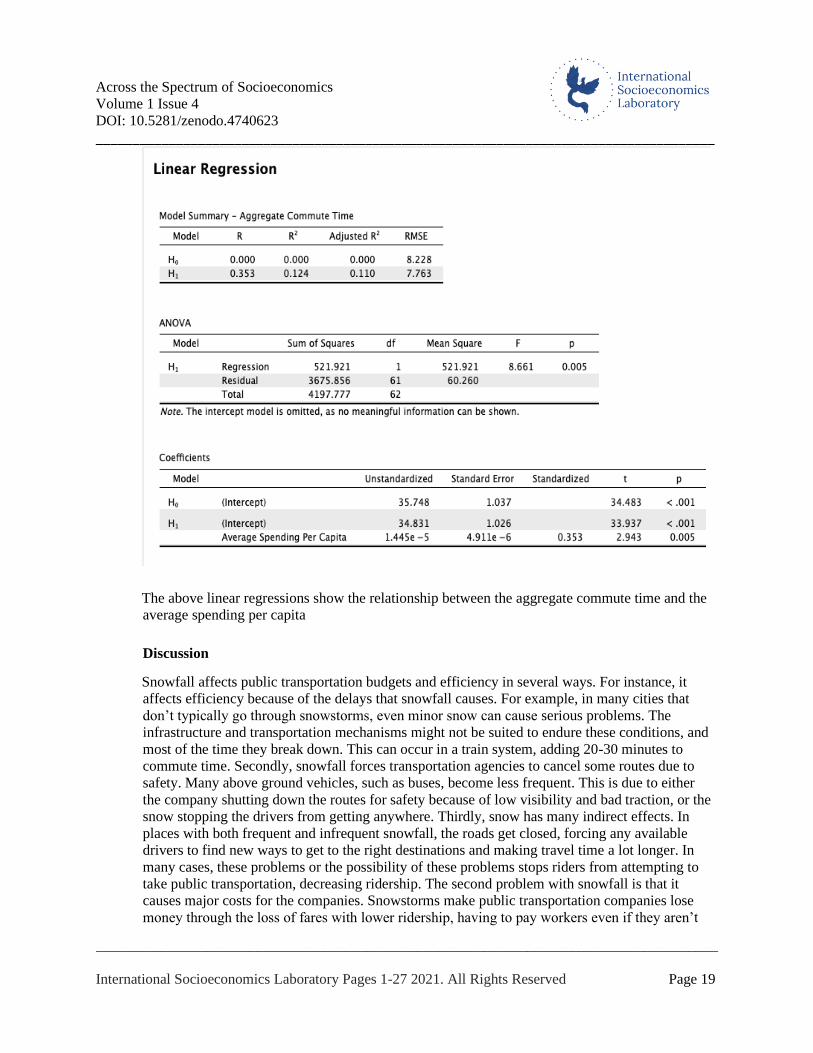
Spending per capita compared to median commute time
When comparing spending per capita to median commute time, we see an R2value of 0.124,
suggesting that the two variables have very little correlation. The p value is 0.005, which
indicates that this lack of correlation is not statistically significant. Therefore, we can conclude
that there is no relation between spending per capita to median commute time, though logically
spending more on improving and maintaining a transport system should correlate with shorter
commute times, as this would indicate that the improvements made are ones that benefit the
customer by decreasing their commute time.
Across the Spectrum of Socioeconomics Volume 1 Issue 4 DOI: 10.5281/zenodo.4740623
_____________________________________________________________________________________
_____________________________________________________________________________________
International Socioeconomics Laboratory Pages 1-27 2021. All Rights Reserved Page 19
The above linear regressions show the relationship between the aggregate commute time and the
average spending per capita
Discussion
Snowfall affects public transportation budgets and efficiency in several ways. For instance, it
affects efficiency because of the delays that snowfall causes. For example, in many cities that
don’t typically go through snowstorms, even minor snow can cause serious problems. The
infrastructure and transportation mechanisms might not be suited to endure these conditions, and
most of the time they break down. This can occur in a train system, adding 20-30 minutes to
commute time. Secondly, snowfall forces transportation agencies to cancel some routes due to
safety. Many above ground vehicles, such as buses, become less frequent. This is due to either
the company shutting down the routes for safety because of low visibility and bad traction, or the
snow stopping the drivers from getting anywhere. Thirdly, snow has many indirect effects. In
places with both frequent and infrequent snowfall, the roads get closed, forcing any available
drivers to find new ways to get to the right destinations and making travel time a lot longer. In
many cases, these problems or the possibility of these problems stops riders from attempting to
take public transportation, decreasing ridership. The second problem with snowfall is that it
causes major costs for the companies. Snowstorms make public transportation companies lose
money through the loss of fares with lower ridership, having to pay workers even if they aren’t
Across the Spectrum of Socioeconomics Volume 1 Issue 4 DOI: 10.5281/zenodo.4740623
_____________________________________________________________________________________
_____________________________________________________________________________________
International Socioeconomics Laboratory Pages 1-27 2021. All Rights Reserved Page 20
able to work properly or at all, as well as with repairs to any damage to vehicles or machines
used in the transportation. Even with the chance of them accounted for, snowstorms cost a lot of
money. For example, in New York City, snow is not an uncommon thing in the winter. However,
in 2011 a major snowstorm took place, shutting down almost all parts of the MTA, costing them
over 30 million dollars, not including repairs. However, it is even worse in places that don’t
typically get snow, such as cities in Texas and California. Because they do not have the necessary
preparations for these light snow falls that occur every few years, it costs them more in
reparations than their budgets can handle.
Using our data, we were able to calculate average spending per capita. This was done by dividing
the budget by the passengers on public transport. We ran a linear regression and an anova to see
if there was a correlation between the number of passengers and the amount the city spends per
person on public transport. There was no statistical significance between passengers on public
transport and average spending per person. However, we did notice some patterns in the average
spending per person when looking region by region. The Northeastern region spent an average of
$27,913.01 per person using their public transport system. The South region spent an average of
$24,152.34, and the West region had an average spending of $13,454.31. The Midwest region
stands out immensely with an average spending per capita of $123,012.61. This is most likely
due to the Midwest having the lowest ridership out of the regions. Areas like New York and
Boston in the Northeast have a much higher percentage on average of the total working
population riding on public transport than a city in the Midwest, like Lincoln, Nebraska. The
same can be said for Southern cities like Washington D.C. which has over ⅓ people in their
working population using public transport! Another factor to consider is that some regions are
willing to spend more on their transport system. Different systems have different levels of
efficiency. Light-Rail systems have been shown in previous studies to be the least efficient mode
of transport, while subways are considerably more efficient. It is entirely plausible that cities in
the Midwest have a much smaller need for more efficient transport systems like subways because
their cities are considerably less dense than areas like New York. Subways can provide
exponentially more rides and passengers than a tram or trolley system but could be impractical
due to the lack of density in midwestern cities. Light-Rail systems have the benefit of being
easier to construct and stretch to long distance but carry sizably less passengers. For less dense
cities that are found in the Midwest, it makes sense to build a light-rail system instead of a
subway, even if it is more efficient and costs more per person. A New Yorker can take the
subway many times in a day, as they traverse the city and stop by different sight-seeing locations.
Meanwhile, a light-rail system makes more sense for a small midwestern city, who’s occupants
only rely on public transport to get to work and home. Subways will provide considerably more
rides, but the Midwest does not have the density to support running as many lines and stops if
they build a subway in the first place. With more riders comes more money spent. New York is
willing to spend billions because their citizens will take many more subway rides than a person
trying to traverse through his hometown in the Midwest. This institution of less efficient systems
is the most plausible cause for the high spending-per-capita of the Midwest region.
In the United States of America, there are many different types of cities ranging from more urban
areas to rural. Because of this diversity, there are different population numbers such as New York
City which currently has a population of about 8.5 million people (not including the people who
commute in and out of the state every day) to 680,000 people in El Paso, Texas. This range in
Across the Spectrum of Socioeconomics Volume 1 Issue 4 DOI: 10.5281/zenodo.4740623
_____________________________________________________________________________________
_____________________________________________________________________________________
International Socioeconomics Laboratory Pages 1-27 2021. All Rights Reserved Page 21
population however does not necessarily correlate with the spread of people in the city. As New
York City is a very dense community it also lies in the Northeastern region. The Northeastern
part of the nation contains 11 states. There are 162,257 square miles of land in the northeast. This
can be compared to another region, the Midwest. The Midwest has 12 states, and it is 821,000
square miles. The landmass makes the Midwest compared to the size of Mexico. This
comparison can also be shown by population. The Northeast contains around 55,982,803 people
while the Midwest has 65,000,000. When you divide the population by the square miles for the
Midwest, you get the number 80246.9135802. When you use this equation for the Northeast, the
number is much smaller: 345.025502752. These numbers represent the disproportional
relationships between the population and amount of land throughout the country’s regions. This
pertains to transit systems as well because some cities will have to account for more areas and
more passengers, or vice versa. New York City, for example, takes into account 665 miles of
subway lines with countless stops, while the Metro of Washington DC has 117 miles. The
population of these respective cities is very different since New York City has around 5.6 million
riders daily and Washington DC has 626,000. If we divide the number of daily riders by miles
covered by the transit systems, we, once again, will see the disproportional relationship between
daily riders and mileage by their underground railroad systems. New York City’s quotient to that
equation is 8421.05263158 while Washington DC’s metro’s quotient is 5350.42735043. The
difference of over 3000 highlights the disparity between cities across the nation in terms of
population, land, and coverage of transit lines.
The use and spending of public transportation are unequally dispersed throughout the entire
nation. Reports conclude that New York City/New York spends the most money on public
transportation also known as the MTA. The same reports display that 56.5% of New York
residents exploit public transportation on a daily basis, “with Jersey City in New Jersey where
47.6% of the residents use public transportation instead of commuting by car being a close
runner-up.” Now, it is no surprise that New York City has the most people who use public
transport because New York City has one of the greatest populations in the nation with a
whopping 18,823,000 people occupying the city. Compared to other cities, New York City has a
massive population which significantly contributes to the high percentage of public transportation
users. In New Orleans, Louisiana, for instance, there is only 7.8% of the population that utilizes
public transport daily. This should not be seen as a really low percentage considering its
population (998,000, which is almost 18 times smaller than the New York City population)
Additionally, the population and the percentage of people who use public transport directly
affects the budget and how much each city pays for their public transportation. For example, New
Orleans spends $109 million to run its public transit system as of 2020, compared to New York
City which spends so much that the MTA faces an $8 billion deficit through 2024. Additionally,
in comparison, New Jersey, which holds the second greatest percentage of public transport users
went from spending $2 billion to $2.6 billion for public transport, as of 2020. Another large
public transit system to consider is in California. In California, sources display that San Francisco
Bay Area, which has a 7.75 million population, has the most effective system in California.
California, due to its high population and expenses, has paid $12 billion in expenses for its public
transport system.
The efficiency in this formula of the public transportation of a city is determined by the number
of people taking public transport divided by the total working population divided by the median
Across the Spectrum of Socioeconomics Volume 1 Issue 4 DOI: 10.5281/zenodo.4740623
_____________________________________________________________________________________
_____________________________________________________________________________________
International Socioeconomics Laboratory Pages 1-27 2021. All Rights Reserved Page 22
aggregate commute time. All these factors are affected by how much of the total budget is
dedicated to a city’s public transport system. Taking into consideration the total budget of some
selects cities that have a low efficiency can help determine how exactly the total budget might
not always increase efficiency. One example of this is the city of Stamford, Connecticut. With a
total budget of $42700058 in 2019, the public transportation efficiency is still at a mere
0.2227085157, despite only 7,997 people taking public transit as their form of transportation.
Oddly, this trend continues for the previous five years in Stamford. In 2018, the budget was
$34573016 and had only 8663 people taking public transit, yet still had an efficiency of only
0.2037256147. In 2017, there were 7,278 people taking public transportation and the city had a
total budget of $32389867, but the efficiency was only 0.2415361363. The years 2016 and 2015
had a rather higher amount of people taking public transport, with 10,351 in 2016 and 9,558 in
2015. However, the budget was still in the same range for 2016 and 2015, with $34278859.00
and 36059530.00, respectively. As a result, despite the slight increase in ridership, the efficiency
value still remains quite low, with 0.2222611342 in 2016 and 0.2288397154 in 2015. Other
cities, such as New York City, have low efficiency even with a higher number of people taking
public transit every day and a higher budget. The efficiency in 2019 is 0.02782031303 despite the
total budget being $3,999,859,000.00. Additionally, the total amount of people taking public
transportation is shown to be 2,787,582 people, which is a relatively high number. This same
pattern for New York City continues for all five years. 2018 has an efficiency of 0.0277161487
and a budget of $3999859000. The year 2017 has an efficiency of 0.02809671804 and a total
budget of $2938292071. 2016 has an efficiency of 0.02777412663 and a total budget of
$2,733,958,550.00. Lastly, the public transit efficiency of New York City in 2015 was
0.02786707166, while the total budget was $2,972,675,796. There is seemingly a trend of low
efficiency due to having a high quantity of people despite a large budget dedicated to the public
transit system.
When analyzing transport efficiency, data has shown that the number of passengers does not
impact the efficiency of these systems. However, the question remains; Why don’t certain cities
have as many public transportation users? Looking for answers, city population and land area can
be referred to. Using recent 2019 statistics, Boston, Massachusetts has a reported 272,835 annual
users on public transit. Ranking quite high, this number is accompanied by Boston’s total
estimated population of 692, 600. In 2 the land area, Boston however ranks very little, with only
89. 63 mi. On the other end of the spectrum, 2019 statistics for Fort Worth, Texas tell a different
story. With a reported 3,022 annual users of public transport, this total comes as a shock. With a
general population of 909.585 and a land area of 355.6 mi², Fort Worth in whole is much larger.
Yet, it is public transport usage is over 90x less than Boston’s. Explaining this, a variety of
reasons can be noted. To begin with, Vox’s article, “Why US public transportation is so bad —
and why Americans don’t care” by Aditi Shirkant addresses the safety issues brought alongside
these transit forms. Mentioning uprises in passenger violence and broken-down train lines all
over San Francisco since 2016, she depicts the unreliability of these systems, even prior, a 2014
article by Ecolane titled, “7 REASONS WHY PEOPLE STOP USING PUBLIC TRANSIT”
addressed some concerns on the end of hesitant passengers. Citing delays due to traffic,
overcrowding, and delays due to mechanical failure, this group expressed the variety of
difficulties faced by riders. Comparing Fort Worth and Boston once again, the answer to the
question presented earlier can be simplified in two ways. First, the compactness and urbanization
of major, dense cities like Boston, Washington D.C., and New York City makes public transit
Across the Spectrum of Socioeconomics Volume 1 Issue 4 DOI: 10.5281/zenodo.4740623
_____________________________________________________________________________________
_____________________________________________________________________________________
International Socioeconomics Laboratory Pages 1-27 2021. All Rights Reserved Page 23
more practical. In locations like Fort Worth, more rural surrounding and greater distances
between locations makes cars the transport of choice. Additionally, the financial surroundings of
these two locations varies greatly, with Boston surrounded by major banks, corporations, and
higher-priced institutions. Such makes the need for funding less difficult with increased taxes and
allows construction to fit growing communication needs. All in all, city population and land area
does not impact public transport usage, whereas budgeting, stop-distances, and communication
needs all do.
In New York City, the Metropolitan Transportation Authority spends an exorbitant amount of
money and spent $1434.88 per capita in 2019. One would assume that such a large budget would
help improve the commute time of the average New Yorker. However, it seems that the variables
of spending 2 per capita and median commute time are not correlated. With a p value of 0.124,
this indicates that spending per capita does not significantly affect the median commute time in a
city. These results are not statistically significant with a p value of 0.005. This lack of a
correlation suggests that the budgets of many cities in the United States are not being adequately
utilized to improve the customer experience for a passenger on a transportation system. Ideally,
the budget per capita should be used to improve transportation by investing in repairs, new train
lines, cleaner and new stations, and other improvements that help shorten commute times.
Especially in New York City, where the MTA is heavily relied upon by millions of people, this
linear regression suggests that the MTA needs to reevaluate its budget and what it is spending
money on. Unnecessary repairs and improvements, high labor costs, and other expenditures may
be causing this lack of correlation between spending per capita and median commute time.
Though it is important to note that some cities will inherently have larger commute times due to
the “suburban sprawl” in the region or distance of certain neighborhoods from the city center,
working to improve the relationship between spending per capita and median commute time is a
surefire way to improve the efficiency of a city’s transportation system. More research must be
done on the individual budgets of the transportation systems of cities across the cities in order to
evaluate what adjustments can be made in order to achieve this goal.
Limitations
In this conducted data collection study, it is possible that the budget records for some of the
smaller cities are not fully up to date, affecting the analysis of the budget per capita. A lot of
smaller cities fall into a larger public transportation system. The MBTA, for example, does not
only service Boston. Cities like Cambridge are also a part of the MBTA, and this led to no
official budget for the city of Cambridge. Estimates were made based on publicly available
information. Although websites like the Census were used in order to solidify accurate values for
the working population and aggregate commute time, there is no common database for budgets of
all of the various transportation authorities in the United States, which may potentially cause
disparities in the ways the budgets were reported. Certain budgets had to be recorded based on
pdfs of a city’s budget plan, while others were listed on websites and information guides
specifically posted by the transit system. The MTA makes their budget available, and so does
Albany, but cities in between the two had no information on their transit system’s budget. This
limited our choice in cities, affecting the creation of our list of cities for each region, and the
development of the average spending per capita variable. In addition, the total working
population often did not account for out-of-state travelers or even out of city travelers. Cities like
Newark had a median commute time of 39.50, as many of their citizens travel long distances to
Across the Spectrum of Socioeconomics Volume 1 Issue 4 DOI: 10.5281/zenodo.4740623
_____________________________________________________________________________________
_____________________________________________________________________________________
International Socioeconomics Laboratory Pages 1-27 2021. All Rights Reserved Page 24
New York City for work. There is no statistic on how many people travel out-of-city to work,
only a statistic on the working population living in a city. In a similar vein, median commute
times do not necessarily indicate that a city’s transportation system is inefficient, as geographic
factors also play a role. In cities with more “suburban sprawl”, such as Los Angeles, commute
times will naturally be longer, as it will take more time for commuters to cover longer distances.
The United States Census records used to collect data on the total working population and on
public transportation users only accounted for those over the age of 16; however, many children
under the age of 16 use public transportation and are not accounted for with these statistics.
Although one website was used to recover data for each city in this study, some cities did not
have readily available information for each year. Because of this, some cities may have recorded
the annual snowfall average rather than the total for each year individually. It is important to
address these limitations when considering this investigation; however, this does not undermine
the overall conclusion of the data recorded.
Although, according to this investigation, the train systems of the Northeast contained the most
efficient transit systems in the country, this does not directly correlate with rider satisfaction.
There are still countless issues with the MTA, including cleanliness, delay times, and overall
infrastructure of the underground train system. Studying transportation systems in depth across
the country will allow New York City to replicate the benefits that are found in the transportation
systems of various cities. The MTA has no shortage of problems, and it is important to recognize
that solving these problems requires a multifaceted approach to address different parts of the
MTA’s shortcomings. Ensuring that all reforms made focus on helping the commuter, from
shortening commute times to increasing the quality of subway cars and trains. Reallocating parts
of the MTA’s budget to address these important issues will help increase ridership. Raising the
fare is not the answer, as this will only deter New Yorkers from using MTA services. It is
essential that the government and the MTA reevaluate their expenditures in order to ensure that
the system can continue to run more efficiently in the years to come.
Across the Spectrum of Socioeconomics Volume 1 Issue 4 DOI: 10.5281/zenodo.4740623
_____________________________________________________________________________________
_____________________________________________________________________________________
International Socioeconomics Laboratory Pages 1-27 2021. All Rights Reserved Page 25
References
8.4 – Urban Transport Challenges | The Geography of Transport Systems. (n.d.).
https://transportgeography.org/contents/chapter8/urban-transport-challenges/
Budget Glossary. (2019). MTA. https://new.mta.info/budget/glossary
Chansky, B., (2018, August) Productivity in transit: a new measure of labor productivity for
urban transit systems, Bureau of Labor Statistics,
https://www.bls.gov/opub/mlr/2018/article/productivity-in-transit-a-new-measure-of-labor-
productivity-for-urban-transit-systems.htm
Chung, J. (2021, January 19). MTA Postpones Planned 2021 Fare Hike “For Several Months”
Because “People Are Suffering.” Gothamist. https://gothamist.com/news/mta-postpones-fare-
hike-planned-2021-because-people-are-suffering
Cook, L. (2016, October 27). History of the MTA: Learn about the city's transit system from its
inception. Newsday. https://www.newsday.com/news/new-york/history-of-the-mta-learn-about-
the-city-s-transit-system-from-its-inception-
1.11931586#:~:text=On%20Oct.,1908%20and%20Queens%20in%201915.
Day-by-day ridership numbers. (n.d.). MTA. Retrieved March 12, 2021, from
https://new.mta.info/coronavirus/ridership
E. (2019, September 6). 7 Reasons Why People Stop Using Public Transit. Ecolane.
https://www.ecolane.com/blog/7-reasons-why-people-stop-using-public-
transit#:%7E:text=In%20a%20recent%20study%20at,%2C%20emergencies%20or%20mechanic
al%20failures
FAQs. (2020). LAO. https://lao.ca.gov/Transportation/FAQs
Gelinas, N. (2019). Who Should Run the MTA? City Journal. https://www.city-
journal.org/html/who-should-run-mta-16607.html
Goldbaum, C. (2020, April 8). 41 Transit Workers Dead: Crisis Takes Staggering Toll on
Subways. The New York Times. https://www.nytimes.com/2020/04/08/nyregion/coronavirus-
nyc-mta-subway.html?auth=login-google
Guse, C. (2020, October 25). MTA now counts 126 COVID-19 deaths among its workers, down
from 131. Retrieved from https://www.nydailynews.com/coronavirus/ny-coronavirus-mta-
official-death-count-update-covid-20201025-oyl7ir6n2nhilacdj5cbfxkoe4-story.html
Hokey, M., (2017, April) Assessing the Efficiency of Mass Transit Systems in the United States,
SJSU Scholarworks
https://scholarworks.sjsu.edu/cgi/viewcontent.cgi?article=1226&context=mti_publications
Across the Spectrum of Socioeconomics Volume 1 Issue 4 DOI: 10.5281/zenodo.4740623
_____________________________________________________________________________________
_____________________________________________________________________________________
International Socioeconomics Laboratory Pages 1-27 2021. All Rights Reserved Page 26
Knupfer, S. (2018, June) Elements of success: Urban transportation systems of 24 global cities,
McKinsey&Company
https://www.mckinsey.com/~/media/McKinsey/Business%20Functions/Sustainability/Our%20In
sights/Elements%20of%20success%20Urban%20transportation%20systems%20of%2024%20gl
obal%20cities/Urban-transportation-systems_e-versions.ash
Levin, T. (2020, September 26). New York's transit system is in a financial crisis - but saving it is
vital to the US economy, experts say. Retrieved March 12, 2021, from
https://www.businessinsider.com/saving-mta-transit-system-subway-us-new-york-economy-
experts-2020-9
Levy, A. (2017, October 13). NYC subway operating costs: an analysis. Curbed NY.
https://ny.curbed.com/2017/10/13/16455880/new-york-city-subway-mta-operating-cost-analysis
Libman, M. W. L. (2021). StackPath. Mass Transit.
https://www.masstransitmag.com/management/article/21210963/new-york-mta-backs-off-
service-reductions-and-layoffs-but-still-faces-8-billion-deficit-through-
2024#:%7E:text=Management-
,New%20York%20MTA%20backs%20off%20service%20reductions%20and%20layoffs%2C%2
0but,significant%20four%2Dyear%20fiscal%20challenge.
M.T.A. (2007). MTA 2008 Preliminary Budget. MTA 2008 Preliminary Budget, 1–574.
http://web.mta.info/mta/budget/july2007/fullbudget.pdf
M.T.A. (2009). MTA 2009 Adopted Budget. MTA 2009 Adopted Budget, 1–418.
http://web.mta.info/mta/budget/feb2009/0209_full.pdf
M.T.A. (n.d.). MTA Operating Budget Basics. MTA. https://new.mta.info/budget/MTA-
operating-budget-basics
Metro Magazine Staff. (2019, April 25). NYC has longest commute time via car and transit, study
says. Metro Magazine. Retrieved March 3, 2021, from https://www.metro-
magazine.com/10031507/nyc-has-longest-commute-time-via-car-and-transit-study-
says#:~:text=According%20to%20the%20results%20of,43%20minutes%20travelling%20on%20
average
Meyer, D., & Fitz-Gibbon, J. (2021, February 15). NYC transit WORKERS worry about SAFETY
amid a spike in subway violence. Retrieved March 12, 2021, from
https://nypost.com/2021/02/15/nyc-transit-workers-worried-amid-spike-in-subway-violence/
MTA Budget. (n.d.). MTA. Retrieved March 12, 2021, from https://new.mta.info/budget
MTA service during the coronavirus pandemic. (2021, February 22). MTA.
https://new.mta.info/coronavirus
NJ Spotlight News. (2020, November 21). NJ’s big boost in spending on transportation projects.
https://www.njspotlight.com/2020/11/transportation-trust-fund-extra-half-billion-dollars-
projects-murphy-administration-under-radar/
Across the Spectrum of Socioeconomics Volume 1 Issue 4 DOI: 10.5281/zenodo.4740623
_____________________________________________________________________________________
_____________________________________________________________________________________
International Socioeconomics Laboratory Pages 1-27 2021. All Rights Reserved Page 27
Ormsbee, B. (2004, December). 100 Years Underground - A Historical Look at the New York
City Subway. https://cooperator.com/article/100-years-underground/full
Railroad History (USA): Timeline, Statistics, Photos & More. (n.d.). Retrieved from
https://www.american-rails.com/history.html
Shrikant, A. (2018, September 26). Why American transit is not improving. Vox.
https://www.vox.com/the-goods/2018/9/26/17903146/mass-transit-public-transit-rail-subway-
bus-car
Sisson, P. (2017, September 19). What New York City’s subway system can learn from ones
around the world. Curbed New York. https://ny.curbed.com/2017/9/19/16335068/nyc-subway-
mta-state-of-emergency-solution
The Beginnings of American Railroads and Mapping. Retrieved from
https://www.loc.gov/collections/railroad-maps-1828-to-1900/articles-and-essays/history-of-
railroads-and-maps/the-beginnings-of-american-railroads-and-mapping/
Times, T. N. Y. (2018, February 20). M.T.A. Delays: How Did the Subway Get So Bad? The New
York Times. https://www.nytimes.com/2018/02/20/nyregion/mta-train-delays.html
Toussaint, K. (2020, February 28). Subway littering fine to double, MTA says. Retrieved March
12, 2021, from https://www.metro.us/subway-littering-fine-to-double-mta-says/
U.S. Census Bureau QuickFacts: Boston city, Massachusetts. (n.d.). Census Bureau QuickFacts.
https://www.census.gov/quickfacts/bostoncitymassachusetts
US Census Bureau. (2019, April 4). Search Results. The United States Census Bureau.
https://www.census.gov/search-
results.html?q=fort+worth+population&page=1&stateGeo=none&searchtype=web&cssp=SERP
&_charset_=UTF-8
Wikipedia contributors. (2020, April 12). List of U.S. cities with high transit ridership.
Wikipedia. https://en.wikipedia.org/wiki/List_of_U.S._cities_with_high_transit_ridership
Wikipedia contributors. (2021, April 7). San Francisco Bay Area. Wikipedia.
https://en.wikipedia.org/wiki/San_Francisco_Bay_Area
Writer, S. W. J. B. Y. |. (2020, January 8). New Orleans RTA to spend $9 million more in 2020 as
public payroll rises. NOLA.Com. https://www.nola.com/news/politics/article_84c13854-2675-
11ea-acdd-
573f9751edcc.html#:%7E:text=The%20Regional%20Transit%20Authority%20expects,ran%20a
%20mostly%20privatized%20operation.