how componential factors and …/67531/metadc3964/m2/1/high_res_dopportunity. although the ... to...
TRANSCRIPT

APPROVED: Audhesh K. Paswan, Major Professor Michael Beyerlein, Committee Member Charles Blankson, Committee Member Lou E. Pelton, Committee Member Jeffrey K. Sager, Chair of the Department of
Marketing and Logistics Kathleen B. Cooper, Dean of the College of
Business Administration Sandra L. Terrell, Dean of the Robert B.
Toulouse School of Graduate Studies
HOW COMPONENTIAL FACTORS AND CONSTRAINT ENHANCE CREATIVITY
IN THE DEVELOPMENT OF NEW PRODUCT IDEAS
Tanawat Hirunyawipada, B.Eng., M.B.A.
Dissertation Prepared for the Degree of
DOCTOR OF PHILOSOPHY
UNIVERSITY OF NORTH TEXAS
August 2007

Hirunyawipada, Tanawat, How componential factors and constraint enhance
creativity in the development of new product ideas, Doctor of Philosophy (Marketing),
August 2007, 127 pp., 15 tables, 9 figures, references, 249 titles.
New product ideation is the transformation of a raw idea into a robust concept
with consideration of fit and feasibility of technologies, customer benefits, and market
opportunity. Although the ideation process often involves ambiguous processes, it is the
most critical activity in new product development (NPD). As a creativity task, the
ideation process is considered heuristic rather than algorithmic. However, managing the
ideation process as either a completely heuristic or an entirely algorithmic procedure
leads to just conventional outcomes.
Rooted in cognitive psychology, this study proposes that ideation activities in
NPD should be pursued as Simonton’s “constrained stochastic behavior.” An ideation
task not only needs good componential factors but also requires constraint to frame the
task by precluding unwieldy ideas while promoting high variability of ideas. Focusing on
the inputs and attempting to strike a balance between algorithmic and heuristic ideation
process may provide the mechanisms to manage the psychological perceptions with an
aim to stimulate and orchestrate the ideation staff’s cognitive efforts to generate the
creative idea.
To achieve this goal, new product idea creativity is considered as the ideas that
could turn out to be products that are novel to and useful for customers, and appropriate
to firms’ existing production systems. In addition, the study asserts that componential
factors include two factors: specialization representing idea creators’ depth of NPD
knowledge, experience, and skills in a product domain, and diverse expertise

representing the breadth of ideation team’s knowledge, experience, and skills
concerning the same domain of NPD. These factors are essential and collectively can
enhance creativity in the development of new product ideas. Finally, goal constraint is
defined, operationalized, and incorporated in the NPD ideation framework. This
constraint encapsulates the overall criteria and stylistic principle for a particular product
domain and reflects the frame of reference for new product idea development.
The findings provide mixed results, and yield at least three new concepts. First,
the process of new product idea development truly requires specialization and diverse
expertise if its ultimate goal is creativity. Both componential factors are essential and
together can enhance new product ideas on all important dimensions. Second, goal
constraint exhibits a linear relationship, rather than an inverted U–curve relationship,
with idea newness and usefulness–two dimension of creativity important for customers.
Finally, goal constraint can enhance creative outcomes of new product ideas, especially
in the ideation team exhibiting a low level of specialization.

ii
Copyright 2007
by
Tanawat Hirunyawipada

iii
ACKNOWLEDGEMENTS
I would like to express my sincere gratitude to my dissertation chair, Dr. Audhesh
K. Paswan, who has offered professional guidance and mentored me since I was in the
doctoral program. Many thanks to my dissertation committee members, Dr. Michael
Beyerlein, Dr. Charles Blankson, and Dr. Lou E. Pelton, for their invaluable suggestions
that have improved this dissertation greatly. I have truly enjoyed working with these
great people. The New Product Development Scholars Program at the Department of
Marketing and Logistics is gratefully acknowledged for financial support for this project.
Friends and practitioners in the area of new product development have advised and
provided several good comments for this dissertation. My family, especially my dad and
my mom, have encouraged me during my years in the doctoral program. Finally and
most importantly, I would not have completed this research without love and
tremendous support from my beloved wife. Without her, writing this dissertation would
have been a very companionless experience.

iv
TABLE OF CONTENTS
Page
ACKNOWLEDGEMENTS .............................................................................................iii LIST OF TABLES..........................................................................................................vi LIST OF FIGURES.......................................................................................................vii Chapter
1. INTRODUCTION ..................................................................................... 1 Product Innovation and Performance............................................ 1 Product Innovation and the Development of New Product Ideas .. 1 Review of Literature ...................................................................... 7 Research Gaps ........................................................................... 13 Theory Development................................................................... 17 Research Contributions............................................................... 20 Unit of Analysis ........................................................................... 21 Research Plan............................................................................. 22
2. HYPOTHESES ...................................................................................... 24
Idea Generation in New Product Development ........................... 24 Team–Based Approach for Idea Development ........................... 26 Idea Generation and Creativity ................................................... 27 Componential Factors and Creative Ideas: the Individuals ......... 31 Componential Factors and Creative Ideas: the NPD Team ........ 37 Constraint and the Componential Factors–Creativity Relationship:
Impact on Individuals........................................................ 42 Constraint and the Componential Factors–Creativity Relationship:
Impact on NPD Teams ..................................................... 48 Goal Constraint–Creativity Paradox ............................................ 49 Planned Analysis: Model Specification........................................ 51
3. METHOD ............................................................................................... 53
Sample Frame and Procedure .................................................... 53 Scale Item Development ............................................................. 56

v
Data Collection............................................................................ 63 Sample Representativeness ....................................................... 66
4. ANALYSIS ............................................................................................. 69
Analysis Procedure ..................................................................... 69 Testing Multivariate Assumptions................................................ 73 Scale Refinement and Validation ................................................ 75 Model Estimation......................................................................... 83 Hypothesis Testing...................................................................... 89 Post Hoc Analysis ....................................................................... 90
5. DISCUSSION ........................................................................................ 95
Impact of Componential Factors: Individual Level....................... 95 Impact of Componential Factors: Team Level............................. 98 Behavior of Goal Constraint: Constraint Enhances Creativity ..... 99 Impact of Goal Constraint ......................................................... 100 Managerial Contribution and Implication ................................... 102 Theoretical Contribution and Implication ................................... 104 Conclusion ................................................................................ 105 Limitation and Suggestion for Future Research ........................ 107
REFERENCES.......................................................................................................... 109

vi
LIST OF TABLES
TABLE 1: Empirical Studies of the Development of New Product Ideas ....................... 12
TABLE 2: Empirical Studies of New Product Development and Creativity .................... 13
TABLE 3: Measures ...................................................................................................... 59
TABLE 4: Phases of Data Collection............................................................................. 64
TABLE 5: Tests of Equality of Means: Online Survey vs. Mail Survey ......................... 65
TABLE 6: Tests of Equality of Means for Non–Response Bias ..................................... 65
TABLE 7: Statistical Techniques Used in the Analysis Prodcedure .............................. 72
TABLE 8: Model A: Measurement Scales of Independent Variables............................. 78
TABLE 9: Model B: Measurement Scales of Dependent Variables ............................... 79
TABLE 10: Correlated Uniqueness Model’s Factor Intercorrelation .............................. 82
TABLE 11: Factor Correlation ....................................................................................... 84
TABLE 12: Results of Hierarchical Multiple Linear Regression..................................... 85
TABLE 13: Results of Multiple Linear Regression......................................................... 86
TABLE 14: Summary of Hypothesis Tests .................................................................... 90
TABLE 15: Post Hoc Analysis Using General Linear Model.......................................... 93

vii
LIST OF FIGURES
FIGURE 1: The Front End of New Product Development ............................................. 25
FIGURE 2: Conceptual Framework............................................................................... 33
FIGURE 3: Sample Description: Industry Representativeness ..................................... 67
FIGURE 4: Sample Description: Highest Level of Education ........................................ 68
FIGURE 5: Sample Description: Job Function .............................................................. 68
FIGURE 6: Aanalysis Procedure................................................................................... 71
FIGURE 7: Revised Testing Model ............................................................................... 80
FIGURE 8: Post Hoc Analysis of Idea Newness ........................................................... 92
FIGURE 9: Post Hoc Analysis of Idea Usefulness ........................................................ 94

1
CHAPTER 1
INTRODUCTION
Product Innovation and Performance
Product innovation has been valued as a crucial factor of business success
(Hamel 2000). Every organization is confronted with a dynamic competitive environment
where there are significant shifts in customers’ knowledge, communication, and
technology (De Meyer 2004). These changes compel organizations to continue to
innovate. As Leenders, van Engelen, and Kratzer (2003, p. 69) suggest, “every
organization, regardless of size, profit motive, or industry, experiences regular
pressures to renew, expand, or modify its product or service offerings.” It appears that
product innovation not only enhances the firm’s strategic success (Hamel 2000) but also
increases its competitiveness (Hitt et al. 2001). The portentous role of product
innovation on financial performance is reinforced in a recent study. The study conducted
by the Boston Consulting Group based on Compustat data from 1995 to 2000 reveals
that successful offerings help the organizational innovators to achieve greater profit
growth, and their stock returns are apparently higher than the industry medians
(McGregor 2006).
Product Innovation and the Development of New Product Ideas
Product innovation is essential to a firm’s “positional advantage,” i.e., “superior
customer value” (Day and Wensley 1988, p. 3). Literature addressing new product
successes and failures has long been established with a stream of research in
marketing (e.g., Booz, Allen, and Hamilton 1968, 1982; Cooper 1979, 1984, 1996;

2
Crawford 1992, 1994). Specifically, several extant studies attempt to identify how new
product development (hereafter, NPD) could be pursued successfully (see Henard and
Szymanski 2001; Montoya–Weiss and Calantone 1994). As exhibited in at least two
empirical reviews of NPD studies, several factors (e.g., products, the development
process, organizational strategy and structure, firm resources, market, technology,
competition environment, etc.) have been discovered as the potential predictors of the
success of new products (Henard and Szymanski 2001; Montoya–Weiss and Calantone
1994). Although all of these NPD–related activities are plausible to the success of new
products, the critical success factor is indeed the activity that happens prior to the
implementation of NPD (Clark and Wheelwright 1995; Cooper 1994; Khurana and
Rosenthal 1998; Reid and de Brentani 2004; Smith and Reinertsen 1991, 1992).
The activities in the early stage of NPD often referred to as “the fuzzy front end”
(hereafter, FFE) which mainly involves the generation of new product ideas that have
not been committed or approved by the management of the firm (Smith and Reinertsen
1992, p. 47; see also Cooper and Kleindschmidt 1986; Montoya–Weiss and O’Driscoll
2000; Reid and de Brentani 2004; Smith and Reinertsen 1991). In their original
definition, Smith and Reinertsen (1992, p. 47) suggest that “the front end of a
development project starts when the need for a new product is first apparent, whether
the company acts on it or not,” and “the front end terminates when the firm commits
significant human resources to development of the product.” Khurana and Rosenthal
(1998, p. 59) expand the activities associating with FFE “to include product strategy
formulation and communication, opportunity identification and assessment, idea
generation, product definition, project planning, and executive reviews.” Because the

3
main purpose of the activities in this predevelopment stage is the idea creation, this
study primarily focuses on the idea development for new products or “new product
ideation” (“new product ideation,” new product idea generation, new product idea
development, new product idea creation, the development of new product ideas, the
generation of new product ideas, and the creation of new product ideas are used
interchangeably in this study) (Goldenberg, Mazursky, and Solomon 1999, p. 200).
The development of new product ideas is a process by which a raw idea is
converted into a concrete product concept with consideration of fit with and feasibility of
technologies, value proposition, and the idea’s commercialization potential (Cooper and
Kleindschmidt 1987; Montoya–Weiss and O’Driscoll 2000). Simply put, the generation
of new product ideas is at the initial phase of NPD in which the newly developed ideas
should be appropriate to target customers and fit with all aspects (e.g., marketing,
technology, production) of firm’s capability (Khurana and Rosenthal 1998).
Although the ideation process can encompass a lot of tentative thinking and
ambiguous procedures, it is asserted by several practitioners and researchers as the
NPD critical activity (e.g., Calantone, Di Benedetto, and Schmidt 1999; Clark and
Wheelwright 1995; Moenaert et al. 1995; Montoya–Weiss and O’Driscoll 2000; Smith
and Reinertsen 1991, 1992). A simple reason is that a successful invention is most
likely an outcome of a good new product idea. One may argue that good ideas may
occur by chance or due to luck. However, as Rosegger (1996, p. 125) argues, “while
some inventions may be the results of the proverbial ‘flash of insight’, the vast majority
involves the commitment of resources to the purposeful search for potentially useful
new technical ideas.”

4
It is not surprising that the importance of idea development is greatly recognized
in the NPD literature. The well–executed ideation process can generate significant
enhancement in the process of NPD. Smith and Reinertsen (1992, p. 47) suggest that
even the minor improvement occurring at the FFE can result in the greatest time
savings at a minimal investment (“largest and cheapest opportunities”). Reducing cycle
time is essential in NPD where the life cycle of many products continue to be shortened,
and products rapidly pass out of use or usefulness (Griffin 1997b; Hayes, Wheelwright,
and Clark 1988; Rosenau 1988; Womak, Jones, and Roos 1990). The Product
Development and Management Association (PDMA) research on NPD practices shows
that the reduction of cycle time exhibits a clear progress in industrial practices (Griffin
1997a; Page 1993). Nearly half of the respondents (41%) from the PDMA survey
indicated that their firms’ NPD cycle time were lower than that in five years ago (Page
1993). A more recent PDMA survey reaffirms that new products could be developed
more quickly, i.e., 15%–20% reduction in NPD cycle time (Griffin 1997a, p. 450).
Improvement in the ideation process also has a significant impact on the
efficiency and effectiveness of resource deployment in NPD. Port (1998) reports that
majority (75%–85%) of relevant costs of making the products are decided during the
ideation stage, reflecting a significant commitment from the firms for the NPD project
after the approval of that new product idea has been granted. Booz, Allen, and Hamilton
studied data from 1,000 firms with highest research and development (R&D) spending
in 2004 (Jaruzelski, Dehoff, and Bordia 2005). This report noted that “70% of the final
cost of a product (the cost reflected in gross margin) is driven by the R&D–based design
decisions” (Jaruzelski, Dehoff, and Bordia 2005, p. 6). Comparing three major stages in

5
NPD, Cooper and Kleinschmidt (1988, p. 255) hold that the firms spent minimally (7.1%)
for the “predevelopment activities” compared with what they invested in NPD activities
(39.0%) and the commercialization of new products (53.9%). This information reaffirms
that the ideation cost is relatively low but its impact could be immeasurable (Coates,
Cook, and Robinson 1996; Smith and Reinertsen 1991, 1992; Urban and Hauser 1993).
Therefore, an understanding of idea development can help firms unlock their potential
for new product ideas, efficiently and effectively manage subsequent NPD phases, and
enhance the success of their new products.
Indeed, in view of the impact of the ideation process, a firm competing on product
innovation needs to truly understand how to develop good new product ideas to achieve
greater success. This statement is supported by the findings from the “BusinessWeek–
Boston Consulting Group 2006 senior management survey on innovation” using
information from 1,070 executives from around the world (North America 46%; Europe
30%; Asia or the Pacific region 16%) (McGregor 2006). Findings from this study show
that “poor idea selection” (21%) and the “dearth of ideas” (18%) are among the great
“enemies of innovation” (McGregor 2006, p. 68). An intensive review of the empirical
studies examining the relationship between the activities in FFE (i.e., ideation activities)
and the performance of new products provides additional supportive evidence (Henard
and Szymanski 2001). The analysis of 29 effects from 12,676 respondents indicates
that the range of correlations between the “predevelopment task proficiency” (of the
activities in the FFE) and new product performance is 0.19 to 0.76 ( X =.46, p≤.05)
(Henard and Szymanski 2001, p. 365–367). These results are strongly related to the

6
notion that good and creative ideas for new products mean “better utilization of human
capital and key competencies” (Boeddrich 2004, p.274).
Having good knowledge and skill sets regarding the generation of new product
ideas not only enhance firms’ competitive advantage in their innovation–based games
but also lay the groundwork for their future competencies (Boeddrich 2004; Day, Gold,
and Kuczmarski 1994). A firm needs an inventory of new product ideas to be converted
into the successful products when the market is ready to adopt those ideas (Tauber
1972). However, not all new product ideas could end up being the successful products.
Griffin’s (1997a, p. 448) “mortality curve” indicates that only 15.2% of the total number
of ideas generated by one firm could be converted into commercially successful
products. Hence, having the organizational setting that supports a more “thoughtful
approach” to generate new product ideas seems to pay off in the future (Day, Gold, and
Kuczmarski 1994, p. 69). Conversely, firms that lack knowledge of idea development
may not be able to accumulate a sufficient number of good ideas in their ideation stock
(Tauber 1972). A deficiency in knowledge of idea development may have deleterious
effects on a firm’s ability to compete with new products.
In summary, a better understanding of idea development helps firms to (1) have
a good starting point before committing their valued resources to any NPD project, (2)
orchestrate and allocate appropriate skills and resources for the following NPD phases,
and (3) create the inventory of potential ideas for future product implementation.

7
Review of Literature
Idea development is a highly complex area that has so far received limited
research attention (Day, Gold, and Kuczmarski 1994; Kim and Wilemon 2002; Reid and
Brentani 2004). A critical review of extant research reveals four areas of ideation
research.
First, the area most studied is how firms organize their work units and routines
for ideation activities. Among the pioneer attempts, Khurana and Rosenthal (1998, p.
64–65) urge firms to adopt the “holistic front end” by linking “business strategy, product
strategy, and product–specific decisions” in the FFE. Kim and Wilemon (2002) note that
idea development should be approached from a team perspective in which a team
leader needs to be appointed to take responsibility of the ideation process. In addition,
new product researchers have advocated several key success factors supporting
common wisdom in the development of new product ideas, including (1) firms’ resource
commitment to ideation activities (Kim and Wilemon 2002), (2) the adoption of the
standardized procedure to obtain customer insights (Flint 2002), (3) firms’ infrastructure
to allow the sharing of information (Kim and Wilemon 2002; Zahay, Griffin, and
Fredericks 2004), and (4) fortification of firms’ relationship with relevant parties
associating with new product idea development (Kim and Wilemon 2002). In the context
of radically new products, Reid and de Brentani (2004) hold that the flow of information
tends to be bottom up–individuals search for environmental information, discover new
product ideas, and select the ideas before submitting those ideas to the organization–
level decision. Management should clearly understand the nature of ideation in
discontinuous innovation and appropriately design firms’ process and structure to

8
maximize the efficiency and effectiveness of the ideation process in this context (Reid
and de Brentani 2004).
The second research area in FFE is the idea screening and selection process.
The Nortel Network case study reflects the idea selection criteria in which information
concerning market, technical, production, and business feasibilities is used to screen
out less potential ideas for NPD (Montoya–Weiss and O’Driscoll 2000). Another seminal
case study advocates the implementation of the “Analytic Hierarchy Process” where
new product ideas are rated according to their fit with the essential criteria (Calantone,
Di Benedetto, and Schmidt 1999, p. 68). This screening technique illuminates the
collective role of competencies (e.g., market, technology), return, and
anticipated/unanticipated risks in the selection of new product ideas (Calantone, Di
Benedetto, and Schmidt 1999).
Discovering sources of new product ideas is the third research area gaining
attention from NPD scholars. Generally, firms’ employees (e.g., R&D staff, members of
NPD project teams) are considered to be the first group of people to generate new
product ideas. Boeddirich (2004, p. 280) suggests that employees with different
“archetypes” (including, “emotional perceiver,” “reserved scientist,” “open
communicator,” “dominant entrepreneur”) differ in their proclivity to generate new
product ideas. Essentially, firms need to beware of assigning people with certain
“archetypes” to the appropriate tasks in the ideation process (Boeddirich 2004, p. 280–
281).
As an external source, a group of customers appears to be among the good
sources of new product ideas (Flint 2002; Olson and Bakke 2001). New product ideas

9
often originate from the “leading edge customers” who can produce novel, tempting new
product concepts (Olson and Bakke 2001, p. 388). The “lead user” process attempts to
gather insights from the “leading edge” customers in the selected segments as well as
“from users in other markets that face similar problems in a more extreme form” (Lilien
et al. 2002, p. 1042). A longitudinal study of several NPD projects at 3M show that the
NPD projects adopting the “lead user” process for their idea development exhibit greater
projection of NPD outcomes (e.g., sales, product newness, market share, and customer
needs) (Lilien et al. 2002, p. 1055).
Market information is an important source of new product ideas. Troy,
Szymanski, and Varadarajan (2001) find the effects of firms’ climate and setting on the
relationship between the amount of market information and firms’ ideation capabilities.
Especially, they find that (1) firms’ encouragement of new interpretation of market data,
(2) information sharing and accessibility, and (3) integration of different job roles
significantly heighten the impacts of the amount of market information on the number of
new product ideas firms generate (Troy, Szymanski, and Varadarajan 2001).
In sum, the third research area asserts that firms’ employees, lead customers,
and marketing information are the major sources rich with new product ideas. However,
as suggested by Huston (2004, p. 192), firms should allocate more efforts to search
beyond the conventional idea “landscape” and pay more attention to the “periphery” for
novel ideas because “this is often where the breakthrough innovations will be found.” In
addition, Huston (2004, p. 191) advocates firms to take a “broad searching” stance
while maintaining their “thinking with focused evaluation and execution.”

10
The final research area consists of the studies attempting to articulate idea
development at a cognitive level. For example, Coates, Cook, and Robinson (1996, p.
108) indicate several techniques for the ideation process e.g., "attribute listing,
brainstorming, brainwriting/blue slip technique, forced relationships and free
association, heuristic ideation technique, lateral thinking, mind mapping, morphological
analysis, product checklists, synectics, ideal solution, lotus blossom technique, nominal
group technique” (Coates, Cook, and Robinson 1996, p. 108; see also Couger et al.
1991; Osborn 1993; Sowrey 1987). Dahl and Moreau (2002, p. 58) suggest that a
newness dimension of ideas “can be enhanced during the idea generation by
encouraging the extensive use of analogies and providing no external benchmarks” for
the idea generators. Goldenberg, Lehman, and Mazursky (2001, p. 74) note that firms
can use such initial criteria as “templates” and “source of the idea” to predict the
“emergence” and success of products. The products that can be categorized into one of
the “templates” and serve customers’ need are potentially successful (Goldenberg,
Lehman, and Mazursky 2001, p. 80). In their seminal work, Goldernberg, Mazursky, and
Solomon (1999, p. 209) posit that the “templates,” which is derived from past data of
successful products, can be used to guide the development of new product ideas and
reduce the business risks resulting from the implementation of these ideas.
Although idea development is important, past research suggests that the
understanding of the activities in this pre–development stage is deficient (Calantone, Di
Benedetto, and Schmidt 1999; Crawford 1994; Day, Gold, and Kuczmarski 1994; Flint
2002; Montoya–Weiss and O’Driscoll 2000; Reid and de Brentani 2004). Review of the
ideation studies in NPD literature indicates that majority of previous studies are either

11
conceptual (Boeddrich 2004; Coates, Cook, and Robinson 1996; Flint 2002; Huston
2004; Kim and Wilemon 2002; Olson and Bakke 2001; Reid and de Brentani 2004;
Vandenbosch, Saatcioglu, and Fay 2006) or case studies–based research that employs
limited in–depth interviews (Khurana and Rosenthal 1998: 12 Japanese/US companies;
Zahay, Griffin, and Fredericks 2004: 20 practitioners). Other case studies are based on
a single industrial practice (Calantone, Di Benedetto, and Schmidt 1999: 1 company;
Montoya–Weiss and O’Driscoll 2000: 1 company). Surprisingly, the number of empirical
studies seems to be minimal (i.e., 7 studies, see for example Table 1).
In summary, previous ideation literature indicates four prominent areas: the
conceptual organization of idea development, idea selection/screening techniques,
sources of ideas, and idea development techniques at the cognitive level. Although
these streams of research yield some knowledge of ideation in NPD, there is a clear
gap needed theoretical development that warrants additional scholarly and managerial
attention.

12
TABLE 1
EMPIRICAL STUDIES OF THE DEVELOPMENT OF NEW PRODUCT IDEAS
Authors Methods (a) Unit Informants Key Findings
Ames and Runco 2005 Interview, regression
Individuals Entrepreneurs Successful entrepreneurs produce more ideas and do that in an untraditional way.
Dahl and Moreau 2002 Experiment, ANOVA
Team NPD practitioners and undergraduate engineering students
Using analogical thinking without exemplar/cues increases the newness of ideas.
Goldenberg, Lehman, and Mazursky 2001
Archival data, logistic regression
Product NPD experts Successful products are produced from the ideas that align with one of the existing idea categories and respond to customers’ needs.
Goldenberg, Mazursky, and Solomon 1999
Experiment, ANOVA
Team Graduate students Product attribute classification using historical data of successful products can be used to guide the “new product ideation” (p. 200) process and reduce the business risks resulting from the implementation of these ideas.
Griffiths-Hemans and Grover 2006
Survey, SEM Individuals and organization
R&D and engineers in high tech firms
Several factors are identified in the 3 stages of FFE, which include idea generation, idea evaluation and selection, and firms’ approval of new ideas.
Lilien et al. 2002 Survey, t–test NPD Project NPD team members from various 3M divisions
“Lead user” (p. 1042) process for their idea development exhibit higher estimation of NPD outcomes (e.g., sales, product newness, market share, and customer needs).
Troy, Szymanski, and Varadarajan 2001
Survey, regression
Team Single informant from each NPD team, National Housewares Manufacturers Association
Organizational climate and settings moderate the market information quantity–the number of new product ideas relationship.
(a) SEM – Structural equation model

13
Research Gaps
Product innovation is the result of firms’ “successful implementation of creative
ideas within an organization” (Amabile et al. 1996, p. 1155). A new product idea, which
is the prerequisite to the NPD task, “will be judged as creative to the extent that it is both
a novel and appropriate, useful, correct, or valuable response to the task at hand”
(Amabile 1983, p. 360). Firms generally expect the ideation process to generate
creative ideas which are described as something not only original/new, but also solving
customer problems (see Im and Workman 2004; Levitt 2002).
It is clear that the development of new ideas is a task associating with creativity
(Amabile 1983; Amabile et al. 1996). However, to this author’s knowledge, there is no
theory–driven empirical ideation study, nor empirical creativity studies that focus on new
product ideas framed in creativity (see Table 1 and 2). Perhaps, the most noticeable
gap in the ideation literature is this lack of a robust theoretical foundation used in the
extant literature.
The “debate about the target, source, and criteria of creativity assessment” have
produced a consensus regarding the creativity definition which focuses on the “attribute
of creative products,” i.e., novelty and usefulness, “as the most useful approach for
empirical study and theory development” (Ford 1996, p. 1114; see also Amabile 1983;
Busse and Mansfield 1980; Mumford and Gustafson 1988). Therefore, novelty (or
newness) and adaptiveness (or usefulness) are the two essential characteristics of
creative ideas (Amabile 1983; Ford 1996). These two dimensions of creativity imply the
involvement of social surroundings (or “social milieu”) which will later decide to what
extent the ideas become new and useful to them (Csikszentmihalyi 1988, p. 325). It is

14
important for ideation research to address the incorporation of social surroundings’
influences in the processes of idea generation (Amabile 1983, 1996; Csikszentmihalyi
1990).
Social surroundings also impact ideation tasks in the sense that most of these
tasks involve the group/team structure. People from relevant functions but different
disciplines (e.g., R&D, NPD, marketing, engineering, etc.) could be assigned to the
team to develop new product ideas. This cross–functional structure has been
extensively studied in the process of new product development (e.g., Atuahene–Gima
1996a, 1996b; Ayers, Dahlstrom, and Skinner 1997; Gatignon and Xuereb 1997;
Leenders and Wierenga 2002; Li and Calantone 1998; Luo, Slotegraaf, and Pan 2006;
Sherman, Souder, and Jenssen 2000; Song, Thieme, Xie 1998; Song and Montoya–
Weiss 2001) but, to the best knowledge of this author, no robust research has been
conducted in the ideation process. The meta–analysis of cross–functional integration
and NPD success reports that none of the NPD ideation studies has been specifically
conducted on the cross–functional team (Hirunyawipada and Vahie 2005). As such, the
empirical study of the ideation process should embrace the social surroundings in which
the creative ideas will be implemented and adopted.
As a creativity task, an ideation process is “heuristic” rather than “algorithmic”
(Amabile 1983, p. 360–361). Heuristic tasks are those where the path usually includes
speculative formulation, trial–and–error method, or not completely identifiable
explanation to solve the problems; conversely, an algorithmic task has a clearly
designated way to solve problems (Amabile 1983; Amabile et al. 2005).

15
TABLE 2
EMPIRICAL STUDIES OF NEW PRODUCT DEVELOPMENT AND CREATIVITY
Authors Methods(a) (b) Unit Informants Key Findings
Andrews and Smith 1996
Survey, regression
Project Consumer goods product managers
Product managers’ knowledge and skill sets, their motivation, and working environment impact the “creativity of the marketing program” (p. 175).
Bharadwaj and Menon 2000
Survey, regression
Individuals and firm
Senior management, cross–sectional data
Creativity at individual and organizational levels collectively enhances innovative outcomes.
Im and Workman 2004 Survey, SEM NPD team Project managers and team leaders
The usefulness dimension of new products mediates the relationship between market orientation and new product success.
Kickul and Gundry 2001
Survey, HLR Firm Chief executive officers of E–commerce firms
Ability to identify business opportunity is a function of CEOs’ creativity.
Kratzer, Leenders, and Engelen 2004
Survey, regression
NPD team NPD team members in digital products
Interaction and communication among the members of subgroup inhibit teams’ creative outcomes.
Leenders, Engelen, and Kratzer 2003
Survey, regression
NPD team NPD team members in electronic products
Creativity increases when NPD team members moderately interact with all the other members of their teams.
Menon et al. 1999 Survey, regression
Firm Senior management, cross–sectional data
The organizational culture that encourages innovation, openness, and quick feedback enhances the “marketing strategy making (MSM)” (p. 19). They also find that comprehensiveness of “MSM,” cross–functional integration, and communication quality positively correlate with “strategy creativity” (p. 25).
Moorman and Miner 1997
Survey, regression
NPD Project, team
VP–Marketing of advertising firms
The level of “organizational memory dispersion” (p. 95) correlates with new product performance and creativity.
Prajogo, Power, and Sohal 2004
Survey, SEM Firm Senior managers Managers’ ability to manage knowledge and creativity within their firms has direct impacts on product and process innovation.
Stevens, Burley, and Divine 1999
Survey, regression
Individuals NPD analysts in a chemical company
“MBTI creativity index” (p. 460) can be used to select creative staff to produce successful products.
(a) SEM – Structural equation model (b) HLR – Hierarchical Multiple Linear Regression

16
The generation of new product ideas is heuristic in the sense that it is the
process whereby individuals generate variation of ideas in somewhat mysterious ways.
Looking at a creativity task in this way may provide limited contribution to the idea
development process where people work together in the complex social system (e.g.,
cross–functional integration teams dedicated for the NPD projects). This social system
needs the interaction and often enhances the alteration of the original ideas to fit with
evolving exigencies and customers’ articulated/unarticulated sought benefits
(Vandenbosch, Saatcioglu, and Fay 2006; Roger 2003).
In contrast, several studies have attempted to address the weakness of heuristic
process by attempting to replace this process with an algorithmic approach. As Table 1
illuminates, building too rigid of a framework to specify the idea generation procedure
and constructing the static ideation schemes to facilitate the development of new ideas
may not appropriately address the dynamism of idea development. Such a rigid
framework as “structured approach to problem solving” can limit the depth and breadth
of new product ideas (Prince 1970, p. 45 as cited in Tauber 1975, p. 68; see also Alford
and Mason 1975). In addition, studies with an exclusive focus on single sourcing of
ideas (i.e., customers) cannot augment the diversification of the ideas for new products;
and this may lead to product disadvantages (Karmarkar 1996; Wind and Mahajan
1997). Hence, the need for further understanding of the development for new product
ideas is apparent.

17
Theory Development
Creativity literature has suggested that theory development for creativity tasks
should focus on the tasks’ inputs (or a “componential approach,” Ahuja and Thatcher
2005, p. 431) rather than the characteristics of creative individual approach (Amabile
1983, 1996). There is a clear evidence of unsound argument as to which cognitive
capabilities and individual characteristics can be strongly related to the ability to
produce novel and useful ideas (see Bailin 1994). This is strongly related to what
Bharadwaj and Menon (2000) have discovered, that is, the firms having a low level of
individual creativity (but a high level of organizational creativity) can deliver significantly
superior innovative performance.
Departing from the conventional psychological tests in which the main thesis
centers on creative persons’ characteristics (e.g., Barron 1955; MacKinnon 1962, 1965),
the “componential approach” (Ahuja and Thatcher 2005, p. 431) views the crucial inputs
at the appropriate level of the idea development unit (e.g., group, team, connected
groups, hierarchical structure of multiple groups–see Ford 1996) as a vital way to attain
creative outcomes. From an “interactionist perspective” (Woodman, Sawyer, and Griffin
1993, p. 294), Csikszentmihályi (1988, p. 336–337) suggests that creativity needs to be
studied from a “system view” in which creative outcomes are produced by the individual
creators (“the person” as the input to creativity tasks) who craft new ideas through the
interaction with (1) those who select the ideas (“the field”) and (2) those who will adopt
and disseminate the ideas to a larger group of people (“the domain”) (see also Ford
1996, p. 1114).

18
Creativity has to be carefully considered using certain criteria because it is not
the creator but rather the related groups of people who determine the extent to which an
outcome of a creativity task becomes creative (Csikszentmihályi 1988, 1990; Ford
1996). Any outcome that lies outside of the fields’ frameworks is likely to be judged as
unwieldy rather than creative (Ford 1996).
Both the “componential” (Ahuja and Thatcher 2005, p. 431) and “interactionist”
perspectives (Woodman, Sawyer, and Griffin 1993, p. 294) illuminate a fundamental
challenge in idea development research: the concurrent aim to accommodate extant
ideation criteria and promote creative processes in NPD. To address this issue, this
study takes the integrative approach by suggesting that the componential factors for a
creativity task need to be revisited. Idea development may not be a task for an
individual creator. The process of new idea development needs to include the multiple
bases of knowledge and skills that reflect the criteria of the fields as the inputs for new
product idea development. This can increase the likelihood that the fields will accept the
new product ideas.
Additionally, multiple knowledge bases together with competent individuals
should be looked at as input for a creativity task to enrich variation through their
interaction (Simonton 1999). The approach to understand the creativity task by
incorporating both the idea generators’ knowledge and skills and multiple views that
may reflect external fields (i.e., consumers, market, and competitors) and by allowing
these crucial factors to freely interact has been suggested as the most practical way to
gain acceptance from the market or target domain as well as enhance creativity (e.g.,
Crawford 1991). This view is supported by Durant (2002, p. 490) who suggests that the

19
perspective of “synchronicity” which encourages multiple points of views enhances the
firms’ likelihood to generate new and meaningful product ideas.
The second challenge arises from the nature of a creativity task and an attempt
to manage the task. While the extant literature suggests that an ideation task is
heuristic, most of research has pursued the creativity task as algorithmic process. The
generation of new product ideas by an individual and/or a group of individuals implies
that creative and habitual actions are rival behaviors (Ford 1996). That is, creative
actions strive to increase variations while habitual actions endeavor to fall back to
conventional ways of thinking. Freeing the ideation process to be completely heuristic
(i.e., anything goes) may result in failure as well as breakthrough (i.e., just happens by
chance) while too much of an algorithmic procedure could lead to repetitive uses of
creators’ knowledge, resulting in the non–innovative outcomes (see Simonton 1983;
Taylor and Greve 2006).
Following Simonton (2003, p. 475), this study proposes that creativity is a
“constrained stochastic behavior.” As he suggested, creativity “demands the intrusion of
a restricted amount of chance, randomness, or unpredictability” (Simonton 2003, p.
476). This view suggests that a creativity task should be modeled as “a quasi–random
combinatorial process” (Simonton 2003, p. 475; see also the “chance–configuration
theory of creativity” in Simonton 1997, p. 67). This approach seeks a balance between
the heuristic and the algorithmic approaches, implicitly suggesting that creativity
demands a certain level of restriction in which efforts can be focused to increase
variation within specific “constraint” (Stokes 2006, p. 7; Simonton 1997, 1999, 2003). In
a sense, constraint guides a creativity task to increase variability by “precluding reliable,

20
repetitive response and promoting unusual, unexpected ones” (Stokes 2001, p. 355;
see also Stokes 2006; Stokes and Fisher 2005; Stokes and Harrison 2002).
Research Contributions
Understanding that the generation of new product ideas is truly important in the
sense that it impacts the allocation of resources in later stages, the present study
accordingly seeks to contribute to theoretical and managerial practices. First, focusing
on the inputs for a team that generates new product ideas may advance the knowledge
of how to select, organize, and structure the team components to achieve a fruitful
ideation process.
Second, this study suggests that the most effective way to achieve creativity is to
strike a balance between algorithmic and heuristic process in which the interactions
between the team members’ knowledge and skills, and other crucial factors play the
vital roles in successful idea development, and this could be pursued by introducing a
specific type of constraint into the framework of a creativity task. Constraint can be used
to manipulate an ideation team’s psychological perceptions with an aim to stimulate and
orchestrate the team’s cognitive efforts to generate creative ideas. It is the purpose of
this study to identify the managerial mechanism to be employed when firms intend to
effectively adopt the team format for generating new product ideas.
Finally, the important dimensions of new ideas are addressed, as well.
Psychological studies have identified several dimensions of new ideas (see Guilford
1968). However, it is unlikely that all those dimensions (especially in the context of an

21
NPD pre–development stage) will have significant impacts on the success of NPD,
especially if the success is considered in terms of efficiency and effectiveness.
Unit of Analysis
NPD teams in established–for–profit organizations are the units of analysis (e.g.,
Sethi 2000; Sethi, Smith, and Park 2001; Thamhain 1990) because most of NPD
activities and new product idea development occur at the team level (Brown and
Eisenhardt 1995; Hargadon and Sutton 1997; Khurana and Rosenthal 1998; Sutton and
Hargadon 1996; Troy, Szymanski, and Varadarajan 2001). There is supporting
evidence for the importance of the team–based approach in NPD. IBM’s research team
conducted the survey of 765 organizational leaders from 20 industries around the world
and found that these executives acknowledged the need to create a more team–based
environment to foster innovation (IBM 2006).
Adopting the team approach for new product idea development is appropriate,
especially when the industries exhibit some specific characteristics. In markets where
NPD is complex and needs interdependence (i.e., needs of integration) among different
functional units, companies will benefit greatly from the adoption of teaming
mechanisms because it effectively facilitates the collaboration and cooperation among
different work units (Mohrman, Cohen, and Mohrman 1995). A recent study confirms
that functional integration is more effective than an increase in R&D budget when new
product success is a desirable goal (Jaruzelski, Dehoff, and Bordia 2005). However, this
setting has gone unnoticed in creativity research (Kazanjian, Drazin, and Glynn 2000;
see also Table 2).

22
Research Plan
The following chapter (chapter 2) provides an inter–disciplinary review of the
team, ideation, and creativity literatures. From this literature review, hypotheses are
generated to explore the relationship between the creativity tasks’ inputs and potentially
important dimensions of the creative ideas. Accordingly, the competing theories linking
creativity and constraint will be brought into the framework to support the hypotheses,
and a theoretical framework for empirical analysis is proposed.
Chapter 3 deals with the research methodology. This is followed by an
explanation of the research design. The population of interest is members of new
product idea development team or NPD team members who are involved in the
generation of new product ideas. This sample is drawn from the sectors clustered
around technology industries. However, it is highly possible that the sample may come
from different types of businesses even though they share similar technology context.
Hence, a variable capturing the contextual difference will be controlled to accomplish
some level of sample homogeneity. As suggested by Calder, Lynn, and Tybout (1981,
1982), homogeneous sample allow researchers to observe more exact effects against
their theoretical priori and accordingly reduces the chance of misinterpretation of the
covariation between selected constructs in that research context. This is particularly
germane to empirical study, especially in light of the research tradition of focusing on
the effects of group behavior on their performance.
In chapter 4, the research design focuses on the conceptualization and
measurement of seminal constructs included in the model proposed in the preceding

23
chapter. The measures of the constructs come from three sources, including: (1) the
scales borrowed from the existing literature, (2) the scales partially adapted from
relevant others, and (3) the newly developed scales based on extant theories. The
measures are reconciled with the constructs amalgamated within the proposed model,
and multi–tier data analytics are presented to test the model. This chapter also critically
assesses the reliability and validity of each construct. Pending the outcomes of reliability
and validity testing, the data attempting to represent the (revised) model is tested using
multivariate data analytics. The results of the data analysis are reported with respect to
the hypothesized relationships presented in Chapter 2.
Chapter 5 of the dissertation is a platform to discuss the implications gleaned
from the empirical testing in Chapter 4. The data analysis is critically evaluated to
assess the extent to which the hypothesized relationships provide a nomological
framework for understanding the success of idea generation in the pre–development
stage of NPD. The new concepts apparently emerging from the study as well as both
the managerial and theoretical contribution will be deliberately discussed.
This final chapter additionally provides the recapitulation of the relation between
theoretical and practical rationality. This chapter briefly delineates the development of
ideation theory in this dissertation. Then, the conclusions are framed in both the
descriptive and normative implications from the model testing, with considerations of the
limitations that exist in the research design. Finally, suggestions for future research are
presented.

24
CHAPTER 2
HYPOTHESES
Idea Generation in New Product Development
The activities and decisions made during the development of new product
concepts/ideas are special and complex. Several attempts have been made to examine
“the fuzzy front end” (hereafter, FFE or the front end; Smith and Reinertsen 1992, p. 47)
and its impact on new product development (hereafter, NPD) in order to cope with this
ambiguous nature (Bacon et al. 1994; Cooper and Kleinschmidt 1994; Gupta and
Wilemon 1988; Moenaert et al. 1995). Focusing on a high–technology setting at Nortel
Networks, Montoya–Weiss and O’Driscoll (2000, p. 146) find that the FFE may include 4
stages (e.g., “idea qualification, concept development, concept rating, concept
assessment”). These important activities concerning the creation of new product ideas
(e.g., “generation, collection, adoption, clustering, screening, selection, improvement”)
and the decisions on innovation projects are the thesis of the FFE (Boeddrich 2004, p.
275). Accordingly, this stream of research has expanded to incorporate several
activities but it is very likely that all of the ideation efforts have principally revolved
around two core activities: (1) new product idea development, and (2) the
selection/screening of new product ideas (see Cooper 1988; Khurana and Rosenthal
1998; Murphy and Kumar 1997). Figure 1 illustrates the multi–dimensionality underlying
the front end of the NPD stage.

25
FIGURE 1
THE FRONT–END OF NEW PRODUCT DEVELOPMENT
Sources: Adapted from Anil Khurana and Stephen R. Rosenthal (1998), “Towards Holistic "Front Ends" in New Product Development,” Journal of Product Innovation Management, 15, 1, p. 59. Used with permission (see also Boeddrich 2004; Mohrman, Cohen, and Mohrman 1995; Montoya–Weiss and O’Driscoll 2000).

26
As presented in Figure 1, the development of new product ideas requires
simultaneous consideration of (1) “product strategy formulation and communication,” (2)
“opportunity identification and assessment,” (3) customer and market consideration, and
(4) product concept feasibility (Khurana and Rosenthal 1998, p. 59; Kim and Wilemon
2002; Montoya–Weiss and O’Driscoll 2000; Murphy and Kumar 1997). Apparently, the
interdependent activities in the front end occur on the continuing basis whereby new
product ideas are developed to be appropriate to the target market and to enhance
firms’ competitive position (Montoya–Weiss and O’Driscoll 2000).
At the end of this pre–development stage, the front end purportedly generates
new product concepts or ideas. Depending upon the outcome of primary executive
review, firms’ approval of a new product idea is at the end the FFE where the execution
of the NPD begins (Figure 1). The outcome of the FFE is the commencement of new
product concept/idea that will subsequently need the corporate executives’ commitment
to allocate necessary resources to implement the concept/idea in a subsequent NPD
execution phase.
Team–Based Approach for Idea Development
Central to the ideation activities in the front end is the production of new product
ideas by a group of individuals working together. The issue of team approach in
developing new product ideas has been widely documented in the literature (e.g.,
Khurana and Rosenthal 1998; Kim and Wilemon 2002; Kratzer, Leenders, and Van
Engelen 2004; Leenders, Engelen, and Kratzer 2003). Some organizations may deploy
a product champion approach where an original product idea is generated by an

27
individual. However, that idea still needs knowledgeable others to provide inputs and
refine the original ideas to achieve the state of practicability. Therefore, a group work or
team–based approach is suitable to unlock firms’ potential to generate new product
ideas (see Mohrman, Cohen, and Mohrman 1995).
Idea Generation and Creativity
The front end is the first stage of the NPD process. It includes all the idea
development activities that can lead to the organizational–level implementation of the
product innovation process (Reid and de Brentani 2004). Idea development in the front
end concerns itself with creativity task by creating the original ideas that are useful and
socially appropriate (Amabile 1983, 1996). Because idea development is a creativity
task, creativity theory is perhaps the most appropriate one to explain the extent to which
the outcomes of the task are pronounced creative (Amabile 1983; Guilford 1950; Kris
1952; Mumford and Gustafson 1988).
According to the componential view in creativity theory (Amabile 1983, 1996),
seminal works assert that creativity should be operationalized as a task’s outcome that
is judged by knowledgeable others (see also Briskman 1980; Harrington 1990;
Hausman 1979; Hocevar 1981). This idea is probably the most sensible and received
remarkable support in the extant literature (e.g., Amabile 1983, 1996; Amabile and Conti
1999; Amabile et al. 2001; Amabile et al. 2004; Amabile et al. 2005; Bailin 1994;
Ghiselin 1963; Harmon 1963).
Creativity is a result rather than a process and is impacted and justified by
several relevant groups of people (or the “fields”) (Csikszentmihályi 1988, p. 325; see

28
also Busse and Mansfield 1980; Csikszentmihályi 1990; Ford 1996). The social groups
or the “fields” in this sense represent the sub–community of people who also determine
to what extent new ideas (as a creativity task’s outcome) are considered creative or
innovative (Csikszentmihályi 1988, p. 325; Harrington 1990). These groups also perform
a significant role in the process of choosing, maintaining, and disseminating the ideas to
a larger group of potential adopters (Getzels and Csikszentmihályi 1975).
Because creativity is context–dependent and needs the incorporation of “social
recognition” as the judging criteria, it could be assessed by different important groups of
relevant individuals in a specific social setting (Mumford and Gustafson 1988, p. 27; see
also Getzels and Csikszentmihályi 1975). Specifically, Ford (1996, p. 1126) holds that
the assessment of creativity in organizational settings is performed through the
interaction among related “fields,” including: (1) “work unit members” (i.e., NPD team
members), (2) “socialized organizational actors” (i.e., other members in the
organization), (3) “functional/professional specialists,” and (4) customers (see also
Csikszentmihályi 1988, p. 336–337).
In the front end, the outcomes of idea development are new product ideas or
concepts. Subsequently, these new product concepts will go through the execution
phase of NPD where several NPD–relevant activities are performed by the
organizational members in the related work units (or the “fields,” Csikszentmihályi 1988,
p. 325; see Figure 1). In an NPD context, team members and customers seem to
represent the two “fields” (Csikszentmihályi 1988, p. 325) that mainly involve in the
assessment of a new product idea. The NPD team represents the work group that will
adopt the ideas for the subsequent NPD phase whereas target customers of the product

29
originated by this idea are those who will consequently deal with new product adoption.
From the “interactionist perspective” (Woodman, Sawyer, and Griffin 1993, p. 294; see
also Csikszentmihályi 1988, 1990; Ford 1996), it could be suggested that the extent to
which the new product idea/concept is considered creative depends upon the
judgments of these two groups (i.e., NPD team and end customers) who will later
accept and implement the idea for making new products, and adopt that product idea.
The assessment of the idea development outcomes by these groups are discussed in
following paragraphs.
The NPD team is the first group to implement a new product idea in the
successive activities. For example, the team will prepare the detailed design of the
product, work together on the specification of the product, create the prototype, and
help the project progress to the next stages of development. During the NPD process,
the team members discover whether they have creative product concepts/ideas to
execute. According to the creativity theories of which new and useful ideas are valued
(Amabile 1996), a creative idea for this team is best defined as the idea that could fit
and utilize the existing production infrastructure and probably increases the efficiency
and effectiveness of the NPD process.
The new product concept/idea should enhance the simplicity of the detailed
designs and the preparation of specification. The idea should be well refined in order
that it does not have to go back and forth between the pre–development and the NPD
execution phases because this could prolong the development of the new product (e.g.,
increase in cycle time, inability to tap the potential market at the right timing etc.) as well
as incur unnecessary costs which may diminish the product’s financial return.

30
The appropriateness/usefulness of the new product idea significantly affects the
efficiency and proficiency of NPD (e.g., reduced cycle time, increased productivity)
(Smith and Reinertsen 1991, 1992). This dimension of new product idea has exhibited a
significant relation with the success of NPD while the relationship between the idea’s
newness dimension (new to the firms) and the success of new products show several
evidences of a disparate finding (Cooper 1979; Griffin 1997a, 1997b; Hayes,
Wheelwright, and Clark 1988; Henard and Szymanski 2001; Page 1993; Rosenau 1988;
Womak, Jones, and Roos 1990).
From an NPD team’s view, the degree to which a new product idea is considered
creative tends to be more about the idea’s usefulness/appropriateness with the process
of NPD rather than newness. As such, the first creative outcome dimension reflecting
the social recognition criteria of a group of NPD team members (the first “field,”
Csikszentmihályi 1988, p. 325) is termed the idea appropriateness which reflects the
extent to which a new product idea is appropriate to the NPD process.
A group of target customers are considered the second “field” that will judge a
new product idea (Csikszentmihályi 1988, p. 325; Ford 1996). Responses from target
customers regarding new product ideas can be obtained during the execution phase of
NPD when the prototype test and validation are conducted as well as during the market
test of new product concepts. From the customer’s viewpoint, a creative new product
idea is assessed by the degree to which the idea is useful and original/unique to the
target group (Mintzberg 1988). A new product idea that could be executed to produce
the product that solves customers’ problems, satisfies their needs, or becomes useful to
them (respond to their sought benefits) is considered a useful idea (or idea usefulness);

31
and the new idea that could be implemented to generate customers’ perception of which
the idea is original and unique is idea newness (see Figure 2). According to Cooper
(1979), both dimensions of a new product idea possess significant impacts on the
success of new products.
In sum, the three dimensions of new product ideas represent the value that
instigates the related influential groups to consider the ideas creative. The value of new
product ideas implies their appropriateness which can enhance the efficiency of a NPD
process as well as their usefulness and newness which can effectively satisfy the target
customers’ needs and wants (or sought benefits) or solve customers’ problems.
According to Brown and Eisenhardt (1995), the efficiency and effectiveness are the key
indicators of new product success. NPD efficiency is defined in terms of “speed and
flexibility of development,” that is, a new product could be made with “a fast, productive
development process” while effectiveness reflects the extent to which NPD can result in
a “product with unique benefits and fit–with–firm competencies” (Brown and Eisenhardt
1995, p. 359, 366; see also Cooper and Kleinschmidt 1987; Zirger and Maidique 1990).
It appears that both the efficiency and effectiveness of new product ideas enhance the
success of NPD.
Componential Factors and Creative Ideas: the Individuals
The “componential theory” of creativity has consistently suggested that the inputs
of the creativity task are the crucial factors to achieve creative outcomes for new idea
generation (Amabile 1997, p. 42; see also Amabile 1983, 1996). Specifically, relevant
knowledge and skills (or “domain–relevant skills,” Amabile 1983, p. 363) are needed to

32
produce creative ideas in a specific domain (Amabile and Conti 1999; Woodman,
Sawyer, and Griffin 1993). Knowledge and skills are the functions of cognition, and “the
integration and reorganization of cognitive structures is likely to underlie major creative
contribution” (Mumford and Gustafson 1988, p. 27; Simonton 1999).
Adopting this theoretical perspective (Mumford and Gustafson 1988; Simonton
1999, 2003), this study proposes that the cognitive elements (or “knowledge elements,”
see Amabile et al. 2005, p. 368) and configuration are the foundations for understanding
creative outcomes in the development of new product ideas. Since this study focuses
on the team level where most of new product activities occur (Brown and Eisenhardt
1995), knowledge and expertise for the production of new product ideas in an
organizational setting can be looked at from two different levels–individuals and team.
Individuals in this sense are persons assigned to the development of new
product ideas. Baer (1993) suggests that the actual performance of ideation is
influenced by a distinct input for the task. That is, the availability of individuals’
necessary expertise. To be creative in a particular area, at least one should have
relevant knowledge and skills (Taggar 2002). This expertise encompasses
“competencies and talents applicable to the domain” or simply put, “everything that the
individual knows and can do in the particular domain” (i.e., NPD team members’
relevant knowledge and skills) (Amabile 2001, p. 333). It is an individual’s specialized
knowledge, skills, and experience in the domain (specialization).

33
FIGURE 2
CONCEPTUAL FRAMEWORK
To customers
To NP
D process
i3i417i216i1513i3
i2i4142i313i3i212i3i111i310i29i182i2
i1i472i36i3i25i3i14i33i22i111i1
XαXαXαu: Y3ModelXαXαXXαXXαXαXαXαu: Y2Model
XαXαXXαXXαXαXαXαu: Y1Model
εε
ε
++++=−
++−+++++=−
++−+++++=−

34
Following the “componential theory” of creativity (Amabile 1997, p. 42; Taggar
2002), this study defines specialization as the extent to which individuals possess
knowledge required for their functions as well as know how to implement that
knowledge for a specific task within that product domain. Domain reflects a meticulous
set of products. The idea of product domain is also distinct in consumer perspective.
From a traditional view, products within the same category encompass similar
attributes. However, consumers assemble product groups using their “familiar usage”
rather than the product’s conventional categories (Ratneshwar and Shocker 1991, p.
291). A product domain encapsulates the degree to which customers perceive several
products with similar/complementary usages and benefits to be in the same cluster of
interest. This product domain view is appropriate especially when technology becomes
converged, resulting in increased usage similarity and less distinct categories among
the products.
In NPD context, specialization in a product domain could be explained as the
complementary knowledge bases. For example, personal digital assistants (PDA),
laptop computers, cell phones, computer game console, portable music player etc. may
be classified into different product categories (e.g., consumer electronics, computers,
telephone). However, many attributes of these products have been developed by
utilizing some complementary knowledge bases. These relevant–knowledge bases
make up the product domain specialization that can be utilized to generate new product
ideas within that domain. In this sense, individuals possessing a depth of such
knowledge and skills are considered specialized in their domain (Taggar 2002).

35
Specialization also includes one’s “memory for factual knowledge, technical
proficiency, and special talents in a target work domain” (Amabile 1997, p. 42). In a
sense, it is an individual’s technical, procedural, and intellectual knowledge and skills for
that problem domain. Specialization could be the problem solvers’ “network of possible
wanderings” (Amabile 1983, p. 363). This refers to cognitive elements (or “knowledge
elements,” Amabile et al. 2005, p. 368) that guide individuals to solve a given problem
or perform a given task in a specific domain. Simonton (1999, p. 79) views these
elements as individuals’ “repertoire of ideas.” Each cognitive element represents the
chunk of ideas that could be related to the product domain. The amount of cognitive
elements available in memory reflects the extent to which individuals are specialized in
the domain.
As proposed by Simonton (1999), the number of cognitive elements becomes
crucial to individuals’ ability to produce creative ideas. He asserts that the internal
process of idea generation within a creator’s mind comprises the “variation–selection
process” (Simonton 1999, p. 26). This is strongly supported by Costello and Keane
(2000, p. 301) who hold that “conceptual combination often involves two processes:
first, the construction of a combined concept, and then the use of that constructed
concept to find an existing referent in the preceding discourse context.” In the process
of variation, individuals resemble the available cognitive elements to generate novel
ideas (Simonton 1999, 2003). A creative idea or an invention is somehow a new
combination of cognitive elements that have been gathered and stored in the memory
(Offner 1990; Schumpeter 1934; Woodman, Sawyer, and Griffin 1993). Simonton
accordingly notes that “to generate ideational variations, a person must have a sufficient

36
repertoire of ideas that can be subjected to some combinatorial procedure” (1999, p.
79). Therefore, the more the person has cognitive elements or specialization, the more
likely that person can assemble new combinations, thus resulting in novel ideas.
Specialization also possesses important impacts on the selection process.
Simonton (1999) suggests that in an idea creator’s internal selection process (at the
“cognitive level,” see Simonton 1997, p. 67), the idea creator with large number of
cognitive elements has better chance to appropriately align those elements to the given
problem (see also Amabile et al. 2005). This mechanism can establish the internal
criteria within a creator’s mind to select novel ideas (or reject non–novel ideas) that are
adaptive to the given problem or the environment. These variation and selection
processes intermingle while the creative process unveils.
The concept abovementioned could be applied in the NPD context. For example,
a research and development (R&D) expert in developing a laptop computer likely has
knowledge about its parts, materials, component functions and utilities, and how all
components work together as a single product. He or she encompasses knowledge
about utilities and functions of several components that can be recombined, rearranged,
or utilized for different product within that domain, i.e., knowledge about memory chip,
random access memory, circuits, digital data technology, display units, input and output
signal, and processor. All of these can be considered the chunks of ideas/information
stored in that person’s memory and represent his or her number of cognitive elements.
When that person comes to develop a new product concept of a new portable
music player, he or she can utilize knowledge and experience about the laptop
computer parts to create a novel, portable music player by putting together some

37
components that can provide new functions and features. A new music player may
utilize the same technologies (e.g., memory, sound system, software) the creator learns
from developing the laptop computer to generate a new product concept that
outperforms several others in the market. In this sense, the expert develops a new
product idea/concept by recombining his or her existing cognitive elements. The more
specialized the person is, the more the number of the recombination or new product
ideas he or she can produce.
Moreover, an expert’s specialization has built for that person the internal criteria.
These criteria could be used as reference to select and recombine the cognitive
elements that could result in the appropriate ideas for a given problem. The creator with
a high level of specialization has learned what kind of new product ideas are considered
new, useful for a given problem, and appropriate for the firm’s existing production
system. New combinations of cognitive elements or new ideas can be tested against
these criteria for usefulness, appropriateness, and novelty. Therefore, it can be
proposed that:
H1: As the level of specialization of an idea creator increases, the creator generates a higher level of idea newness.
H2: As the level of specialization of an idea creator increases, the creator generates a higher level of idea usefulness.
H3: As the level of specialization of an idea creator increases, the creator generates a higher level of idea appropriateness.
Componential Factors and Creative Ideas: the NPD Team
As NPD becomes more complex, the generation of creative new product ideas
needs “a greater amount of domain–relevant knowledge and skills” (Griffiths–Hemans

38
and Grover 2006, p. 29). Using a team or group has been identified as an effective
approach to enhance knowledge utilization and the generation of new ideas (Nijstad,
Diehl, and Stroebe 2003). There is a higher chance that people can develop creative
ideas when they work together as a team (Nijstad, Diehl, and Stroebe 2003; Paulus et
al. 1993; Stroebe, Diehl, and Abakoumkin 1992). Dennis and Valachich (1994) compare
group performance among the integral groups, several small sub–groups, and
individuals and find that the integral groups are the most efficient setting for generating
new ideas. Paulus and Yang (2000) conclude that team could be an appropriate way to
increase creativity and innovation in an organization.
This team–for–innovating concept has been witnessed in NPD where
practitioners have recognized the importance of the use of team to utilize multiple
knowledge bases in developing new products (see Kappel and Rubenstein 1999;
Mohrman, Cohen, and Mohrman 1995). The success of Toyota’s NPD has shown
positive relation with the impressive degree of integration among involving functions
while the company ensures that those functions maintain their expertise (Sobek, Liker
and Ward 1998). In the group brainstorming studies, Sutton and Hargadon (1996; see
also Hargadon and Sutton 1997) spent almost a year on their ethnographic study of
NPD teams at IDEO–a prominent new product design and idea generation firm. This
study shows that, among the others, diverse functional background is a part of the
teams that conduct the efficient and effective brainstorming. This may imply that diverse
expertise could enhance the idea development for new products.
Based on the above discussion, diverse expertise is defined as the team or
group approach that has been used to actively recruit members with different expertise

39
in different functional background and skills to an idea generation task (see Ford 1996;
Khurana and Rosenthal 1996). Diverse expertise in this sense represents the idea–
generation team members’ expertise to serve as raw materials for ideation.
Incorporating diverse expertise into an ideation team increases the number of
domain–relevant knowledge sources (e.g., R&D staff, industrial designers, marketers,
engineers). An example of the utilization of diverse expertise in the development of new
product ideas is the formal use of brainstorming session during idea development (e.g.,
Hargadon and Sutton 1997; Sutton and Hargadon 1996). This setting allows the design
team members to access diverse knowledge sources. Diverse expertise can also
channel additional knowledge from a firm’s external sources or organizational memories
(i.e., archived data from previous NPD projects), thus increasing the number of
knowledge bases within the team as well, i.e., marketing staff can bring in knowledge
from marketing consultants while production engineers can share new knowledge from
suppliers.
Having diverse expertise within an ideation team directly increases the gross
number of cognitive elements available to the team (however, some of these elements
may be replicated while some of them could be complementary). Generally, the
availability of these cognitive elements directly correlates with the possibility of creative
idea generation (Taylor and Greve 2006). When the team members confront an ideation
task, they get into the process of searching a “space of possibilities” or the possible
combinations of cognitive elements in their memory (Dahl and Moreau 2002, p. 48; see
also Newell 1990; Perkins 1997). The ideation team high with diverse expertise allows
its members to build on the expertise of others by having access to more knowledge

40
sources during the creativity task process (Hargadon and Sutton 1997; Sutton and
Hargadon 1996). As such, the probability of novel ideas may be high when the ideation
team is composed of individuals with diverse expertise.
Support of this idea can be found in extant research. It is believed that the
increase in the availability of knowledge bases can increase the probability of
knowledge activation in multiple existing domains (Nijstad, Diehl, and Stroebe 2003).
The availability of multiple bases of knowledge allows the team members to “borrow
both attributes and relations from available domains and use them in the creation of a
novel target” (Dahl and Moreau 2002, p. 48). Conversely, expertise that is too specific
limits the breadth of cognitive elements and leads the idea creator to a conventional
way of thinking (Ford 1996; Simonton 1983). It is very likely that diverse expertise can
increases the potential of additional associations or new ideas that the team members
can produce as well as the breadth of ideas that the creators can selectively retain as
the most appropriate to a problem at hand, i.e., useful to customers and appropriate to
the NPD production facilities.
The positive impacts of diverse expertise on creativity can also be explained in
terms of the interaction between different “performance scripts” (Amabile 1983, p. 363;
see also Schank and Abelson 1977). Team members from different functional
backgrounds encompass expertise in different knowledge bases (i.e., expertise in
different functions) and probably different knowledge domain (i.e., expertise in different
product domains). When the ideation team members are assigned to a creativity task,
each creator brings in his or her “scripts” (Amabile 1983, p. 363; Schank and Abelson
1977) to solve the assigned creativity problem, that is, the creation of a useful and novel

41
product idea/concept. In groups, idea–sharing individuals are exposed to more “scripts”
during their session than solitary idea generators, and there is much potential for
“cognitive stimulation” in groups (Nijstad, Diehl, and Stroebe 2003, p. 149; see also
Brown et al. 1998; Paulus, Larey, and Dzindolet 2000) as well as the re–examination of
each others’ “scripts” (Amabile 1983, p. 363–365; see also Langer and Imber 1979).
This interaction can stimulate creative thinking (Nijstad, Diehl, and Stroebe 2003).
Moreover, this process allows the idea creators to build on other experts’ ideas (see
Osborn 1993) by providing clues for new combination. A greater amount of new
association consequently increases the breadth of newly combined cognitive elements
(or ideas) that can be appropriately selected for a given quandary.
According to Parent et al. (2000), it is suggested that the team setting with
diverse expertise allows the idea to be intricate and improved through interaction within
the team. For instance, the R&D staff may propose a new product idea to the team. This
idea may stimulate knowledge bases of marketing staff and production and design
engineers during an idea–sharing session. Creators from both functions may enrich the
idea to achieve the level of usefulness to customers as well as appropriateness for the
existing manufacturing system while maintaining its newness dimension. In similar
fashion, marketing staff may suggest a new product concept which, based on marketing
knowledge bases, is considered unique and useful to customers. Creators from R&D
function may also suggest a minor change in the product components to exhibit the
market value of newness and usefulness while their proposed ideas may spark new
inputs from manufacturing engineers to redesign the prototype to appropriately and fully
utilize the production facilities (e.g., Kazanjian, Drazin, and Glynn 2000). In summary, it

42
can be proposed that diverse expertise enhances creativity, especially the new, useful,
and appropriate ideas. Consequently, it is hypothesized that:
H4: As the level of diverse expertise of the ideation team members increases, they generate a higher level of idea newness.
H5: As the level of diverse expertise of the ideation team members increases, they generate a higher level of idea usefulness.
H6: As the level of diverse expertise of the ideation team members increases, they generate a higher level of idea appropriateness.
Constraint and the Componential Factors–Creativity Relationship: Impact on Individuals
The concept of constraint has long been researched in the extant studies (Carey
1985; Chomsky 1957; Fodor 1983; Gelman and Gallistel 1978; Keil 1981; Li and
Gardner 1993; Stokes 2001; Stokes and Fisher 2005; Stokes and Harrison 2002).
These researchers propose that “human cognition is seen as not infinitely constructive
or wholly adaptive; rather, it is constrained,” that is, it is constrained by some factors
that set the framework for acquiring proficiency within that framework (Li and Gardner
1993, p. 95). This is supported by Johnson–Laird (1988, p. 216) who asserts that “the
creator generate ideas making use of some initial constraints.” The general concept of
constraint on creativity holds that one constraint “promotes (or directs search among)
high variability, novel responses” that could lead to creative outcomes, and
simultaneously “precludes (or limits search among) low–variability, tried–and–true
responses” that could lead to conventional results (Stokes and Fisher 2005, p. 284; see
also Stokes 2001, 2006; Stokes and Harrison 2002).

43
Several definite constraints have been suggested (e.g., “goal, domain, talent,
cognitive, subject, source”) to have the effects on creativity (Stoke 2006, p. 8; Stokes
and Fisher 2005, p. 285). However, these constructs seem to be overlapped and, to the
best of this author’s knowledge, have not been empirically developed or intensively
validated. Stokes and Fisher (2005) suggest that only goal constraint seems to be
global and probably directs all lower level constraints. In addition, they suggest that goal
constraint encapsulates the overall criteria and “stylistic conventions” for a particular
domain (Stokes and Fisher 2005, p. 283; see also Stokes 2006). Hence, incorporating
goal constraint into the framework of creativity seems to implicitly delineate the overall
impacts of constraint on creativity.
Adopting this perspective (Johnson–Laird 1988; Stokes 2006), this study
suggests that goal constraint for NPD reflects the frame of reference for new product
ideas to be developed. For example, goal constraint for creativity in architecture for
Frank Lloyd Wright was “an organic structure, which he articulated as – among other
things – building from the inside out, making a unit of the building and its environment”
(Stoke 2006, p. 75). By setting goal constraint in this way, “Wright precluded separation”
and directed the search of ideas on designing “as if a house were a single room” (Stoke
2006, p. 71). He excludes the other design pattern and focus on the box concept to
enhance variation that is useful to buyers within that constraint (Stoke 2006). Another
example, Stoke (2006, p. 91) notes that “functional” is an important goal constraint for
creativity in Leo Burnett’s advertising. Functional advertisement gets target customers
to behave (as directed by the ads). Within this constraint, creative staff can produce
variation much more efficiently, i.e., anything new but functional. One employee at this

44
firm noted that “if we tried to create without constraints, the ads would just be noise”
(Stokes 2006, p. 100).
In consumer electronic context, goal constraint for Philips’ product development
is probably “sense and simplicity” or “humanized technology” (see Tiplady 2005). The
company sets its goal constraint for new designs and new product ideas that technology
should not increase difficulty for users (“simplicity”) but it should be designed around the
users’ daily activities (“sense”) (Tiplady 2005). For example, Capell (2006) wrote that,
“…any lay person can operate Philips’ Heart Start defibrillators to shock a topped hear
back into action.” Capell (2006) further described that, “There's also the Perfect Draft
beer dispenser, a twist on Philips' hugely successful Senseo coffee makers, which
allows you to enjoy the same cooling, pressure, and foam at home that you do in the
pub.” By setting the constraint in this way, Philips design team shifts focus from
hardware toward building extensive interaction with its end customers (or the “field,”
Csikszentmihályi 1988, p. 325) who will adopt the product ideas and the finished
products (see also Capell 2006; Tiplady 2005). The design team is also exposed to
groups of professionals within the product domains (see Capell 2006), and these people
represent another social group that judges the product ideas. This approach
perpetuates the team members to acquire essential knowledge from imperative social
groups under the guidance of their established constraint (see Philips’ NPD practices in
Tiplady 2005).
In this sense, goal constraint attempts to locate possible associations within the
space that locates between heuristic and algorithmic ends. Goal constraint does not go
deep into detail by drawing the rigid scheme for new thought. Instead, goal constraint

45
prohibits the waste of cognitive efforts and uncreative association by inhibiting
anything–goes (completely heuristic) approach. At the same time, goal constraint
directs specialization of idea generators to “the scope of explored possibilities”
(Goldenberg, Lehmann, and Mazursky 2001, p. 72). As suggested by Finke, Ward, and
Smith (1996, p. 32), “restricting the ways in which creative cognitions are interpreted
encourages creative exploration and discovery and further reduces the likelihood that a
person will fall back on conventional lines of thought” (see also Goldenberg, Mazursky,
and Lehmann 1999, p. 204). This constraint increases the potential to have greater
variation within that scope (compared to without constraint) and prevent the generators
to surrender themselves to habitual views (Finke, Ward, and Smith 1992; Goldenberg,
Mazursky, and Lehmann 1999).
From a cognitive psychology perspective (Simonton 2003, p. 485), goal
constraint should be “vague” and “ambiguous” or “any combination” of these
characteristics. For example, goal constraint of Philips’ new product design is loosely
defined (i.e., advanced technology with extremely ease of use) rather than strictly
characterized (i.e., specific features or attributes of certain products). In a sense, goal
constraint can frame the boundary for the combinations/associations of cognitive
elements. Idea creators with a high level of specialization have more cognitive elements
than novice. With this mild restriction, the idea creators high with specialization can
increase atypical combination (rather than typical combination which is unlikely to result
in creative ideas) of available cognitive elements within the constraint (Finke, Ward, and
Smith 1992). This can lead to more original associations and increase the breadth of

46
new cognitive combinations that increases the chance to generate ideas appropriate for
a given quandary. Hence, the process results in more new and useful ideas.
This goal constraint–creativity idea is additionally supported by cognitive
psychology research which has shown that moderately restricting the scope of an
ideation task enhances innovative productivity and industrial practices (e.g., Brown and
Duguid 2000, 2001; Khurana and Rosenthal 1998; Perkins 1981; Perkins and Grotzer
1997; Weisberg 1992). The seminal works in “new product ideation” (Goldenberg,
Mazursky, and Solomon 1999, p. 200) support the increase of idea generation
effectiveness when the creators are given some limits on “the scope of explored
possibilities” (Goldenberg, Lehman, and Mazursky 2001, p. 72).
A case study at Google is among several good examples. According to her
experience as the vice–president for search products and user experience at Google,
Mayer (2006) noted that “when balanced with a healthy disregard for the impossible,
constraints can shape and focus problems, leading to truly creative solutions.” A field
example from Google strongly supports this idea. Goal constraint for the development of
a new Google Toolbar is “to create a toolbar that works for all users” i.e., all types of
users’ monitors and all kinds of Internet connection (Mayer 2006). Google idea
development team encompasses specialization in the product domain. Goal constraint
reflects the “the scope of explored possibilities” (Goldenberg, Lehmann, and Mazursky
2001, p. 72) of which the changes in customers’ behavior must be minimized by
allowing them to continue using what they currently have (i.e., current monitors and
dial–accessed connections with narrow bandwidth when they adopt Google’s new
features) (see also Mayer 2006). By framing the problem in this way, goal constraint for

47
the Google idea development team is moderately set. The constraint establishes the
space of association and allows the ideation team to be more creative by increasing
variation of their new product ideas within what customers’ acceptance range. This goal
constraint stimulates their cognitive efforts to come up with atypical combination base
on their available cognitive elements within the constrained framework. Mayer (2006)
concluded that the development team successfully came up with new functions within
that constraint–the condition of which any type of customers’ Internet connection and
monitors could be used to run the Google’s new toolbar.
The above discussion reaffirms that conditioning the ideation process with goal
constraint precludes the area beyond the acceptance range of customers and
simultaneously promotes the search for variation within an appropriate high variability
(and possibility) space. In a sense, goal constraint directs the specialization of idea
generators to the moderately defined framework, thus increasing the potential to have a
higher variation within that constraint (compared to without constraint) and prevent the
generators from falling into a trap of conventional train of thought. Hence, it could be
proposed that:
H7: As goal constraint in the development of new product ideas increases, an idea creator having a high level of specialization generates a higher level of idea newness than the creator having a low level of specialization.
H8: As goal constraint in the development of new product ideas increases, an idea creator having a high level of specialization generates a higher level of idea usefulness than the creator having a low level of specialization.

48
Constraint and the Componential Factors–Creativity Relationship: Impact on NPD Teams
While goal constraint helps promote the variation by framing specialization (or
aligning cognitive elements) in the creators’ mind, it can stimulate creative idea among
diverse experts in an ideation team. Having diverse expertise in a new product idea
generation team allows the integration of diverse knowledge sources, resulting in more
available cognitive elements. According to Simonton (1999), the availability of these
elements improves the chance of associations and variation (see also Paulus and Yang
2000). However, an attempt to integrate different expertise may result in too–diverse
knowledge. Attempting to recombine too–diverse knowledge is unlikely to generate
creative outcomes (Gough 1976; Mumford and Gustafson 1988). “When knowledge
component are diverse, uncertainty about the value of each component increases the
uncertainty of the output, however, and so does uncertainty about the optimal way to
combine components” (Taylor and Greve 2006, p. 727). The integration of the ideation
team members with extremely diverse knowledge may end up with failure as well as
radical innovation (see Taylor and Greve 2006).
Goal constraint can facilitate the combinations of knowledge elements by
providing the frame of reference (e.g., advanced technology at ease of use, lowest
behavioral trade–off, functional, etc.) (Stokes 2006). This reference precludes the
combination of too–diverse knowledge elements which can result in awkward and
unfeasible outputs (e.g., Arthur 1989; March and Simon 1958; Taylor and Greve 2006)
and simultaneously promotes variation from the new association of knowledge elements
within the frame of reference (Stokes 2006). This constraint increases the opportunity to
have the recombination of moderately remote cognitive elements. The extant literature

49
has shown that “the use of moderately rather than highly remote associations is related
to creative achievement in professional occupations” (Mumford and Gustafson 1988, p.
33; see also Gough 1976; MacKinnon 1962). In addition, it is possible that goal
constraint can get the ideation team members focus on the exploitation of their
specialization within the frame of reference (or constrained territory). This can stimulate
the dialogues among the team members and maintain the momentum of the team’s
idea sharing. Paulus and Yang (2000) assert that the idea sharing can stimulate team
cognition. Thus, goal constraint can enhance new associations among the ideation
team members. It is very likely that when there is an increase in the moderately remote
association or newly generated ideas within the team, the availability of these ideas
enhances the breadth of newly combined ideas. These affluent associations enrich the
chance for the team to selectively retain the ideas most relevant to their problems, thus
increasing the potential for novel and useful ideas.
H9: As goal constraint in the development of new product ideas increases, an ideation team having a high level of diverse expertise generates higher level of idea newness than the team having a low level of diverse expertise.
H10: As goal constraint in the development of new product ideas increases, an ideation team having a high level of diverse expertise generates higher level of idea usefulness than the team having a low level of diverse expertise.
Goal Constraint–Creativity Paradox
In the process of new product idea generation, perceived goal constraint may
raise concerns regarding their jobs and assigned tasks (or job stress) among the
ideation team members. Ofori–Dankwa and Julian (2004, p. 1459) assert that
employees’ job stress or concerns can incur “cognitive tension” (see also Newton and

50
Keenan 1987). This stress or tension could engender the team members’ feeling (i.e.,
feel challenge from.., feel stress from.., and feel pressure from…) which is another type
of affect (see Barsade and Gibson 2007).
Review of extant literature reveals that the influence of affect on creativity is not
consistent across several studies. According to Barsade and Gibson (2007), the positive
affect directly correlates with creative performance. Montgomery, Hodges, and Kaufman
(2004) similarly note that creative result is enhanced by a positive mood state. However,
there is evidence that tension exhibits negative effect on creativity (Van Dyne, Jehn,
and Cummings 2002). Moreover, George and Zhou’s (2002) study reveals the
surprising results in which creativity exhibits direct relation with negative moods and
inverse relation with positive moods. This plurality of the relationship between affect and
creativity are also found in business and creativity literature (e.g., Filipowicz 2006;
Wright and Walton 2003).
Although this study has argued that goal constraint construes creativity, the
common wisdom probably holds that this constraint may simultaneously inhibit
innovative way of thinking. The inconsistencies in extant literature render this study to
adopt the paradoxical view to explain the goal constraint–creativity relation.
As proposed by Lewis (2000, p. 774), the “paradox framework serves as a lens
for examining surprising findings and seemingly absurd aspects.” Adopting the
paradoxical concept (Lewis 2000), Ofori–Dankwa and Julian (2004) postulate that the
impact of affect on creativity could be speculative as paradox. They delineate that job
stress (or goal constraint in this study context) at low to moderate level acts as
motivation for designated staff to accomplish the task while too much stress causes

51
counterproductive creative performance (Ofori–Dankwa and Julian 2004; see also
Hollenbeck et al. 1995; Oldham et al. 1995). This idea also gains support from the
affect–creativity relationship research. Using Martindale’s (1981, 1995) theories, James,
Brodersen, and Eisenberg (2004) propose that (1) mild–to–moderate arousal can
increase cognitive resources and direct the creators to pay attention to new association,
and (2) arousal exceeding moderate level reduces cognitive resources because it
diverts the creators’ attention from the combination and probably disengages the
creators from the acquisition of information that is necessary for the generation of new
ideas (see also Isen, Daubman, and Nowicki 1987; McAdam 2006; West and Martindale
1996). Because the amount of cognitive resources has direct impact on creativity of
ideas (e.g., idea newness, idea usefulness) (Simonton 1999), it could be speculated
that goal constraint has inverted U–shaped relationship with creative outcomes.
H11: As goal constraint increases beyond the moderate level, it is likely that this constraint inhibits idea newness in the development of new product ideas.
H12: As goal constraint increases beyond the moderate level, it is likely that this constraint inhibits idea usefulness in the development of new product ideas.
Planned Analysis: Model Specification
To test the hypothesized relationship, the estimated models are specified as the
following forms (see also Figure 2):
1iε4iX7α23iX6α3iX2iX5α3iX1iX4α3iX3α2iX2α1iX1α1
u1i
Y ++−+++++= Model1
2iε4iX14α23iX13α3iX2iX12α3iX1iX11α3iX10α2iX9α1iX8α2u2iY ++−+++++= Model2
3iε4iX17α2iX16α1iX15α3u3iY ++++= Model3

52
where 1Y is idea newness; 2Y is idea usefulness; 3Y is idea appropriateness; 1X is
specialization; 2X is diverse expertise; 3X is goal constraint; 4X is covariate; iα is
parameter estimates; and iε is an error of estimation. The exponential terms
( 23i63i3 XαXα −+ and 2
3i133i10 XαXα −+ ) are specified to test the curvilinear relationship
between goal constraint and idea newness and usefulness (Aiken and West 1991;
Cohen et al. 2003).
The model is run using a multivariate technique (Cohen et al. 2003; Hair et al.
1998; Jaccard, Wan, and Turrisi 1990; Neter et al. 1996) while all necessary statistics
are verified to satisfy the technique’s statistical assumptions. Although the interest of
this study is within the context of identifying the effects of componential factors and
constraint on creativity in a new idea development team environment, it is asserted that
the research frame should incorporate the influential factors as well as the confounding
variables that may provide rival explanation. This approach can allow the unique
impacts of componential factors and goal constraint on creativity to be clearly identified.
Therefore, turbulence is selected as the potential covariate and is included in the
model. This construct measures rivalry intensity and environmental changes, especially
the changes concerning technology, customers’ product preferences, and market
(Atuahene–Gima 2005; Jaworski and Kohli 1993). Turbulent environment may put
certain level of pressure on idea creators to generate new products that capture these
changes. This state of team members’ mind may prevent them to take an
unconventional approach to create new product ideas. Because this construct
measures various contextual aspects that could influence the outcome of the ideation
process in NPD, the inclusion of turbulence in the model is fairly justified.

53
CHAPTER 3
METHOD
Sample Frame and Procedure
The technological product industries are selected as the study context to test the
hypothesized model and its associated hypotheses. Several industries that are
considered moderate to high technology use cross–functional structure and rely on a
team approach to develop new products. These types of sectors represent the cross–
sectional data that can allow a survey approach to capture the variation among idea
creators, teams, and organizational setting (captured in the major constructs and a
covariate in the hypothesized model). Additionally, these industries require high level of
technical skills and interdependence among different work functions (e.g., Kazanjian,
Drazin, and Glynn 2000), which is consistent with the team–based approach envisioned
in this study. It is envisaged that this can increase the correspondence between context
and respondents.
To this end, this study employs the multimode strategy for data collection. Both
mail and web–based surveys were used for gathering data. Review of the literature
suggests that mail and online surveys “complement each other” and should be used
together to increase sample representativeness (Ilieva, Baron, and Healey 2002, p. 362;
see also Roster, Rogers, and Albaum 2004; Schaefer and Dillman 1998). Ilieva, Baron,
and Healey (2002) suggest that there are several advantages of online survey, including
(1) increased response rate, (2) reduced response time, and (3) greater data quality.
According to their study, the virtual surveys exhibit 15%–29% response rates in 1999;
34% of the online surveys were completed within less than two weeks, 33% within two

54
to four weeks, and 33% took longer than four weeks (Ilieva, Baron, and Healey 2002, p.
364–366). In addition, a researcher using web–based survey can control its availability
to potential respondents and receives more complete information than mail survey
(Ilieva, Baron, and Healey 2002; Schaefer and Dillman 1998). Based on several
evidence of advantage, web survey was used along with mail survey.
As with any key informant research, the goal of this study is to identify the person
who would be knowledgeable about the front end as well as NPD (Cini, Moreland, and
Levine 1993). The prescreening process was conducted to identify the appropriate
informants concerning their knowledge about the front end. The informants were
contacted to verify their indication and willingness to participate in the study and as the
proper sources of information. The informants who were unenthusiastic to participate or
inappropriate were asked to refer to the proper sources. Because one of the data
sources (the contact list for mail survey) did not provide the telephone and email
address, the list of informants was screened by their basic work group and functions.
The informants were asked to report on the most recently developed new product that
has been in the market. This method “avoids selection and social desirability biases
toward more successful products” (Im and Workman 2004, p. 119) and additionally
prevents the common method bias when the same source of informants were used to
collect data for both independent and dependent variables.
In addition, identifying the right informants also causes the other desirable effects
on survey research. The informants who are knowledgeable about the study are more
likely to provide inputs regardless of the survey types. Survey literature has suggested

55
that addressing the right target respondents possessing relevant expertise may
increase the survey response rate (Cavusgil and Elvery–Kirk 1998).
A response rate of a survey study is a critical factor that can significantly impact
the sample representativeness. The higher the response rate, the greater the
opportunity the data can represent the sample frame. To address this concern, the
creation of survey materials followed the approach recommended by previous survey
literature. Adopting these survey techniques may be able to boost the mail survey
response rate. Yu and Cooper (1983) show that questionnaire length has a negative
correlation with response rate. Their findings suggest that surveys with 61–150
questions can provide as high as 50.7% response rate (Yu and Cooper 1983, p. 39).
The latter suggestion helped in the design of the questionnaire.
Cavusgil and Elvery–Kirk (1998) additionally indicate that a “social utility appeal”
is a crucial motivational factor for survey respondents. This appeal reflects the extent to
which the respondents perceive that their help in completing questionnaires can make
things better for society (Cavusgil and Elvery–Kirk 1998). Survey having this appeal has
significantly higher response rate than the survey without such indication, and this
appeal works well when the survey is endorsed by a university (Cavusgil and Elvery–
Kirk 1998).
Finally, the respondents were offered non–monetary incentives (e.g., study
summary, discussion with the principal investigator regarding the study results). This
technique has been suggested to improve the response rate (Yu and Cooper 1983),
and it fits with the “social utility appeal” (see Cavusgil and Elvery–Kirk 1998). In addition
to the promise of anonymity of the respondents, the cover letter content was written to

56
reflect the two motivational factors in order to increase the response rate, as shown in
the following excerpt:
“…..This research aims at exploring and understanding the
interaction between "constraints" and "creativity" as well as other team
and organizational factors that free, preclude, and promote ideas for
innovation in the front–end of NPD. Since the decision made during the
ideation process can lock in 75–85% of subsequent NPD costs, this
research is expected to provide insights that improve the quality of the
new product ideas the teams generate…
All information obtained from the participants will be kept
confidential. Only the general findings will be shared. Upon the completion
of your survey, you can request an executive summary of the study results
(in PDF format) by providing your email address. Further clarification of
the ideas resulting from this research project can be arranged between the
participants and the principal investigator.”
Scale Item Development
The description and understanding of creative behavior could be made only with
careful consideration within the context of interest. Several constructs embodied in this
study (e.g., goal constraint, specialization, diverse expertise, idea appropriateness)
have not been developed empirically for the front end of the NPD context. Although
using the existing scales developed elsewhere generally ensures a high level of

57
reliability, using measures inconsistent with the research context may cause serious
troubles relative to both internal and external validity (Campbell and Stanley 1973).
Review of creativity literature showed that specialization, diverse expertise, and
idea appropriateness have not been developed specifically for the NPD ideation
context. Most of the creativity scales were invented to instinctively capture individual
traits and characteristics in an organization (e.g., Amabile et al. 1996; Amabile and
Conti 1999; Amabile et al. 2004; Amabile et al. 2005; Bharadwaj and Menon 2002;
Griffiths–Hemans and Grover 2006). Moreover, the concept of goal constraint is
relatively new (Stokes 2006), and, to the best knowledge of this author, none of the
established scales to date was designed to appropriately capture this construct.
In sum, it appeared that some measures needed to be developed while some
variables in the extant literature that could be borrowed or appropriately modified could
be used in this study. Therefore, measures for four constructs were newly constructed
for this study context, including specialization, diverse expertise, idea appropriateness,
and goal constraint. Measures for the two dependent variables (idea newness and idea
usefulness) were adapted from Im and Workman’s (2004) product newness and
usefulness scales, and a measure for the control variable (turbulence) was borrowed
from Atuahene–Gima’s (2005) turbulence (see also Jaworski and Kohli 1993). These
measures have been extensively validated in the literature and exhibited high reliability
(product newness, α =.89; product usefulness, α =.91; turbulence, α =.78).
The development of new scales followed the rigorous procedure recommended
by several marketing scholars (Van Auken, Barry, and Bagozzi 2006; Baumgartner and
Steenkamp 1996; Gerbing and Anderson 1988). The initial measurement items were

58
drawn from an intensive review of the literature. To prevent the common method bias
(systematic error) that might arise from using the same informants for both independent
and dependent variable (Podsakoff et al. 2003), the study context was provided in the
introductory paragraph of the questionnaire. In this paragraph, the potential respondents
were suggested to select the most recently developed product that they have
knowledge about its idea development process. This selected product should currently
be or have been on the market. They were asked to share their opinion about the idea
development process, and the feedback from customers and the new product
development staff on the approved idea that was used for developing the selected
product. In addition, a more specific description concerning each construct was given
immediately before the questions (see Table 3). Because this study uses retrospective
questions, giving a specific context and increasing the chance of event recognizability
can provide a “temporal context” to foster recall accuracy (Larsen 1992, p. 486; Sobell
et al. 1990).
In addition, three marketing experts and one industrial organization expert served
as the panel to verify the face validity of the questions. According to the mail list vendor,
the sample appeared to represent various ethnic backgrounds. To prevent the
misinterpretation or interpretation discrepancy among cross–ethnic samples, the
questionnaires were sent to the NPD practitioners who were knowledgeable about the
development of new product ideas. Some of these practitioners have different ethnic
backgrounds. The practitioners were requested to give feedback and comments
regarding the questionnaire, especially the content of a questionnaire that might be
misinterpreted by respondents. This process necessitates the “measurement

59
equivalency” (especially the “cross–ethnic equivalence”) which ensures that the scale
items and response categories are interpreted the same across the sample
(Krishnakumar, Buehler, and Barber 2004, p. 809; see also Singh 1995; Van Auken,
Barry, and Bagozzi 2006). Moreover, it is essential to have NPD practitioners and
experts compare the scale items against the survey instruments’ domain in order to
establish content validity (Huck 2003). Finally, the practitioners’ and expert panel’s
comments were incorporated in the scale. The scales were refined and included in the
questionnaire before administering the survey.

60
TABLE 3
MEASURES
Construct Questions(a) (5–Point Likert Scale, Strongly Disagree [1] to Strongly Agree [5] )
Specialization (Special)
Please indicate how strongly you agree or disagree with the following statements concerning a group of people you worked with during the development of ideas for the selected product. We worked with a group of people who … 1) were knowledgeable about the relevant product categories (sp1). 2) were knowledgeable about the development of similar products (sp2). 3) had experience with the technology used in similar products (sp3). 4) had experience in new product development in relevant product categories (sp4). 5) experienced with developing similar products (sp5). 6) had necessary skills for developing similar products (sp6). 7) were experts in relevant product categories (sp7).
Diverse expertise (Diverse)
Please indicate how strongly you agree or disagree with the following statements concerning a group of people you worked with during the development of ideas for the selected product. We worked with a group of people who … 1) had diverse expertise (dv1). 2) had diverse knowledge (dv2). 3) represented all the different work functions required to deliver the new product (dv3). 4) had different skills pertinent to developing new products (dv4). 5) had different educational background (dv5). 6) had diverse experience in new product development (dv6).
Continue…
(a) Item abbreviations in parenthesis

61
TABLE 3
MEASURES (CONTINUED)
Construct Questions(a) (5–Point Likert Scale, Strongly Disagree [1] to Strongly Agree [5] )
Goal constraint (Constraint)
Please indicate how strongly you agree or disagree with the following statements concerning the constraint on the development of ideas for the selected product. 1) The goal constraint for the idea development reflected customers' needs (go1). 2) The development of new product ideas was constrained within the framework inspired by
customers (go2). 3) We did not put any customer–related constraint while developing new product idea (go3). (–)* 4) The specific overall criteria about customers guided our new product idea development (go4). 5) Idea creators were encouraged to think about new product idea within a specific framework
that was set by customers (go5). 6) We used customer data to frame the problem for developing new product ideas (go6). 7) There was no constraint from customers for developing new product ideas (go7). (–)* 8) There was no customer–related framework for developing new product ideas (go8). (–)
Turbulence(b) Please indicate how strongly you agree or disagree with the following statements concerning the market and competitive environment during the last 5 years. 1) The actions of local and foreign competitors in our major markets were changing quite rapidly
(tur1). 2) Technological changes in our industry were rapid and unpredictable (tur2). 3) The market competitive conditions were highly unpredictable (tur3). 4) Customers' product preferences changed quite rapidly (tur4). 5) Changes in customers' needs were quite unpredictable (tur5).
Continue…
(a) Item abbreviations in parenthesis (b) Reprinted with permission from Journal of Marketing, published by the American Marketing Association, Bernard
J.Jaworski and Ajay K. Kohli/P. Rajan Varadarajan, July 1993/57, p. 68–69; Kwaku Atuahene–Gima/Ruth N. Bolton, October 2005/69, p. 69.
(–) Reverse coding * Eliminated during scale refinement

62
TABLE 3
MEASURES (CONTINUED)
Construct Questions(a) (5–Point Likert Scale, Strongly Disagree [1] to Strongly Agree [5] )
Idea appropriateness
Please indicate how strongly you agree or disagree with the following statements concerning the feed back from new product development staff on the approved idea for developing the selected product. 1) The product idea was appropriate for the production line (ap1).** 2) The product idea fully utilized the capacity of the production line (ap2).** 3) The product idea was simple to produce (ap3).* 4) The product idea reduced the cycle time for new product development (ap4).*** 5) The product idea helped reduce the production cost (ap5).*** 6) The product idea was too complex for the production line (ap6). (–)* 7) The product idea needed new production technology (ap7). (–)* 8) The product idea enhanced production effectiveness (ap8).*** 9) The product idea increased the production efficiency (ap9).***
Idea newness (New) (b)
Please indicate how strongly you agree or disagree with the following statements concerning customer feedback on the approved idea for developing the selected product. 1) The product idea was really "out of the ordinary" (new1) 2) The product idea could be considered as revolutionary (new2). 3) The product idea was stimulating (new3). 4) The product idea reflected a customary perspective in this industry (new4). (–) 5) The product idea was radically different from industry norms (new5). 6) The product idea showed an unconventional way of solving problems (new6).
Idea usefulness (Useful) (b)
Please indicate how strongly you agree or disagree with the following statements concerning customer feedback on the approved idea for developing the selected product. 1) The product idea was relevant to customers' needs and expectations (use1). 2) The product idea was considered suitable for customers' desires (use2). 3) The product idea served customers' needs and expectations (use3). 4) The product idea was useful for customers (use4). 5) The product idea could solve customers' problems (use5).
(a) Item abbreviations in parenthesis (b) Reprinted with permission from Journal of Marketing, published by the American Marketing Association, Subin Im
and John P. Workman, Jr./Ruth N. Bolton, April 2004/68, p. 128. These scales were modified to be appropriate for the study context.
(–) Reverse coding * Eliminated during scale refinement ** Loaded on the same scale (idea appropriateness) *** Loaded on the same scale (idea productiveness)

63
Data Collection
The data for this study were collected using the multimode (mail and web
surveys) data collection. The mail survey samples included 3,846 contacts obtained
from a commercial vendor who maintained the mailing addresses for a not–for–profit
professional organization. Its database consisted of the contact addresses of the NPD
professional members and the members of NPD–related functions (e.g., research and
development (R&D), new product design) in technology companies (e.g., aerospace,
consumer electronics/appliances, computer and computer accessories manufacturer,
communications systems and equipment, electronics, integrated circuit (IC’s) and
microprocessors, medical electronic equipment). The survey materials, which included
questionnaires, cover letters with a brief explanation of the study objectives and
procedure, and return envelopes with postage prepaid, were sent to all the target
informants on the same day.
The samples for online survey included 131 qualified members of three
associations–the Product Development and Management Association (PDMA), the
Industrial Designers Society of America (IDSA), and the Project Management Institute
(PMI). The cover letter and questionnaire were uploaded for the web–based survey.
The web–targeted informants were contacted via emails or phone explaining the study
objectives and procedure. As noted earlier, the potential respondents for the two modes
of data collection were offered the executive summary of the ideas resulting from this
study as the incentive for their participation. The informants were notified that further
clarification of the ideas resulting from this research could be arranged between the
principal investigator and the participants. By the survey closing date, the numbers of

64
responses for the online and mail surveys were 67 and 109 respectively (see Table 4).
The data from all the responses in this stage were found to be complete and usable.
Because the same questions and a similar questionnaire format were used in all
phases, it is reasonable to combine the data from the different phases (e.g., Im and
Workman 2004) and the two modes of data collection (Ilieva, Baron, and Healey 2002;
Roster, Rogers, and Albaum 2004). As presented in Table 5, both the t–test for equality
of means (p>.10) and the Levene’s test for equality of variances (p>.10) exhibit no
significant difference between the web–based and the mail survey data. Therefore, the
data from the online and mail surveys were combined.
The comparison of key variable means was performed to assure the
homogeneity of data from different phases of data collection (Table 4). The ANOVA test
of equality of the key variables’ means from data in different phases indicates the strong
evidence of non–response bias (Table 6).
TABLE 4
PHASES OF DATA COLLECTION
Frequency Percentage Phase Approximate Timeline
Online Mail Total % Cumulative
1 First three weeks 40 – 40 22.7 22.7 2 Following three weeks 19 83 102 58.0 80.7 3 Last three weeks 8 26 34 19.3 100.0
67 109 176 100.0

65
TABLE 5
TESTS OF EQUALITY OF MEANS: ONLINE SURVEY VS. MAIL SURVEY
Variables Levene's Test for Equality of Variances(a) t-test for Equality of Means
F P-Value t-Value df P-Value
Specialization 1.872 0.173 -0.383 174 0.702 Diverse expertise 0.951 0.331 -1.202 174 0.231 Goal constraint 0.658 0.418 1.165 174 0.245 Idea newness 0.002 0.960 -1.231 174 0.220 Idea usefulness 1.478 0.226 0.645 174 0.520 Idea appropriateness 2.380 0.125 0.223 174 0.824 Idea productiveness 0.145 0.704 0.610 174 0.543 Turbulence 1.989 0.160 1.366 174 0.174
(a) Equal variance assumed.
TABLE 6
TESTS OF EQUALITY OF MEANS FOR NON–RESPONSE BIAS
Variables ANOVA
F df P-Value
Specialization 1.391 175 0.251 Diverse expertise 1.420 175 0.244 Goal constraint 1.902 175 0.152 Idea newness 0.445 175 0.641 Idea usefulness 0.057 175 0.945 Idea appropriateness 2.108 175 0.125 Idea productiveness 1.573 175 0.210 Turbulence 0.837 175 0.435

66
Sample Representativeness
After correcting for the returned mails with incorrect addresses (31 returned mails
from bad addresses), the use of mail and online surveys produced 176 usable,
complete questionnaires with an overall response rate of 4.5%. The sample is
distributed across several high technology industries, including aerospace, consumer
electronics and appliances, computer manufacturer, telecommunication and
communication systems/equipment, electronics, IC’s and microprocessors, and medical
electronic equipment (see Figure 3). The respondents also include some new product
design and development companies–a specific sector serves as the external NPD
function for several technological industries. Both the business–to–business (53%) and
business–to–customers (47%) industries are equally represented. It appears that the
sample frame is representative of the population of interest.
To identify the respondents’ knowledge concerning the study context, they were
asked to report their knowledge about the development of ideas for the selected
product. On a scale of 1 to 5, the overall mean ( X =4.41, SD=.98) shows that the
respondents’ knowledge about the study topics is considerably high (88.2%), confirming
the informant expertise and appropriateness. The mean of the respondents’ NPD tenure
is 16.2 years, with a range from 0.5 to 38.0 years (SD=9.97). The respondents
represent several key functions associated with NPD (e.g., R&D: 31.8%, NPD: 25.6%,
engineering: 15%, management: 12.7%, others: 14.9%). This lends support to the
cross–functional sample which can provide comprehensive and diversified views from
different functions in NPD. About 98.8% of the respondents reported that they
graduated with at least bachelor’s degree; 42.2% reported to possess a master’s

67
degree; and 31.2% had doctoral degrees (see Figure 4). Finally, 56.6% of the
respondents reported that they were specialists (scientists, engineers, new product
designers); 16.4% were middle management; and 14.1% held top management
positions (see Figure 5). Overall, the sample portrays informants with appropriate
qualifications and characteristics that are commensurate for the purpose of the study.
FIGURE 3
SAMPLE DESCRIPTION: INDUSTRY REPRESENTATIVENESS
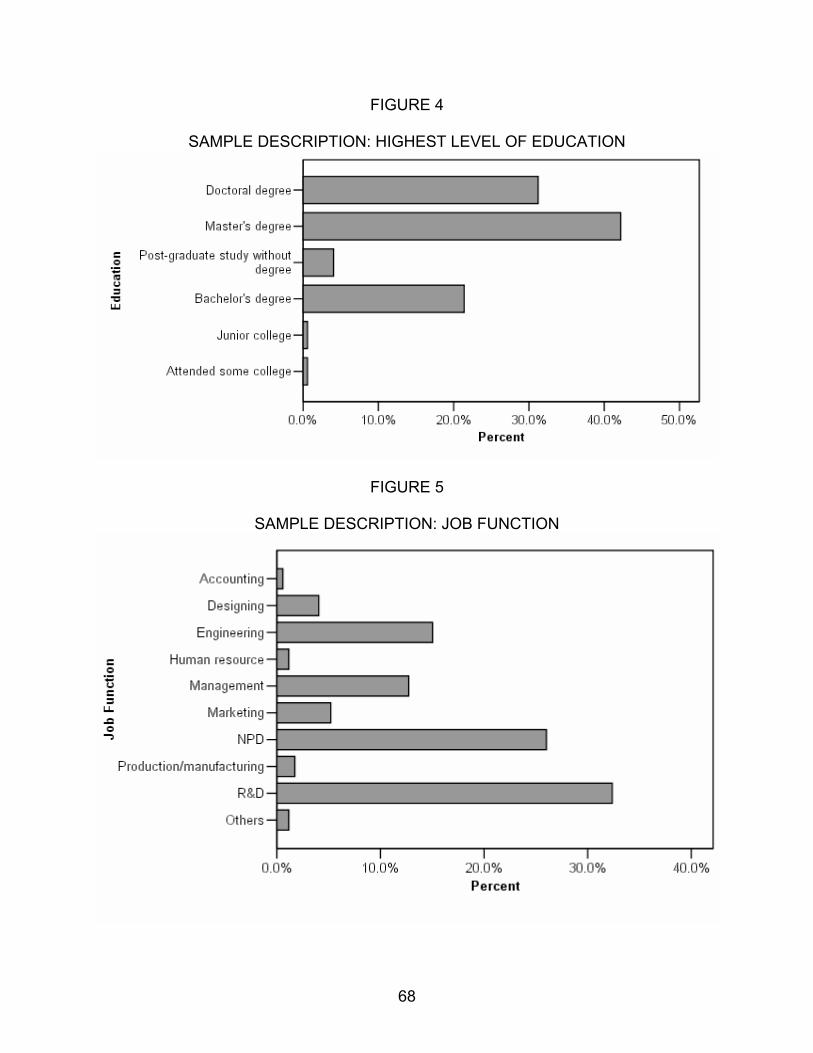
68
FIGURE 4
SAMPLE DESCRIPTION: HIGHEST LEVEL OF EDUCATION
FIGURE 5
SAMPLE DESCRIPTION: JOB FUNCTION

69
CHAPTER 4
ANALYSIS
Analysis Procedure
This chapter presents a detailed report of the research design, findings and
analysis. Toward this goal, this study followed generally–accepted multivariate data
analysis protocols, including the assessment of measurement scales’ internal
consistency and validity (Van Auken, Barry, and Bagozzi 2006; Bagozzi and Yi 1993;
Bagozzi, Yi, and Nassen 1999; Baumgartner and Steenkamp 1996; Campbell and
Stanley 1973; Gerbing and Anderson 1988). Likewise, a conscientious attempt was
made to employ robust data analyses (Aiken and West 1991; Allison 2002; Byrne 1998;
Cohen et al. 2003; Gerbing and Anderson 1988; Hair et al. 1998; Jaccard, Turrisi, and
Wan 1990).
In the pre–analysis procedure, the measures were developed and included in the
questionnaires. The multimode (mail and online) surveys were used to collect the data.
As exhibited in Figure 6, the analysis procedure consists of seven stages. The first
stage is to examine the data and to identify the appropriate remedy method for its
incompleteness. The raw scores from all scale items were then tested against the
general assumptions of multivariate data analysis, in which linearity, multivariate
normality, and homoscedasticity were examined. This was followed by the processes of
measure validation and data reduction. The confirmatory factor analysis and reliability
analysis were used to identify the data structure corresponding to the theoretically pre–
specified underlying factors. These measures’ internal validity was later verified.
Furthermore, it is essential to ensure that the data does not possess any serious

70
common method bias occurring from both independent and dependent variable scores
being collected from the same source of informants. At the end of these processes, the
composite scores were calculated.
Even though all of the items, including the eliminated items, were tested against
the multivariate assumption in the data examination stage, it is important to ensure that
the linear combination in the calculation of composite scores does not incur any
violation of multivariate data analysis assumptions. Therefore, the verification of the
assumptions of multiple linear regression was subsequently performed on the
composite scores. All key assumptions of multiple linear regression, including linearity,
normality of error term distribution, homoscedasticity, independence of error terms,
absence of multicollinearity, and absence of significant outliers were examined. If there
is a significant violation of the multivariate assumption, an appropriate remedy would be
pursued to ensure that the composite scores would yield accurate results from the
robust estimation method.
Hierarchical multiple linear regression was selected for the estimated models
with interaction and higher order terms. The models with only the first order terms were
estimated using multiple linear regression. Since the hypothesized model was initially
specified with some interaction terms, the post hoc analyses were planned and
performed to reveal the possible interaction direction.

71
FIGURE 6
ANALYSIS PROCEDURE
Composite Scores
Raw Scores from 176 responses
Composite Scores
1. Confirmatory factor analysis2. Reliability analysis
(3) Refining New and Existing Scales
1. Missing data2. Outlier
(1) Examining Data
1. Multivariate linearity2. Multivariate normality3. Homoscedasticity
(2) Testing Multivariate Assumptions
1. Trait validity2. Content validity3. Construct validity: convergent and discriminant 4. Nomological validity5. Testing common method bias
(4) Validating Scales and Hypothesized Model
1. Linearity2. Normality of error term distribution3. Homoscedasticity
(5) Testing Regression Assumptions4. Independence of error terms5. No serious threat of multicollinearity6. No serious threat of outliers
Step 1. Main effects modelStep 2. Main effects + interactional effectsStep 3. Main effects + interactional effects + higher order terms
(6) Testing Hypotheses
1. Higher order terms2. Interaction terms
(7) Conducting Post Hoc Analyses
Note: The analysis procedure was developed based on several multivariate data analysis protocols (e.g., Aiken and West 1991; Allison 2002; Van Auken, Barry, and Bagozzi 2006; Bagozzi and Yi 1993; Bagozzi, Yi, and Nassen 1999; Baumgartner and Steenkamp 1996; Byrne 1998; Cohen et al. 2003; Gerbing and Anderson 1988; Hair et al. 1998; Jaccard, Turrisi, and Wan 1990; and Neter et al. 1996).

72
TABLE 7
STATISTICAL TECHNIQUES USED IN THE ANALYSIS PROCEDURE
Analysis Procedure Stage Technique Reference Application
1. Data examination − Missing data MCAR Test (data missing at completely random) Allison (2002); Little and Rubin (1987);
Schafer (1997); Schafer and Graham (2002) SAS 9.1.2
− Imputation Linear trend regression Allison (2002); Gourieroux and Monfort (1981) SPSS 12.0 − Outlier Mahalanobis distance (D2) Hair et al. (1998) SPSS 12.0
2. Testing general assumptions − Linearity Visual inspection–Scatter plots Hair et al. (1998) SPSS 12.0 − Normality Skewness and kurtosis Curran, West, and Finch (1996) SPSS 12.0 − Homoscedasticity Levene’s test Hair et al. (1998) SPSS 12.0
3. Refining scales − Confirmatory factor Structural equation model Byrne (1998); Jöreskog and Sörbom (1993) LISREL 8.54
4. Validating scales − Construct validity Correlated uniqueness model Bagozzi and Yi (1993); Kenny (1976) LISREL 8.54− Nomological validity Hierarchical regression analysis Cohen et al. (2003) SPSS 12.0 − Common method bias Harman’s single factor test Podsakoff et al. (2003) LISREL 8.54
5. Testing multiple regression assumptions: composite scores − Linearity Visual inspection–Scatter plots Hair et al. (1998) SPSS 12.0 − Normality of error term Skewness, kurtosis, normal probability plots Hair et al. (1998); Neter et al. (1996) SPSS 12.0 − Independence of error Durbin–Watson coefficient D Neter et al. (1996) − Homoscedasticity Levene’s test Hair et al. (1998) SPSS 12.0 − Multicollinearity Variance inflation factor and tolerance Aiken and West (1991); Hair et al. (1998) SPSS 12.0 − Outliers Mahalanobis distance (D2) Hair et al. (1998) SPSS 12.0
6. Hypothesis tests − Model tests Hierarchical regression analysis Aiken and West (1991); Cohen et al. (2003) SPSS 12.0
7. Post hoc analysis − Data classification Cluster analysis Hair et al. (1998) SPSS 12.0 − Interaction effect models General linear modeling Aiken and West (1991); Neter et al. (1996) SPSS 12.0

73
The analysis procedure included different stages, and each stage occasionally
required different statistical techniques to accomplish those tasks (e.g., examining data,
cleaning up data, validating the measures, testing the hypotheses). All the analytical
techniques employed in this study (see Table 7) were carefully selected to achieve the
accurate and robust test results, which is a prerequisite to attaining a high level of
internal and external validity (Cook and Campbell 1979).
Testing Multivariate Assumptions
The data were carefully examined at the very beginning of the analysis
procedure. This process included the examination of missing data and outliers. It is
important to identify the missing data pattern before the decision is made regarding the
imputation method. The missing data consisted of only 25 out of 4,928 data points.
Although the percentage of missing data is extremely low (0.30%), it might have a
detrimental effect on the data.
To ensure that the missing data did not cause any significant impact on the data
distribution, Little’s (1988) chi–square test of data missing at completely random
(MCAR) was performed (see also Schafer 1997; Schafer and Graham 2002). This test
is considered the robust and conservative approach of data examination (Hair et al.
1998). The MCAR test identifies 8 missing data patterns with only one pattern (3 cases)
with frequency exceeding one. The MCAR’s chi–square test is insignificant (χ2=381.09,
df=353, p>.10). Because MCAR’s chi–square test is very sensitive to the violation of
complete randomness of the missing data, this strongly indicates that the data is

74
missing at completely random, and an imputation method could be pursued (Allison
2002).
A common remedy for missing data is the mean substitution. However, for the
completely random missing data, a linear trend regression is more appealing because
this approach takes into consideration the available information about the case with
missing data (Hair et al. 1998). With mean substitution, this information would not be
accounted for. In addition, the analysis results from the imputed data and non–imputed
data were compared. No significant difference was found between the two data sets.
Therefore, the missing data was imputed using the linear trend regression. This
completed the 176–response data set for the analysis.
The multivariate detection of outliers was performed using Mahalanobis distance
(D2). Mahalanobis distance “provides a common measure of multidimensional centrality
and also has statistical properties that allow for significance testing” (Hair et al. 1998, p.
66). It is suggested that a very conservative level (p=.001) be used for a t–test of the
critical value (D2/df). As such, the independent and moderating variable scores were
regressed on the dependent variables. The residual statistical analysis indicates a D2–
range of 4.01 to 55.29, and shows no extreme case of outliers (a maximum value of
D2/df=1.97, df=26, p>.10). Thus, no remedy for outliers is necessary.
Next, the assumptions of multivariate analysis (linearity, normality, and
homoscedasticity) were tested. The multivariate linearity test relied on the visual
inspection of the scatter plots of each pair of variables (i.e., scores from each
independent variable’s scale item vs. those from each dependent variable’s scale item).
Examination of the scatter plots does not exhibit any serious nonlinear relations.

75
Skewness and Kurtosis statistic were used for the multivariate normality test. The
ranges of Skewness and Kurtosis statistic are –1.71 to 0.58 ( X =–.60) and –1.21 to 5.19
( X =.42) respectively. An ideal normal distribution is achieved when Skewness and
Kurtosis statistics are approaching zero. From a practical standpoint, the data is
moderately non-normal when Skewness and Kurtosis statistics are from 2.00 to 3.00
and from 7.00 to 12.00 respectively, and the data is extremely non-normal when
Skewness and Kurtosis values exceed 3.00 and 21.00 respectively (Byrne 1998, p. 196-
198; Curran, West, and Finch 1996).
Given that (1) means of Skewness and Kurtosis statistics of the scores from this
data are approaching zero, (2) that only a few scale items have a Skewness statistic
less than –1.00 (8 out of 47 items; minimum value=–1.71), and (3) that only a few scale
items have a Kurtosis statistic exceeding 4.00 (4 out of 47 items; maximum value=5.19),
these suggest that the scores could be generally considered approximating a normal
distribution.
Finally, Levene’s tests of equality of variance were performed to identify the
absence of correlated errors (homoscedasticity). Industry and gender were used as the
categorical variables for the tests. The results of the tests for each of the categorical
variables show no significant threat of heteroscedasticity (p>.05).
Scale Refinement and Validation
The scale refining process followed the confirmatory factor analysis (Byrne 1998;
Jöreskog and Sörbom 1993). Two first–order measurement models (Model A
comprising independent, moderating, and control variables, and Model B comprising

76
dependent variables) were estimated using structural equation modeling (LISREL 8.54).
Nevitt and Hancock (2004), evaluating the overall data–model fit for small samples
through Monte Carlo simulation, suggest that structure equation model using maximum
likelihood is a robust technique even when it is used for sample size less than 100.
Technically, the sample size of this study (n=176) satisfies the priori of this method.
All model fit statistics report moderately to highly good fit between the estimated
models and data (Model A: 2χ =379.02, df=243, p=.00, RMSEA=.057, NFI=.90,
CFI=.96; Model B: 2χ =123.48, df=96, p=.030, RMSEA=.04, NFI=.94, CFI=.98) while
none of the estimated parameters exhibit unreasonable estimates, negative variances,
and non–positive definite of covariance or of correlation matrices. These results confirm
the robust estimation of the measurement model and factor structures (see Byrne
1998).
As presented in Table 8 and 9, all items are loaded with the corresponding
factors (4–newly developed and 3–established factors). The low loading items were
excluded from the measurement models one at a time while the model fit statistic and
other items’ loading were carefully examined. In addition, principal component analysis
(PRINCALS) was performed on the scores from original scales (pre elimination) and the
scores from the remaining items (post elimination) for each factor to ensure that the
eliminated items were appropriately excluded from the measurement models. Most of
the 40 scale items have high loadings with the corresponding underlying factors. There
were only 6 items with poor factor loadings (<0.45), and they were cautiously eliminated
(go3, go7, new4, ap3, ap6, and ap7; see Table 8 and 9).

77
It appears that two latent factors load on the remaining 6 items that measure idea
appropriateness (one factor loading on ap1 and ap2; another factor loading on ap4,
ap5, ap8, and ap9). Generally, common wisdom holds that one factor should be loaded
on at least 3 observable variables (items). However, theoretical consideration is the
most reliable reference for any item elimination or inter– and intra–item correlation
judgment (see Byrne 1998). Based on the items’ trait, content, and theoretical
consideration, the two factors are labeled appropriateness (ap1 and ap2) and
productiveness (ap4, ap5, ap8, and ap9).
Appropriateness indicates the degree to which the new product idea is
appropriate for the production line and can fully utilize the capacity of the production line
while productiveness measures the extent to which the new product idea is well refined
in the sense that it helps increase production effectiveness and efficiency. These two
dimensions reflect the extent to which new product ideas are considered appropriate to
the existing production system and are consistent with the original definition of idea
appropriateness. Because of the revision of the scales’ dimensions, the testing model
was revised accordingly (Figure 7).
Following the refinement process, 8 scales were refined (see Table 8 and 9). The
scale items exhibit high factor loadings from the corresponding factors (>.50),
moderately high to high R2, and high level of reliability (α >.70, Nunnally 1978; Nunnally
and Bernstein 1994). The measurement items converge to their corresponding factors.
The measurement models exhibit good fit with the data.

78
TABLE 8
MODEL A: MEASUREMENT SCALES OF INDEPENDENT VARIABLES
Construct Scale Item Loading(a) R2 α
Special Sp1 .52 .55 Sp2 .76 .70 Sp3 .68 .55 Sp4 .64 .51 Sp5 .72 .53 Sp6 .68 .50 Sp7 .72 .55 .89 Diverse Dv1 .60 .43 Dv2 .58 .43 Dv3 .83 .49 Dv4 .71 .64 Dv5 .45 .21 Dv6 .74 .48 .83 Constraint Go1 .48 .26 Go2 .60 .32 Go3 Eliminated(b) – Go4 .71 .54 Go5 .79 .50 Go6 .77 .47 Go7 Eliminated(b) – Go8 .46 .19 .77 Turbulence Tur1 .65 .45 Tur2 .84 .56 Tur3 1.11 .99 Tur4 .60 .35 Tur5 .50 .25 .83
2χ 379.02
df 243.00 p .00 RMSEA .06 NFI .90 CFI .96
(a) Confirmatory factor analysis using structural equation model (b) Factor loading <.45, R2<.20

79
TABLE 9
MODEL B: MEASUREMENT SCALES OF DEPENDENT VARIABLES
Construct Scale Item Loading(a) R2 α
New New1 .97 .71 New 2 1.03 .72 New 3 .61 .53 New 4 Eliminated(b) – New 5 .91 .60 New 6 .78 .51 .89 Useful Use1 .67 .65 Use 2 .61 .74 Use 3 .66 .73 Use 4 .57 .64 Use 5 .57 .59 .91 Appropriateness Ap1 .91 .97 (Appropriate) Ap2 .65 .38 .75 Productiveness Ap3 Eliminated(b) – (Productive) Ap4 .76 .46 Ap5 .87 .62 Ap6 Eliminated(b) – Ap7 Eliminated(b) – Ap8 .51 .30 Ap9 .61 .42 .80
2χ 123.48
df 96.00 p .03 RMSEA .04 NFI .94 CFI .98
(a) Confirmatory factor analysis using structural equation model (b) Factor loading <.30, R2<.10

80
FIGURE 7
REVISED TESTING MODEL
To customers
To NP
D process
i3i420i219i1814i4
i3i417i216i1513i3
i2i4142i313i3i212i3i111i310i29i182i2
i1i472i36i3i25i3i14i33i22i111i1
XαXαXαu: Y4ModelXαXαXαu: Y3Model
XαXαXXαXXαXαXαXαu: Y2Model
XαXαXXαXXαXαXαXαu: Y1Model
εε
ε
ε
++++=−
++++=−
++−+++++=−
++−+++++=−

81
As suggested by Marsh and Bailey (1991), the correlated uniqueness model
originally developed by Kenny (1976; see also Bagozzi and Yi 1993; Van Auken, Barry,
and Bagozzi 2006) was used for validating the scales. This method uses structural
equation model to construct the measurement model in which eight factors (special,
diverse, constraint, turbulence, new, use, appropriateness, and productiveness) were
allowed to freely correlate among the factors while this approach also allowed the
intercorrelation among error terms of the scale items corresponding to each latent
variable (Bagozzi and Yi 1993). It is suggested that “the factor loadings reflect
information about convergent validity, whereas the correlations between factors address
the degree of discriminant validity” (Van Auken, Barry, and Bagozzi 2006, p. 446).
The correlated uniqueness model shows reasonably good fit with the data
( 2χ =745.36, df=635, p=.002, RMSEA=.032, NFI=.91, CFI=.97). Only 2 items showed
moderately low factor loadings (go8=.38 and ap8=.44) whereas 38 items exhibited high
loadings (>.50), thus indicating convergent validity within the factors. As shown in Table
10, the confidence intervals of all correlations between factors (off–diagonal elements)
are below 1.00. These results also reaffirm the factors’ discriminant validity.

82
TABLE 10
CORRELATED UNIQUENESS MODEL’S FACTOR INTERCORRELATION(a)
Measure 1 2 3 4 5 6 7 8
1. Special 1.00 2. Diverse .57 ** 1.00 (.08) 3. Constraint .27 ** .25 ** 1.00 (.08) (.08) 4. Turbulence .02 .02 .01 1.00 (.03) (.03) (.02) 5. New .19 ** .25 ** .21 ** .05 1.00 (.06) (.06) (.07) (.05) 6. Useful .57 ** .40 ** .44 ** .04 .31 ** 1.00 (.06) (.07) (.10) (.05) (.07) 7. Appropriateness .48 ** .35 ** .18 * .03 -.01 .44 ** 1.00 (.08) (.08) (.08) (.04) (.06) (.07) 8. Productiveness .03 .09 .07 .01 .04 .02 .06 1.00 (.04) (.06) (.05) (.01) (.04) (.03) (.05)
(a) Values in parentheses denote standard errors. * Correlation is significant at the 0.05 level (2-tailed). ** Correlation is significant at the 0.01 level (2-tailed).
In this study, the same informants provided their responses for both the
independent and dependent variables. This may, at least partially, create common
method biases–the main source of systematic measurement error (Bagozzi and Yi
1991). Although the preventive actions were taken (i.e., providing specific context for
the scale items, reverse questions), it is important to ensure that the common method
bias is not a confounding factor for the relationship observed between the constructs
(Podsakoff et al. 2003).
As with other studies (e.g., Andersson and Bateman 1997; Aulakh and Gencturk
2000), Harman’s single–factor test was used to discover the common factor among

83
variables. All observed variables (40 scale items) were loaded on the exploratory factor
analysis (PRINCALS). The unrotated factor loadings were determined by the number of
factors that account for variance in the model. The results indicate 10 factors emerging
from the factor analysis. Moreover, there is no general factor accounting for the majority
of the covariance among the measures. Hence, the amount of common method
variance is not substantial.
Model Estimation
The composite scores (average) for eight factors (specialization, diverse
expertise, goal constraint, turbulence, newness, usefulness, appropriateness, and
productiveness) were calculated and used in the model estimation. Table 11 displays
the correlations between factors’ composite scores. Hierarchical multiple linear
regression was used in the estimation of Model 1 and 2 (Table 12), both of which
include interaction and higher order terms, whereas Model 3 and 4 (Table 13) were
estimated using multiple linear regression.
A Hierarchical multiple linear regression analysis of a set of independent
variables generates the coefficients necessary to answer the research question (Cohen
et al. 2003). Technically, the independent variables were entered cumulatively in a
sequence specified in advance based on the purpose and logic of the research (e.g.,
main effect first, interaction effects, and quadratic terms, respectively) while “the R2 and
partial regression and correlation coefficients are determined as sets of independent
variables join the others” (see Cohen et al. 2003, p. 158–162). It is suggested that using
hierarchical multiple linear regression can technically justify the inclusion of interaction

84
and higher order terms (Aiken and West 1991; Jaccard, Turrisi, and Wan 1990). In the
following parts, all essential tests of the key assumptions of multiple linear regression
are reported, and the results of model estimation are consequently discussed.
TABLE 11
FACTOR CORRELATION(a)
Measure X SD 1 2 3 4 5 6 7 8
1. Special 4.00 .71 .89 2. Diverse 3.79 .73 .50 ** .83 3. Constraint 3.68 .72 .18 * .27 ** .77 4. Turbulence 3.16 .81 .10 .07 .07 .83 5. New 3.43 .91 .07 .33 ** .21 ** .18 * .89 6. Useful 4.31 .65 .50 ** .45 ** .44 ** .12 .32 ** .91 7. Appropriate 3.71 .88 .42 ** .32 ** .21 ** .09 -.02 .39 ** .75 8. Productive 2.90 .81 .14 .22 ** .17 * .21 ** .10 .14 .21 ** .80
(a) Diagonal elements represent Cronbach’s alphas (α) values. ** Significant at the 0.01 level (2-tailed) * Significant at the 0.05 level (2-tailed)
General assumptions of linear regression (e.g., linearity, multicollinearity,
normality, independence of error terms, homoscedasticity, outliers) were examined
using statistical tests and the visual inspection of residual plots (Hair et al. 1998; Neter
et al. 1996). The partial residual plots between the independent and dependent
variables strongly support linearity of the relationship.

85
TABLE 12
RESULTS OF HIERARCHICAL MULTIPLE LINEAR REGRESSION(a) (b) (c)
Coefficient ( β ) (d) Model Dependent Variable Independent and Moderating Variable
Step 1 Step 2 Step 3
1 New Constant .00 .01 .05 Special -.15 -.21 * -.21 * Diverse .40 ** .35 ** .35 ** Turbulence .16 * .15 * .14 Constraint – .13 .17 * Constraint X Special – -.16 * -.18 * Constraint X Diverse – .06 .06 Constraint X Constraint – – .07 F-statistic 10.21 ** 6.66 ** 6.04 ** R2 .15 .19 .20 Adjusted R2 .14 .16 .17 ∆R2 (compared to step 1) – .04 * .05 *
2 Useful Constant .00 .05 -.01 Special .37 ** .24 ** .24 ** Diverse .26 ** .15 * .15 * Turbulence .06 .00 -.01 Constraint – .31 ** .35 ** Constraint X Special – -.20 ** -.21 ** Constraint X Diverse – -.07 -.07 Constraint X Constraint – – .07 F-statistic 25.63 ** 28.46 ** 25.19 ** R2 .31 .50 .51 Adjusted R2 .30 .49 .49 ∆R2 (compared to step 1) – .19 ** .20 **
(a) The order in which the variables (standardized scores) were entered is based on theoretical
considerations. (b) Standardized scores were used in hierarchical multiple regression. (c) F-statistics for ∆R2 =
1)k)/(NR(1/kR
2
2
−−− where k is the number of predictor variables and N is the
sample size. (d) Maximum variance inflation factor =2.45 and minimum tolerance =.41 (for model 1 and 2) ** Significant at the 0.01 level (2-tailed) * Significant at the 0.05 level (2-tailed)

86
TABLE 13
RESULTS OF MULTIPLE LINEAR REGRESSION(a)
Model Dependent Variable Independent Variable Coefficient ( β ) (b)
3 Appropriate Constant 1.15 ** Special .43 ** Diverse .18 Turbulence .05 F-statistic 14.25 ** R2 .20 Adjusted R2 .19
4 Productive Constant 1.37 ** Special .03 Diverse .22 * Turbulence .19 * F-statistic 5.40 ** R2 .09 Adjusted R2 .07
(a) Model estimation using composite scores (b) Maximum variance inflation factor =1.34 and minimum tolerance=.74 (for model 3 and 4) ** Significant at the 0.01 level (2-tailed) * Significant at the 0.05 level (2-tailed)
Model 1 and 2 showed strong evidence of multicollinearity when they were first
estimated while model 3 and 4 exhibited no significant multicollinearity. As suggested by
Aiken and West (1991), all factors’ composite scores were mean–centered
(standardized scores). The models estimations (Model 1 and 2) of standardized scores
display no significant threat of multicollinearity (maximum variance inflation factor=2.45,
minimum tolerance=.41). Thus, this violation has been remedied.
Next, normality of error term distribution was analyzed using normal probability
plots (standardized residual plots) and Skewness and Kurtosis statistics. The normal
probability plots of regression standardized residuals from all models indicate normality

87
of the error terms. In addition, all factors’ Skewness (-1.74 to -.05) and Kurtosis (-.26 to
6.10) statistics are far below the critical value recommended by Curran, West, and
Finch (1996; Skewness <3.00 and Kurtosis <7.00). Both the visual inspections (e.g.,
standardized residual plots) and the statistics (e.g., Skewness and Kurtosis values)
suggest that the factors’ composite scores are generally considered approximating a
normal distribution.
Autocorrelation of the error terms could be detected by Durbin–Watson
coefficient D. All the estimated models report the coefficient Ds approaching 2.0
(DModel1=1.97, DModel2=1.78, DModel3=2.04, and DModel4=1.96), confirming the
independence of error terms from the estimations. Levene’s test was used to detect
heteroscedasticity of the error terms.
Because goal constraint encompasses a higher order term (quadratic) and is
most likely to cause heterogeneity of error variances, this variable was used to create a
grouping variable (quartiles). Residuals from all cases in 4 models were grouped
according to a group variable, and homogeneity of variance tests were performed.
Levene’s statistics for Model 1 to 4 (.82, 2.47, .89, and 1.21; p>.05) show no significant
test results, supporting homoscedasticity of all models’ error terms.
Finally, Mahalanobis distances (D2) were calculated from the residuals of all
model estimations (176 cases per model). The D2 tests indicate 5 (in Model 1 and 2,
df=7) and 2 (in Model 3 and 4, df=3) cases that have probability associated with their D2
less than 0.001, indicating multivariate outliers. To examine the outlier effect on the
estimation, the outliers were eliminated. The data without the presence of the outliers
was reanalyzed. The result indicates no significant changes (e.g., R2, F–statistic, beta

88
estimates) from those in the original models, strongly indicating that the outliers do not
pose any significant impact on the model estimation and results. As such, elimination of
those cases is not necessary.
It appears that all essential assumptions of multiple linear regression have been
satisfied, and the interpretation of the model estimation results could be proceeded.
Based on a priori theory, the main effects, the interaction terms, and the higher order
terms were entered in the model estimations, respectively. The R2 differences between
the models in different estimation steps were compared. As reported in Table 12, model
1 and 2 are significant in all 3 steps of estimation (FModel1=10.21, 6.66, and 6.04; p<.01;
FModel2=25.63, 28.46, and 25.19; p<.01), and the percents of explained variance
increase when interaction and higher order terms are included in the models
(R2Model1=.15, .19, and .20; adjusted R2
Model1=.14, .16, and .17; R2Model2=.31, .50,
and .51; adjusted R2Model2=.30, .49, and .49–for the estimation step 1, 2, and 3). The
significant R2 differences between models from different steps of estimation (∆R2
Model1=.04 and .05, p<.05; ∆R2 Model2=.19 and .20, p<.01) strongly support the theoretical
and statistical rationales of the inclusion of interaction and higher order terms. This
accordingly suggests that the results from the third step of model 1–and model 2–
estimations (main effects + interaction terms + higher order term) are accurate and
could be used for testing hypotheses. Model 3 and 4 were estimated using multiple
linear regression. As shown in Table 13, the models are significant (FModel3=14.25,
p<.01; FModel4=5.40, p<.01) and indicate good fit with data (R2Model3=.20, adjusted
R2Model3=.19; R2
Model4=.09, adjusted R2Model4=.07).

89
In summary, the results from the third step estimation of model 1 and 2 and the
results from model 3 and 4 provide the parameter estimates for hypotheses testing. The
significance of model fit indices (Model 1–4) and the statistical rationales of the inclusion
of interaction and higher order terms in Model 1 and 2 reaffirm nomological validity of
this study.
Hypothesis Testing
The outcomes from the 4 models provide mixed results (see Table 14). The beta
estimates from the models show that specialization significantly impacts idea newness
( β =-.21, p<.05), idea usefulness ( β =.24, p<.01), and idea appropriateness ( β =.43,
p<.01), but its significant impact on idea newness is opposite to the hypothesized
direction. These results provide support for H2 and H3a while H1 is supported in a
reverse direction. Among all the dependent variables, only idea productiveness appears
to have no significant association with specialization ( β =.03, p>.10), leaving H3b
unsupported.
Diverse expertise also reveals mixed results. It exhibits significantly positive
relationship with idea newness ( β =.35, p<.01), idea usefulness ( β =.15, p<.05), and
idea productiveness ( β =.22, p<.05) but it shows marginal significance with idea
appropriateness ( β =.18, p=.06). These findings support H4, H5, and H6b but do not
support H6a. Surprisingly, goal constraint possesses negative moderating effects on the
specialization–idea newness relationship ( β =-.18, p<.05) and the specialization–idea
usefulness relationship ( β =-.21, p<.01), but does not indicate significant impacts either
on the relationship between diverse expertise and idea newness ( β =.06, p>.05) or the

90
relationship between diverse expertise and idea usefulness ( β =-.07, p>.05). Thus, H7
and H8 are supported in a reverse direction while H9 and H10 are not supported.
Finally, two hypotheses (H11 and H12) hold that the relationship between goal
constraint and idea newness and usefulness are inverted U–curve shapes. In order to
support these hypotheses, the parameter estimates of goal constraint (first order terms)
need to be significantly positive and the beta of the parameter’s quadratic terms must
be significantly negative. However, only goal constraint first order terms indicate
statistical support ( Model1β =.17, p<.05; Model2β =.35, p<.01) while the parameter estimates
of the quadratic terms are not significant ( Model1β =.07, p>.05; Model2β =.07, p>.05).
Therefore, H11 and H12 are partially supported.
Post Hoc Analysis
The hypothesis testing reveals two research quandaries deserving further
investigation, including (1) goal constraint’s significant moderating impact on the
relationship between specialization and idea newness, and between specialization and
idea usefulness, and (2) the linear relationship between goal constraint and idea
newness, and between goal constraint and idea usefulness. More specifically, these
research questions suggest that post hoc analyses be further conducted.

91
TABLE 14
SUMMARY OF HYPOTHESIS TESTS
Hypothesis Relationship(a) (b) (c) Result Conclusion
H1 Specialization Idea newness Significant Supported in reverse direction
H2 Specialization Idea usefulness Significant Supported
H3a Specialization Idea appropriateness Significant Supported
H3b Specialization Idea productiveness Not significant Not supported
H4 Diverse expertise Idea newness Significant Supported
H5 Diverse expertise Idea usefulness Significant Supported
H6a Diverse expertise Idea appropriateness Not significant Not supported
H6b Diverse expertise Idea productiveness Significant Supported
H7 Goal constraint X Specialization Idea newness Significant Supported in reverse direction
H8 Goal constraint X Specialization Idea usefulness Significant Supported in reverse direction
H9 Goal constraint X Diverse expertise Idea newness Not significant Not supported
H10 Goal constraint X Diverse expertise Idea usefulness Not significant Not supported
H11 Goal constraint ∩ Idea newness Significant linear relationship Partially supported
H12 Goal constraint ∩ Idea usefulness Significant linear relationship Partially supported
(a) “ ” denotes direct and positive relationship. (b) “X” denotes interaction between constructs. (c) “∩” denotes inverted U–curve relationship.

92
To identify the impact of goal constraint on the specialization–idea newness
relationship and the specialization–idea usefulness relationship, cluster analyses and
general linear modeling (ANOVA) were used on the relevant variables. Cluster analysis
was performed on the two variables (goal constraint and specialization) that
demonstrate the significant interaction relationship with the dependent variables (idea
newness and idea usefulness). This analysis exhibits two clusters of specialization
( X High Specialization=4.15, SD=.52; X Low Specialization=2.56, SD=.67) and two clusters of goal
constraint ( X High Goal Constraint=4.06, SD=.59; X Low Goal Constraint=3.78, SD=1.02). The
relationship between these clusters and idea newness and usefulness was additionally
examined using general linear modeling.
As the results displayed in Table 15, and Figure 8 and 9, samples having a low
level of specialization generate more novelty and ( X High Goal Constraint=3.73, SE=.32; X Low
goal constraint=2.69, SE=.30) and useful new product ideas ( X High Goal Constraint=4.33, SE=.20;
X Low goal constraint=2.96, SE=.19) if they perceive a high level of goal constraint.
Conversely, the level of goal constraint is unlikely to significantly impact the samples
having a high level of specialization on both idea newness ( X High Goal Constraint=3.47,
SE=.08; X Low goal constraint=3.46, SE=.17) and idea usefulness ( X High Goal Constraint=4.41,
SE=.05; X Low goal constraint=4.29, SE=.11).
The second question requires a careful examination of the direct relationship
between goal constraint and idea newness and usefulness. To ensure that there is no
other rival explanation to this relationship, goal constraint and its quadratic term were
regressed on idea newness and idea usefulness. Both regression models using
standardized scores are significant (Fnew=4.66, p<.05; Fuse=21.35, p<.001) and show

93
reasonably good fit (R2new=.05, adjusted R2
new=.04; R2use=.20, adjusted R2
use=.19). Goal
constraint exhibits significantly positive relationship with the first order terms of idea
newness ( β =.25, p<.01) and usefulness ( β =.45, p<.001) while its quadratic terms
show non–significant influence on idea newness ( β =.05, p>.10) and marginally
significant impact on idea usefulness ( β =.002, p<.05). These confirm the results of
Model 1 and 2 that the presence of quadratic terms in the equations is very unlikely to
have any significant effect. Therefore, the goal constraint–idea newness and usefulness
relations are apparently linear. The implications of the hypothesis testing and the
planned post hoc analysis are discussed in the following chapter.
TABLE 15
POST HOC ANALYSIS USING GENERAL LINEAR MODEL(a) (b) (c)
New Useful Constraint Special
X SE X SE
High High 3.47 .08 4.41 .05 Low 3.73 .32 4.33 .20 Low High 3.46 .17 4.29 .11 Low 2.69 .30 2.96 .19
(a) Pairwise comparisons between high goal constraint and low goal constraint on idea newness and idea usefulness are significant at 0.05 and 0.01 level.
(b) Univariate tests on idea newness and idea usefulness are also significant at 0.05 and 0.01 level.
(c) F-tests of the multivariate effect of goal constraint cluster based on the linearity independent pairwise comparisons among the estimated marginal means indicate the observed powers (Pillai’s trace, Wilks’ lambda, Hotelling’s trace, and Roy’s largest root) at 0.996 (α=.05).

94
FIGURE 8
POST HOC ANALYSIS OF IDEA NEWNESS
FIGURE 9
POST HOC ANALYSIS OF IDEA USEFULNESS

95
CHAPTER 5
DISCUSSION
Findings from this study provide evidence that the relationship between the
desired outcomes of new product idea generation and the key input factors is indeed a
complicated, but manageable, one. Results of this study suggest that input factors make
an influential contribution to new product idea creativity, and these impacts could be
enhanced by effectively managing a specific constraint in an ideation process. The
results of this research imply that valuable new product ideas could be generated if at
least crucial componential factors and goal constraint are correctly understood and
appropriately managed by those who have directed and overseen the development of
new product ideas. The finding concerning componential factors and goal constraint are
discussed along with their implication for the generation of new product ideas.
Impact of Componential Factors: Individual Level
The key findings indicate that the componential factors perform central roles
shaping the outcomes of the development of new product ideas. It is accordant with the
literature that creative outcomes are the results of good componential factors (Amabile
1996). However, this study reveals that the breadth (diverse expertise) and the depth
(specialization) of componential factors cause different effects on the making of new
product ideas (see Taggar 2002).
Specialization is an essential factor for any creativity tasks. This factor
encompasses knowledge, skills, and experience in the product domain. The results
support the strong relationship between specialization and idea usefulness, indicating

96
that the depth of relevant knowledge and skill in a product domain is a significant factor
for increasing the usefulness dimension of new product ideas. This is also supported by
the cognitive psychological perspective (Simonton 1999). Specialization reflects the
number of cognitive elements directing individuals to solve the problem in his/her
domain of expertise. The greater the number of individuals’ cognitive elements (or
knowledge sets), the higher chance the individuals can produce the associations that
are most relevant to a given problem (useful solution).
The impacts of specialization on idea appropriateness and productiveness seem
different. Idea appropriateness is positively influenced by specialization. However, the
pre–specified relationship between specialization and idea productiveness show no
significant evidence of support. Idea appropriateness represents the degree to which
new product ideas could fit with existing lines of production whereas idea
productiveness reflects the extent to which new product ideas can increase production
efficiency and effectiveness. Idea appropriateness requires new product idea creators to
acquire and accumulate knowledge relevant to the production system up to a certain
level. This knowledge can help the creators to find the ideas that are the right one and
ready to be turned into a finished product. When new product ideas encompass
production appropriateness, they do not have to go back and forth with either the major
or minor revision during the execution phase of NPD.
On the other hand, idea productiveness requires more comprehensive
knowledge concerning the manufacturing of new products because this dimension
focuses on how to reduce the production hassle. This may explain why specialization,
which is more relevant to knowledge and skills in the development of new products

97
rather than the manufacturing of existing products, possesses a positive impact on idea
appropriateness but has no significant impact on idea productiveness.
Surprisingly, the findings of this study display an inverse linear relationship
between specialization and idea newness. The finding clearly indicates the significance
of the specialization–idea newness relationship but the direction of this relation is
contradictory to the pre–specified direction. One possible explanation for the negative
impact of specialization on the newness dimension is based on the practices of
knowledge combination. Idea creators embedded with specialization may use their
existing knowledge in a traditional way (Schumpeter 1934). The exploitation of too–
focused knowledge can generate “competence traps, in which new information is
disregarded and teams become locked in their old behaviors” (Taylor and Greeve 2006,
p. 723; see also Arthur 1989; March and Simon 1958). This eventually results in non–
novel outcomes.
Another possible reason for the negatively linear relationship between
specialization and idea newness is based on psychology research, especially “the curse
of knowledge” theory (Gourville 2005, p. 13; see also Birch and Bloom 2003; Camerer,
Loewenstein, and Weber 1989; Heath 2003; Kelley and Jacoby 1996). This view
suggests that if the creators know something, their knowledge curse tends to make
them “find it hard to imagine not knowing it” (Heath and Heath 2006, p.21). In NPD
context, this process leads the new product idea creators to overestimating other
people’s judgment–“expecting others to see the value in their innovations that they
themselves see” (Gourville 2005, p. 14). The idea creators with high specialization are
knowledgeable about the product domain. The curse of knowledge theory implies that

98
they are likely to expect customers to share similar value in their innovative ideas
(Gourville 2005). This may mislead idea creators to search for new association beyond
what customers perceive to be novel and result in an odd result. The creators falsely
perceive that they innovate but customers feel alienated.
Simply put, the depth of knowledge (specialization) enhances the usefulness of a
new product idea, but is unlikely to positively impact its newness dimension. This may
explain why diverse expertise, the componential factors’ breadth of knowledge, is
additionally essential for the making of new products’ creative ideas.
Impact of Componential Factors: Team Level
Diverse expertise is characterized by the extent to which an NPD team
comprises different areas of expertise from different functional backgrounds,
experience, and skills. The results reaffirm the positive impacts of diverse expertise on
the newness, usefulness, and productiveness of the ideation outcomes, but do not
reveal a significant association between diverse expertise and idea appropriateness.
This study confirms that working as a team increases quantity and quality of new
product ideas (see Dennis and Valacich 1994). Moreover, findings indicate that NPD
team members’ integrative knowledge and skills, experience, and group cognition
enhance new product ideas’ newness and usefulness to customers. These
qualifications can also improve efficiency and effectiveness in the production system
(e.g., reduced cycle times, lower production losses, improved product quality).
The contribution of diverse expertise does not significantly improve the fit
between new product ideas and existing lines of production. The idea appropriateness

99
dimension requires only NPD team members’ general knowledge about what could be
made at the current production facilities. This kind of knowledge would rather serve as
the foundation of the integration of diverse expertise and provide the basis for creating
further dialogues between the experts from different functions to enhance the
production effectiveness and efficiency, not as the result of the diverse expertise. As
such, idea appropriateness is a result of individuals’ expertise in NPD of a given product
domain rather than the product of the incorporation of diverse expertise into an ideation
team. This argument is strongly supported by the significant relationship between
specialization and idea appropriateness.
Behavior of Goal Constraint: Constraint Enhances Creativity
The goal constraint–idea newness and goal constraint–idea usefulness
relationship are pre–specified as inverted U–shape. However, these hypotheses are
found to be only partially supported. The results exhibit significant linear relationship
rather than the curvilinear association between goal constraint and newness and
usefulness dimensions of new product ideas. To ensure that the conclusion can be
rigorously made from the model estimation, post hoc studies were conducted to exclude
any rival explanation by other variables.
The re–analyses powerfully assert that goal constraint increases the newness
and usefulness of new product ideas in a linear manner. These findings could be
supported by the fact that goal constraint can be used to confine creativity task and
focus ideation problems. Confining creativity and focusing ideation, in turn, may
stimulate the challenge for idea creators to conquer. As one might conclude, challenge

100
(especially as a result of goal constraint) could be considered the factor that increases
excitement and concentration and enables idea creators to enjoy the ideation tasks
(Oldham et al. 1995). Accordingly, this intrinsically motivates the creators to overcome
the challenge and accomplish the ideation tasks. As suggested by seminal works on
creativity (Amabile 1996), intrinsic motivation is a crucial factor for creative outcomes
(both usefulness and newness dimensions). This linear relationship between goal
constraint and creative ideation outcomes redirects research attention to the type of
constraint rather than the level of constraint. The different types of constraints may
cause dissimilar effects on the dimensions of new product ideas. For example, goal
constraint enhances creative ideas but other types of constraint (e.g., task constraint,
resource constraint etc.) may negatively impact creativity.
Impact of Goal Constraint
Because goal constraint has exhibited the significant linear relationship with both
newness and usefulness dimensions of ideation outcomes, it is not unexpected to find
that this construct has less significant interaction influence on the componential factors.
Goal constraint can enable significant moderating impacts on the relationship between
specialization and idea newness and that between specialization and idea usefulness.
However, the impact of this constraint seems unapparent on the relationship between
diverse expertise and idea newness and that between diverse expertise and idea
usefulness.
One possible explanation for goal constraint’s non–significant effect on the
diverse expertise–idea newness and diverse expertise–usefulness relationship could be

101
that the ideation team with diverse expertise already had its members representing
diverse body of knowledge. These members have a diversity of views and experience
that they can bring to and share with the others during the creativity task. This ideation
team allows its members to use judgments of knowledgeable others as a basis for
appraising the value of each member’s novel contribution in the relevant functions for a
specific product domain (Csikszentmihályi 1990; Ford 1996; Mumford and Gustafson
1988). This already serves as an implicit and intrinsic constraint for the team when it is
assigned a specific ideation task. As a result of this mechanism, this constraint is likely
to guide the association between the heuristic and algorithmic approach within the
ideation team. Various experts in the team can help others locate the space of
possibilities and prohibit the waste of cognitive efforts and uncreative association. This
may also prevent the team members (with different expertise) from surrendering
themselves to a habitual way of ideation. Therefore, including goal constraint into this
team setting seems unlikely to provide additional impact on the generation of new and
useful ideas.
Inconsistent with the study’s proposal, goal constraint exhibits the significant
moderating impacts on both the relationship between specialization and newness and
that between specialization and usefulness. However, these moderating impacts are in
the opposite direction to the hypothesized ones. In the two follow–up post hoc analyses,
it appears that goal constraint can significantly enhance the idea newness and
usefulness in a group of idea creators who demonstrate a low level of specialization.
Specifically goal constraint increases both idea newness and usefulness in a group of
less specialized creators. This constraint can help this group outperform the more

102
specialized group on the newness and usefulness dimension of creative ideas (see
figure 8 and 9). Apparently, goal constraint does not exhibit a significant impact on a
group with high level of specialization.
A possible explanation for this moderating impact is that the group members
exhibiting high level of specialization are highly experienced and well equipped with
relevant knowledge, experience, and skills regarding new product idea development.
These people understand what they should do when they get involved in the creativity
task. It is perhaps unnecessary to increase goal constraint as the guidance for their
work, and doing so would probably discourage them from creative goals. Conversely, a
group of idea creators with low level of specialization needs guidance. Goal constraint
directs less specialized creators to acquire new information, knowledge, and skills
necessary for producing novel and useful ideation outcomes. Therefore, goal constraint
should be managed carefully and selectively for the appropriate level of ideation team
members’ knowledge, skills, and experience.
Managerial Contribution and Implication
Findings from this study provide several insights for ideation practices. Before
starting any new product idea development project, managers or supervisors for this
creativity task should carefully consider (1) types and quality of new product ideas, (2)
components of an ideation work unit, (3) a goal constraint that could enhance product
innovation, and finally (4) how to generate creative ideas with team members having
different levels of competency.

103
The NPD’s ideation task should be benchmarked by not only two simple
traditional dimensions of new ideas (newness and usefulness to customers) but also the
extent to which new product ideas would fit with the exiting production facilities. This
ultimate goal for the ideation process can satisfy both customers who seek novel and
useful features as well as the producers who desire to mitigate the production hassle
due to completely new sourcing models and the huge investment associated with the
making of a few new product items.
The results from the study also suggest that the development of new product
ideas is a creativity task that needs a team of experts. Having experts embedded with
relevant knowledge regarding NPD in the product domain working on the development
of new product ideas is likely to increase the depth and breadth of knowledge,
experience, and skills necessary for this creativity task. This diversity of area of
expertise can enhance the usefulness of the ideas to customers as well as the
appropriateness of the ideas for the existing lines of production. However, experts
should not be allowed to perform the task solitarily, that can inhibit the newness of
product ideas. A diversity of knowledge, skills, and training backgrounds can mitigate
the effect of competence trap, in which experts are locked in with their own accumulated
knowledge and lead to their routine behaviors rather than novel paths to creative ideas.
A diversity of expertise significantly enhances the creation of new product ideas that are
new and useful to customers and potentially improves the product efficiency and
effectiveness. The findings strongly encourage practitioners to adopt such team setting
as cross–functional structure in the front end of NPD.

104
It is worthy to note that goal constraint is an influential factor that should be
managed rather than eliminated from a creativity task. From a practical standpoint, goal
constraint represents the development limits set by customers. Practitioners should
consider using this constraint to challenge the designated team members who are
assigned to the development of new product ideas. This constraint can stimulate
excitement and intrinsic motivation challenging the team members to overcome
obstacles by utilizing their accumulated knowledge and acquiring new relevant
information necessary for an assigned creativity task. Furthermore, goal constraint is
indeed much more important when the ideation team members do not demonstrate a
high level of competence (i.e., knowledge, skills, and experience in new product idea
development for a specific product domain). This constraint can help the team members
to create new product ideas that are useful and novel to customers.
Theoretical Contribution and Implication
In addition to the managerial insights, this research has added theoretical
contribution to the domain of new product development, especially the front–end of
NPD. Findings from this study suggest that the componential factors for creativity task
could be well understood by separating the breadth (diverse expertise) and depth
(specialization) of knowledge. These two dimensions of knowledge along with a work
unit setting of new product idea creators have different impacts on the desired
outcomes of a creativity task. Findings from this study shed light as to how the ideation
team could be properly organized and structured to achieve the desired creative
outcomes. Moreover, the significant impacts of both specialization and diverse expertise

105
contribute to the literature in cross–functional integration for NPD. The findings indicate
that a cross–functional form could be used successfully in the front–end of NPD as well.
This study also suggests that creativity of new product ideas should be appraised
based on the dimensions that reflect both customer and firm perspective. Idea newness
and usefulness reflect only customer perspective. Therefore, idea appropriateness and
productiveness should be used to represent the impact of ideation outcomes on firms’
production efficiency and effectiveness. These four outcome dimensions of new product
idea creativity should be assessed simultaneously when an ideation project takes off
because they represent essential aspects of the front end, and any decision made
during this stage influences the majority of subsequent resources allocated for the NPD
project.
Finally, this study reveals that constraint, especially goal constraint, does not
inhibit creativity but, instead, enhances creativity. Goal constraint is an essential tool for
an ideation task in which creative idea can be achieved by striking a balance between
algorithmic and heuristic processes. Goal constraint enhances creativity directly and
indirectly through the interaction with ideation team members’ level of knowledge.
Conclusion
As a creativity task, the ideation process is traditionally considered heuristic
rather than algorithmic in nature. The idea generation is heuristic in the sense that it is
the process whereby individuals generate variation of ideas in somewhat mysterious
ways. Making the ideation process to be completely heuristic (i.e., anything goes) needs

106
not result in breakthroughs while the rigid, algorithmic procedure often leads to just
conventional outcomes.
Rooted in cognitive psychology (Simonton 2003, p. 475), this study proposes that
ideation activities in NPD should be pursued as the “constrained stochastic behavior.”
An ideation task not only needs good componential factors but also requires constraint
to frame the task by precluding unwieldy ideas while promoting high variability of ideas.
Focusing on the inputs and attempting to strike a balance between algorithmic and
heuristic ideation process may provide the mechanisms to manage the psychological
perceptions with an aim to stimulate and orchestrate the ideation staff’s cognitive efforts
to generate the creative idea.
To achieve this goal, new product idea creativity is considered as the ideas that
could turn out to be products that are novel to and useful for customers, and appropriate
to firms’ existing production systems. All these dimensions should be used
simultaneously to appraise the extent to which new product ideas are considered
creative. In addition, the study asserts that componential factors include two factors:
specialization representing idea creators’ depth of NPD knowledge, experience, and
skills in a product domain, and diverse expertise representing the breadth of ideation
team’s knowledge, experience, and skills concerning the same domain of NPD. These
factors are essential and collectively can enhance creativity in the development of new
product ideas. Finally, goal constraint is defined, operationalized, and incorporated in
the NPD ideation framework. This constraint encapsulates the overall criteria and
stylistic principle for a particular product domain and reflects the frame of reference for
new product idea development.

107
The findings from this study provide mixed results, and yield at least three new
concepts. First, the process of new product idea development truly requires
specialization and diverse expertise if its ultimate goal is creativity. Both componential
factors are essential and together can enhance new product ideas on all important
dimensions. Second, goal constraint exhibits a linear relationship, rather than an
inverted U–curve relationship, with idea newness and usefulness–two dimension of
creativity important for customers. Finally, goal constraint should be managed rather
than eliminated. This constraint can enhance creative outcomes of new product ideas,
especially in the ideation team exhibiting a low level of specialization.
Limitation and Suggestion for Future Research
The limitation of this study reveals opportunities for future research. Given that
this study has been framed in the technology products, particular care should be taken
when the findings are generalized beyond this product domain. To the best of this
author’s knowledge, this is the first study that incorporates constraint in the model of
new product idea generation and explores its impact on new product ideas. Replication
and confirmatory studies may be very helpful to make progress for this research area.
Several other areas also need future exploration and examination. Firms’
resource available to the ideation team is another key factor that may correlate with
creativity and productivity of idea generation. The supports from the companies
guarantee idea creators necessary resources (e.g., time, human and financial
resources) to experiment and try new things. These may have different impacts on
different creative outcomes. In addition, forming R&D alliance or NPD partnership can

108
increase the number of knowledge sources in which idea creators can access (Huston
and Sakkab 2006), thus increases in the potential for creativity. This relationship
deserves further exploration, as well. Furthermore, it would be interesting to discover
the other industry–specific constraints and understand how these constraints could
improve creativity.
There are other important factors at the ideation team level that should be
examined. Team structure and team process factors are likely to impact team
performance, especially the outcomes of a team’s creativity tasks. Communication and
association are the important factors to facilitate flow of information among individual
idea creators, especially when the creators work as a team. Hence, individuals’ ability to
communicate and associate with other team members is very important in a team’s
creativity task. The additional factors that tie the ideation team members together and
direct them to focus on the assigned creativity task (e.g., social cohesiveness, task
cohesiveness, goal congruity) are likely to facilitate the sharing of knowledge to create
new product ideas. These factors require an examination as well. It is hoped that these
research avenues will pave the way for significant progress in research and practice
concerning the front end of new product development.

109
REFERENCES
Ahuja, Manju K. and Jason Bennett Thatcher (2005), “Moving Beyond Intentions and Toward the Theory of Trying: Effects of Work Environment and Gender on Post–Adoption Information Technology Use,” MIS Quarterly, 29 (September), 427–459.
Aiken, Leona S. and Stephen G. West (1991), Multiple Regression: Testing and Interpreting Interactions. Newbury Park: Sage Publications.
Alford, Charles L. and Joseph Barry Mason (1975), “Generating New Product Ideas,” Journal of Advertising Research, 15 (December), 27–32.
Allison, Paul D. (2002), Missing Data. Thousand Oaks: Sage Publications.
Amabile, Teresa M. (1983), “Personality Processes and Individual Differences,” Journal of Personality and Social Psychology, 45 (August), 357–376.
Amabile, Teresa M. (1996), Creativity in Context: Update to the Social Psychology of Creativity. Boulder: Westview Press.
Amabile, Teresa M. (1997), “Motivating Creativity in Organizations: on Doing What You Love and Loving What You Do,” California Management Review, 40 (1), 39–58.
Amabile, Teresa M. (2001), “Beyond Talent: John Irving and the Passionate Craft of Creativity,” American Psychologist, 56 (4), 333–336.
Amabile, Teresa M. and Sigal G. Barsade, Jennifer S. Mueller, and Barry M. Staw (2005), “Affect and Creativity at Work,” Administrative Science Quarterly, 50 (September), 367–403.
Amabile, Teresa M. and Regina Conti (1999), “Changes in the Work Environment for Creativity during Downsizing,” Academy of Management Journal, 42 (December), 630–640.
Amabile, Teresa M., Regina Conti, Heather Coon, Jeffrey Lazenby, and Michael Herron (1996), “Assessing the Work Environment for Creativity,” Academy of Management Journal, 39 (October), 1154–1184.
Amabile, Teresa M., Chelley Patterson, Jennifer Mueller, Tom Wojcik, Paul A. Odomirok, Mel Marsh, and Steven J. Kramer (2001), “Academic–Practitioner Collaboration in Management Research: A Case of Cross–Profession Collaboration,” Academy of Management Journal, 44 (April), 418–431.
Amabile, Teresa M., Elizabeth A. Schatzel, Giovanni B. Moneta, and Steven J Kramer (2004), “Leader Behaviors and the Work Environment for Creativity: Perceived Leader Support,” Leadership Quarterly, 15 (February), 5–32.

110
Ames, Michael and Mark A. Runco (2005), “Predicting Entrepreneurship from Ideation and Divergent Thinking,” Creativity and Innovation Management, 14 (September), 311–315.
Andersson, Lynne M. and Thomas S. Bateman (1997), “Cynicism in the Workplace: Some Causes and Effects,” Journal of Organizational Behavior, 18 (September), 449–469.
Andrews, Jonlee and Daniel C. Smith (1996), “In Search of the Marketing Imagination: Factors Affecting the Creativity of Marketing Programs for Mature Products,” Journal of Marketing Research, 33 (May), 174–187.
Arthur, W. Brian (1989), “Competing Technologies, Increasing Returns, and Lock–In by Historical Events,” Economic Journal, 99 (March), 116–131.
Atuahene–Gima, Kwaku (1996a), “Market Orientation and Innovation,” Journal of Business Research, 35 (February), 93–103.
Atuahene–Gima, Kwaku (1996b), “Differential Potency of Factors Affecting Innovation Performance in Manufacturing and Services Firms in Australia,” Journal of Product Innovation Management, 13 (January), 35–52.
Atuahene–Gima, Kwaku (2005), “Resolving the Capability–Rigidity Paradox in New Product Innovation,” Journal of Marketing, 69 (October), 61–83.
Aulakh, Preet S. and Esra F. Gencturk (2000), “International Principal–agent Relationships: Control, Governance and Performance,” Industrial Marketing Management, 29 (November), 521–537.
Ayers, Doug, Robert Dahlstrom, and Steven J. Skinner (1997), “An Exploratory Investigation of Organizational Antecedents to New Product Success,” Journal of Marketing Research, 34 (February), 107–116.
Bacon, Glenn, Sara Beckman, David Mowery, and Edith Wilson (1994), “Managing Product Definition in High–technology Industries: A Pilot Study,” California Management Review, 36 (3), 32–56.
Baer, John (1993), Creativity and Divergent Thinking: A Task–Specific Approach. Hillsdale: Lawrence Erlbaum Associates.
Bagozzi, Richard P. and Youjae Yi (1991), “Multitrait–Multimethod Matrices in Consumer Research,” Journal of Consumer Research, 17 (March), 426–439.
Bagozzi, Richard P. and Youjae Yi (1993), “Multitrait–Multimethod Matrices in Consumer Research: Critique and New Developments,” Journal of Consumer Psychology, 2 (2), 143–170.

111
Bagozzi, Richard P., Youjae Yi, and Kent D. Nassen (1999), “Representation of Measurement Error in Marketing Variables: Review of Approaches and Extension to Three–Facet Designs,” Journal of Econometrics, 89, 393–421.
Bailin, Sharon (1994), Achieving Extraordinary Ends: An Essay on Creativity. Norwood: Ablex.
Barron, Frank (1955), “The Disposition Toward Originality,” Journal of Abnormal and Social Psychology, 51 (November), 478–485.
Barsade, Sigal G. and Donald E. Gibson (2007), “Why Does Affect Matter in Organizations?,” Academy of Management Perspectives, 21 (February), 36–59.
Baumgartner, Hans and Jan–Benedict E.M. Steenkamp (1996), “Exploratory Consumer Buying Behavior: Conceptualization and Measurement,” International Journal of Research in Marketing, 13 (April), 121–137.
Bharadwaj, Sundar and Anil Menon (2000), “Making Innovations Happen in Organizations: Individual Creativity Mechanisms, Organizational Creativity Mechanisms or Both?,” Journal of Product Innovation Management, 17 (November), 424–434.
Birch, Susan A. and Paul Bloom (2003), “The Curse of Knowledge in Reasoning about False Beliefs,” unpublished manuscript, Yale University.
Boeddrich, Heinz–Juergen (2004), “Ideas in the Workplace: A New Approach Towards Organizing the Fuzzy Front–end of the Innovation Process,” Creativity and Innovation Management, 13 (December), 274–285.
Booz, Allen, and Hamilton (1968), Management of New Products. New York: Booz, Allen, and Hamilton, Inc.
Booz, Allen, and Hamilton (1982), New Product Management for the 1980’s. New York: Booz, Allen, and Hamilton, Inc.
Briskman, Larry (1980), "Creative Product and Creative Process in Science and Art," Inquiry, 23, 83–106.
Brown, John Seely and Paul Duguid (2000), “Balancing Act: How to Capture Knowledge Without Killing It,” Harvard Business Review, 78 (May), 73–80.
Brown, John Seely and Paul Duguid (2001), “Creativity Versus Structure: A Useful Tension,” MIT Sloan Management Review, 42 (Summer), 93–94.
Brown, Shona L. and Kathleen M. Eisenhardt (1995), “Product Development: Past Research, Present Findings, and Future Directions,” Academy of Management Review, 20 (April), 343–378.
112
Brown, Vincent, Michael Tumeo, Timothy S. Larey, and Paul B. Paulus (1998), “Modeling Cognitive Interactions During Group Brainstorming,” Small Group Research, 29 (August), 495–526.
Busse, Thomas V. and Richard S. Mansfield (1980), “Theories of the Creative Process: A Review and a Perspective,” Journal of Creative Behavior, 14 (2), 91–103.
Byrne, Barbara M. (1998), Structural Equation Modeling with LISREL, PRELIS, and SIMPLIS. Mahwah: Lawrence Erlbaum Associates.
Calantone, Roger J., C. Anthony Di Benedetto, and Jeffrey B. Schmidt (1999), “Using the Analytic Hierarchy Process in New Product Screening,” Journal of Product Innovation Management, 16 (January), 65–76.
Calder, Bobby J., Lynn W. Phillips, and Alice M. Tybout (1981), “Designing Research for Application,” Journal of Consumer Research, 8 (September), 197–207.
Calder, Bobby J., Lynn W. Phillips, and Alice M. Tybout (1982), “The Concept of External Validity,” Journal of Consumer Research, 9 (December), 240–244.
Camerer, Colin, George Loewenstein, and Martin Weber (1989), “The Curse of Knowledge in Economic Settings: An Experimental Analysis,” Journal of Political Economy, 97 (5), 1232–1254.
Campbell, Donald T. and Julian C. Stanley (1973), Experimental and Quasi–Experimental Designs for Research. Chicago: Rand McNally College.
Capell, Kerry (2006), “How Philips Got Brand Buzz,” BusinessWeek, (July 31).
Carey, Susan (1985), Conceptual Change in Childhood. Cambridge: MIT Press.
Cavusgil, S. Tamer and Lisa A. Elvey–Kirk (1998), “Mail Survey Response Behavior: a Conceptualization of Motivating Factors and an Empirical Study,” European Journal of Marketing, 32 (11/12), 1165–1192.
Chomsky, Noam (1957), Syntactic Structures. The Hague: Mouton.
Cini, Marie A., Richard L. Moreland, and John M. Levine (1993), “Group Staffing Levels and Response to Prospective and New Group Members,” Journal of Personality and Social Psychology, 65 (October), 723–734.
Clark, Kim B. and Steven C. Wheelwright (1995), Leading Product Development. New York: Free Press.
Coates, Nigel F., Iain Cook, and Harry Robinson (1996), Idea Generation Techniques in an Industrial Market,” Journal of Marketing Practice: Applied Marketing Science, 3 (2), 107–118.

113
Cohen, Jacob, Patricia Cohen, Stephen G. West, and Leona S. Aiken (2003), Applied Multiple Regression/Correlation Analysis for the Behavioral Sciences. Mahwah: Lawrence Erlbaum Associates.
Cook, Thomas D. and Donald T. Campbell (1979), Quasi–Experimentation: Design and Analysis Issues for Field Settings. Boston: Houghton Mifflin Company.
Cooper, Robert G. (1979), “The Dimensions of Industrial New Product Success and Failure,” Journal of Marketing, 43 (Summer), 93–103.
Cooper, Robert G. (1984), “New Product Strategies: What Distinguishes the Top Performers?,” Journal of Product Innovation Management, 1 (September), 151–164.
Cooper, Robert G. (1988), “Predevelopment Activities Determine New Product Success,” Industrial Marketing Management, 17 (August), 237–247.
Cooper, Robert G. (1994), “Perspective: Third–Generation New Product Processes” Journal of Product Innovation Management, 11 (January), 3–14.
Cooper, Robert G. (1996), “New Products: What Separates the Winners from Losers,” in The PDMA Handbook of New Product Development, Milton D. Rosenau, ed. New York: John Wiley & Sons, 3–18.
Cooper, Robert G. and Elko J. Kleinschmidt (1987), “New Products: What Separates Winners from Losers?,” Journal of Product Innovation Management, 4 (September), 169–184.
Cooper, Robert G. and Elko J. Kleinschmidt (1988), “Resource Allocation in the New Product Process,” Industrial Marketing Management, 17 (August), 249-252.
Cooper, Robert G. and Elko J. Kleinschmidt (1994), “Determinants of Timeliness in Product Development,” Journal of Product Innovation Management, 11 (November), 381–396.
Costello, Fintan J. and Mark T. Keane (2000), “Efficient Creativity: Constraint–Guided Conceptual Combination, Cognitive Science, 24 (April), 299–349.
Couger, J. Daniel, Scott C. McIntyre, Lexis F. Higgins, and Terry A. Snow (1991), “Using a Bottom–Up Approach to Creativity Improvement in IS Development,” Journal of Systems Management, 42 (September), 23–28.
Crawford, C. Merle (1991), “The Dual–Drive Concept of Product Innovation,” Business Horizons, 34 (May), 32–38.
Crawford, C. Merle (1992), New Products Management. Boston: Irwin.
Crawford, C. Merle (1994), New Products Management. Burr Ridge: Irwin.

114
Csikszentmihályi, Mihály (1988), “Society, Culture, and Person: A Systems View of Creativity,” in The Nature of Creativity, Robert J. Sternberg, eds. New York: Cambridge University Press, 325–339.
Csikszentmihályi, Mihály (1990), “The Domain of Creativity,” in Theories of Creativity, Mark A. Runco and Robert S. Albert, eds. Newbury Park: Sage Publications, 191–212.
Curran, Patrick J., Stephen G. West, and John F. Finch (1996), “The Robustness of Test Statistics to Nonnormality and Specification Error in Confirmatory Factor Analysis, Psychological Methods, 1 (March), 16–29.
Dahl, Darren W. and Page Moreau (2002), “The Influence and Value of Analogical Thinking During New Product Ideation,” Journal of Marketing Research, 39 (February), 47–60.
Day, George S., Bela Gold, and Thomas D. Kuczmarski (1994), Significant Issues for the Future of Product Innovation, Journal of Product Innovation Management, 11 (January), 69–75.
Day, George S. and Robin Wensley (1988), “Assessing Advantage: A Framework for Diagnosing Competitive,” Journal of Marketing, 52 (April), 1–20.
De Meyer, Arnoud (2004), “Renewal and Innovation: A Condition of the Health of Nations,” The Organization for Economic Cooperation and Development (OECD) Observer, 243 (May), 50–51.
Dennis, Alan R. and Joseph S. Valacich (1994), “Group, Sub–Group, Nominal Group Idea Generation: New Rules for a New Media?,” Journal of Management, 20 (4), 723–736.
Durant, Rita (2002), “Synchronicity: A Post–Structuralist Guide to Creativity and Change,” Journal of Organizational Change Management, 15 (5), 490–501.
Filipowicz, Allan (2006), “From Positive Affect to Creativity: The Surprising Role of Surprise,” Creativity Research Journal, 18 (2), 141–152.
Finke, Ronald A., Thomas B. Ward, and Steven M. Smith (1992), Creative Cognition. Cambridge: MIT Press.
Finke, Ronald A., Thomas B. Ward, and Steven M. Smith (1996), Creative Cognition: Theory, Research, and Applications. Cambridge: MIT Press.
Flint, Daniel J. (2002), “Compressing New Product Success–to–Success Cycle Time: Deep Customer Value Understanding and Idea Generation,” Industrial Marketing Management, 31 (July), 305–315.
Fodor, Jerry F. (1983), The Modularity of Mind. Cambridge: MIT Press.

115
Ford, Cameron M. (1996), “A Theory of Individual Creative Action in Multiple Social Domains,” Academy of Management Review, 21 (October), 1112–1142.
Gatignon, Hubert and Jean–Marc Xuereb (1997), “Strategic Orientation of the Firm and New Product Performance,” Journal of Marketing Research, 34 (February), 77–90.
Gelman, Rochel and C. Randy Gallistel (1978), The Child's Understanding of Number. Cambridge: Harvard University Press.
George, Jennifer M. and Jing Zhou (2002), “Understanding When Bad Moods Foster Creativity and Good Ones Don’t: The Role of Context and Clarity of Feelings,” Journal of Applied Psychology, 87 (August), 687–697.
Gerbing, David W. and James C. Anderson (1988), “An Updated Paradigm for Scale Development Incorporating Unidimensionality and Its Assessment,” Journal of Marketing Research, 25 (May), 186–192.
Getzels, Jacob W. and Mihaly Csikszentmihalyi (1975), “From Problem Solving to Problem Finding,” in Perspectives in Creativity, Irving A. Taylor and Jacob W. Getzels, eds. Chicago: Aldine, 90–116.
Ghiselin, Brewster (1963), “Ultimate Criteria for Two Levels of Creativity,” in Scientific Creativity: Its Recognition and Development, Calvin Walker Taylor and Frank X. Barron, eds. New York: Wiley, 30–43.
Goldenberg, Jacob, David Mazursky, and Sorin Solomon (1999), “Toward Identifying the Inventive Templates of New Products: A Channeled Ideation Approach,” Journal of Marketing Research, 36 (May), 200–210.
Goldenberg, Jacob, Donald R. Lehman, and David Mazursky (2001), “The Idea Itself and the Circumstances of Its Emergence as Predictors of New Product Success,” Management Science, 47 (January), 69–84.
Gough, H. G. (1979), “A Creative Personality Scale for the Adjective Check List,” Journal of Personality and Social Psychology, 37 (August), 1398–1405.
Gourieroux, Christian and Alain Monfort (1981), “On the Problem of Missing Data in Linear Models,” The Review of Economic Studies, 48 (October), 579–586.
Gourville, John T. (2005), “The Curse of Innovation: Why Innovative New Products Fail,” Marketing Science Institute Reports, 5 (117), 3–23.
Griffin, Abbie (1997a), “PDMA Research on New Product Development Practices: Updating Trends and Benchmarking Best Practices,” Journal of Product Innovation Management, 14 (November), 429–458.

116
Griffin, Abbie (1997b), “The Effect of Project and Process Characteristics on Product Development Cycle Time,” Journal of Marketing Research, 34 (February), 24–35.
Griffiths–Hemans, Janice and Rajiv Grover (2006), “Setting the Stage for Creative New Products: Investigating the Idea Fruition Process,” Journal of the Academy of Marketing Science, 34 (1), 27–39.
Guilford, Joy Paul (1950), “Creativity,” American Psychologist, 5 (September), 444-454.
Guilford, Joy Paul (1968), Creativity, Intelligence, and their Educational Implications. San Diego: Knapp.
Gupta, Ashok K. and David Wilemon (1988), “The Credibility–Cooperation Connection at the R&D–Marketing Interface,” Journal of Product Innovation Management, 1 (March), 20–31.
Hair, Jr., Joseph F., Rolph E. Anderson, Ronald L. Tatham, and William C. Black (1998), Multivariate Data Analysis. Upper Saddle River: Prentice Hall.
Hamel, Gary (2000), Leading the Revolution. Boston: Harvard Business School Press.
Hargadon, Andrew and Robert I. Sutton (1997), “Technology Brokering and Innovation in a Product Development Firm,” Administrative Science Quarterly, 42 (December), 716–749.
Harmon, L. R. (1963), “The Development of a Criterion of Scientific Competence,” in Scientific Creativity: Its Recognition and Development, Calvin Walker Taylor and Frank X. Barron, eds. New York: Wiley, 44–52.
Harrington, David M. (1990), “The Ecology of Human Creativity: A Psychological Perspective,” in Theories of Creativity, Mark A. Runco and Robert S. Albert, eds. Newbury Park: Sage Publications, 143–169.
Hausman, Carl R. (1979), “Criteria of Creativity,” Philosophy and Phenomenological Research, 40 (December), 237–249.
Hayes, Robert H., Steven C. Wheelwright, and Kim B. Clark (1988), Dynamic Manufacturing. New York: Free Press.
Heath, Chip (2003), “Loud and Clear: Crafting Messages That Stick–What Nonprofits Can Learn From Urban Legen,” Standford Social Innovation Review, Winter, 18–27.
Heath, Chip and Dan Heath (2006), “The Curse of Knowledge,” Harvard Business Review, 84 (December), 20–22.
Henard, David H. and David M. Szymanski (2001), “Why Some New Products are More Successful than Others,” Journal of Marketing Research, 38 (August), 362–375.

117
Hirunyawipada, Tanawat and Archna Vahie (2005), “Cross–Functional Integration and New Product Performance: A Meta–Analysis,” in 2005 AMA Winter Educators’ Conference: Marketing Theory and Applications, Kathleen Seiders and Glenn B. Voss, eds. Chicago: American Marketing Association, 183–184.
Hitt, Michael A., R. Duane Ireland, S. Michael Camp, and Donald L. Sexton (2001), “Guest Editors’ Introduction to the Special Issue Strategic Entrepreneurship: Entrepreneurial Strategies for Wealth Creation,” Strategic Management Journal, 22 (June), 479–491.
Hocevar, Dennis (1981), “Measurement of Creativity: Review and Critique,” Journal of Personality Assessment, 45 (October), 450–464.
Hollenbeck, John R, Daniel R. Ilgen, Dale B. Tuttle, and Douglas J. Sego (1995), “Team Performance on Monitoring Tasks: An Examination of Decision Errors in Contexts Requiring Sustained Attention,” Journal of Applied Psychology, 80 (December), 685–696.
Huck, Schuyler W. (2003), Reading Statistics and Research. Boston: Pearson Education.
Huston, Larry (2004), “Mining the Periphery for New Products,” Long Range Planning, 37 (April), 191–196.
Huston, Larry and Nabil Sakkab (2006), “Connect and Develop: Inside Procter & Gamble’s New Model for Innovation,” Harvard Business Review, 84 (March), 58–66.
IBM (2006), “The Global CEO Study 2006,” (accessed June 3, 2006), [available at http://www–1.ibm.com/services/us/bcs/html/bcs_ceostudy2006.html?re=wmys].
Ilieva, Janet, Steve Baron, and Nigel M. Healey (2002), “Online Surveys in Marketing Research: Pros and Cons,” International Journal of Marketing Research, 44 (3), 361–382.
Im, Subin and John P. Workman Jr. (2004), “Market Orientation, Creativity, and New Product Performance in High–Technology Firms,” Journal of Marketing, 68 (April), 114–132.
Isen, Alice M., Kimberly A. Daubman, and Gary P. Nowicki (1987), “Positive Affect Facilitates Creative Problem Solving,” Journal of Personality and Social Psychology, 52 (June), 1122–1131.
Jaccard, James, Choi K. Wan, and Robert Turrisi (1990), “The Detection and Interpretation of Interaction Effects Between Continuous Variables in Multiple Regression,” Multivariate Behavioral Research, 25 (October), 467–478.

118
James, Keith, Marc Brodersen, and Jacob Eisenberg (2004), “Workplace Affect and Workplace Creativity: A Review and Preliminary Model,” Human Performance, 17 (2), 169–194.
Jaruzelski, Barry, Kevin Dehoff, and Rakesh Bordia (2005), “The Booz Allen Hamilton Global Innovation 1000: Money Isn’t Everything,” strategy+business, 41 (Winter), 3–15.
Jaworski, Bernard J. and Ajay K. Kohli (1993), “Market Orientation: Antecedents and Consequences,” Journal of Marketing, 57 (July), 53–70.
Johnson–Laird, Philip N. (1988), “Freedom and Constraint in Creativity,” in The Nature of Creativity: Contemporary Psychological Perspectives, Robert J. Sternberg, eds. Cambridge: Cambridge University Press, 202–219.
Jöreskog, Karl G., and Dag Sörbom (1993). LISREL 8: LISREL 8: User's Reference Guide. Mooresville: Scientific Software International.
Kappel, Thomas A. and Albert H. Robenstein (1999), “Creativity in Design: The Contribution of Information Technology,” IEEE Transactions on Engineering Management, 46 (May), 132–143.
Karmarkar, Uday S. (1996), “Integrative Research in Marketing and Operations Management,” Journal of Marketing Research, 33 (May), 125–133.
Kazanjian, Robert K., Robert Drazin, and Mary Ann Glynn (2000), “Creativity and Technological Learning: The Roles of Organization Architecture and Crisis in Large–Scale Projects,” Journal of Engineering and Technology Management, 17 (September), 273–298.
Keil, Frank C. (1981), Constraints on Knowledge and Cognitive Development, Psychological Review, 83 (3), 197–227.
Kelley, Colleen M. and Larry L. Jacoby (1996), “Adult Egocentrism: Subjective Experience versus Analytic Bases for Judgment,” Journal of Memory and Language, 35 (April), 157–175.
Kenny, David A. (1976), “An Empirical Application of Confirmatory Factor Analysis to the Multitrait–Multimethod Matrix,” Journal of Experimental Social Psychology, 12 (May), 247–252.
Khurana, Anil and Stephen R. Rosenthal (1998), “Towards Holistic "Front Ends" in New Product Development,” Journal of Product Innovation Management, 15 (January), 57–74.
Kickul, Jill and Lisa Gundry (2001), “Breaking through Boundaries for Organizational Innovation: New Managerial Roles and Practices in E–commerce Firms,” Journal of Management, 27 (3), 347–361.

119
Kim, Jongbae, and David Wilemon (2002), “Focusing the Fuzzy Front–End in New Product Development,” R&D Management, 32 (September), 269–279.
Kratzer, Jan, Roger Th. A. J. Leenders, and Jo M. L. van Engelen (2004), “Stimulating the Potential: Creative Performance and Communication in Innovation Teams,” Creativity and Innovation Management,” 13 (March), 63–71.
Kris, Ernst (1952), Psychoanalytic Explorations in Art. New York: International Universities Press.
Krishnakumar, Ambika, Cheryl Buehler, and Brian K. Barber (2004), “Cross–Ethnic Equivalence of Socialization Measures in European American and African American Youth,” Journal of Marriage and Family, 66 (August), 809–240.
Langer, Ellen J. and Lois G. Imber (1979), “When Practice Makes Imperfect: Debilitating Effects of Overlearning,” Journal of Personality and Social Psychology, 37 (November), 2014–2024.
Larsen, Randy J. (1992), “Neuroticism and Selective Encoding and Recall of Symptoms: Evidence from a Combined Concurrent–Retrospective Study,” Journal of Personality and Social Psychology, 62 (March), 480–488.
Leenders, Mark A. A. M. and Berend Wierenga (2002), “The Effectiveness of Different Mechanisms for Integrating Marketing and R&D,” Journal of Product Innovation Management, 19 (July), 305–317.
Leenders, Roger Th. A. J., Jo M. L. van Engelen, and Jan Kratzer (2003), “Virtuality, Communication, and New Product Team Creativity: A Social Network Perspective,” Journal of Engineering and Technology Management, 20 (March/June), 69–92.
Levitt, Theodore (2002), “Creativity Is Not Enough,” Harvard Business Review, 80 (August), 137–144.
Lewis, Marianne W. (2000), “Exploring Paradox: Toward a More Comprehensive Guide,” Academy of Management Review, 25 (October), 760–776.
Li, Jin and Howard Gardner (1993), “How Domains Constrain Creativity: The Case of Traditional Chinese and Western Painting,” American Behavioral Scientist, 37 (1), 94–101.
Li, Tiger and Roger J. Calantone (1998), “The Impact of Market Knowledge Competence on New Product Advantage: Conceptualization and Empirical Examination,” Journal of Marketing, 62 (October), 13–29.
Lilien, Gary L., Pamela D. Morrison, Kathleen Searls, Mary Sonnack, Eric von Hippel (2002), “Performance Assessment of the Lead User Idea–Generation Process for New Product Development,” Management Science, 48 (August), 1042–1059.

120
Little, Roderick J. (1988), “Missing Data in Large Surveys,” Journal of Business and Economic Statistics, 6 (July), 287–296.
Little, Roderick J. and Donald B. Rubin (1987), Statistical Analysis with Missing Data. New York: John Wiley.
Luo, Xueming, Rebecca J. Slotegraaf, and Xing Pan (2006), "Cross–Functional Coopetition: The Simultaneous Role of Cooperation and Competition within Firms," Journal of Marketing, 70 (April), 67–80.
MacKinnon, Donald W. (1962), “The Nature and Nurture of Creative Talent,” American Psychologist, 17 (July), 484–495.
MacKinnon, Donald W. (1965), “Personality and the Realization of Creative Potential,” American Psychologist, 20 (April), 273–281
March, James G. and Herbert A. Simon (1958), Organizations. New York: Wiley.
Marsh, Herbert W. and Michael Bailey (1991), “Confirmatory Factor Analyses of Multitrait–Multimethod Data: A Comparison of Alternative Models, Applied Psychological Measurement, 15 (1), 47–70.
Martindale, Colin (1981), Cognition and Consciousness. Homewood: Dorsey Press.
Martindale, Colin (1995), “Creativity and Connectionism,” in The Creative Cognition Approach, Steven M. Smith, Thomas B. Ward, and Ronald A. Finke, eds. Cambridge: MIT Press, 249–268.
Mayer, Marissa Ann (2006), “Creativity Loves Constraints,” BusinessWeek, (February 13).
McAdam, Neil (2006), “Situational Stress and Restriction of Stylistic Repertoire in High Potential Managerial Aspirants: Implications for the Implementation of the New Organization,” Journal of Management and Organization, 12 (June), 40–67.
McGregor, Jena (2006), “The World’s Most Innovative Companies,” BusinessWeek, (April 24).
Menon, Anil, Sundar G. Bharadwaj, Phani Tej Adidam, and Steven W. Edison (1999), “Antecedents and Consequences of Marketing Strategy Making: A Model and a Test,” Journal of Marketing, 63 (April), 18–40.
Mintzberg, Henry (1988), “Generic Strategies: Toward a Comprehensive Framework,” in Advances in Strategic Management, Robert B. Lamb and Paul Shivastava, eds. Greenwich: JAI Press, 1–67.

121
Moenaert, Rudy K., Arnoud De Meyer, William E. Souder, and Dirk Deschoolmeester (1995), “R&D/Marketing Communication during the Fuzzy Front–End,” IEEE Transactions on Engineering Management, 42 (August), 243–258.
Mohrman, Susan Albers, Susan G. Cohen, and Allan M. Mohrman, Jr. (1995), Designing Team–Based Organizations: New Forms for Knowledge Work. San Francisco: Jossey–Bass.
Montgomery, Diane, Pamela A. Hodges, and Judith S. Kaufman (2004), “An Exploratory Study of the Relationship between Mood States and Creativity Self–perceptions,” Creativity Research Journal, 16 (2/3), 341–344.
Montoya–Weiss, Mitzi M. and Roger Calantone (1994), “Determinants of New Product Performance: A Review and Meta–Analysis,” Journal of Product Innovation Management, 11 (November), 397–417.
Montoya–Weiss, Mitzi M., and Tony M. O'Driscoll (2000), “From Experience: Applying Performance Support Technology in the Fuzzy Front End,” Journal of Product Innovation Management, 17 (March), 143–161.
Moorman, Christine and Anne S. Miner (1997), “The Impact of Organizational Memory on New Product Performance and Creativity,” Journal of Marketing Research, 34 (February), 91–106.
Mumford, Michael D. and Sigrid B. Gustafson (1988), “Creativity Syndrome: Integration, Application, and Innovation,” Psychological Bulletin, 103 (January), 27–43.
Murphy, Steven A. and Vinod Kumar (1997), “The Front End of New Product Development: A Canadian Survey,” R & D Management, 27 (January), 5–15.
Neter, John, Michael H. Kutner, Christopher J. Nachtsheim, and William Wasserman (1996), Applied Linear Statistical Models. Chicago: Irwin.
Nevitt, Jonathan and Gregory R. Hancock (2004), “Evaluating Small Sample Approaches for Model Test Statistics in Structural Equation Modeling,” Multivariate Behavioral Research, 39 (July), 439–478.
Newell, Allen (1990), Unified Theories of Cognition. Cambridge: Harvard University Press.
Newton, T. J. and A. Keenan (1987), “Role Stress Reexamined: An Investigation of Role Stress Predictors,” Organizational Behavior and Human Decision Processes, 40 (December), 346–368.
Nijstad, Bernard A., Michael Diehl, and Wolfgang Stroebe (2003), “Cognitive Stimulation and Interference in Idea–Generating Groups,” in Group Creativity: Innovation Through Collaboration, Paul B. Paulus and Bernard A. Nijstad, eds. New York: Oxford University Press, 137–159.

122
Nunnally, Jum C. (1978), Psychometric Theory. New York: McGraw–Hill.
Nunnally, Jum C. and Ira H. Bernstein (1994), Psychometric Theory. New York: McGraw–Hill.
Offner, Deborah (1990), “Hitch–Hiking on Creativity in Nature,” Journal of Creative Behavior, 24 (3), 199–204.
Ofori–Dankwa, Joseph and Scott D. Julian (2004), “Conceptualizing Social Science Paradoxes Using the Diversity and Similarity Curves Model: Illustrations from the Work/Play and Theory Novelty/Continuity Paradoxes,” Human Relations, 57 (November), 1449–1477.
Oldham, Greg R., Anne Cummings, Leann J. Mischel, James M. Schmidtke, and Jing Zhou (1995), “Listen While You Work? Quasi–experimental Relations between Personal–Stereo Headset Use and Employee Work Responses,” Journal of Applied Psychology, 80 (October), 547–564.
Olson, Erik L. and Geir Bakke (2001), “Implementing the lead user method in a high technology firm: A longitudinal study of intentions versus actions,” Journal of Product Innovation Management, 18 (November), 388–395.
Osborn, Alex F. (1993), Applied Imagination: Principles and Procedures of Creative Problem–Solving. Hadley: Creative Education Foundation.
Page, Albert L. (1993), “Assessing New Product Development Practices and Performance: Establishing Crucial Norms,” Journal of Product Innovation Management, 10 (September), 273–290.
Parent, Michael, R. Brent Gallupe, Wm. David Salisbury, and Jay M. Handelman (2000), “Knowledge Creation in Focus Groups: Can Group Technologies Help?,” Information & Management, 38 (October), 47–58.
Paulus, Paul B., Mary T. Dzindolet, George Poletes, and L. Mabel Camacho (1993), “Perception of Performance in Group Brainstorming: The Illusion of Group Productivity,” Personality and Social Psychology Bulletin, 19 (February), 78–89.
Paulus, Paul B., Timothy S. Larey, and Mary T. Dzindolet (2000), “Creativity in Groups and Teams,” in Groups at Work: Theory and Research, Marlene E. Turner, eds. Hillsdale: Hampton, 319–338.
Paulus, Paul B. and Huei–Chuan Yang (2000), “Idea Generation in Groups: A Basis for Creativity in Organizaitons,” Organizational Behavior and Human Decision Processes, 82 (May), 76–87.
Perkins, David N. (1981), The Men’s Best Work. Boston: Harvard University Press.

123
Perkins, David N. (1997), Knowledge as Design. Mahwah: Lawrence Erlbaum Associates.
Perkins, David N. and Tina A. Grotzer (1997), “Teaching Intelligence,” The American Psychologist, 52 (October), 1125–1133.
Podsakoff, Philip M., Scott B. MacKenzie, Jeong–Yeon Lee, and Nathan P. Podsakoff (2003), “Common Method Biases in Behavioral Research: a Critical Review of the Literature and Recommended Remedies”, Journal of Applied Psychology, 88 (October), 879–903.
Port, Otis (1998), “Design Software That Makes Complexity Look Simple,” BusinessWeek, (May 18).
Prajogo, Daniel I., Damien J. Power, and Amrik S. Sohal (2004), “The Role of Trading Partner Relationships in Determining Innovation Performance: An Empirical Examination,” European Journal of Innovation Management, 7 (3), 178–186.
Prince, George M. (1970), The Practice of Creativity. New York: Harper and Row.
Ratneshwar, S. and Allan D. Shocker (1991), “Substitution in Use and the Role of Usage Context in Product Category Structure”, Journal of Marketing Research, 28 (August), 281–295.
Reid, Susan E. and Ulrike de Brentani (2004), “The Fuzzy Front–end of New Product Development for Discontinuous Innovations: A Theoretical Model,” Journal of Product Innovation Management, 21 (May), 170–184.
Rogers, Everett M. (2003), Diffusion of Innovations. New York: Free Press.
Rosegger, Gerhard (1996), The Economics of Production and Innovation. Oxford: Butterworth–Heinemann, p. 125–145.
Rosenau, Morton D. (1988), “Speeding Your Product to Market,” Journal of Consumer Marketing, 5 (March), 23–40.
Roster, Catherine A., Robert D. Rogers, and Gerald Albaum (2004), “A Comparison of Response Characteristics from Web and Telephone Surveys,” International Journal of Marketing Research, 46 (3), 359–373.
Schaefer, David R. and Don A. Dillman (1998), “Development of a Standard E–mail Methodology: Results of an Experiment,” Public Opinion Quarterly, 62 (3), 378–397.
Schafer, Joseph L. (1997), Analysis of Incomplete Multivariate Data. London: Chapman & Hall.

124
Schafer, Joseph L. and John W. Graham (2002), “Missing Data: Our View of the State of the Art,” Psychological Methods, 7 (June), 147–177.
Schank, Roger C. and Robert P. Abelson (1977), Scripts, Plans, Goals and Understanding: an Inquiry into Human Knowledge Structures. Hillsdale, NJ: Lawrence Erlbaum.
Schumpeter, Joseph A. (1934), The Theory of Economic Development. Cambridge: Harvard University Press.
Sethi, Rajesh (2000), “New Product Quality and Product Development Teams,” Journal of Marketing, 64 (April), 1–14.
Sethi, Rajesh, Daniel C. Smith, and C. Whan Park (2001), “Cross–Functional Product Development Teams, Creativity, and the Innovativeness of New Consumer Products,” Journal of Marketing Research, 38 (February), 73–85.
Sherman, J. Daniel, William E. Souder and Svenn A. Jenssen (2000), “Differential Effects of the Primary Forms of Cross Functional Integration on Product Development Cycle Time,” Journal of Product Innovation Management, 17 (July), 257–267.
Simonton, Dean Keith (1983), “Formal Education, Eminence and Dogmatism: The Curvilinear Relationship,” Journal of Creative Behavior, 17, 149–162.
Simonton, Dean Keith (1997), “Creative Productivity: A Predictive and Explanatory Model of Career Trajectories and Landmarks,” Psychological Review, 104 (January), 66–89.
Simonton, Dean Keith (1999), Origins of Genius: Darwinian Perspectives on Creativity. New York: Oxford University Press.
Simonton, Dean Keith (2003), “Scientific Creativity as Constrained Stochastic Behavior: The Integration of Product, Person, and Process perspectives,” Psychological Bulletin, 129 (July), 475–454.
Singh, Jagdip (1995), “Measurement Issues in Cross–National Research,” Journal of International Business Studies, 26 (3), 597–619.
Smith, Preston G. and Donald G. Reinertsen (1991), Developing Products in Half the Time, New York: Van Nostrand Reinhold.
Smith, Preston G. and Donald G. Reinertsen (1992), “Shortening the Product Development Cycle,” Research Technology Management, 35 (May), 44–49.
Sobek II, Durward K., Jeffrey K. Liker, and Allen C. Ward (1998), “Another Look at How Toyota Integrates Product Development,” Harvard Business Review, 76 (July), 36–49.

125
Sobell, Linda C., Tony Toneatto, Mark B. Sobell, Reinhard Schuller, and Maxine Maxwell (1990), “A Procedure for Reducing Errors in Reports of Life Events,” Journal of Psychosomatic Research, 34 (2), 163–170.
Song, Michael X. and Mitzi M. Montoya–Weiss (2001), “The Effect of Perceived Technological Uncertainty on Japanese New Product Development,” Academy of Management Journal, 44 (February), 61–80.
Song, Michael X., R. Jeffrey Thieme, and Jinhong Xie (1998), “The Impact of Cross–functional Joint Involvement Across Product Development Stages: An Exploratory Study,” Journal of Product Innovation Management, 15 (July), 289–303.
Sowrey, Trevor (1987), The Generation of Ideas for New Products. London: Kogan Page.
Stevens, Greg, James Burley, and Richard Divine (1999), “Creativity+Business Discipline=Higher Profits Faster from New Product Development,” Journal of Product Innovation Management, 16 (September), 455468.
Stokes, Patricia D. (2001), “Variability, Constraints, and Creativity: Shedding Light on Claude Monet,” American Psychologist, 56 (April), 355–359.
Stokes, Patricia D. (2006), Creativity: The Psychology of Breakthrough. New York: Springer Publishing.
Stokes, Patricia D. and Danielle Fisher (2005), “Selection, Constraints, and Creativity Case Studies: Max Beckmann and Phillip Guston,” Creativity Research Journal, 17 (2/3), 283–291.
Stokes, Patricia D. and Helen M. Harrison (2002), “Constraints Have Different Concurrent Effects and Aftereffects on Variability,” Journal of Experimental Psychology, 131 (December), 552–566.
Stroebe, Wolfgang, Michael Diehl, and Georgios Abakoumkin (1992), “The Illusion of Group Effectivity,” Personality and Social Psychology Bulletin, 18 (October), 643–650.
Sutton, Robert I. and Andrew Hargadon (1996), “Brainstorming Groups in Context: Effectiveness in a Product Design Firm,” Administrative Science Quarterly, 41 (December), 685–718.
Taggar, Simon (2002), “Individual Creativity and Group Ability to Utilize Individual Creative Resources: A Multilevel Model,” Academy of Management Journal, 45 (April), 315–330.
Tauber, Edward M. (1972), “HIT: Heuristic Ideation Technique–A Systematic Procedure for New Product Search,” Journal of Marketing, 36 (January), 58–70.

126
Tauber, Edward M. (1975), “Discovering New Product Opportunities with Problem Inventory Analysis,” Journal of Marketing, 39 (January), 67–70.
Taylor, Alva and Henrich R. Greve (2006), “Superman or the Fantastic Four? Knowledge Combination and Experience in Innovative Teams,” Academy of Management Journal, 49 (August), 723–740.
Thamhain, Hans J. (1990), “Managing Technologically Innovative Team Efforts Toward New Product Success,” Journal of Product Innovation Management, 7 (March), 5–18.
Tiplady, Rachel (2005), “Behind Philips' High Design,” BusinessWeek, (October 26).
Troy, Lisa C., David M. Szymanski, and P. Rajan Varadarajan (2001), “Generating New Product Ideas: An Initial Investigation of the Role of Market Information and Organizational Characteristics,” Journal of the Academy of Marketing Science, 29 (1), 89–101.
Urban, Glen L. and John R. Hauser (1993), Design and Marketing of New Products. Englewood Cliffs: Prentice–Hall.
Van Auken, Stuart, Thomas E. Barry, and Richard P. Bagozzi (2006), “A Cross–Country Construct Validation of Cognitive Age,” Journal of the Academy of Marketing Science, 34 (3), 439–455.
Van Dyne, Linn, Karen A. Jehn, and Anne Cummings (2002), “Differential Effects of Strain on Two Forms of Work Performance: Individual Employee Sales and Creativity,” Journal of Organizational Behavior, 23 (February), 57–74.
Vandenbosch, Betty, Argun Saatcioglu, and Sharon Fay (2006), “Idea Management: A Systemic View,” Journal of Management Studies, 43 (March), 259–288.
Weisberg, Robert W. (1992), Creativity Beyond the Myth of Genius. New York: W.H. Freeman Company.
West, Alan and Colin Martindale (1996), “Creative Trends in the Content of Beatles Lyrics,” Popular Music and Society, 20 (4), 103–125.
Wind, Jerry and Vijay Mahajan (1997), “Issues and Opportunities in New Product Development: An Introduction to the Special Issue,” Journal of Marketing Research, 34 (February), 1–12.
Womak, James, Daniel Jones, and Daniel Roos (1990), The Machine That Changed the World. New York: HarperCollins.
Woodman, Richard W, John E. Sawyer, and Ricky W. Griffin (1993), “Toward a Theory of Organizational Creativity,” Academy of Management Review, 18 (April), 293–321.

127
Wright, Thomas A. and André P. Walton (2003), “Affect, Psychological Well–Being and Creativity: Results of a Field Study,” Journal of Business and Management, 9 (1), 21–32.
Yu, Julie and Harris Cooper (1983), “A Quantitative Review of Research Design Effects on Response Rates to Questionnaires,” Journal of Marketing Research, 20 (February), 36–44.
Zahay, Debra, Abbie Griffin, and Elisa Fredericks (2004), “Sources, Uses, and Forms of Data in the New Product Development Process,” Industrial Marketing Management, 33 (October), 657–666.
Zirger, Billie Jo and Modesto Maidique (1990), “A Model of New Product Development: An Empirical Test,” Management Science, 36 (July), 867–883.