how do humans understand explanations from machine ... · how do humans understand explanations...
TRANSCRIPT
How do Humans Understand Explanations fromMachine Learning Systems?
An Evaluation of the Human-Interpretability ofExplanation
Menaka Narayanan*1, Emily Chen*1, Jeffrey He*1, Been Kim2, Sam Gershman1
and Finale Doshi-Velez1
1Harvard University2Google Brain
February 5, 2018
Abstract
Recent years have seen a boom in interest in machine learning systems that can provide ahuman-understandable rationale for their predictions or decisions. However, exactly what kindsof explanation are truly human-interpretable remains poorly understood. This work advances ourunderstanding of what makes explanations interpretable in the specific context of verification.Suppose we have a machine learning system that predicts X, and we provide rationale forthis prediction X. Given an input, an explanation, and an output, is the output consistent withthe input and the supposed rationale? Via a series of user-studies, we identify what kinds ofincreases in complexity have the greatest effect on the time it takes for humans to verify therationale, and which seem relatively insensitive.
1 IntroductionInterpretable machine learning systems provide not only decisions or predictions but also expla-nation for their outputs. Explanations can help increase trust and safety by identifying when therecommendation is reasonable when it is not. While interpretability has a long history in AI [Michie,1988], the relatively recent widespread adoption of machine learning systems in real, complexenvironments has lead to an increased attention to interpretable machine learning systems, withapplications including understanding notifications on mobile devices [Mehrotra et al., 2017, Wanget al., 2016], calculating stroke risk [Letham et al., 2015], and designing materials [Raccugliaet al., 2016]. Techniques for ascertaining the provenance of a prediction are also popular within the
1
arX
iv:1
802.
0068
2v1
[cs
.AI]
2 F
eb 2
018
machine learning community as ways for us to simply understand our increasingly complex models[Lei et al., 2016, Selvaraju et al., 2016, Adler et al., 2016].
The increased interest in interpretability has resulted in many forms of explanation beingproposed, ranging from classical approaches such as decision trees [Breiman et al., 1984] to inputgradients or other forms of (possibly smoothed) sensitivity analysis [Selvaraju et al., 2016, Ribeiroet al., 2016, Lei et al., 2016], generalized additive models [Caruana et al., 2015], procedures [Singhet al., 2016], falling rule lists [Wang and Rudin, 2015], exemplars [Kim et al., 2014, Frey and Dueck,2007] and decision sets [Lakkaraju et al., 2016]—to name a few. In all of these cases, there is aface-validity to the proposed form of explanation: if the explanation was not human-interpretable,clearly it would not have passed peer review.
That said, these works provide little guidance about when different kinds of explanation mightbe appropriate, and within a class of explanations—such as decision-trees or decision-sets—whatare the limitations of human reasoning. For example, it is hard to imagine that a human wouldfind a 5000-node decision tree as interpretable as 5-node decision tree, for any reasonable notionof interpretable. The reason the explanation is desired is also often left implicit. In Doshi-Velezand Kim [2017], we point to a growing need for the interpretable machine learning community toengage with the human factors and cognitive science of interpretability: we can spend enormousefforts optimizing all kinds of models and regularizers, but that effort is only worthwhile if thosemodels and regularizers actually solve the original human-centered task of providing explanation.Carefully controlled human-subject experiments provide an evidence-based approach to identifywhat kinds of regularizers we should be using.
In this work, we make modest but concrete strides toward this large goal of quantifying whatmakes explanation human-interpretable. We shall assume that there exists some explanation systemthat generates the explanation—for example, there exist a variety of approaches that use perturba-tions around a point of interest to produce a local decision boundary [Ribeiro et al., 2016, Singhet al., 2016]. Our question is: What kinds of explanation can humans most easily utilize? Below, wedescribe the kind of task we shall explore, as well as the form of the explanation.
Choice of Task The question of what kinds of explanation a human can utilize implies thepresence of a downstream task. The task may be intrinsic—relying on just the explanation alone—or extrinsic—relying on the explanation and other facts about the environment.1 Intrinsic tasksinclude problems such as verification—given an input, output, and explanation, can the human userverify that the output is consistent with the input and provided explanation?—and counterfactualreasoning—given an input, output, and explanation, can the human subject identify what inputchanges would result in a different output? In contrast, extrinsic tasks include goals such as safety—given the input, output, explanation, and observations of the world, does the explanation help thehuman user identify when the agent is going to make a mistake?—and trust—given the input,output, explanation, and observations of the world, does the explanation increase the human user’sconfidence in the agent? Evaluation on extrinsic tasks, while ultimately what we care about, requirecareful experimental design that ensures all subjects have similar knowledge and assumptions about
1As noted in Herman [2017], explanation can also be used to persuade rather than inform; we exclude that use-casehere.
2
the environment. One must also tease apart conflations between human perception of knowledgewith actual knowledge: for example, it may be possible to manipulate trust arbitrarily separatelyfrom prediction accuracy. Thus, evaluating extrinsic tasks is more challenging than intrinsic ones.
In this work, we will focus on the simplest intrinsic setting: verification. Given a specific input,explanation, and output, can we quickly determine whether the output is consistent with the inputand explanation? Such a setting may arise in consumer recommendation scenarios—for example,a salesperson may wish to ensure that a specific product recommendation is consistent with aconsumer’s preferences. Starting simple also provides an opportunity to explore aspects relevant tothe experimental design.
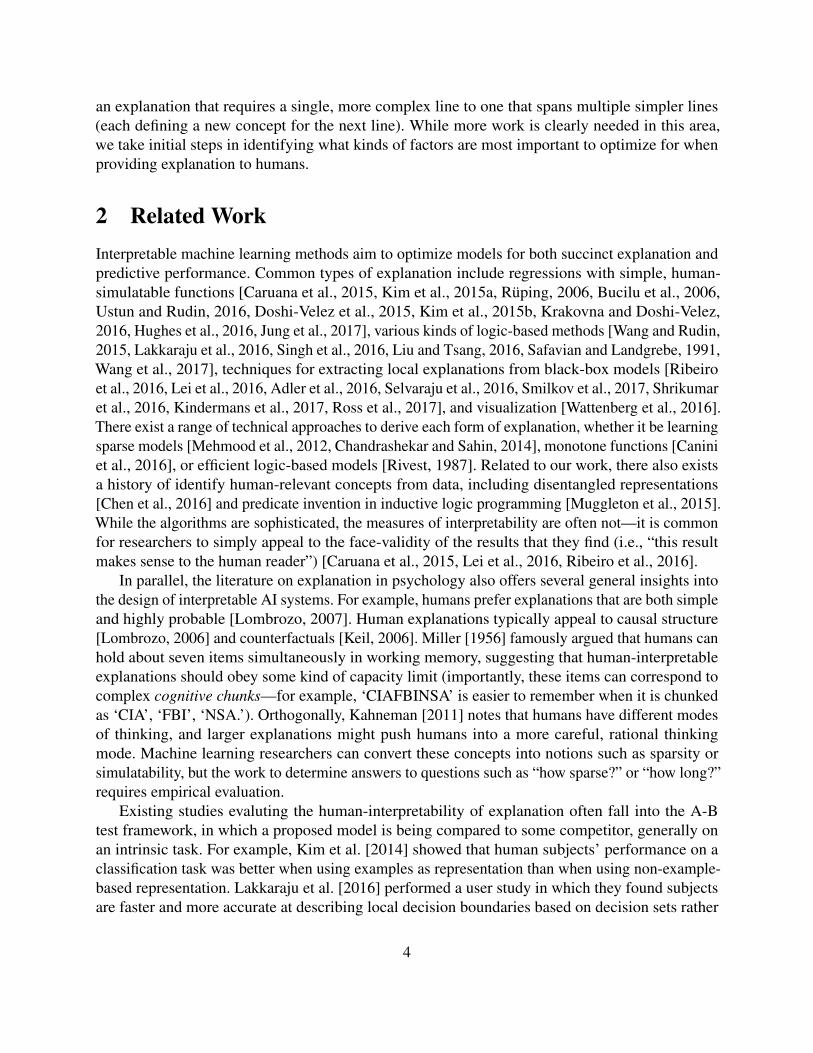
Choice of Explanation Form As mentioned above, there have been many forms of explanationproposed, ranging from decision trees to gradients of neural networks. In this work, we considerexplanations that are in the form of decision sets. Decision sets are a particular form of procedureconsisting of a collection of cases, each mapping some function of the inputs to a collection ofoutputs. An example of a decision set is given below
Figure 1: Example of a decision set explanation.
where each line contains a clause in disjunctive normal form (an or-of-ands) of the inputs, which, iftrue, provides a way to verify the output (also in disjunctive normal form). As argued in Lakkarajuet al. [2016], decision sets are relatively easy for humans to parse given a specific instance, becausethey can scan for the rule that applies and choose the accompanying output. Decision sets (alsoknown as rule sets) also enjoy a long history of optimization techniques, ranging from Frank andWitten [1998], Cohen [1995], Clark and Boswell [1991] to Lakkaraju et al. [2016].
However, we can also already see that there are many factors that could potentially make thedecision set more or less challenging to follow: in addition to the number of lines, there are ways inwhich terms interact in the disjunctions and conjunctions, and, more subtly, aspects such as howoften terms appear and whether terms represent intermediate concepts. Which of these factors aremost relevant when it comes to a human’s ability to process and utilize an explanation, and to whatextent? The answer to this question has important implications for the design of explanation systemsin interpretable machine learning, especially if we find that our explanation-processing ability isrelatively robust to variation in some factors but not others.
Contributions The core contribution of this work is to provide an empirical grounding for whatkinds of explanations humans can utilize. We find that while almost all increases in the complexityof an explanation result in longer response times, some types of complexity—such as the number oflines, or the number of new concepts introduced—have a much bigger effect than others—such asvariable repetition. We also find some unintuitive patterns, such as how participants seem to prefer
3
an explanation that requires a single, more complex line to one that spans multiple simpler lines(each defining a new concept for the next line). While more work is clearly needed in this area,we take initial steps in identifying what kinds of factors are most important to optimize for whenproviding explanation to humans.
2 Related WorkInterpretable machine learning methods aim to optimize models for both succinct explanation andpredictive performance. Common types of explanation include regressions with simple, human-simulatable functions [Caruana et al., 2015, Kim et al., 2015a, Ruping, 2006, Bucilu et al., 2006,Ustun and Rudin, 2016, Doshi-Velez et al., 2015, Kim et al., 2015b, Krakovna and Doshi-Velez,2016, Hughes et al., 2016, Jung et al., 2017], various kinds of logic-based methods [Wang and Rudin,2015, Lakkaraju et al., 2016, Singh et al., 2016, Liu and Tsang, 2016, Safavian and Landgrebe, 1991,Wang et al., 2017], techniques for extracting local explanations from black-box models [Ribeiroet al., 2016, Lei et al., 2016, Adler et al., 2016, Selvaraju et al., 2016, Smilkov et al., 2017, Shrikumaret al., 2016, Kindermans et al., 2017, Ross et al., 2017], and visualization [Wattenberg et al., 2016].There exist a range of technical approaches to derive each form of explanation, whether it be learningsparse models [Mehmood et al., 2012, Chandrashekar and Sahin, 2014], monotone functions [Caniniet al., 2016], or efficient logic-based models [Rivest, 1987]. Related to our work, there also existsa history of identify human-relevant concepts from data, including disentangled representations[Chen et al., 2016] and predicate invention in inductive logic programming [Muggleton et al., 2015].While the algorithms are sophisticated, the measures of interpretability are often not—it is commonfor researchers to simply appeal to the face-validity of the results that they find (i.e., “this resultmakes sense to the human reader”) [Caruana et al., 2015, Lei et al., 2016, Ribeiro et al., 2016].
In parallel, the literature on explanation in psychology also offers several general insights intothe design of interpretable AI systems. For example, humans prefer explanations that are both simpleand highly probable [Lombrozo, 2007]. Human explanations typically appeal to causal structure[Lombrozo, 2006] and counterfactuals [Keil, 2006]. Miller [1956] famously argued that humans canhold about seven items simultaneously in working memory, suggesting that human-interpretableexplanations should obey some kind of capacity limit (importantly, these items can correspond tocomplex cognitive chunks—for example, ‘CIAFBINSA’ is easier to remember when it is chunkedas ‘CIA’, ‘FBI’, ‘NSA.’). Orthogonally, Kahneman [2011] notes that humans have different modesof thinking, and larger explanations might push humans into a more careful, rational thinkingmode. Machine learning researchers can convert these concepts into notions such as sparsity orsimulatability, but the work to determine answers to questions such as “how sparse?” or “how long?”requires empirical evaluation.
Existing studies evaluting the human-interpretability of explanation often fall into the A-Btest framework, in which a proposed model is being compared to some competitor, generally onan intrinsic task. For example, Kim et al. [2014] showed that human subjects’ performance on aclassification task was better when using examples as representation than when using non-example-based representation. Lakkaraju et al. [2016] performed a user study in which they found subjectsare faster and more accurate at describing local decision boundaries based on decision sets rather
4
than rule lists. Subramanian et al. [1992] found that users prefer decision trees to tables in games,whereas Huysmans et al. [2011] found users prefer, and are more accurate, with decision tablesrather than other classifiers in a credit scoring domain. Hayete and Bienkowska [2004] found apreference for non-oblique splits in decision trees (see Freitas [2014] for more detailed survey).These works provide quantitative evaluations of the human-interpretability of explanation, but rarelyidentify what properties are most essential for what contexts—which is critical for generalization.
Specific application areas have also evaluated the desired properties of an explanation withinthe context of the application. For example, Tintarev and Masthoff [2015] provides a survey inthe context of recommendation systems, noting differences between the kind of explanations thatmanipulate trust [Cosley et al., 2003] and the kind that increase the odds of a good decision [Bilgicand Mooney, 2005]. In many cases, these studies are looking at whether the explanation has an effect,sometimes also considering a few different kinds of explanation (actions of similar customers, etc.).Horsky et al. [2012] describe how presenting the right clinical data alongside a decision supportrecommendation can help with adoption and trust. Bussone et al. [2015] found that overly detailedexplanations from clinical decision support systems enhance trust but also create over-reliance;short or absent explanations prevent over-reliance but decrease trust. These studies span a variety ofextrinsic tasks, and again given the specificity of each explanation type, identifying generalizableproperties is challenging.
Closer to the objectives of the proposed work, Kulesza et al. [2013] performed a qualitative studyin which they varied the soundness (nothing but the truth) and the completeness (the whole truth) ofan explanation in a recommendation system setting. They found completeness was important forparticipants to build accurate mental models of the system. Allahyari and Lavesson [2011], Elomaa[2017] also find that larger models can sometimes be more interpretable. Schmid et al. [2016] findthat human-recognizable intermediate predicates in inductive knowledge programs can sometimesimprove simulation time. Poursabzi-Sangdeh et al. [2017] manipulate the size and transparencyof an explanation and find that longer explanations and black-box models are harder to simulateaccurately (even given many instances) on a real-world application predicting housing prices. Ourwork fits into this category of empirical study of explanation evaluation; we perform controlledstudies on a pair of synthetic application to assess the effect of a large set of explanation parameters.
3 MethodsOur main research question is to determine what properties of decision sets are most relevant forhuman users to be able to utilize the explanations for verification. In order to carefully controlvarious properties of the explanation and the context, in the following we shall present humansubjects with explanations that could have been machine-generated, but were in fact generated byus. Before describing our experiment, we emphasize that while our explanations are not actuallymachine-generated, our findings provide suggestions to designers of interpretable machine learningsystems about what parameters affect the usability of an explanation, and which should be optimizedwhen producing explanations.
5
3.1 Factors VariedEven within decision sets, there are a large number of ways in which the explanations couldbe varied. Following initial pilot studies (see Appendix), we chose to focus on the three mainkinds of variation (described below). We also tested on two different domains—a faux reciperecommendation domain and a faux clinical decision support domain—to see if the context wouldresult in different explanation processing while other factors were held constant.
Explanation Variation We explored the following sources of explanation variation:
• V1: Explanation Size. We varied the size of the explanation across two dimensions: the totalnumber of lines in the decision set, and the maximum number of terms within the outputclause. The first corresponds to increasing the vertical size of the explanation—the number ofcases—while the second corresponds to increasing the horizontal size of the explanation—thecomplexity of each case. We focused on output clauses because they were harder to parse:input clauses could be quickly scanned for setting-related terms, but output clauses had tobe read through and processed completely to verify an explanation. We hypothesized thatincreasing the size of the explanation across either dimension would increase the time requiredto perform the verification task.
• V2: Creating New Types of Cognitive Chunks. In Figure 2, the first line of the decisionset introduces a new cognitive chunk: if the alien is ‘checking the news’ or ‘coughing,’ thatcorresponds to a new concept ‘windy.’2 On one hand, creating new cognitive chunks can makean explanation more succinct. On the other hand, the human must now process an additionalidea. We varied two aspects related to new cognitive chunks. First, we simply adjusted thenumber of new cognitive chunks present in the explanation. All of the cognitive chunks werenecessary for verification, to ensure that the participant had to traverse all of concepts insteadof skimming for the relevant one.
Second, we tested whether it was more helpful to introduce a new cognitive chunk or leaveit implicit: for example, instead of introducing a concept ‘windy’ for ‘checking the news orcoughing,’ (explicit) we could simply include ‘checking the news or coughing’ whereverwindy appeared (implicit). We hypothesized that adding cognitive chunks would increase thetime required to process an explanation, because the user would have to consider more linesin the decision list to come to a conclusion. However, we hypothesized that it would still bemore time-efficient to introduce the new chunk rather than having long clauses that implicitlycontained the meaning of the chunk.
• V3: Repeated Terms in an Explanation. Another factor that might affect humans’ abilityto process an explanation is how often terms are used. For example, if input conditions in thedecision list have little overlap, then it may be faster to find the appropriate one because thereare fewer relevant cases to consider. We hypothesized that if an input condition appeared inseveral lines of the explanation, this would increase the time it took to search for the correct
2One can imagine this being akin to giving names to nodes in a complex model, such as a neural network.
6
rule in the explanation. (Repeated terms was also a factor used by Lakkaraju et al. [2016] tomeasure interpretability.)
Domain Variation Below we describe the two contexts, or domains, that we used in our experi-ments: recipe recommendations (familiar) and clinical decision support (unfamiliar). The domainswere designed to feel very different but such that the verification tasks could be made to exactlyparallel each other, allowing us to investigate the effect of the domain context in situations whenthe form of the explanation was exactly the same. We hypothesized that these trends would beconsistent in both the recipe and clinical domains.
Alien Recipes. In the first domain, study participants were told that the machine learning systemhad studied a group of aliens and determined each of their individual food preferences in varioussettings (e.g., snowing, weekend). Each task involved presenting participants with the setting(the input), the systems’s description of the current alien’s preferences (the explanation), and aset of recommended ingredients (the output). The user was then asked whether the ingredientsrecommendation was a good one. This scenario represents a setting in which customers may wishto know why a certain product or products were recommended to them. Aliens were introducedin order to avoid the subject’s prior knowledge or preferences about settings and food affectingtheir responses; each task involved a different alien so that each explanation could be unique. Allnon-literals (e.g. what ingredients were spices) were defined in a dictionary so that all participantswould have the same cognitive chunks.
Alien Medicine In the second domain, study participants were told that the machine learningsystem had studied a group of aliens and determined personalized treatment strategies for varioussymptoms (e.g. sore throat). Each task involved presenting participants with the symptoms (theinput), the system’s description of the alien’s personalized treatment strategy (the explanation), anda set of recommended drugs (the output). The user was then asked whether the drugs recommendedwere appropriate. This scenario closely matches a clinical decision support setting in which a systemmight suggest a treatment given a patient’s symptoms, and the clinician may wish to know why thesystem chose a particular treatment.
As before, aliens were chosen to avoid the subject’s prior medical knowledge from affectingtheir responses; each task involved personalized medicine so that each explanation could be unique.We chose drug names that corresponded with the first letter of the illness (e.g. antibiotic medicationswere Aerove, Adenon and Athoxin) so as to replicate the level of ease and familiarity of food names.Again, all drug names and categories were provided in a dictionary so that participants would havethe same cognitive chunks.
In our experiments, we maintained an exact correspondence between inputs (setting vs. symp-toms), outputs (foods vs. drugs), categories (food categories vs. drug categories), and the formsof the explanation. These parallels allowed us to test whether changing the domain from a rel-atively familiar, low-risk product recommendation setting to a relatively unfamiliar, higher-riskdecision-making setting affected how subjects utilized the explanations for verification.
7
3.2 Experimental Design and InterfaceThe three kinds of variation and two domains resulted in six total experiments. In the recipe domain,we held the list of ingredients, food categories, and possible input conditions constant. Similarly, inthe clinical domain, we held the list of symptoms, medicine categories, and possible input conditionsconstant. The levels were as follows:
• Length of the explanation (V1). We manipulated the length of the explanation (varyingbetween 2, 6, and 10 lines) and the length of the output clause (varying between 2 and 5terms). Each combination was tested twice within a experiment, for a total of 12 questions.
• Introducing new concepts (V2): We manipulated the number of cognitive chunks introduced(varying from 1 to 5), and whether they were embedded into the explanation or abstracted outinto new cognitive chunks. Each combination was tested once within a experiment, for a totalof 10 questions.
• Repeated terms (V3): We manipulated the number of times the input conditions appearedin the explanation (varying from 1 to 5) and held the number of lines and length of clausesconstant. Each combination was tested twice within a experiment, for a total of 10 questions.
The outputs were consistent with the explanation and the input 50% of the time, so subjects couldnot simply learn that the outputs were always (in)consistent.
Participants were recruited via Amazon Mechanical Turk. Before starting the experiment, theywere given a tutorial on the verification task and the interface. Then they were given a set ofthree practice questions. Following the practice questions, they started the core questions for eachexperiment. They were told that their primary goal was accuracy, and their secondary goal was speed.While the questions were the same for all participants, the order of the questions was randomizedfor every participant. Each participant only participated in one of the experiments. For example, oneparticipant might have completed a 12-question experiment on the effect of varying explanationlength in the recipe domain, while another would have completed 10-question experiment on theeffect of repeated terms in the clinical domain. Experiments were kept short to avoid subjects gettingtired.
Metrics We recorded three metrics: response time, accuracy, and subjective satisfaction. Responsetime was measured as the number of seconds from when the task was displayed until the subjecthit the submit button on the interface. Accuracy was measured if the subject correctly identifiedwhether the output was consistent with the input and the explanation (a radio button). After eachsubmitting their answer for each question, the participant was also asked to subjectively rate thequality of the explanation on a scale from one to ten.
8
(a) Recipe Domain
(b) Clinical Domain
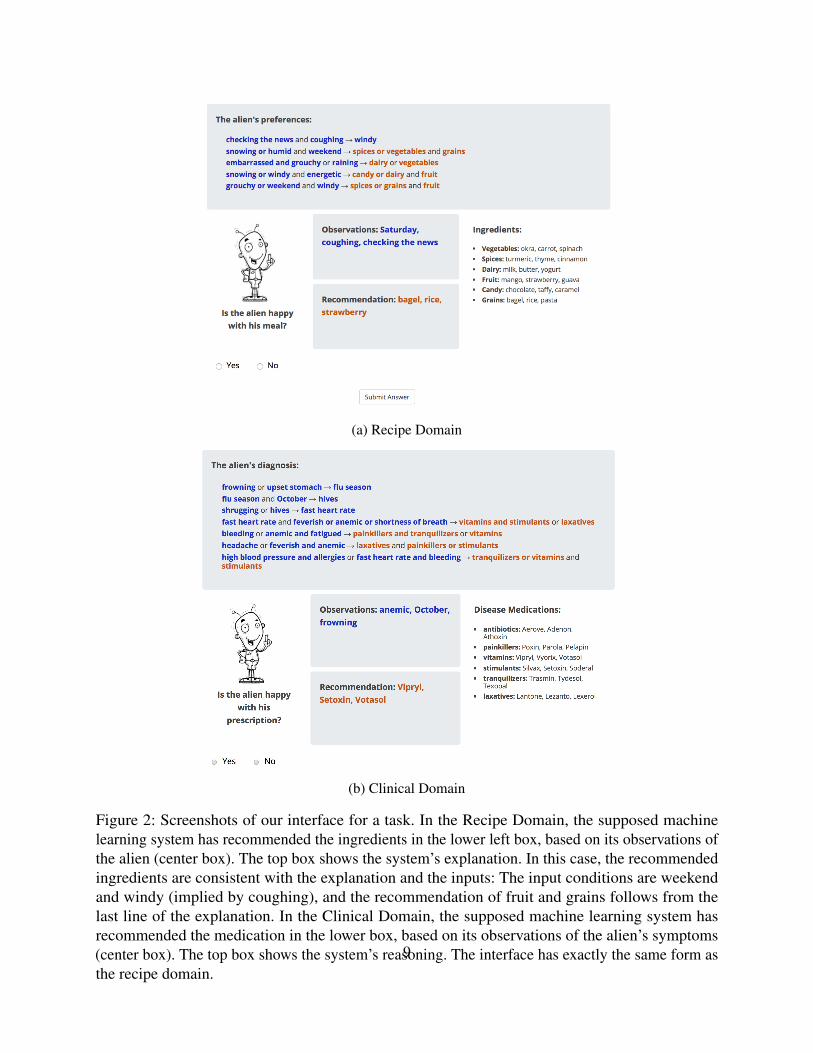
Figure 2: Screenshots of our interface for a task. In the Recipe Domain, the supposed machinelearning system has recommended the ingredients in the lower left box, based on its observations ofthe alien (center box). The top box shows the system’s explanation. In this case, the recommendedingredients are consistent with the explanation and the inputs: The input conditions are weekendand windy (implied by coughing), and the recommendation of fruit and grains follows from thelast line of the explanation. In the Clinical Domain, the supposed machine learning system hasrecommended the medication in the lower box, based on its observations of the alien’s symptoms(center box). The top box shows the system’s reasoning. The interface has exactly the same form asthe recipe domain.
9

Table 1: Participant Demographics. There were no patients over 69 years old. 4.2% of participantsreported “other” for their education level. The rates of participants from Australia, Europe, LatinAmerica, and South America were all less than 0.5%. (All participants were included in the analyses,but we do not list specific proportions for them for brevity.)
Feature Category : ProportionAge 18-34 : 59.0% 35-50 : 35.1% 51-69 : 5.9%Education High School : 28.5% Bachelor’s : 52.4% Beyond Bachelor’s: 14.9%Gender Male : 58.8% Female : 41.2%Region US/Canada : 87.1% Asia : 11.4%
Experimental Interface Figure 2 shows our interfaces for the Recipe and Clinical domains. Theobservations section (middle) refers to the inputs into the algorithm. The recommendation sectionrefers to the output of the algorithm. The preferences section (top) contains the explanation—thereasoning that the supposed machine learning system used to suggest the output (i.e., recommenda-tion) given the input, presented as a procedure in the form of a decision set. Finally, the ingredientssection in the Recipe domain (and the disease medications section in the Clinical domain) containeda dictionary of cognitive chunks relevant to the experiment (for example, the fact that bagels, rice,and pasta are all grains). Including this list explicitly allowed us to control for the fact that somehuman subjects may be more familiar with various concepts than others.
The choice of location for these elements was chosen based on pilot studies—while an orderingof input, explanation, output might make more sense for an AI expert, we found that presenting theinformation in the format of Figure 2 seemed to be easier for subjects to follow in our preliminaryexplorations. We also found that presenting the decision set as a decision set seemed easier to followthan converting it into paragraphs. Finally, we colored the input conditions in blue and outputs inorange within the explanation. We found that this highlighting system made it easier for participantsto parse the explanations for input conditions.
4 ResultsWe recruited 100 subjects for each our six experiments, for a total of 600 subjects all together.Table 1 summarizes the demographics of our subjects across the experiments. Most participantswere from the US or Canada (with the remainder being almost exclusively from Asia) and were lessthan 50 years old. A majority had a Bachelor’s degree. There were somewhat more male participantsthan female. We note that US and Canadian participants with moderate to high education dominatethis survey, and results may be different for people from different cultures and backgrounds.
All participants completed the full task (each survey was only 10-12 questions). In the analysisbelow, however, we exclude participants who did not get all three initial practice questions or all twoof the additional practice questions correct. While this may have the effect of artificially increasingthe accuracy rates overall—we are only including participants who could already perform the taskto a reasonable extent—this criterion helped filter the substantial proportion of participants who
10
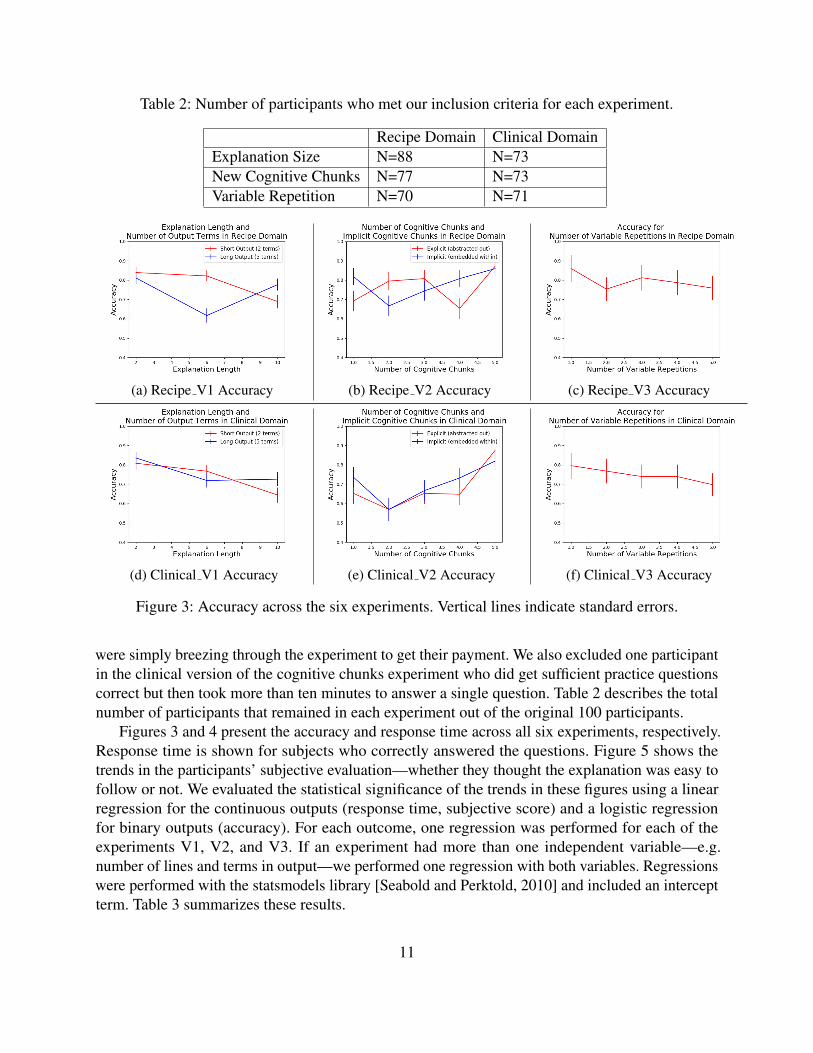
Table 2: Number of participants who met our inclusion criteria for each experiment.
Recipe Domain Clinical DomainExplanation Size N=88 N=73New Cognitive Chunks N=77 N=73Variable Repetition N=70 N=71
(a) Recipe V1 Accuracy (b) Recipe V2 Accuracy (c) Recipe V3 Accuracy
(d) Clinical V1 Accuracy (e) Clinical V2 Accuracy (f) Clinical V3 Accuracy
Figure 3: Accuracy across the six experiments. Vertical lines indicate standard errors.
were simply breezing through the experiment to get their payment. We also excluded one participantin the clinical version of the cognitive chunks experiment who did get sufficient practice questionscorrect but then took more than ten minutes to answer a single question. Table 2 describes the totalnumber of participants that remained in each experiment out of the original 100 participants.
Figures 3 and 4 present the accuracy and response time across all six experiments, respectively.Response time is shown for subjects who correctly answered the questions. Figure 5 shows thetrends in the participants’ subjective evaluation—whether they thought the explanation was easy tofollow or not. We evaluated the statistical significance of the trends in these figures using a linearregression for the continuous outputs (response time, subjective score) and a logistic regressionfor binary outputs (accuracy). For each outcome, one regression was performed for each of theexperiments V1, V2, and V3. If an experiment had more than one independent variable—e.g.number of lines and terms in output—we performed one regression with both variables. Regressionswere performed with the statsmodels library [Seabold and Perktold, 2010] and included an interceptterm. Table 3 summarizes these results.
11
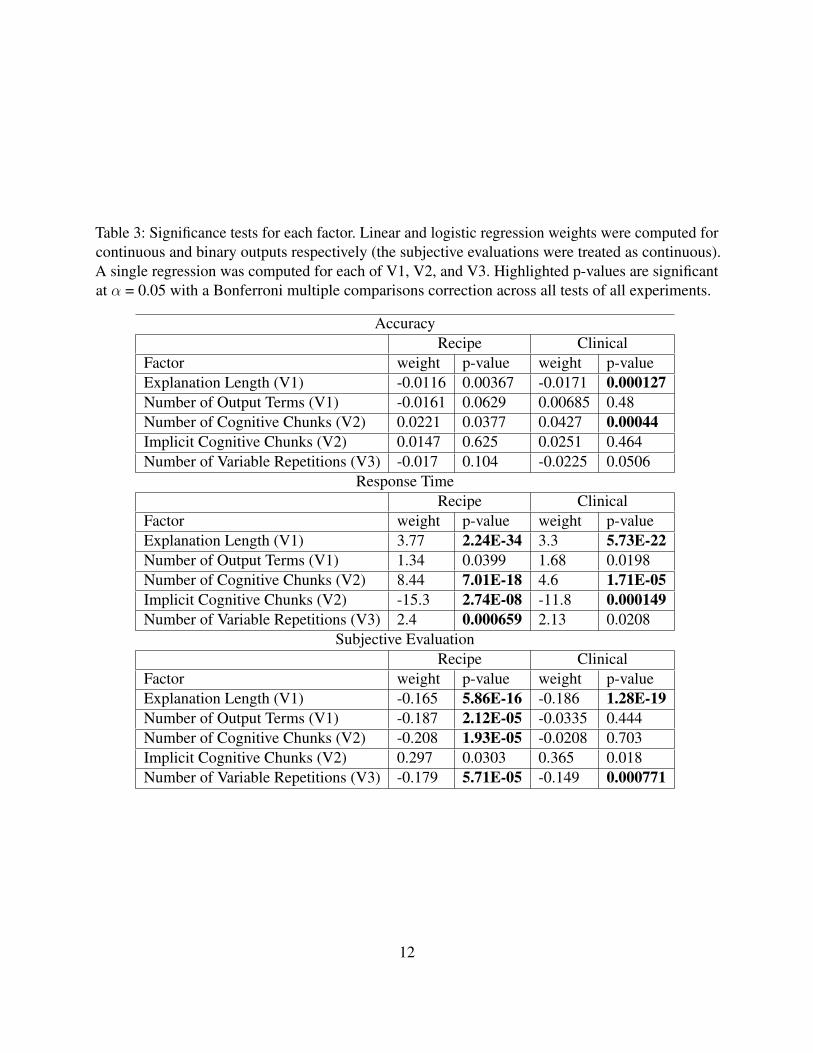
Table 3: Significance tests for each factor. Linear and logistic regression weights were computed forcontinuous and binary outputs respectively (the subjective evaluations were treated as continuous).A single regression was computed for each of V1, V2, and V3. Highlighted p-values are significantat α = 0.05 with a Bonferroni multiple comparisons correction across all tests of all experiments.
AccuracyRecipe Clinical
Factor weight p-value weight p-valueExplanation Length (V1) -0.0116 0.00367 -0.0171 0.000127Number of Output Terms (V1) -0.0161 0.0629 0.00685 0.48Number of Cognitive Chunks (V2) 0.0221 0.0377 0.0427 0.00044Implicit Cognitive Chunks (V2) 0.0147 0.625 0.0251 0.464Number of Variable Repetitions (V3) -0.017 0.104 -0.0225 0.0506
Response TimeRecipe Clinical
Factor weight p-value weight p-valueExplanation Length (V1) 3.77 2.24E-34 3.3 5.73E-22Number of Output Terms (V1) 1.34 0.0399 1.68 0.0198Number of Cognitive Chunks (V2) 8.44 7.01E-18 4.6 1.71E-05Implicit Cognitive Chunks (V2) -15.3 2.74E-08 -11.8 0.000149Number of Variable Repetitions (V3) 2.4 0.000659 2.13 0.0208
Subjective EvaluationRecipe Clinical
Factor weight p-value weight p-valueExplanation Length (V1) -0.165 5.86E-16 -0.186 1.28E-19Number of Output Terms (V1) -0.187 2.12E-05 -0.0335 0.444Number of Cognitive Chunks (V2) -0.208 1.93E-05 -0.0208 0.703Implicit Cognitive Chunks (V2) 0.297 0.0303 0.365 0.018Number of Variable Repetitions (V3) -0.179 5.71E-05 -0.149 0.000771
12
(a) Recipe V1 Time (b) Recipe V2 Time (c) Recipe V3 Time
(d) Clinical V1 Time (e) Clinical V2 Time (f) Clinical V3 Time
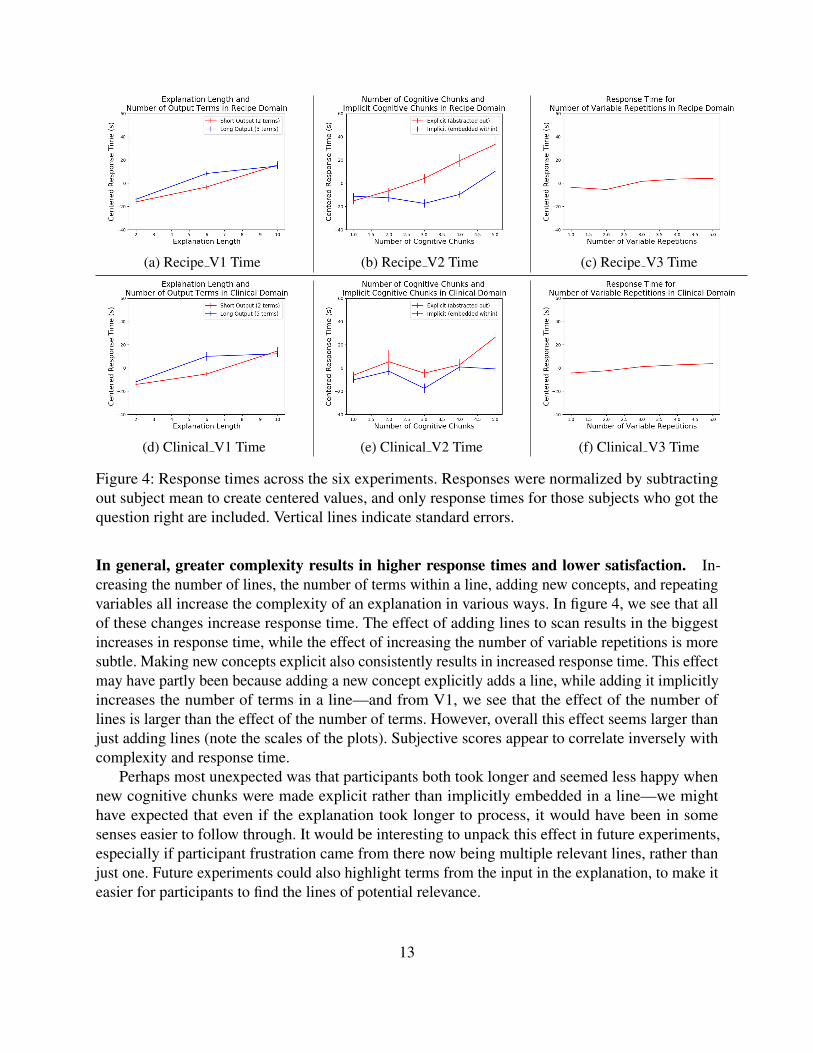
Figure 4: Response times across the six experiments. Responses were normalized by subtractingout subject mean to create centered values, and only response times for those subjects who got thequestion right are included. Vertical lines indicate standard errors.
In general, greater complexity results in higher response times and lower satisfaction. In-creasing the number of lines, the number of terms within a line, adding new concepts, and repeatingvariables all increase the complexity of an explanation in various ways. In figure 4, we see that allof these changes increase response time. The effect of adding lines to scan results in the biggestincreases in response time, while the effect of increasing the number of variable repetitions is moresubtle. Making new concepts explicit also consistently results in increased response time. This effectmay have partly been because adding a new concept explicitly adds a line, while adding it implicitlyincreases the number of terms in a line—and from V1, we see that the effect of the number oflines is larger than the effect of the number of terms. However, overall this effect seems larger thanjust adding lines (note the scales of the plots). Subjective scores appear to correlate inversely withcomplexity and response time.
Perhaps most unexpected was that participants both took longer and seemed less happy whennew cognitive chunks were made explicit rather than implicitly embedded in a line—we mighthave expected that even if the explanation took longer to process, it would have been in somesenses easier to follow through. It would be interesting to unpack this effect in future experiments,especially if participant frustration came from there now being multiple relevant lines, rather thanjust one. Future experiments could also highlight terms from the input in the explanation, to make iteasier for participants to find the lines of potential relevance.
13
(a) Recipe V1 Evaluation (b) Recipe V2 Evaluation (c) Recipe V3 Evaluation
(d) Clinical V1 Evaluation (e) Clinical V2 Evaluation (f) Clinical V3 Evaluation
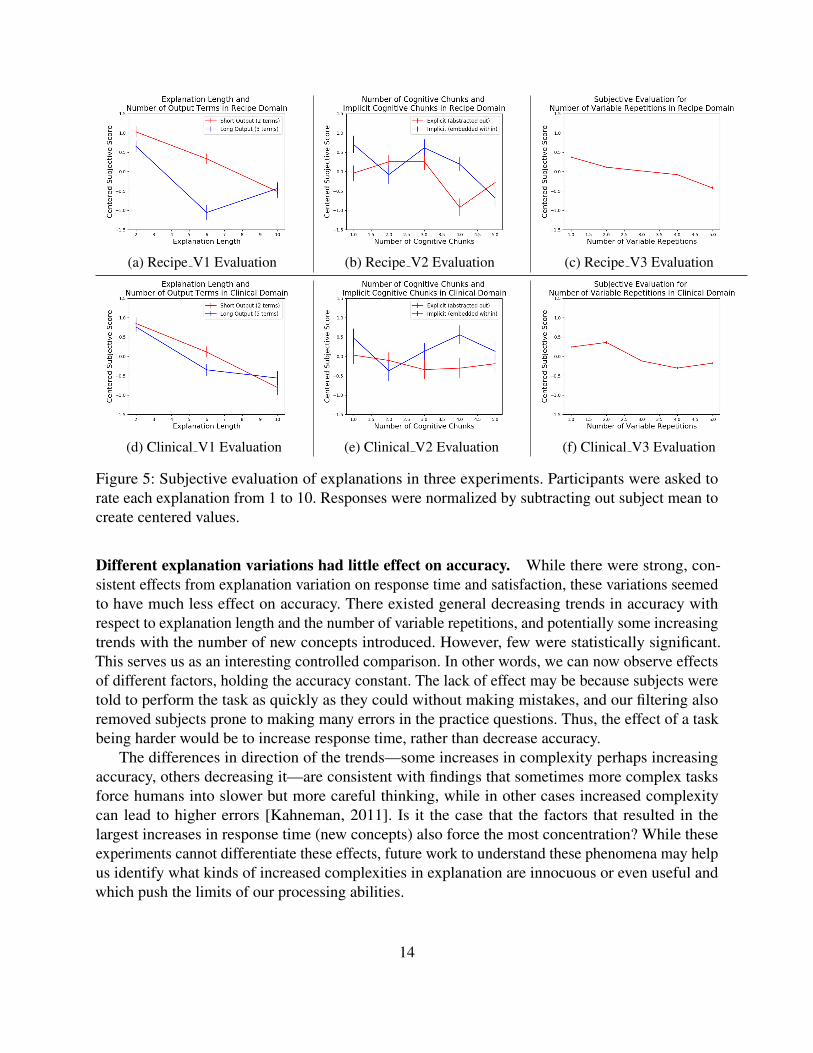
Figure 5: Subjective evaluation of explanations in three experiments. Participants were asked torate each explanation from 1 to 10. Responses were normalized by subtracting out subject mean tocreate centered values.
Different explanation variations had little effect on accuracy. While there were strong, con-sistent effects from explanation variation on response time and satisfaction, these variations seemedto have much less effect on accuracy. There existed general decreasing trends in accuracy withrespect to explanation length and the number of variable repetitions, and potentially some increasingtrends with the number of new concepts introduced. However, few were statistically significant.This serves us as an interesting controlled comparison. In other words, we can now observe effectsof different factors, holding the accuracy constant. The lack of effect may be because subjects weretold to perform the task as quickly as they could without making mistakes, and our filtering alsoremoved subjects prone to making many errors in the practice questions. Thus, the effect of a taskbeing harder would be to increase response time, rather than decrease accuracy.
The differences in direction of the trends—some increases in complexity perhaps increasingaccuracy, others decreasing it—are consistent with findings that sometimes more complex tasksforce humans into slower but more careful thinking, while in other cases increased complexitycan lead to higher errors [Kahneman, 2011]. Is it the case that the factors that resulted in thelargest increases in response time (new concepts) also force the most concentration? While theseexperiments cannot differentiate these effects, future work to understand these phenomena may helpus identify what kinds of increased complexities in explanation are innocuous or even useful andwhich push the limits of our processing abilities.
14
Trends are consistent across recipe and clinical domains In all experiments, the general trendsin the metrics are consistent across both the recipe and clinical domains. Sometimes an effect ismuch weaker or unclear, but never is an effect clearly reversed. We believe this bodes well for therebeing a set of general principles for guiding explanation design, just as there exist design principlesfor interfaces and human-computer interaction. However, one small pattern can be noted in Figure5, which shows lower satisfaction for the clinical domain than the recipe domain. This could be dueto the fact that people felt more agitated about performing poorly in the medical domain than theclinical domain.
5 Discussion and ConclusionIdentifying how different factors affect a human’s ability to utilize explanation is an essential piecefor creating interpretable machine learning systems—we need to know what to optimize. Whatfactors have the largest effect, and what kind of effect? What factors have relatively little effect?Such knowledge can help us expand to faithfulness of the explanation to what it is describing withminimal sacrifices in human ability to process the explanation.
In this work, we investigated how the ability of humans to perform a simple task—verifyingwhether an output is consistent with an explanation and input—varies as a function of explanationsize, new types of cognitive chunks and repeated terms in the explanation. We tested across twodomains, carefully controlling for everything but the domain.
We summarized some intuitive and some counter intuitive discoveries—as any increase inexplanation complexity increases response time and decreases subjective satisfaction with theexplanation—some patterns were not so obvious. We had not expected that embedding a newconcept would have been faster to process and more appealing than creating a new definition. Wealso found that new concepts and the number of lines increase response time more than variablerepetition or longer lines. It would be interesting to verify the magnitude of these sensitivitieson other tasks, such as forward simulation or counterfactual reasoning, to start building a morecomplete picture of what we should be optimizing our explanations for.
More broadly, there are many interesting directions regarding what kinds of explanation are bestin what contexts. Are there universals that make for interpretable procedures, whether they be cast asdecision sets, decision trees, or more general pseudocode; whether the task is verification, forwardsimulation, or counterfactual reasoning? Do these universals also carry over to regression settings?Or does each scenario have its own set of requirements? When the dimensionality of an input getsvery large, do trade-offs for defining intermediate new concepts change? A better understanding ofthese questions is critical to design systems that can provide rationale to human users.
Acknowledgements The authors acknowledge PAIR at Google and the Harvard Berkman KleinCenter for their support.
15

ReferencesPhilip Adler, Casey Falk, Sorelle A Friedler, Gabriel Rybeck, Carlos Scheidegger, Brandon Smith,
and Suresh Venkatasubramanian. Auditing black-box models for indirect influence. In DataMining (ICDM), 2016 IEEE 16th International Conference on, pages 1–10. IEEE, 2016.
Hiva Allahyari and Niklas Lavesson. User-oriented assessment of classification model understand-ability. In 11th scandinavian conference on Artificial intelligence. IOS Press, 2011.
Mustafa Bilgic and Raymond J Mooney. Explaining recommendations: Satisfaction vs. promotion.In Beyond Personalization Workshop, IUI, volume 5, page 153, 2005.
Leo Breiman, Jerome Friedman, Charles J Stone, and Richard A Olshen. Classification andregression trees. CRC press, 1984.
Cristian Bucilu, Rich Caruana, and Alexandru Niculescu-Mizil. Model compression. In Proceedingsof the 12th ACM SIGKDD international conference on Knowledge discovery and data mining,pages 535–541. ACM, 2006.
Adrian Bussone, Simone Stumpf, and Dympna O’Sullivan. The role of explanations on trustand reliance in clinical decision support systems. In Healthcare Informatics (ICHI), 2015International Conference on, pages 160–169. IEEE, 2015.
Kevin Canini, Andy Cotter, MR Gupta, M Milani Fard, and Jan Pfeifer. Fast and flexible monotonicfunctions with ensembles of lattices. Advances in Neural Information Processing Systems (NIPS),2016.
Rich Caruana, Yin Lou, Johannes Gehrke, Paul Koch, Marc Sturm, and Noemie Elhadad. Intelligiblemodels for healthcare: Predicting pneumonia risk and hospital 30-day readmission. In Proceedingsof the 21th ACM SIGKDD International Conference on Knowledge Discovery and Data Mining,pages 1721–1730. ACM, 2015.
Girish Chandrashekar and Ferat Sahin. A survey on feature selection methods. Computers &Electrical Engineering, 40(1):16–28, 2014.
Xi Chen, Yan Duan, Rein Houthooft, John Schulman, Ilya Sutskever, and Pieter Abbeel. Infogan:Interpretable representation learning by information maximizing generative adversarial nets,2016.
Peter Clark and Robin Boswell. Rule induction with cn2: Some recent improvements. In EuropeanWorking Session on Learning, pages 151–163. Springer, 1991.
William W Cohen. Fast effective rule induction. In Proceedings of the twelfth internationalconference on machine learning, pages 115–123, 1995.
16
Dan Cosley, Shyong K Lam, Istvan Albert, Joseph A Konstan, and John Riedl. Is seeing believing?:how recommender system interfaces affect users’ opinions. In Proceedings of the SIGCHIconference on Human factors in computing systems, pages 585–592. ACM, 2003.
Finale Doshi-Velez and Been Kim. A roadmap for a rigorous science of interpretability. arXivpreprint arXiv:1702.08608, 2017.
Finale Doshi-Velez, Byron Wallace, and Ryan Adams. Graph-sparse lda: a topic model withstructured sparsity. Association for the Advancement of Artificial Intelligence, 2015.
Tapio Elomaa. In defense of c4. 5: Notes on learning one-level decision trees. ML-94, 254:62, 2017.
Eibe Frank and Ian H Witten. Generating accurate rule sets without global optimization. 1998.
Alex A Freitas. Comprehensible classification models: a position paper. ACM SIGKDD explorationsnewsletter, 15(1):1–10, 2014.
Brendan J Frey and Delbert Dueck. Clustering by passing messages between data points. science,315(5814):972–976, 2007.
Boris Hayete and Jadwiga R Bienkowska. Gotrees: Predicting go associations from proteins.Biocomputing 2005, page 127, 2004.
Bernease Herman. The promise and peril of human evaluation for model interpretability. arXivpreprint arXiv:1711.07414, 2017.
Jan Horsky, Gordon D Schiff, Douglas Johnston, Lauren Mercincavage, Douglas Bell, and BlackfordMiddleton. Interface design principles for usable decision support: a targeted review of bestpractices for clinical prescribing interventions. Journal of biomedical informatics, 45(6):1202–1216, 2012.
Michael C Hughes, Huseyin Melih Elibol, Thomas McCoy, Roy Perlis, and Finale Doshi-Velez.Supervised topic models for clinical interpretability. arXiv preprint arXiv:1612.01678, 2016.
J. Huysmans, K. Dejaeger, C. Mues, J. Vanthienen, and B. Baesens. An empirical evaluation of thecomprehensibility of decision table, tree and rule based predictive models. DSS, 2011.
Jongbin Jung, Connor Concannon, Ravi Shroff, Sharad Goel, and Daniel G Goldstein. Simple rulesfor complex decisions. 2017.
Daniel Kahneman. Thinking, fast and slow. Macmillan, 2011.
Frank Keil. Explanation and understanding. Annu. Rev. Psychol., 2006.
B. Kim, C. Rudin, and J.A. Shah. The Bayesian Case Model: A generative approach for case-basedreasoning and prototype classification. In NIPS, 2014.
17
Been Kim, Elena Glassman, Brittney Johnson, and Julie Shah. iBCM: Interactive bayesian casemodel empowering humans via intuitive interaction. 2015a.
Been Kim, Julie Shah, and Finale Doshi-Velez. Mind the gap: A generative approach to interpretablefeature selection and extraction. In Advances in Neural Information Processing Systems, 2015b.
Pieter-Jan Kindermans, Kristof T Schutt, Maximilian Alber, Klaus-Robert Muller, and Sven Dahne.Patternnet and patternlrp–improving the interpretability of neural networks. arXiv preprintarXiv:1705.05598, 2017.
Viktoriya Krakovna and Finale Doshi-Velez. Increasing the interpretability of recurrent neuralnetworks using hidden markov models. arXiv preprint arXiv:1606.05320, 2016.
Todd Kulesza, Simone Stumpf, Margaret Burnett, Sherry Yang, Irwin Kwan, and Weng-Keen Wong.Too much, too little, or just right? ways explanations impact end users’ mental models. In VisualLanguages and Human-Centric Computing (VL/HCC), 2013 IEEE Symposium on, pages 3–10.IEEE, 2013.
Himabindu Lakkaraju, Stephen H Bach, and Jure Leskovec. Interpretable decision sets: A jointframework for description and prediction. In Proceedings of the 22nd ACM SIGKDD InternationalConference on Knowledge Discovery and Data Mining, pages 1675–1684. ACM, 2016.
Tao Lei, Regina Barzilay, and Tommi Jaakkola. Rationalizing neural predictions. arXiv preprintarXiv:1606.04155, 2016.
Benjamin Letham, Cynthia Rudin, Tyler H McCormick, David Madigan, et al. Interpretableclassifiers using rules and bayesian analysis: Building a better stroke prediction model. TheAnnals of Applied Statistics, 9(3):1350–1371, 2015.
Weiwei Liu and Ivor W Tsang. Sparse perceptron decision tree for millions of dimensions. In AAAI,pages 1881–1887, 2016.
Tania Lombrozo. The structure and function of explanations. Trends in cognitive sciences, 10(10):464–470, 2006.
Tania Lombrozo. Simplicity and probability in causal explanation. Cognitive psychology, 55(3):232–257, 2007.
Tahir Mehmood, Kristian Hovde Liland, Lars Snipen, and Solve Sæbø. A review of variableselection methods in partial least squares regression. Chemometrics and Intelligent LaboratorySystems, 118:62–69, 2012.
Abhinav Mehrotra, Robert Hendley, and Mirco Musolesi. Interpretable machine learning formobile notification management: An overview of prefminer. GetMobile: Mobile Computing andCommunications, 21(2):35–38, 2017.
18

Donald Michie. Machine learning in the next five years. In Proceedings of the 3rd EuropeanConference on European Working Session on Learning, pages 107–122. Pitman Publishing, 1988.
George A Miller. The magical number seven, plus or minus two: some limits on our capacity forprocessing information. Psychological review, 63(2):81, 1956.
Stephen H Muggleton, Dianhuan Lin, and Alireza Tamaddoni-Nezhad. Meta-interpretive learningof higher-order dyadic datalog: Predicate invention revisited. Machine Learning, 100(1):49–73,2015.
Forough Poursabzi-Sangdeh, Daniel G. Goldstein, Jake M. Hofman, Jennifer Wortman Vaughan,and Hanna Wallach. Manipulating and measuring model interpretability. In NIPS Workshop onTransparent and Interpretable Machine Learning in Safety Critical Environments, 2017.
Paul Raccuglia, Katherine C Elbert, Philip DF Adler, Casey Falk, Malia B Wenny, Aurelio Mollo,Matthias Zeller, Sorelle A Friedler, Joshua Schrier, and Alexander J Norquist. Machine-learning-assisted materials discovery using failed experiments. Nature, 533(7601):73–76, 2016.
Marco Tulio Ribeiro, Sameer Singh, and Carlos Guestrin. Why should i trust you?: Explaining thepredictions of any classifier. In Proceedings of the 22nd ACM SIGKDD International Conferenceon Knowledge Discovery and Data Mining, pages 1135–1144. ACM, 2016.
Ronald L Rivest. Learning decision lists. Machine learning, 2(3):229–246, 1987.
Andrew Ross, Michael C Hughes, and Finale Doshi-Velez. Right for the right reasons: Trainingdifferentiable models by constraining their explanations. In International Joint Conference onArtificial Intelligence, 2017.
Stefan Ruping. Thesis: Learning interpretable models. PhD thesis, Universitat Dortmund, 2006.
S Rasoul Safavian and David Landgrebe. A survey of decision tree classifier methodology. IEEEtransactions on systems, man, and cybernetics, 21(3):660–674, 1991.
Ute Schmid, Christina Zeller, Tarek Besold, Alireza Tamaddoni-Nezhad, and Stephen Muggleton.How does predicate invention affect human comprehensibility? In International Conference onInductive Logic Programming, pages 52–67. Springer, 2016.
Skipper Seabold and Josef Perktold. Statsmodels: Econometric and statistical modeling with python.In Proceedings of the 9th Python in Science Conference, volume 57, page 61, 2010.
Ramprasaath R Selvaraju, Abhishek Das, Ramakrishna Vedantam, Michael Cogswell, Devi Parikh,and Dhruv Batra. Grad-cam: Why did you say that? visual explanations from deep networks viagradient-based localization. arXiv preprint arXiv:1610.02391, 2016.
Avanti Shrikumar, Peyton Greenside, Anna Shcherbina, and Anshul Kundaje. Not just a black box:Interpretable deep learning by propagating activation differences. ICML, 2016.
19

Sameer Singh, Marco Tulio Ribeiro, and Carlos Guestrin. Programs as black-box explanations.arXiv preprint arXiv:1611.07579, 2016.
Daniel Smilkov, Nikhil Thorat, Been Kim, Fernanda Viegas, and Martin Wattenberg. Smoothgrad:removing noise by adding noise. arXiv preprint arXiv:1706.03825, 2017.
Girish H Subramanian, John Nosek, Sankaran P Raghunathan, and Santosh S Kanitkar. A compari-son of the decision table and tree. Communications of the ACM, 35(1):89–94, 1992.
Nava Tintarev and Judith Masthoff. Explaining recommendations: Design and evaluation. InRecommender Systems Handbook, pages 353–382. Springer, 2015.
Berk Ustun and Cynthia Rudin. Supersparse linear integer models for optimized medical scoringsystems. Machine Learning, 102(3):349–391, 2016.
Fulton Wang and Cynthia Rudin. Falling rule lists. In Artificial Intelligence and Statistics, pages1013–1022, 2015.
Tong Wang, Cynthia Rudin, Finale Doshi, Yimin Liu, Erica Klampfl, and Perry MacNeille. Bayesianors of ands for interpretable classification with application to context aware recommender systems.In ICDM, 2016.
Tong Wang, Cynthia Rudin, Finale Doshi-Velez, Yimin Liu, Erica Klampfl, and Perry MacNeille.Bayesian rule sets for interpretable classification. In International Conference on Data Mining,2017.
Martin Wattenberg, Fernanda Viegas, and Moritz Hardt. Attacking discrimination with smartermachine learning. Google Research, 17, 2016.
Description of Pilot StudiesWe conducted several pilot studies in the design of these experiments. Our pilot studies showedthat asking subjects to respond quickly or within a time limit resulted in much lower accuracies;subjects would prefer to answer as time was running out rather than risk not answering the question.That said, there are clearly avenues of adjusting the way in which subjects are coached to placethem in fast or careful thinking modes, to better identify which explanations are best in each case.
The experiment interface design also played an important role. We experimented with differentplacements of various blocks, the coloring of the text, whether the explanation was presented asrules or as narrative paragraphs, and also, within rules, whether the input was placed before or afterthe conclusion (that is, ‘if A: B” vs. “B if A”). All these affected response time and accuracy, andwe picked the configuration that had the highest accuracy and user satisfaction.
Finally, in these initial trials, we also varied more factors: number of lines, input conjunctions,input disjunctions, output conjunctions, output disjunctions and global variables. Upon running
20

preliminary regressions, we found that there was no significant difference in effect between disjunc-tions and conjunctions, though the number of lines, global variables, and general length of outputclause—regardless of whether that length came from conjunctions or disjunctions—did have aneffect on the response time. Thus, we chose to run our experiments based on these factors.
21