how does the new sat predict academic …people.terry.uga.edu/mustard/new sat.pdfhow does the new...
TRANSCRIPT

How Does the New SAT Predict Academic Achievement in College?1
Christopher M. Cornwell2
David B. Mustard3
Jessica Van Parys4
Working Paper
Last Modified: 6-25-2008
Abstract
In 2006, the College Board substantively altered the format and content of its SAT Test. Parts of the existing verbal (SATV) and math (SATM) portions of the test were changed, and a new writing (SATW) section was added. No academic research exists on the extent to which the new SAT generally, and the SATW specifically, relates to student performance in college. Thus, admissions offices of many higher educational institutions have disregarded the SATW scores in their admission decisions. By examining how the revised SAT affects a number of college performance outcomes, this study fills the gap in the academic literature and also provides evidence for formulating admissions policies. This study uses data for over 4,300 first-year students at the University of Georgia who were in the first cohort of students to take the revised SAT and complete a year of higher education. The data include every college class students took and their corresponding grades. Our regressions control for personal characteristics (race, gender, and parental education), high school academic achievement (HS GPA and AP credits) and high school fixed effects. We have three central conclusions. First, SATW scores favorably influence many collegiate academic outcomes. With each 100-point increase in SATW scores, students earn, on average, 0.07-points higher first-year GPAs and 0.18-points higher GPAs in freshman English courses; they also enroll in and earn 0.44 and 0.54 more credit hours, respectively. Conversely, these students withdraw from 0.2 fewer credit hours and are three percent less likely to lose the HOPE Scholarship. Second, the SATW scores are consistently more effective than SAT verbal and math scores at predicting academic achievement. Third, the effect of the new SATW largely subsumes the effect of SATV.
1 We thank the University of Georgia Registrar, Admissions Office, Office of Financial Aid, and Institutional Research and Planning for making their data available to us. We also thank Dale Ballou, Joseph Soares, and the participants at the annual meeting of the American Educational Finance Association for their constructive comments. 2 Christopher M. Cornwell, Department of Economics and Senior Fellow at the Institute of Higher Education, University of Georgia, Athens, GA 30622. Email: [email protected]. Phone: 706-542-3670. 3 David B. Mustard, Department of Economics and Senior Fellow at the Institute of Higher Education, University of Georgia, Athens, GA 30622 and the Institute for the Study of Labor. Email: [email protected]. Phone: 706-542-3624. 4 Jessica Van Parys. Department of Economics, University of Georgia, Athens, GA 30622. Email: [email protected]. Phone: 770-862-3287.

1
1. Introduction
Standardized tests play an increasingly important role in college admissions, expanding
the market for test preparation classes and tutoring. Approximately 90 percent of four-year
colleges and universities require either the SAT or ACT5 tests for admission (Zwick 2007). The
results from a survey6 conducted by the National Association for College Admission Counseling
(NACAC) indicate that SAT and ACT test scores are the second-most important factor in
admissions decisions, after high school grades (Hawkins and Lautz 2005). This is especially true
for large schools.
Since 1926, the College Board has administered the SAT Test7 of ability to high-school
students who are applying to college (Lawrence et al. 2003). One of the motivations for
introducing the test was to democratize the college admissions process. Requiring scores from all
applicants sought to enhance the role of meritocracy in college admissions decisions, while
diminishing the roles of nepotism and patronage. Today, roughly 1.5 million students take the
test each year.
The College Board has made a number of adjustments to the SAT Test’s rules and
content over the years, but none more significant than the changes adopted in 2006. Not only
were alterations made to the SAT verbal section (SATV) and SAT math section (SATM), but an
entirely new section, known as the SAT writing section (SATW), was added to the test. Taken
together, these changes have substantially altered the test’s structure, content, and scoring.
5 The ACT is another aptitude test administered by the American College Testing Program. It is most popular among high school students in the Midwest. All students, regardless of region, are eligible to take the SAT, ACT, or both tests for college admissions purposes. The College Board reports that 1,475,623 students took the SAT and 1,186,251 students took the ACT in 2005. 6 The survey was not a random sample, so results should be viewed with caution. 7 The College Board has changed the name of the test over time. Originally, it was called the Scholastic Aptitude Test, then the Scholastic Achievement Test, and now it is simply referred to as the SAT Test. It should not be confused with the SAT II Subject Tests.

2
Because the SAT has become so influential in the process of matching students to
colleges, the recent changes in the test merit scholarly scrutiny. There is a large literature in the
economics of education and educational psychology showing that SAT scores predict academic
success in college as measured by grade-point average (GPA) (Betts and Morell 1999; Stumph
and Stanley 2002; Cohn et al. 2003; Cornwell et al. 2005; Grove et al. 2006). When Betts-Morell
(1999) control for high school GPA, SAT scores, gender, and race/ethnicity, they find that each
100-point increase in SATV and SATM scores lead to a 0.08- and 0.09-point increase in first-
year GPA, respectively. There is not, however, consensus on the degree to which SAT scores
add value. Some contend that the magnitude of significance depends on the data and quality of
control variables (Weitzman 1982; Freedle 2003; Rothstein 2004). Furthermore, the ability of the
SAT to predict other measures of success, such as course completion, in college has gone largely
unexplored. In addition, no academic study has considered the effects of the 2006 changes, in
particular, the marginal value of the SATW. The value-added of SATW in predicting college
performance is an important question for higher education administration and policy. Because
the writing test is new and controversial, 47 percent of higher educational institutions, including
MIT, University of Chicago, Georgetown University, and Ohio State University disregarded the
scores in their 2006-07 admissions decisions (Forelle 2005; Honawar 2005). Indeed, many
colleges are awaiting results from academic research before they consider the SATW scores at
all (University Business 2005).
In this paper, we examine the relationship between the new SAT scores on college GPA
and course-load choices, focusing on the contribution of SATW. We also investigate the
contributions of the test components in predicting performance in freshman English and Math
courses, and predicting the probability that eligible freshman students lose Georgia’s merit

3
scholarship, known as Helping Outstanding Pupils Educationally (HOPE). Our analysis is based
on the 2006 freshman class at the University of Georgia, the members of which belong to the
first cohort to take the new exam and complete one year of college. Our results can be
summarized as follows. First, we find that SATW scores are significant determinants many
measures of academic performance in college. We estimate that increasing SATW by 100 points
raises first-year GPAs 0.07 points and GPAs in freshman English courses 0.18 points
(controlling for race, gender, parental education, high school GPA, the number of earned AP
credits hours, and high school fixed effects). A 100-point increase in SATW is associated with
0.44 and 0.54 more enrolled and earned credits, respectively, and 0.2 fewer withdrawn credits. A
100-point rise in SATW also reduces the probability of losing HOPE, a merit-based scholarship,
by 3 percent. Second, SATW scores better explain student performance than either the SATV or
SATM scores. For seven of our nine outcome measures the estimated effect of SATW is larger
than the corresponding effects of SATV and SATM. Third, we find that SATV is typically a
strong predictor of academic performance when SATW is omitted, but its estimated effect is no
longer statistically significant when SATW is included. Therefore, the independent information
contained in the SATV score is subsumed by the new SATW.
2. The New SAT
The College Board made three primary changes to the SAT in 2006. First, on the SATV,
now known as the critical-reading section8, analogies were replaced with paragraph-length
critical reading passages. Second, the SATM section’s quantitative comparison questions were
8 For the sake of simplicity, we will still refer to this section as the SAT verbal section (SATV).

4
replaced by student free-response questions, and the SATM now includes Algebra II content.
Third, the SATW, the newly added third section of the test, assesses students’ writing ability.
The College Board maintains that the new test and the writing section in particular, will
better assess academic potential and will more accurately identify qualified candidates in the
undergraduate admissions process (Kobrin 2005). The argument is that writing skills are a
critical part of the undergraduate tool kit for success, and prior to the SATW, admissions offices
lacked a rubric by which to compare students’ writing ability. (Though applicants submit
personal statements, critics point out that those statements could be written and/or edited by
others (Gose 2007).) The SATW focuses on grammar and sentence structure to determine how
well students use English writing mechanics to communicate their ideas and opinions. The
section is divided into two parts; part one grants 35 minutes to complete 49 multiple-choice
questions in which students are asked to identify grammatical errors and improve sentence or
paragraph structuring. Part Two gives 25 minutes for students to argue a given prompt in essay
format. Similar to the verbal and math portions of the test, the writing score ranges 200-800,
thereby accounting for one-third of the total SAT score.
The new writing section has generated some controversy. Opponents argue that the
SATW, with its focus on mechanics and the standard “5-paragraph essay”, will inhibit students
from developing creative writing styles (Bollag 2005; Maloney 2005; Newkirk 2005). There are
also concerns that high schools will “teach to the test” (MacGowan 2005), that the SATW is an
ineffective predictor of writing ability or ability to succeed in college more generally (Toppo
2005), and that SATW scores will contribute little to the predictive validity of the overall test
(Hamp-Lyons 2005). Finally, some believe the test will disproportionately hurt low-income,
minority, and non-native English speaking students (University Business 2005). Proponents

5
assert the test is not a measure of creativity, but its purpose is to evaluate mechanical writing
skills and these skills will gauge a student’s capacity to complete basic college writing
assignments (Camara 2005). The College Board believes the new test may encourage high
school writing instruction, where little to none existed before (Norris et al. 2004), and it further
claims the SATW “will not exacerbate score disparities among gender or ethnic groups” (Zwick
2007).
The College Board recently released its own report assessing the new SAT’s validity in
predicting first-year college GPA (Kobrin et al. 2008). The report’s findings are based on student
data from 110 (out of 726) four-year colleges and universities that received at least 200 SAT
scores in 2005 and agreed to participate in the study. Schools in the northeast and those that
admit 50-75% of applicants are over-represented; public schools are under-represented. More
importantly, the College Board data do not contain high-school performance measures beyond
GPA and no family background controls. Thus, its analysis is limited simple correlations
between the test components and college GPA.9 In contrast, we use regression analysis to
estimate the value of SAT components at the margin, holding constant a range of high-school,
personal and family characteristics that influence academic and test-taking success.
3. Data
We begin with a sample of 4,998 first-year students who entered the University of
Georgia (UGA) in 2006. These students are members of the first cohort required to complete the
SATW and finished their first year of college in Spring 2007. Together, UGA’s Office of
Undergraduate Admissions, Registrar’s Office, and Office of Student Financial Aid provided
9 Some correlation analysis is stratified by the public/private status, selectivity and size of the school.

6
data measures for success in college, high-school achievement, personal characteristics and
parental education. Table 1 lists the variables and summary statistics for each. For the most part,
we confine our analysis to the 4,320 typical first-time freshman (TFTF), of whom we have
complete outcome and covariate records. TFTF students are those whose first semester at the
University was in Fall 2006.
A. Measures of Academic Success
We consider nine measures of student performance: the first-year student’s overall
GPA10, grades in English 1101, English 1102, Pre-Calculus, and Calculus I, annual credit hours
enrolled, earned, and withdrawn, and the probability that she loses the HOPE Scholarship.
Annual credit hours enrolled refer to the number of hours of coursework a student has officially
enrolled in beyond the mid-point withdrawal marker. All enrolled courses receive a grade, but
not all enrolled courses are earned. Earned hours refer to the number of hours that count toward
graduation, requiring a grade of A-D. Hours withdrawn refer to the number of hours a student
attempted, but withdrew from, either with or without penalty.11
Course load is an important outcome variable because it affects time to graduation.
Recurrent low course loads or numerous course withdrawals could indicate inadequate
motivation or a lack of ability to complete the required coursework. Either way, fewer hours
earned raise the cost of attending college and increase the likelihood of academic dismissal (Ottl
10 We calculated the first-year student’s overall GPA by weighting each course grade with the number of hours the course earned, summing across all courses in Fall 2007 and Spring 2008, then dividing the weighted sum by the sum of total graded hours. Graded hours refer to courses graded A-F and include WFs. Grade point averages are calculated on a 4.0-scale. 11 “Without penalty” refers to when a student withdraws before the semester half-way point with permission from the professor. The student then receives a “W” on her transcript, but the course is excluded in GPA calculations. Withdrawing “with penalty” occurs when a student fails to withdraw prior to the semester mid-point and/or fails to acquire teacher consent. This results in a “WF” indicator on her transcript, which amounts to a failing grade in GPA calculations.

7
1987). Universities aim to accept students capable of degree completion. This study will help
admissions offices more accurately predict which students will stay on track during the first year.
We also examine the relationship between SAT scores and success in core English and
Math courses, as measured by grades in ENGL1101, ENGL1102, MATH1113, and MATH2200.
Students are required to pass the two English courses and MATH1113 (Pre-Calculus) to graduate
from the University. Additionally, MATH2200 (Calculus I) is required of many students who are
business, pre-med, or science majors. Therefore, each of these classes will contain large numbers
of freshmen.
Finally, we evaluate the degree to which the SAT predicts the loss of the HOPE
Scholarship. HOPE grants full tuition, fees, and a modest book allowance to residents who
graduate from a Georgia high school with a 3.0 grade-point average and attend a public college
or university in the state. To keep the scholarship, a student must maintain a 3.0 overall GPA in
college. The HOPE variable binary variable indicating that a student’s GPA has fallen below the
3.0 threshold.
The first section of Table 1 lists the summary statistics for the dependent variables. The
mean first-year GPA was 3.16, the mean GPA in the first freshman English class was 3.10, the
mean hours earned over the academic year was 26.45 and the average number of students losing
the HOPE Scholarship was 29%. Though not included in the table, hours enrolled and earned
ranged from 0-39, and hours withdrawn ranged 0-26 over the academic year.
B. Control Variables
In examining the relationship between the three SAT scores of student i in high school j
( ijSAT ) and college performance, the model controls for a range of personal and high school
8
characteristics and high high-school fixed effects. High school measures of academic success
( ijACAD ) includes her high school grade-point average and the number of advanced placement
(AP) credits she earned. Advanced placement credits could have been earned from passing
Advanced Placement or International Baccalaureate tests in high school, or from entrance
examinations at the University. The next section of Table 1 shows the summary statistics for
students’ high school achievement variables. The mean SAT scores for SATW, SATV, and
SATM were 600, 607, and 615, respectively. The mean high school GPA was 3.78 with a
standard deviation of 0.30. SAT scores range from 1130 to 2400 (Total), 300 to 800 (Writing),
280 to 800 (Math), and 330 to 800 (Verbal), while high school GPA ranged from 2.27 to 4.58 on
a 4.0 scale that grants extra points for advanced placement and honors courses. The mean
number of AP credits was 8.13 and the range went from 0 to 60.12
Personal characteristics ( ijPER ) include whether a student is female, the student’s
race/ethnicity (Caucasian, African American, Asian American, Hispanic, and Multi-Ethnic), and
the level of both parents’ education. Students indicated that their father’s maximum level of
education was either less than a high school education, high school degree, some college,
Bachelor’s degree, Master’s degree/post-baccalaureate education, or a Ph.D. The options were
identical for mothers.
The lower half of Table 1 gives the summary statistics for personal characteristics. Of the
incoming class, approximately 63% were female, 7% African American, 80% White, and 86%
were Georgia residents. Moreover, 81% of students have fathers and/or mothers with at least a
Bachelor’s degree.
12 UGA caps Advanced Placement at sixty credit hours.

9
4. Empirical Model and Estimation
We estimate the effect of SAT scores on our measures of college performance by using
empirical models of the form
ijijijiji HSPERACADSATY εγφδβα +++++= 1 , (1)
where Y is an outcome variable, SAT is a vector containing the three test scores, ACAD and PER
contain the high-school achievement variables and personal characteristics and ε is a random
error. We estimate the models by OLS and allow for heteroscedasticity in the standard-error
calculation. Since Rothstein (2005) shows that the mean SAT score from a high school is a better
predictor of first-year GPA than within school score deviations from that mean, we incorporate a
vector HS for high school fixed effects. These fixed effects control for unobserved pre-college
characteristics that are shared by students in the same high school; for example, peer effects,
expectations about college success, socioeconomic status, and school-level preparation. In the
discussion of the results, we highlight the marginal contribution of SATW in prediction.
5. Results
A. College GPA
Table 2 presents the results for overall first-year GPA. The first column reports the
baseline specification, which omits SATW and the high-school effects. The second column adds
SATW. Column (3) is simply column (2) with the addition of high-school fixed effects.
Comparing R2s across model specifications shows that controlling for high school attended is
empirically important. Adding high-school effects generally increases the explanatory power of
the model by about 16 percentage points or 50 percent.

10
Table 2 explains how the effects of the SATM and SATV scores change when control
variables are added. When estimating college GPA without high school fixed effects and SATW,
column (1) shows that an increase of 100 points in SATM is associated with a 0.057 point
increase in first-year GPA. When SATW is added as a control variable the estimated effect drops
by 22.1 percent to 0.045, which is still statistically significant at the 0.01-level. However, the
estimated effect of SATM is essentially eliminated when high school fixed effects are added in
column (3), where the coefficient estimate is not statistically different from zero. If admissions
offices cannot control for high school effects, then the SATM score has an economically and
statistically significant effect on college GPA. However, once high school effects are included,
there is no independent effect of SATM on GPA.
Controlling for high school effects has little impact (and actually slightly increases the
estimated effect of SATV), but the effect of SATV is largely subsumed by the inclusion of the
SATW variable. When SATW is included, the estimated effect of SATV drops 57.4 percent
between columns (1) and (2). This result may be because the SATW captures similar skills as the
SATV. Table 3 reports the correlation matrix associated with the academic preparedness
variables. The correlation coefficient for SATW and SATV scores is 0.71, which is higher than
the correlation between any other variables.
Table 2 clearly shows that SATW has greater explanatory power than either of the other
SAT scores. In the full specification (column (3)), a 100-point increase in the writing score
increases first-year GPA by 0.068 points, which is statistically significant at the 0.01-level. The
corresponding estimated effects for SATM and SATV are 0.004 and 0.032. The former estimate
is not statistically significant while the latter is barely statistically significant at the 0.05-level
and is less than half of the effect of SATW.

11
High school GPA is strongly correlated with college GPA, while AP credits moderately
affect first-year GPA. In column (3), which includes the most exhaustive set of control variables,
every 1-point increase in high school GPA increases college GPA by 0.895 points and each
additional AP credit hour earned increases first year GPA by 0.007 points. Moving from column
(1) to (2) in the table, the coefficient estimate on high school GPA remains consistent, but then
increases in column (3) with the addition of high school fixed effects. This is to be expected, as
using high school fixed effects is one way to standardize grades across high schools. The
coefficient estimate on AP credit hours decreases slightly after adding SATW scores (moving
from column (1) to (2)). This suggests that SATW scores capture some of the explanatory power
that AP credit hours previously had on first-year GPA. Finally, at the margin, high school GPA
is a stronger predictor of first-year GPA than any individual SAT score. For example, one
standard deviation increase in high school GPA corresponds to a 0.27-point higher first-year
GPA, whereas a one standard deviation increase in the SATW score corresponds to a 0.05-point
higher first-year GPA.13 The finding that high school GPA is better predictor of academic
outcomes is consistent with Geiser and Santelices (2007) who study about 80,000 University of
California students and conclude that high school GPA is consistently the strongest predictor of
four-year college outcomes.
B. GPA in Core English and Math Courses
Table 4 reports how SAT scores explain GPA in core Math and English courses. These
results are of interest, as they document how scores on specific sections of the SAT predict
student performance in closely related college courses. Controlling for other factors, the 13 To calculate, use the standard deviations for each variable listed in Table 1. After readjusting the SAT estimates to their original units, multiply each coefficient estimate by the variable’s standard deviation. This will generate results that are comparable across variables.

12
performance on a specific SAT section has very large positive effects on the GPA in a closely
related college course, but no (or sometimes a negative) effect on grades in unrelated college
courses. The first row of columns (1) and (2) in Table 4 shows that SATW scores have a positive
and statistically significant effect on grades in freshman English courses 1101 and 1102. With
every 100-point increase in SATW scores, the grades increase 0.186 points in ENGL1101 and
0.17 points in ENGL1102. Conditional on SATW scores, SATV is not a significant predictor of
GPA in ENGL1101 and ENGL1102. However, when estimating the first two regressions in
Table 4 and omitting SATW, the coefficient estimate on SATV is 0.13 with a t-statistic of 4.2
(English 1101) and 0.133 with a t-statistic of 5.0 (English 1102). These results are consistent
with those found for overall first year GPA; that is, the SATW score essentially eliminates the
independent effect of the SATV.
SATM scores are negative and statistically significant for both English courses.
Controlling for other factors, a 100-point increase in SATM reduces GPA in the two English
classes by about .05 to .06 GPA points. A one-point increase in high school GPA results in a 0.6-
point increase in ENGL1101 and 0.512-point increase ENGL1102.
Columns (3) and (4) of Table 4 show that SATW scores have no effect on performance in
freshmen math courses. High school GPA and SATM scores are the strongest determinants of
student success in Pre-Calculus and Calculus I. For every one-point increase in HSGPA, grades
rise by 1.715 points in pre-calculus and 0.88 points in calculus. For every 100-point increase in
SATM scores, grades increase 0.362 points and 0.52 points in pre-calculus and calculus I,
respectively. SATV scores and AP credits do not predict grades in mathematics with any
significant degree of certainty.

13
C. Credit Hours
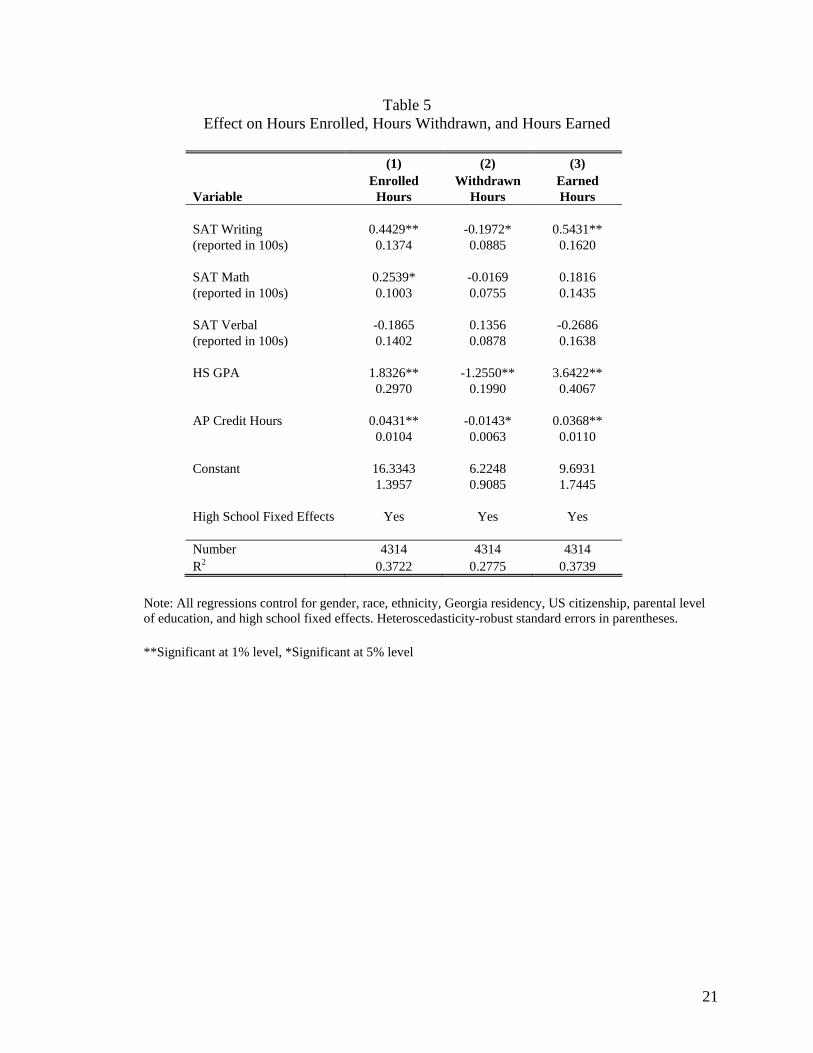
Table 5 reports the results for the regressions with the full set of controls for three
different measures of credit hours—hours enrolled (column (1)), hours withdrawn (column (2)),
and hours earned (column (3)). The first row of Table 5 documents how SATW scores have a
statistically significant effect on all three variables. As was true in Tables 2 and 4, of the three
SAT scores, SATW has the largest estimated effect for all measures of credit hours. For every
100-point increase in SATW scores, a student will, on average, enroll in 0.44 more hours over
the academic year, withdraw from 0.20 fewer hours, and earn 0.54 more hours. In contrast, the
estimated effect of SATM is statistically significant (at the 0.05-level) only for enrolled hours.
The estimated effect of SATV is actually the “wrong” sign in all three cases, but none of the
results are statistically different from zero.
The regressions that omit SATW (not reported in this table) show that the coefficient
estimate for SATM was statistically significant for all three outcomes and that although the
estimated effects for SATV were not statistically significant, the coefficient estimates were of the
correct signs. As in the college GPA regressions shown in Table 2, including the SATW score
largely subsumes the effects of the other scores. Once we control for an array of personal and
achievement characteristics and high school fixed effects, the writing section is the only SAT
score to consistently correlate in a meaningful way with first-year credit hour outcomes.
High school GPA and AP credits also clearly enhance student performance in college,
and their estimated effects are statistically significant for all three measures of hours. The fourth
row of Table 5 shows that a 1-point increase in high school GPA is associated with an increase
of 1.84 enrolled hours, a reduction of 1.26 withdrawn hours, and an increase of 3.64 earned
hours. Similarly, an additional AP credit hour increases enrolled hours by 0.043, reduces
14
withdrawn hours by 0.014, and increases earned hours by 0.037. This means that a typical class
exemption (3-credit hours) will increase hours earned by 0.111.
D. HOPE Scholarship Loss
Table 6 provides evidence of the ability of SAT scores to predict HOPE Scholarship loss.
We report the results from the linear probability model, with and without the SATW variable.
The first column shows that without the SATW variable, a 100-point increase in the SATV score
reduces a student’s likelihood of losing the HOPE Scholarship by 3.3% with a t-statistic of 2.6.
As was found, however, in seven of the eight previous outcome variables, SATW subsumes the
effect of the SATV. Columns (1) and (2) reveal that when the model controls for SATW, the
coefficient estimate on SATV drops in half and loses its statistical significance. Moreover, the
SATV’s power of prediction for HOPE Scholarship loss shifts to the SATW variable. The first
row of column (2) shows that for every 100-point increase in SATW scores, students are
approximately 3% less likely to lose the HOPE Scholarship. This estimate is significant at the
0.1-level. Consistent with the previous findings in this paper, column (2) confirms that SATW
has a much larger estimated effect than that of the other SAT scores. It is also the only score to
retain a degree of significance when all three scores are included in the model.
High school GPA and AP credits predict the likelihood of HOPE loss. Row 4 of Table 6
indicates that each 1-point increase in high school GPA reduces the likelihood that a student will
lose the Scholarship by 57 percent. With each 1-credit hour increase in AP credit, a student is
roughly 0.3 percent less likely to lose HOPE. The coefficient estimates on high school GPA and
AP credits remain consistent when SATW is added to the model (moving from columns (1) to
(2)).
15
6. Conclusion
This paper is the first and only academic study that evaluates the effectiveness of the new
SAT. It is also the most comprehensive assessment of the SAT in terms of the variety of
academic achievement outcomes measured. The results lead us to draw three primary
conclusions. First, SATW scores favorably influence many collegiate academic outcomes.
Controlling for other factors, with each 100-point increase in SATW scores, students earn, on
average, 0.07 points higher first-year GPAs and 0.18 points higher GPAs in freshman English
courses, enroll in 0.44 more credit hours, earn 0.54 more credit hours, withdraw from 0.2 fewer
credit hours, and are three percent less likely to lose the HOPE Scholarship.
Second, the SATW scores are consistently more effective than SAT verbal and math
scores at predicting academic achievement. For example, when we include high school fixed
effects, the coefficient estimate on SATM is not statistically different from zero for about two-
thirds of the outcomes. Conditional on SATW, SATV was a statistically significant determinant
for only one of the nine measured outcomes (overall first-year GPA).
Third, the effect of the new SATW largely subsumes the effect of SATV. When we
estimate the regressions and omit the SATW score, the effects of SATV are generally large and
statistically significant. However, when SATW is included in the regression, the SATV score is
statistically different from zero in only one case. This indicates that SATW contains most, if not
all, of the predictive information from the SATV.

16
In sum, this is the first study of the predictive power of the new SAT and the results are
quite strong and consistent. However, as this study examines first-year students at one institution,
we do not yet know the extent to which they characterize student achievement at different
institutions. Also, because this study used the very first cohort of students, we do not yet know
whether the results will be consistent over time. The relative predictive strength of the SATW
score may be due to its novelty. In the future, students taking the SATW may invest in more test-
taking strategies, which have tended to raise test scores for SATV and SATM (Kulik et al. 1984).
Over time such preparation may lead SATW scores to be less accurate measures of each
student’s underlying ability than they are now. Therefore, we encourage future studies that
analyze the effects of the new SAT on students at other institutions and over longer periods of
time.
Nevertheless, because the existing evidence indicates that the SATW favorably affects a
wide variety of college academic performance measures and because the magnitude of its effect
exceeds the size of the effects of the SATV and SATM, the SATW provides information that can
help institutions admit students who are more likely to succeed in college. While the scores are
imperfect, taken together with high school GPA, other portions of standardized tests, AP credit,
and non-cognitive variables, they clearly help predict first-year student academic achievement.

17
Table 1 Summary Statistics
Variable Observations Mean Std. Dev.
Dependent Variables College GPA 4309 3.16 0.60 English 1101 GPA 2095 3.10 0.64 English 1102 GPA 2913 3.20 0.63 Pre-Calculus GPA 1309 2.76 1.08 Calculus I GPA 803 3.05 0.96 Enrolled Hours 4318 26.99 3.90 Earned Hours 4318 26.45 4.71 Withdrawn Hours 4318 1.33 2.40 HOPE Loss 3684 0.29 0.45
Measures of High School Achievement SAT Writing 4320 600 74.30 SAT Verbal 4320 607 74.80 SAT Math 4320 615 73.00 SAT Total 4320 1823 187.60 High School GPA 4320 3.78 0.30 AP Credit Hours 4320 8.13 8.99
Personal Characteristics Female 4320 0.63 0.48 Male 4320 0.37 0.48 Black 4320 0.07 0.26 White 4320 0.80 0.40 Asian 4320 0.08 0.26 Hispanic 4320 0.03 0.16 Multi-Ethnic 4320 0.02 0.15 GA Resident 4320 0.86 0.34 Citizen 4320 0.96 0.19
Parental Education Variables Father: No High School 4320 0.02 0.15 Father: High School 4320 0.09 0.29 Father: Some College 4320 0.03 0.18 Father: BA Degree 4320 0.13 0.34 Father: MA Degree 4320 0.37 0.48 Father: PhD Degree 4320 0.31 0.47 Mother: No High School 4320 0.02 0.12 Mother: High School Grad 4320 0.11 0.32 Mother: Some College 4320 0.04 0.20 Mother: BA Degree 4320 0.20 0.40 Mother: MA Degree 4320 0.38 0.49 Mother: PhD Degree 4320 0.23 0.42

18
Table 2 Effect on College GPA (CGPA) with varying model specifications
(1) (2) (3) Variable CGPA CGPA CGPA SAT Writing 0.0706** 0.0677** (reported in 100s) 0.0153 0.0158 SAT Math 0.0574** 0.0447** 0.0037 (reported in 100s) 0.0141 0.0144 0.0157 SAT Verbal 0.0650** 0.0277+ 0.0318* (reported in 100s) 0.0134 0.0155 0.0162 HS GPA 0.8187** 0.8113** 0.8946** 0.0358 0.0355 0.0418 AP Credit Hours 0.0087** 0.0079** 0.0073** 0.0010 0.001 0.0011 Constant -0.7327 -0.8128 -0.8016 0.1521 0.1539 0.1836 High School Fixed Effects No No Yes Number 4309 4309 4305 R2 0.3312 0.3344 0.4980
Note: Though the results are omitted from the table, all regressions control for gender, race, ethnicity, Georgia residency, U.S. citizenship, and parental level of education. Heteroscedasticity-robust standard errors in parentheses. **Significant at 1% level, *Significant at 5% level, +Significant at 10% level

19
Table 3
Correlation Matrix for Academic Preparedness Variables
HSGPA SATW SATV SATM AP Credit HSGPA 1.000 0.000 SATW 0.275 1.000 0.000 0.000 SATV 0.241 0.711 1.000 0.000 0.000 0.000 SATM 0.292 0.504 0.485 1.000 0.000 0.000 0.000 0.000 AP Credit 0.319 0.530 0.554 0.486 1.000 0.000 0.000 0.000 0.000 0.000 Notes: P-values are below the correlation coefficients

20
Table 4 Effect on Grades in Freshman English and Math Courses
(1) (2) (3) (4) English Math Variable 1101 1102 1113 2200 SAT Writing 0.1855** 0.1704** -0.0805 -0.0378 (reported in 100s) 0.0366 0.0285 0.0772 0.1030 SAT Math -0.0599+ -0.0542* 0.3618** 0.5196** (reported in 100s) 0.0348 0.0268 0.0805 0.1063 SAT Verbal 0.0407 0.0496 -0.0614 -0.0987 (reported in 100s) 0.0350 0.0306 0.0831 0.1174 HS GPA 0.5956** 0.5108** 1.7147** 0.8791** 0.0847 0.0649 0.1770 0.2332 AP Credit Hours 0.0060 0.0020 0.0105 0.0077 0.0037 0.0028 0.0075 0.0076 Constant -0.3671 0.4367 -4.7891 -2.5961 0.3436 0.3220 0.8188 1.1158 High School Fixed Effects Yes Yes Yes Yes Number 1940 2726 1229 747 R2 0.4373 0.3570 0.5643 0.5526
Note: All regressions control for gender, race, ethnicity, Georgia residency, US citizenship, parental level of education, and high school fixed effects. Heteroscedasticity-robust standard errors in parentheses. **Significant at 1% level, *Significant at 5% level, +Significant at 10% level
21
Table 5 Effect on Hours Enrolled, Hours Withdrawn, and Hours Earned
(1) (2) (3) Enrolled Withdrawn Earned Variable Hours Hours Hours SAT Writing 0.4429** -0.1972* 0.5431** (reported in 100s) 0.1374 0.0885 0.1620 SAT Math 0.2539* -0.0169 0.1816 (reported in 100s) 0.1003 0.0755 0.1435 SAT Verbal -0.1865 0.1356 -0.2686 (reported in 100s) 0.1402 0.0878 0.1638 HS GPA 1.8326** -1.2550** 3.6422** 0.2970 0.1990 0.4067 AP Credit Hours 0.0431** -0.0143* 0.0368** 0.0104 0.0063 0.0110 Constant 16.3343 6.2248 9.6931 1.3957 0.9085 1.7445 High School Fixed Effects Yes Yes Yes Number 4314 4314 4314 R2 0.3722 0.2775 0.3739
Note: All regressions control for gender, race, ethnicity, Georgia residency, US citizenship, parental level of education, and high school fixed effects. Heteroscedasticity-robust standard errors in parentheses. **Significant at 1% level, *Significant at 5% level

22
Table 6 Effect on the Probability of Losing Hope
(1) (2) HOPE HOPE
Variable Loss Loss SAT Writing -0.0286+ (reported in 100s) 0.0147 SAT Math -0.0004 0.0007 (reported in 100s) 0.0135 0.0137 SAT Verbal -0.0334** -0.0188 (reported in 100s) 0.0129 0.0151 HS GPA -0.5748** -0.5698** 0.0319 0.0320 AP Credit Hours -0.0034** -0.0031** 0.0010 0.0010 Constant 2.7487 2.7786 0.1361 0.1365 High School Fixed Effects Yes Yes Number 3676 3676 R2 0.3338 0.3346
Note: Both regressions control for gender, race, ethnicity, and parental level of education. The sample was restricted to Georgia residents. Heteroscedasticity-robust standard errors in parentheses.
**Significant at 1% level, *Significant at 5% level, +Significant at 10% level

23
References
Betts, Julian R. and Darlene Morell. 1999. “The Determinants of Undergraduate Grade Point
Average: The Relative Importance of Family Background, High School Resources, and
Peer Group Effects.” Journal of Human Resources. 34:3. pp. 268-293.
Bollag, Burton. 2005. “English Teachers Blast SAT Writing Test.” Chronicle of Higher
Education. 51:36.
Camara, Wayne. 2005. “Misstatements and Misunderstandings About the SAT Writing Test
[Response to The Student-Written Essay and the New SAT by B. MacGowen]”. Journal
of College Admission. 188. pp. 2-3.
Cohn, Elchanan, Sharon Cohn, Donald C. Balch, and James Bradley. 2003. “Determinants of
undergraduate GPAs: SAT scores, high school GPA and high-school rank.” Economics of
Education Review. 23:6. pp. 577-586.
Cornwell, Christopher M., Kyung Hee Lee, and David B. Mustard. 2005. “Student Responses to
Merit Scholarship Retention Rules.” Journal of Human Resources. 40:4. pp. 895-917.
Forelle, Charles. 2005. “Many Colleges Ignore New SAT Writing Test.” Wall Street Journal -
EasternEdition.
Freedle, Roy. 2003. “Correcting the SAT's Ethnic and Social-Class Bias: A Method for
Reestimating SAT Scores.” Harvard Educational Review. 73:1. pp. 1-43.
Geiser, Saul and Maria Veronica Santelices. 2007. “Validity of High-school Grades in Predicting
Student Success Beyond the Freshman Year.” Research and Occasional Paper Series:
CSHE.6.07. Center for Studies in Higher Education. University of California, Berkeley.
Gose, Ben. 2007. “Author! Author! Colleges Struggle to Evaluate Applicants' Writing.”
Chronicle of Higher Education.

24
Grove, Wayne, Tim Wasserman, Andrew Grodner. 2006. “Choosing a Proxy for Academic
Aptitude. The Journal of Economic Education.” 37:2. pp. 131-47.
Hamp-Lyons, Liz. 2005. “What is writing? What is “scholastic aptitude”? What are the
consequences? SAT I Writing —a trip down memory lane.” Assessing Writing. 10. pp.
151-156.
Hawkins, D. A., & Lautz, J. 2005. State of college admission. Alexandria, Virginia: National
Association for College Admission Counseling. Retrieved February 7, 2008 from
http://www.nacacnet.org.
Honawar, Vaishali. 2005. “Colleges Hesitate to Embrace SAT Writing Test.” Education Week.
Kobrin, Jennifer. L., Brian F. Patterson, Emily J. Shaw, Krista D. Mattern, and Sandra M.
Barbuti. 2008. “Validity of the SAT® for Predicting First-Year College Grade Point
Average.” College Board Publications. Research Report 2008-5.
Kobrin, Jennifer. 2005. “Forecasting the Predictive Validity of the New SAT I Writing Section.”
College Board Publications.
Kulik, James A., Chen-Lin C. Kulik, and Robert L. Bangert. 1984. “Effects of Practice on
Aptitude and Achievement Test Scores.” American Educational Research Journal. 21:2.
pp. 435-447.
Lawrence, Ida, Gretchen Rigol, Thomas Van Essen, and Carol Jackson. 2003. “A Historical
Perspective on the Content of the SAT.” College Board Research Report No. 2003-3.
MacGowan, B. 2005. “The Student-Written Essay and the New SAT.” Journal of College
Admission. 186. pp. 2-3.
Maloney, Henry B. 2005. “SAT Writing Exercise: 'Dig It Out, Say It Fast'.” Education Week.

25
Newkirk, T. 2005. “The New Writing Assessments: Where Are They Leading Us?” English
Journal 95:2. pp. 21-2.
Norris, D., Oppler, S., Kuang, D., Day, R., & Adams, K. 2004. “The College Board SAT Writing
validation research study: An assessment of the predictive and incremental validity.”
Washington, DC: American Institutes for Research.
Ott1, Mary Diederich. 1987. “An analysis of predictors of early academic dismissal.” Office of
Institutional Studies, The University of Maryland College Park.
Rothstein, Jesse M. 2004. “College Performance Predictions and the SAT.” Journal of
Econometrics. 121. pp. 297-317.
Rothstein, Jesse M. 2005. “SAT Scores, High Schools, and College Performance Predictions.”
Working Paper. Obtained from http://www.princeton.edu/%7Ejrothst/research.html.
Stumpf, H. and J.C. Stanley. 2002. “Group Data on High School Grade Point Averages and
Scores on Academic Aptitude Tests as Predictors of Institutional Graduation Rates.”
Educational and Psychological Measurement. 62:6. pp. 1042-52.
Toppo, Greg. 2005. “English teachers group says new SAT writing test could backfire.” USA
Today.
University Business. 2005. “The New SAT Writing Section Under Fire: Some IHEs are Ignoring
the New SAT Writing Scores.” pp. 16-17.
Weitzman, R.A. 1982. “The Prediction of College Achievement by the Scholastic Aptitude Test
and the High School Record.” Journal of Educational Measurement. 19:3. pp. 179-191.
Zwick, Rebecca. 2007. “College Admission Testing.” Report for National Association for
College Admission Counseling. pp. 1-44.