how does total quality management influence the loan ... · between total quality management (tqm)...
TRANSCRIPT
Full Terms & Conditions of access and use can be found athttp://www.tandfonline.com/action/journalInformation?journalCode=ctqm20
Download by: [University of Sussex Library] Date: 17 May 2016, At: 08:21
Total Quality Management & Business Excellence
ISSN: 1478-3363 (Print) 1478-3371 (Online) Journal homepage: http://www.tandfonline.com/loi/ctqm20
How does total quality management influence theloan quality of the bank?
Hasanul Banna, Rubi Ahmad & Eric H.Y. Koh
To cite this article: Hasanul Banna, Rubi Ahmad & Eric H.Y. Koh (2016): How does total qualitymanagement influence the loan quality of the bank?, Total Quality Management & BusinessExcellence, DOI: 10.1080/14783363.2016.1180954
To link to this article: http://dx.doi.org/10.1080/14783363.2016.1180954
Published online: 11 May 2016.
Submit your article to this journal
Article views: 14
View related articles
View Crossmark data
How does total quality management influence the loan quality of thebank?
Hasanul Banna , Rubi Ahmad∗
and Eric H.Y. Koh
Department of Finance and Banking, Faculty of Business and Accountancy, University ofMalaya, Kuala Lumpur, Malaysia
This paper aims to investigate whether, and to what extent, total quality management(TQM) influences bank loan quality. We propose an approach to measure TQM forevaluating this relationship. The proposed measure is the residual from the Fama–MacBeth regression based on bank efficiency proxied by the income-to-cost ratio.Our proposed TQM measure is statistically significant. We obtain data of 581 UScommercial banks from the SNL Financial database for the period 1991–2013 witha total of 13,303 bank-year observations. The result shows that TQM is positivelyrelated to bank loan quality. This suggests that the implementation of better TQMcan help management to monitor borrowers, improve competition and efficiency,manage good-quality loan portfolios, minimise expenses, and generate morerevenues. This research has several implications for regulation, TQMimplementation, and policy for the banking industry. In sum, an association betweenTQM and loan quality allows us to expand our knowledge of the specific role ofTQM in bank performance, management decision, and managing loan portfolios.
Keywords: total quality management; bank efficiency; loan quality; bankperformance; loan portfolios; managerial ability
1. Introduction
Many banks in the USA failed and suffered substantial loan losses during the 2007–2009
global financial crisis. The huge increase in the number of bank failures raises many ques-
tions about bank management quality (Habib & Hossain, 2013; Jin, Kanagaretnam, &
Lobo, 2011). Managers were also criticised for their inability to see the looming economic
problems and manage loan quality (Cantrell, 2013). Loans make up a substantial pro-
portion of bank assets, and therefore, it is important to manage loan quality to keep
banks financially sound (Barth & Landsman, 2010). There is a positive relationship
between total quality management (TQM) implementation and firms’ financial perform-
ance (Chaudary, Zafar, & Salman, 2015), and the successful implementation of TQM
depends on managers’ performance. Thus, TQM can potentially influence loan quality
by keeping lower non-performing loans (NPLs) ratio. Banks with lower NPLs have
good financial performance and stability. The bank can generate more revenues and main-
tain good-quality loans by implementing better TQM. Therefore, it is crucial to find a
relationship between TQM and bank loan quality to capture the real picture of financial
performance for the investors and regulators.
TQM is one of the most important factors to ensure banks’ financial performance and
long-run survival (Chaudary et al., 2015; Habib & Hossain, 2013). The ultimate challenge
for the managers is to cope with increasing uncertainties and accompanying risks (Barr &
# 2016 Informa UK Limited, trading as Taylor & Francis Group
∗Corresponding author. Email: [email protected]
Total Quality Management, 2016
http://dx.doi.org/10.1080/14783363.2016.1180954
Dow
nloa
ded
by [
Uni
vers
ity o
f Su
ssex
Lib
rary
] at
08:
21 1
7 M
ay 2
016
Siems, 1997; Curcio & Hasan, 2015; Giulioni, 2015). Implementation of better TQM may
help managers to overcome the challenges by managing the risks involved in today’s
financial environment. Better TQM can help managers allocate resources efficiently and
control the bank’s operations effectively, while generating more incomes and minimising
expenses. TQM can also help maintain high-quality loans through better processes of
monitoring the borrowers more closely by using managerial ability. Thus, better manage-
rial ability can signify the implementation of better TQM. Hence, TQM is essential for a
bank to have good financial performance and position. Therefore, the main objective of
this study is to investigate whether, and to what extent, TQM influences bank loan quality.
Besides TQM, some other bank-specific and macroeconomic determinants such as
bank size, loan growth, GDP growth, lending rate, and inflation rate also influence bank
loan quality. We select the control variables for this study based on previous literature
(e.g. Berger & DeYoung, 1997; Clair, 1992; Fenech, Yap, & Shafik, 2014; Louzis,
Vouldis, & Metaxas, 2012; Rinaldi & Sanchis-Arellano, 2006; Shu, 2002; Sinkey &
Greenawalt, 1991) and the life-cycle consumption theory of Modigliani and Brumberg
(1954) and Lawrence (1995). Louzis et al. (2012) consider bank size in their study and
point out that loan quality is negatively related to bank size because large banks might
take excessive risk and cannot manage the loan portfolios properly. While Sinkey and
Greenawalt (1991) find a negative relationship between loan growth and loan quality,
Clair (1992) finds a positive relationship. Fenech et al. (2014) use GDP growth as a macro-
economic variable and show a positive relationship between GDP growth and loan quality.
Rinaldi and Sanchis-Arellano (2006) argue that loan default is influenced by income and
lending rates because the probability of default depends on current income, which is linked
to the uncertainty regarding future income and lending rates. They conclude that lending
rate positively influences loan quality. Rinaldi and Sanchis-Arellano (2006) indicate that
inflation rate negatively influences loan quality; however, Shu (2002) finds the opposite.
Researchers, investors, and regulators used different proxies for TQM or the manage-
rial ability to find the relationship with financial performance. Most of the proxies are
affected by some overriding outer factors such as firm characteristics and are qualitative
in nature. Earlier studies (e.g. Aarts & Vos, 2001; Boulter, Bendell, & Dahlgaard, 2013;
Chaudary et al., 2015; Ciptono, Ibrahim, Sulaiman, & Kadir, 2011; Duh, Hsu, &
Huang, 2012; Eriksson & Hansson, 2003; Hendricks & Singhal, 2001; Modi & Mishra,
2011) use different proxies of TQM such as ISO 9000, ISO 9001, quality award recipients,
world-class company practices, and efficiency of good operation management. Most of
them also used different proxies of financial ratios such as return on assets, operating
income, stock returns, cost of goods sold, abnormal return, Tobin’s Q, current ratio, and
profitability. Ciptono et al. (2011) find a positive relation between TQM implementation
and financial performance using world-class company practices as TQM proxy. Duh et al.
(2012) study TQM using structural equation modelling with a sample of 209 firms. TQM
implementation is found to have a positive albeit indirect relationship with firm perform-
ance. Eriksson and Hansson (2003) use quality award recipients for TQM measure and
study on the relationship between TQM and financial performance. The results indicate
that during the implementation period, the award recipients do not necessarily perform
better than their competitors and the branch indices. Modi and Mishra (2011) use effi-
ciency of good operation management as a proxy for TQM and find a positive relation
with financial performance.
The above proxies of TQM are more qualitative in nature, difficult to obtain, and
contain more noise. Thus, it is crucial to quantify the proxy for TQM that can be easily
obtainable as well as contains less noise than others. Besides, the earlier studies focus
2 H. Banna et al.
Dow
nloa
ded
by [
Uni
vers
ity o
f Su
ssex
Lib
rary
] at
08:
21 1
7 M
ay 2
016
mainly on non-bank firms. Therefore, prior studies do not quantify TQM and study how
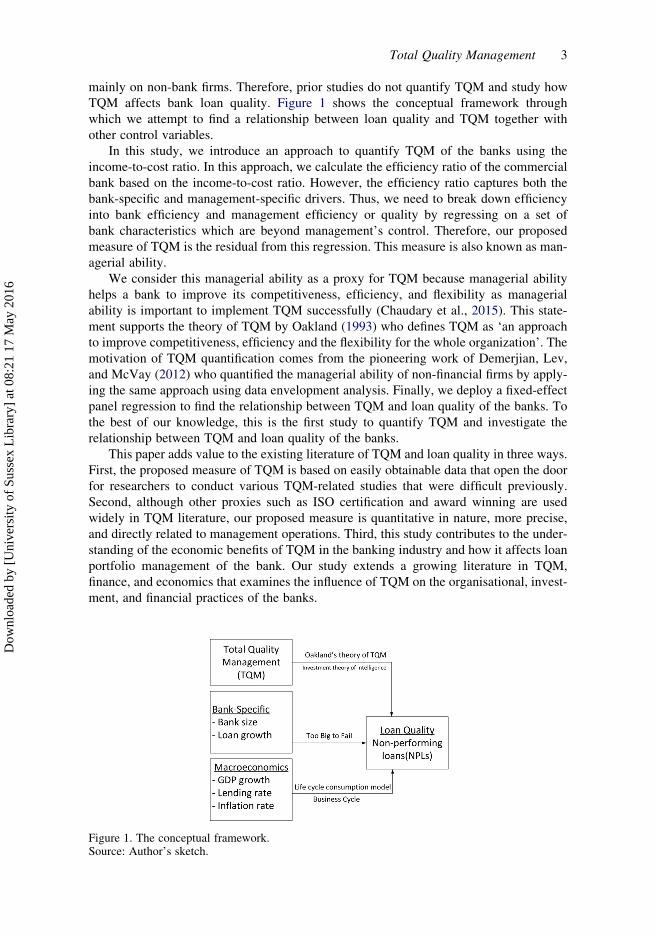
TQM affects bank loan quality. Figure 1 shows the conceptual framework through
which we attempt to find a relationship between loan quality and TQM together with
other control variables.
In this study, we introduce an approach to quantify TQM of the banks using the
income-to-cost ratio. In this approach, we calculate the efficiency ratio of the commercial
bank based on the income-to-cost ratio. However, the efficiency ratio captures both the
bank-specific and management-specific drivers. Thus, we need to break down efficiency
into bank efficiency and management efficiency or quality by regressing on a set of
bank characteristics which are beyond management’s control. Therefore, our proposed
measure of TQM is the residual from this regression. This measure is also known as man-
agerial ability.
We consider this managerial ability as a proxy for TQM because managerial ability
helps a bank to improve its competitiveness, efficiency, and flexibility as managerial
ability is important to implement TQM successfully (Chaudary et al., 2015). This state-
ment supports the theory of TQM by Oakland (1993) who defines TQM as ‘an approach
to improve competitiveness, efficiency and the flexibility for the whole organization’. The
motivation of TQM quantification comes from the pioneering work of Demerjian, Lev,
and McVay (2012) who quantified the managerial ability of non-financial firms by apply-
ing the same approach using data envelopment analysis. Finally, we deploy a fixed-effect
panel regression to find the relationship between TQM and loan quality of the banks. To
the best of our knowledge, this is the first study to quantify TQM and investigate the
relationship between TQM and loan quality of the banks.
This paper adds value to the existing literature of TQM and loan quality in three ways.
First, the proposed measure of TQM is based on easily obtainable data that open the door
for researchers to conduct various TQM-related studies that were difficult previously.
Second, although other proxies such as ISO certification and award winning are used
widely in TQM literature, our proposed measure is quantitative in nature, more precise,
and directly related to management operations. Third, this study contributes to the under-
standing of the economic benefits of TQM in the banking industry and how it affects loan
portfolio management of the bank. Our study extends a growing literature in TQM,
finance, and economics that examines the influence of TQM on the organisational, invest-
ment, and financial practices of the banks.
Figure 1. The conceptual framework.Source: Author’s sketch.
Total Quality Management 3
Dow
nloa
ded
by [
Uni
vers
ity o
f Su
ssex
Lib
rary
] at
08:
21 1
7 M
ay 2
016
This paper proceeds as follows. Section 2 outlines the methodology. Section 3 provides
the empirical results and analysis. The final section provides a conclusion of the study.
2. Methodology
2.1. Measure of TQM
The proposed approach to measure TQM is based on the cost-to-income ratio. In the pre-
vious banking literature, researchers used the cost-to-income ratio (refers to non-interest
expense, less amortisation of intangible assets, divided by net interest income on a fully
taxable equivalent basis and non-interest income) to proxy the bank efficiency related
to management quality. Higher cost-to-income ratio of the bank means that costs are
rising at a rate higher than that for income, which could suggest that the bank is
running inefficiently. Since the cost-to-income ratio shows inefficiency, we compute its
reciprocal, that is, income-to-cost ratio (if income growth is exceeding cost growth, effi-
ciency is increasing), in the following way. Initially, the cost-to-income ratio is divided by
100 to convert it to decimal format from percentage. Thus, the cost-to-income ratio (C) of
the bank i in year t is:
cit =100
c
( )it
, i = 1, . . . ,N, t = 1, . . . ,T (1)
If the cost-to-income ratio of the bank i in year t is C, then the efficiency ratio
(income-to-cost ratio) (q) is:
qit =1
cit
(2)
Based on Equation (2), we measure our efficiency ratio for the bank i in year t.
This efficiency measure is influenced by both the bank-specific and the manager-
specific drivers. Thus, it is necessary to remove the effect of bank efficiency by regressing
on a set of bank characteristics such as bank size [ln (total assets), ln (employees)], bank
age, population effect, capital adequacy, and international operation, which are outside of
the control of the management. It is expected that large banks have better negotiating
power with depositors and borrowers concerning rates and have economies of scale con-
cerning fixed costs. Thus, larger banks can operate more efficiently compared with other
banks, holding TQM constant. We use natural log of total assets and the natural log of the
number of bank employees as proxies for bank size similar to Demerjian et al. (2012) and
Cantrell (2013).
We also expect the more established banks (measured as bank age) to have good repu-
tation that gives them advantage in terms of greater access to investment prospects and
more power in negotiating contracts, thus greater efficiencies. We presume that banks
in highly populated areas (i.e. the seven most populated states in the USA, namely Cali-
fornia, Texas, New York, Florida, Illinois, Pennsylvania, and Ohio) have greater opportu-
nities for investments as well as deposits, thus greater efficiencies holding TQM constant.
It is also expected that well-capitalised (capital adequacy) banks can charge more on
investment and pay less on deposits because of the low risk of bankruptcy (Demirguc-
Kunt, Laeven, & Levine, 2004), thus higher efficiencies.
4 H. Banna et al.
Dow
nloa
ded
by [
Uni
vers
ity o
f Su
ssex
Lib
rary
] at
08:
21 1
7 M
ay 2
016
A bank with multiple countries operation faces complexities and more challenges for
the management to handle properly regardless of management decisions (Demerjian et al.,
2012), thus lower efficiencies. However, some argue that American banks operating in
foreign countries, especially the developing countries, have higher efficiency because
they can easily capture the market using their international reputation.
Since the above characteristics are expected to have impacts on the estimated effi-
ciency, it is needed to take out the effects to have only managerial efficiency. Therefore,
we use the Fama–MacBeth two-step panel regression (Fama & MacBeth, 1973) to
measure TQM (residual of the regression). In the first step, this procedure performs a
cross-sectional regression to estimate the coefficient and standard error for each single
time period, and the second step estimates the overall coefficient and standard error,
which are the average of the coefficient and standard error obtained from the first step.
This study considers the Fama–MacBeth approach because of its time effect design
and unbiased standard errors unlike ordinary least squares (OLS) (Petersen, 2009). Wool-
dridge (2003) and Skoulakis (2008) claim that the use of traditional OLS standard errors
can lead to erroneous inferences because of the presence of cross-sectional and/or serial
dependence of the regressors and the disturbances. Thus, we use the Fama–MacBeth
method to estimate the coefficient and standard errors of the regression. Finally, the
residual of the regression is our proposed measure of TQM.
The Fama–MacBeth approach comes from the standard regression for a panel data set,
which is:
Yit = Xitb+ 1it, i = 1, . . . , N and t = 1, . . . , T , (3)
where assumption:X = 1, mean (m) = 0 , and s2 , 1.
Although the Fama–MacBeth estimation provides better standard errors than OLS,
Petersen (2009) argues that both approaches provide biased standard errors. He suggests
to use the Newey–West standard errors (Newey & West, 1987) for the panel data
which provide very small bias as compared with the OLS and Fama–MacBeth. Therefore,
we also use the Newey–West standard errors-adjusted Fama–MacBeth approach for the
robustness of the standard errors.
Based on Equation (3), the Fama–MacBeth regression can be specified in the follow-
ing equation:
Bank efficiency, qit = b0 + b1 log(total assets)it + b2 log(no. of employees)it+b3 log(bank age)it + b4 population effecti + b5capital adequacyit+
b6international operationit + Residual (TQM), 1it.
(4)
The residual from Equation (4) is the proposed measure of TQM.
2.2. Data selection
We studied the annual data of commercial banks operating in the USA. The data were
obtained from the SNL Financial database from 1991 to 2013 for bank-related variables
throughout the study. The sample period of 1991–2013 was selected based on the data
availability on SNL Financial. We consider insured US chartered commercial banks
having consolidated assets of $300 million and more as of 31 December 2013. Savings
banks, investment banks, cooperative banks, bank holding companies, and other non-
Total Quality Management 5
Dow
nloa
ded
by [
Uni
vers
ity o
f Su
ssex
Lib
rary
] at
08:
21 1
7 M
ay 2
016
bank financial firms are excluded from the sample due to the different business scopes,
capital structure, and regulatory environment (Fenech et al., 2014) to ensure data
comparability.
Furthermore, the banks established after 1990 are eliminated because our study period
starts from 1991. In case of mergers and acquisitions, we treat as separate entities both the
target and acquiring banks if they continue to file financial reports separately; otherwise,
we exclude them from the sample (Fenech et al., 2014). We eliminate the banks not having
at least three years of consecutive financial reports from our sample (Fenech et al., 2014;
Roodman, 2009). The final sample size is 581 banks and 13,303 observations. The bank-
year observations vary from year to year due to some missing values. We collect the
macroeconomic data from the World Bank’s database. To measure loan quality, we use
non-performing loans (NPLs) ratio, similar to Louzis et al. (2012) and Clair (1992). We
expect that better implementation of TQM can lower NPLs; thus, higher loan quality as
quality management facilitates better credit analysis, better monitoring skills, and
higher revenue generation (Louzis et al., 2012). Therefore, we expect a negative relation
between NPLs and TQM.
3. Results and analysis
3.1. TQM measure
Table 1 presents the year-wise mean efficiency ratio of the US commercial banks using
Equation (2).
Table 1. The year-wise mean efficiency ratio of the US commercial banks.
Year Mean Median
1991 0.346 0.3641992 0.373 0.3931993 0.374 0.3941994 0.383 0.3951995 0.399 0.4051996 0.416 0.4171997 0.421 0.4291998 0.414 0.4231999 0.404 0.4132000 0.402 0.4072001 0.402 0.4062002 0.412 0.4242003 0.400 0.4092004 0.394 0.4052005 0.407 0.4102006 0.402 0.4032007 0.387 0.3932008 0.372 0.3802009 0.347 0.3622010 0.352 0.3692011 0.345 0.3542012 0.345 0.3542013 0.328 0.339Overall (13,303) 0.384 0.395
6 H. Banna et al.
Dow
nloa
ded
by [
Uni
vers
ity o
f Su
ssex
Lib
rary
] at
08:
21 1
7 M
ay 2
016
The overall mean and median efficiency ratio of the US commercial banks are 0.384
and 0.395, respectively. The efficiency ratio value based on this method is not constrained
between zero and one. It could be negative and more than one. We calculated the effi-
ciency ratio from the year 1991–2013, where the lowest efficiency score (0.328) was in
2013, and the highest efficiency score (0.421) was in 1997. Thus, bank efficiency (from
the management context) is the initial point to measure TQM.
Table 2 presents the results of the Fama–MacBeth regression and Newey–West stan-
dard errors-adjusted Fama–MacBeth regression based on Equation (4).
The regression results indicate that the log of total assets, employees, and bank age are
statistically significant at the 1% level. Bank size (total assets) and bank age are positively
related with bank efficiency as expected and similar to Cantrell (2013). However, bank
size (employee) does not show a positive relationship with bank efficiency. Population
effect, capital adequacy, and international operations have a significant relationship
with bank efficiency at the 1% level. International operation and capital adequacy have
a negative and positive relationship, respectively, with bank efficiency which is in line
with Demerjian et al. (2012). However, the population effect has a negative relationship
with bank efficiency. In Fama–MacBeth and Newey–West corrected standard errors,
we do not find any changes in the direction of the coefficient, but the reverse applies to
standard errors. Based on the average R2, these variables explain bank efficiency by
25.88%. However, in order to get the adjusted R2 value and the robustness of the
method, we run OLS and Tobit regressions. The results suggest that these variables can
explain 22.58% of bank efficiency and the signs of the variables do not change. This
suggests that the efficiency ratio is affected by the bank factors that need to be removed
Table 2. Converting bank efficiency to TQM.
Bank efficiency to TQM
VariablesPredicted
sign Fama–MacBethFama–MacBeth (Newey–
West corrected SE)
Ln (Total Assets) + 0.138∗∗∗ (0.003) 0.138∗∗∗ (0.005)Ln (Employees) + 20.133∗∗∗ (0.004) 20.133∗∗∗ (0.005)Ln (Bank Age) + 0.025∗∗∗ (0.003) 0.025∗∗∗ (0.005)Population Effect (CA, TX, NY,
FL, IL, PA, OH = 1, Otherwise= 0)
+ 20.021∗∗∗ (0.003) 20.021∗∗∗ (0.004)
Capital adequacy + 0.007∗∗∗ (0.001) 0.007∗∗∗ (0.001)International Operation
(International Operation = 1,Otherwise = 0)
+ 20.076∗∗∗ (0.004) 20.076∗∗∗ (0.005)
Year fixed effect included Yes YesNumber of observations 13,303 13,303Time periods 23 23F(6, 22) 671.56 348.99Prob . F .0000 .0000Average R2 0.2588 0.2588Adjusted R2 (from OLS) 0.2258 0.2258
Note: Standard errors are in parentheses.∗Statistical significance at the 10% level for two-tailed tests.∗∗Statistical significance at the 5% level for two-tailed tests.∗∗∗Statistical significance at the 1% level for two-tailed tests.
Total Quality Management 7
Dow
nloa
ded
by [
Uni
vers
ity o
f Su
ssex
Lib
rary
] at
08:
21 1
7 M
ay 2
016
from the efficiency ratio to measure TQM. Hence, we use the residual from the regression
as our proposed TQM measure. which is the main dependent variable of this study.
3.2. Descriptive statistics
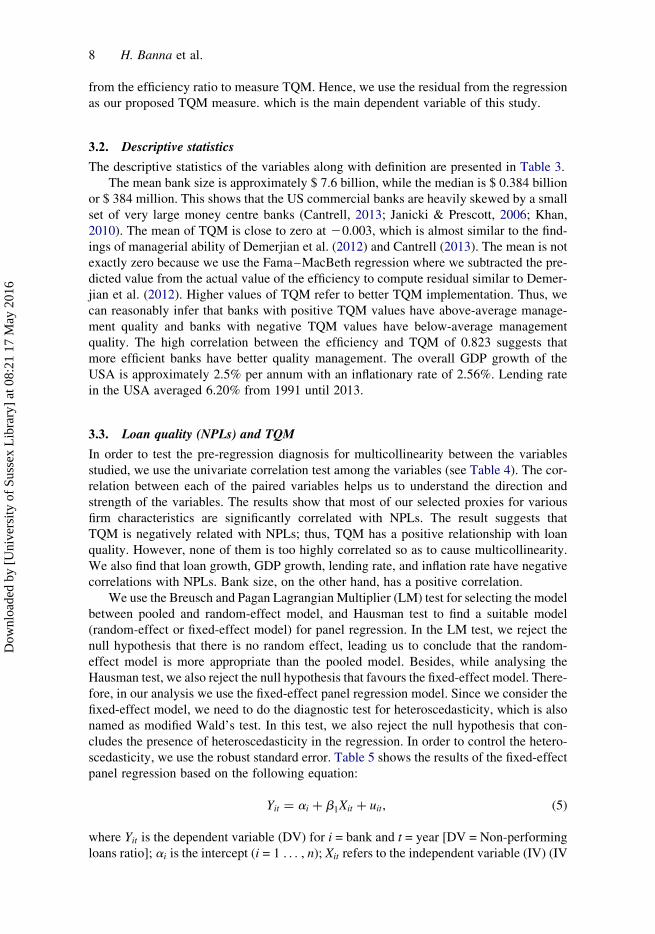
The descriptive statistics of the variables along with definition are presented in Table 3.
The mean bank size is approximately $ 7.6 billion, while the median is $ 0.384 billion
or $ 384 million. This shows that the US commercial banks are heavily skewed by a small
set of very large money centre banks (Cantrell, 2013; Janicki & Prescott, 2006; Khan,
2010). The mean of TQM is close to zero at 20.003, which is almost similar to the find-
ings of managerial ability of Demerjian et al. (2012) and Cantrell (2013). The mean is not
exactly zero because we use the Fama–MacBeth regression where we subtracted the pre-
dicted value from the actual value of the efficiency to compute residual similar to Demer-
jian et al. (2012). Higher values of TQM refer to better TQM implementation. Thus, we
can reasonably infer that banks with positive TQM values have above-average manage-
ment quality and banks with negative TQM values have below-average management
quality. The high correlation between the efficiency and TQM of 0.823 suggests that
more efficient banks have better quality management. The overall GDP growth of the
USA is approximately 2.5% per annum with an inflationary rate of 2.56%. Lending rate
in the USA averaged 6.20% from 1991 until 2013.
3.3. Loan quality (NPLs) and TQM
In order to test the pre-regression diagnosis for multicollinearity between the variables
studied, we use the univariate correlation test among the variables (see Table 4). The cor-
relation between each of the paired variables helps us to understand the direction and
strength of the variables. The results show that most of our selected proxies for various
firm characteristics are significantly correlated with NPLs. The result suggests that
TQM is negatively related with NPLs; thus, TQM has a positive relationship with loan
quality. However, none of them is too highly correlated so as to cause multicollinearity.
We also find that loan growth, GDP growth, lending rate, and inflation rate have negative
correlations with NPLs. Bank size, on the other hand, has a positive correlation.
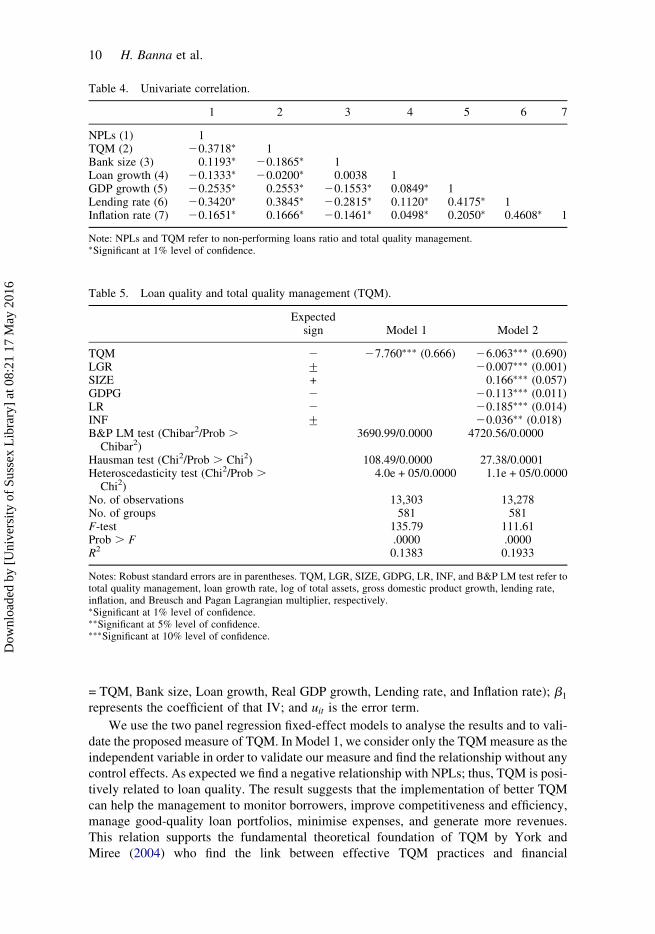
We use the Breusch and Pagan Lagrangian Multiplier (LM) test for selecting the model
between pooled and random-effect model, and Hausman test to find a suitable model
(random-effect or fixed-effect model) for panel regression. In the LM test, we reject the
null hypothesis that there is no random effect, leading us to conclude that the random-
effect model is more appropriate than the pooled model. Besides, while analysing the
Hausman test, we also reject the null hypothesis that favours the fixed-effect model. There-
fore, in our analysis we use the fixed-effect panel regression model. Since we consider the
fixed-effect model, we need to do the diagnostic test for heteroscedasticity, which is also
named as modified Wald’s test. In this test, we also reject the null hypothesis that con-
cludes the presence of heteroscedasticity in the regression. In order to control the hetero-
scedasticity, we use the robust standard error. Table 5 shows the results of the fixed-effect
panel regression based on the following equation:
Yit = ai + b1Xit + uit, (5)
where Yit is the dependent variable (DV) for i = bank and t = year [DV = Non-performing
loans ratio]; ai is the intercept (i = 1 . . . , n); Xit refers to the independent variable (IV) (IV
8 H. Banna et al.
Dow
nloa
ded
by [
Uni
vers
ity o
f Su
ssex
Lib
rary
] at
08:
21 1
7 M
ay 2
016
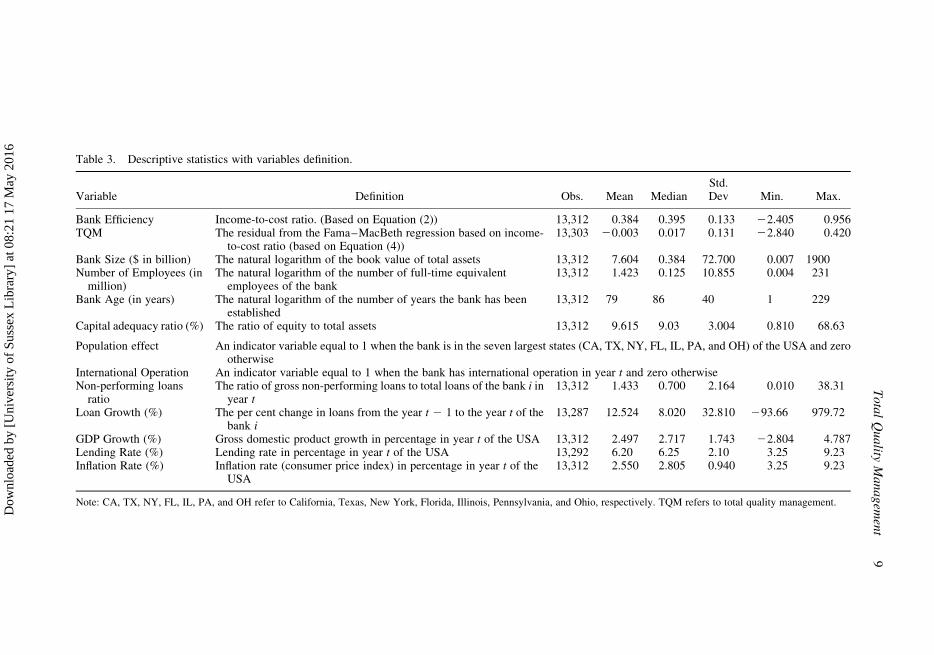
Table 3. Descriptive statistics with variables definition.
Variable Definition Obs. Mean MedianStd.Dev Min. Max.
Bank Efficiency Income-to-cost ratio. (Based on Equation (2)) 13,312 0.384 0.395 0.133 22.405 0.956TQM The residual from the Fama–MacBeth regression based on income-
to-cost ratio (based on Equation (4))13,303 20.003 0.017 0.131 22.840 0.420
Bank Size ($ in billion) The natural logarithm of the book value of total assets 13,312 7.604 0.384 72.700 0.007 1900Number of Employees (in
million)The natural logarithm of the number of full-time equivalent
employees of the bank13,312 1.423 0.125 10.855 0.004 231
Bank Age (in years) The natural logarithm of the number of years the bank has beenestablished
13,312 79 86 40 1 229
Capital adequacy ratio (%) The ratio of equity to total assets 13,312 9.615 9.03 3.004 0.810 68.63
Population effect An indicator variable equal to 1 when the bank is in the seven largest states (CA, TX, NY, FL, IL, PA, and OH) of the USA and zerootherwise
International Operation An indicator variable equal to 1 when the bank has international operation in year t and zero otherwiseNon-performing loans
ratioThe ratio of gross non-performing loans to total loans of the bank i in
year t13,312 1.433 0.700 2.164 0.010 38.31
Loan Growth (%) The per cent change in loans from the year t 2 1 to the year t of thebank i
13,287 12.524 8.020 32.810 293.66 979.72
GDP Growth (%) Gross domestic product growth in percentage in year t of the USA 13,312 2.497 2.717 1.743 22.804 4.787Lending Rate (%) Lending rate in percentage in year t of the USA 13,292 6.20 6.25 2.10 3.25 9.23Inflation Rate (%) Inflation rate (consumer price index) in percentage in year t of the
USA13,312 2.550 2.805 0.940 3.25 9.23
Note: CA, TX, NY, FL, IL, PA, and OH refer to California, Texas, New York, Florida, Illinois, Pennsylvania, and Ohio, respectively. TQM refers to total quality management.
To
tal
Qu
ality
Ma
na
gem
ent
9
Dow
nloa
ded
by [
Uni
vers
ity o
f Su
ssex
Lib
rary
] at
08:
21 1
7 M
ay 2
016
= TQM, Bank size, Loan growth, Real GDP growth, Lending rate, and Inflation rate); b1
represents the coefficient of that IV; and uit is the error term.
We use the two panel regression fixed-effect models to analyse the results and to vali-
date the proposed measure of TQM. In Model 1, we consider only the TQM measure as the
independent variable in order to validate our measure and find the relationship without any
control effects. As expected we find a negative relationship with NPLs; thus, TQM is posi-
tively related to loan quality. The result suggests that the implementation of better TQM
can help the management to monitor borrowers, improve competitiveness and efficiency,
manage good-quality loan portfolios, minimise expenses, and generate more revenues.
This relation supports the fundamental theoretical foundation of TQM by York and
Miree (2004) who find the link between effective TQM practices and financial
Table 5. Loan quality and total quality management (TQM).
Expectedsign Model 1 Model 2
TQM 2 27.760∗∗∗ (0.666) 26.063∗∗∗ (0.690)LGR + 20.007∗∗∗ (0.001)SIZE + 0.166∗∗∗ (0.057)GDPG 2 20.113∗∗∗ (0.011)LR 2 20.185∗∗∗ (0.014)INF + 20.036∗∗ (0.018)B&P LM test (Chibar2/Prob .
Chibar2)3690.99/0.0000 4720.56/0.0000
Hausman test (Chi2/Prob . Chi2) 108.49/0.0000 27.38/0.0001Heteroscedasticity test (Chi2/Prob .
Chi2)4.0e + 05/0.0000 1.1e + 05/0.0000
No. of observations 13,303 13,278No. of groups 581 581F-test 135.79 111.61Prob . F .0000 .0000R2 0.1383 0.1933
Notes: Robust standard errors are in parentheses. TQM, LGR, SIZE, GDPG, LR, INF, and B&P LM test refer tototal quality management, loan growth rate, log of total assets, gross domestic product growth, lending rate,inflation, and Breusch and Pagan Lagrangian multiplier, respectively.∗Significant at 1% level of confidence.∗∗Significant at 5% level of confidence.∗∗∗Significant at 10% level of confidence.
Table 4. Univariate correlation.
1 2 3 4 5 6 7
NPLs (1) 1TQM (2) 20.3718∗ 1Bank size (3) 0.1193∗ 20.1865∗ 1Loan growth (4) 20.1333∗ 20.0200∗ 0.0038 1GDP growth (5) 20.2535∗ 0.2553∗ 20.1553∗ 0.0849∗ 1Lending rate (6) 20.3420∗ 0.3845∗ 20.2815∗ 0.1120∗ 0.4175∗ 1Inflation rate (7) 20.1651∗ 0.1666∗ 20.1461∗ 0.0498∗ 0.2050∗ 0.4608∗ 1
Note: NPLs and TQM refer to non-performing loans ratio and total quality management.∗Significant at 1% level of confidence.
10 H. Banna et al.
Dow
nloa
ded
by [
Uni
vers
ity o
f Su
ssex
Lib
rary
] at
08:
21 1
7 M
ay 2
016
performance. The relation also supports Oakland’s theory of TQM (Oakland, 1993), the
bad management hypothesis (Berger & DeYoung, 1997), and the investment theory of
intelligence (Cattell, 1987).
Further, we extend our analysis by adding bank-specific and macroeconomic variables
as control variables for the robustness of the model. We find that loan growth has a nega-
tive relationship with NPLs that is consistent with Clair (1992) who found the same results
using US data. This can be explained by the fact that on average the US commercial banks
can monitor loan portfolios effectively and can improve the loan quality by implementing
better TQM, especially during the crisis period (Berger & DeYoung, 1997).
Furthermore, we find a positive relationship between NPLs and bank size in Model
2. The direction of the variables supports the ‘Too Big to Fail’ hypothesis. Therefore,
the large commercial banks of the USA take excessive risks by increasing their leverage
(Louzis et al., 2012) and cannot implement TQM properly, thus lower loan quality. GDP
growth is negatively related to NPLs. This finding is consistent with Louzis et al. (2012)
and suggests that an expansionary economy features relatively low NPL as both consu-
mers and banks have an adequate flow of income and revenues to deal with their debts,
thus better loan quality. This result also shows a strong dependency of repayment of the
loans on the business cycle (Quagliariello, 2007). Further, we find the expected negative
relationship of lending rate with NPLs similar to Rinaldi and Sanchis-Arellano (2006). The
evidence suggests that loan default depends on income and the lending rates because the
probability of default depends on current income which is linked to the uncertainty regard-
ing future income and lending rates, lower NPLs, and better loan quality. Finally, we find
that inflation is negatively related to NPLs, similar to Shu (2002) but differs from Rinaldi
and Sanchis-Arellano (2006). An inflation rate increase causes a decline in bank custo-
mers’ loan default rates, thus decreasing NPLs of the bank and enhancing loan quality.
Thus, the implementation of better TQM can improve the loan quality of the bank.
4. Conclusion
In our study, we use fixed-effect panel regression to determine the relationship between
TQM and loan quality in the US commercial banking sectors. We use our proposed
measure of TQM as the main independent variable and find that TQM is positively
related to loan quality. The implementation of better TQM can help the management to
monitor borrowers, improve competition and efficiency, manage good-quality loan port-
folios, minimise expenses, and generate more revenues. Macroeconomic variables and
bank-specific variables such as the real GDP growth rate, lending rate, inflation rate,
bank size, and loan growth rate affect the loan quality.
Our results present several implications with regard to regulation, TQM implemen-
tation, and policy for the banking industry. In particular, there is evidence that NPLs
may serve as important signals for future troubled loans. The results also suggest that reg-
ulators should emphasise TQM to identify banks with possible loan quality deterioration.
Further, this research suggests investors and regulators that managers with more ability
can implement TQM successfully and make decision efficiently, and thus reduce financial
risk. Additionally, the aforesaid relations might be useful for forecasting and stress-testing
purposes for both regulators and banks (Louzis et al., 2012). For example, micro-stress
testing could be implemented on bank-specific factors to assess future trouble and ade-
quacy of loan loss provision that may arise in particular banks by indicating relatively
high NPLs.
Total Quality Management 11
Dow
nloa
ded
by [
Uni
vers
ity o
f Su
ssex
Lib
rary
] at
08:
21 1
7 M
ay 2
016
The measure of TQM, although an improvement over current measures, has limit-
ations. First, we consider only the commercial banks of the USA, so future researchers
can extend this to other financial and non-financial institutions. Second, in our second
stage of measure, we use some characteristics which are beyond the control of the man-
agers that can be refined in the future research. For example, we use population effect
that is applicable for the USA, but not for all countries. Hence, future researchers may con-
sider incorporating other factors in the second stage based on different geographical con-
texts. Another limitation is that our measure is the residual from a model, so there is a
possibility that a portion of this residual reflects factors which are not attributable to TQM.
Despite these limitations, our measure of TQM is available for a broad section of firms
and exhibits a significant manager-specific component. Future researchers may consider
our proxy of TQM to find the relationship with abnormal returns, operating income, profit-
ability, and capital expenditure of the firm. In sum, an association between TQM and loan
quality allows us to expand our knowledge of the specific role of TQM in bank perform-
ance, management decision, and managing loan portfolios.
Acknowledgements
The authors would like to thank Dr Chan Sok Gee, Dr Wan Marhaini Binti Wan Ahmad, Dr IzlinBinti Ismail, Dr Fauzi Bin Zainir, Mr Sohel Rana, Mr Aslam Mia, Mr Abu Hanifa Noman BinAlam, and the anonymous reviewers for their critical review and precious comments that helpedimprove the manuscript substantially.
Disclosure statement
No potential conflict of interest was reported by the authors.
Funding
The first author would like to thank University of Malaya for funding his doctoral studies through?Bright Spark Program (BSP).
ORCID
Hasanul Banna http://orcid.org/0000-0002-6902-8525
References
Aarts, F. M., & Vos, E. (2001). The impact of ISO registration on New Zealand firms’ performance:A financial perspective. The TQM Magazine, 13(3), 180–191.
Barr, R. S., & Siems, T. F. (1997). Bank failure prediction using DEA to measure managementquality. In R. S. Barr, R. V. Helgason, & J. L. Kennington (Eds.), Interfaces in computerscience and operations research (pp. 341–365). New York (NY): Springer.
Barth, M. E., & Landsman, W. R. (2010). How did financial reporting contribute to the financialcrisis? European Accounting Review, 19(3), 399–423.
Berger, A. N., & DeYoung, R. (1997). Problem loans and cost efficiency in commercial banks.Journal of Banking & Finance, 21(6), 849–870.
Boulter, L., Bendell, T., & Dahlgaard, J. (2013). Total quality beyond North America: A compara-tive analysis of the performance of European Excellence Award winners. InternationalJournal of Operations & Production Management, 33(2), 197–215.
Cantrell, B. (2013). Bank managerial ability and accounting: Do better managers report higherquality loan loss reserves and fair values? (Doctor of Philosophy). University of Texas at
12 H. Banna et al.
Dow
nloa
ded
by [
Uni
vers
ity o
f Su
ssex
Lib
rary
] at
08:
21 1
7 M
ay 2
016
Austin. Retrieved from http://repositories.lib.utexas.edu/bitstream/handle/2152/21752/CANTRELL-DISSERTATION-2013.pdf?sequence=1
Cattell, R. B. (1987). Intelligence: Its structure, growth and action. Oxford: Elsevier.Chaudary, S., Zafar, S., & Salman, M. (2015). Does total quality management still shine? Re-exam-
ining the total quality management effect on financial performance. Total QualityManagement & Business Excellence, 26(7–8), 811–824.
Ciptono, W. S., Ibrahim, A. R., Sulaiman, A., & Kadir, S. L. S. A. (2011). Sustainability of TQMimplementation model in the Indonesia’s oil and gas industry: An assessment of structuralrelations model fit. Gadjah Mada International Journal of Business, 13(1), 1–20.
Clair, R. T. (1992). Loan growth and loan quality: Some preliminary evidence from Texas banks.Economic Review, (3rd quarter), 9–22.
Curcio, D., & Hasan, I. (2015). Earnings and capital management and signaling: The use of loan-lossprovisions by European banks. The European Journal of Finance, 21(1), 26–50.
Demerjian, P., Lev, B., & McVay, S. (2012). Quantifying managerial ability: A new measure andvalidity tests. Management Science, 58(7), 1229–1248.
Demirguc-Kunt, A., Laeven, L., & Levine, R. (2004). Regulations, market structure, institutions, andthe cost of financial intermediation. Journal of Money, Credit and Banking, 36(3), 593–622.
Duh, R.-R., Hsu, A. W.-H., & Huang, P. W. (2012). Determinants and performance effect of TQMpractices: An integrated model approach. Total Quality Management and BusinessExcellence, 23(5–6), 689–701.
Eriksson, H., & Hansson, J. (2003). The impact of TQM on financial performance. MeasuringBusiness Excellence, 7(1), 36–50.
Fama, E. F., & MacBeth, J. D. (1973). Risk, return, and equilibrium: Empirical tests. The Journal ofPolitical Economy, 81, 607–636.
Fenech, J. P., Yap, Y. K., & Shafik, S. (2014). Can the Chinese banking system continue to growwithout sacrificing loan quality? Journal of International Financial Markets Institutions &Money, 31, 315–330.
Giulioni, G. (2015). Policy interest rate, loan portfolio management and bank liquidity. The NorthAmerican Journal of Economics and Finance, 31, 52–74.
Habib, A., & Hossain, M. (2013). CEO/CFO characteristics and financial reporting quality: Areview. Research in Accounting Regulation, 25(1), 88–100.
Hendricks, K. B., & Singhal, V. R. (2001). The long-run stock price performance of firms with effec-tive TQM programs. Management Science, 47(3), 359–368.
Janicki, H., & Prescott, E. S. (2006). Changes in the size distribution of US banks: 1960-2005. FRBRichmond Economic Quarterly, 92(4), 291–316.
Jin, J. Y., Kanagaretnam, K., & Lobo, G. J. (2011). Ability of accounting and audit quality variablesto predict bank failure during the financial crisis. Journal of Banking & Finance, 35(11),2811–2819.
Khan, U. (2010). Does fair value accounting contribute to systemic risk in the banking industry?(Columbia Business School Research Paper).
Lawrence, E. C. (1995). Consumer default and the life cycle model. Journal of Money, Credit andBanking, 27, 939–954.
Louzis, D. P., Vouldis, A. T., & Metaxas, V. L. (2012). Macroeconomic and bank-specific determi-nants of non-performing loans in Greece: A comparative study of mortgage, business and con-sumer loan portfolios. Journal of Banking & Finance, 36(4), 1012–1027.
Modi, S. B., & Mishra, S. (2011). What drives financial performance–resource efficiency or resourceslack?: Evidence from US based manufacturing firms from 1991 to 2006. Journal ofOperations Management, 29(3), 254–273.
Modigliani, F., & Brumberg, R. (1954). Utility analysis and the consumption function: An interpret-ation of cross-section data. In K. K. Kurihara (Eds.), Post Keynesian Economics. NewBrunswick (NJ): Ruthers University Press.
Newey, W., & West, K. (1987). A simple, positive semi-definite, heteroskedasticity and autocorrela-tion consistent covariance matrix. Econometrica, 55(3), 703–708.
Oakland, J. (1993). Total quality management: The route to improving performance. Oxford:Butterworth-Heinemann.
Petersen, M. A. (2009). Estimating standard errors in finance panel data sets: Comparing approaches.Review of Financial Studies, 22(1), 435–480.
Total Quality Management 13
Dow
nloa
ded
by [
Uni
vers
ity o
f Su
ssex
Lib
rary
] at
08:
21 1
7 M
ay 2
016
Quagliariello, M. (2007). Banks’ riskiness over the business cycle: A panel analysis on Italian inter-mediaries. Applied Financial Economics, 17(2), 119–138.
Rinaldi, L., & Sanchis-Arellano, A. (2006). Household debt sustainability: What explains householdnon-performing loans? An empirical analysis. Retrieved from SSRN 872528.
Roodman, D. (2009). A note on the theme of too many instruments∗. Oxford Bulletin of Economicsand Statistics, 71(1), 135–158.
Shu, C. (2002). The impact of macroeconomic environment on the asset quality of Hong Kong’sbanking sector (Hong Kong Monetary Authority Research Memorandums, 1–26).
Sinkey, J. F.Jr., & Greenawalt, M. B. (1991). Loan-loss experience and risk-taking behavior at largecommercial banks. Journal of Financial Services Research, 5(1), 43–59.
Skoulakis, G. (2008). Panel data inference in finance: Least-squares vs fama-macbeth. Retrievedfrom SSRN 1108865
Wooldridge, J. M. (2003). Cluster-sample methods in applied econometrics. American EconomicReview, 93, 133–138.
York, K. M., & Miree, C. E. (2004). Causation or covariation: An empirical re-examination of thelink between TQM and financial performance. Journal of Operations Management, 22(3),291–311.
14 H. Banna et al.
Dow
nloa
ded
by [
Uni
vers
ity o
f Su
ssex
Lib
rary
] at
08:
21 1
7 M
ay 2
016