how dom can help you determine the true meaning of market...
TRANSCRIPT

• What is depth of market?
• What does the data mean?
• What do changes in the data mean?
• How DOM can help you find support and resistance
• How DOM can help you get better fills for entry and exit
• How I use DOM to predict extremely short-term swings
• How DOM can help you determine the true meaning of market reactions to news
• How DOM can tell you ahead of time whether there is accumulation of distribution
• How DOM can trick you into erroneous conclusions
• Tips, tricks, and techniques for using DOM
• Detailed methods I have developed for daytrading with DOM
2/24/2014 ©2014 JAKE BERNSTEIN/NETWORK PRESS INC.
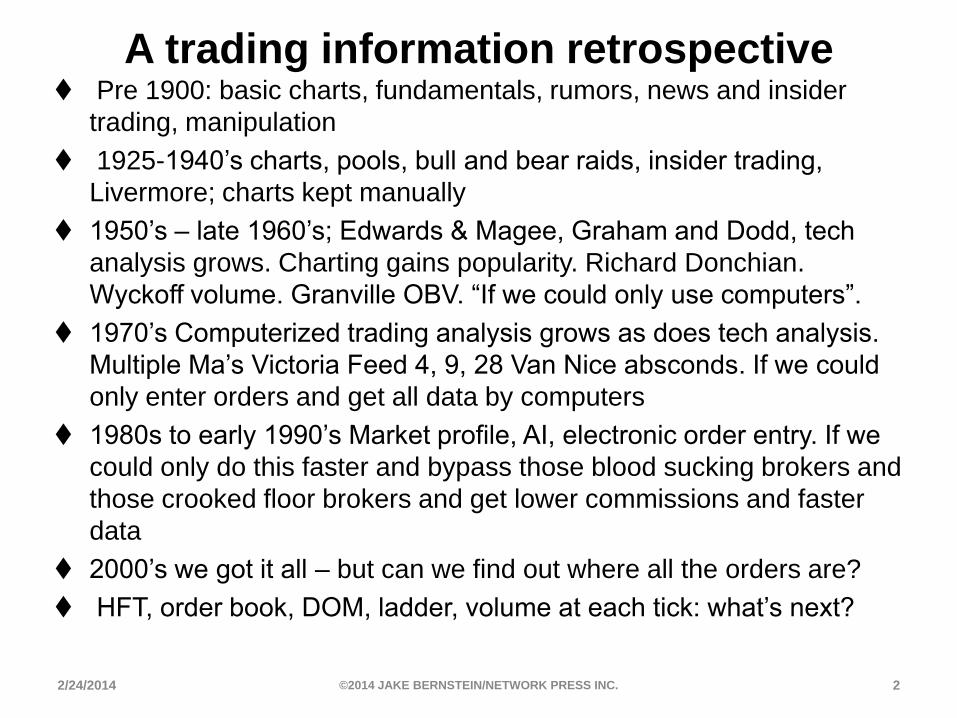
A trading information retrospective
Pre 1900: basic charts, fundamentals, rumors, news and insider
trading, manipulation
1925-1940’s charts, pools, bull and bear raids, insider trading,
Livermore; charts kept manually
1950’s – late 1960’s; Edwards & Magee, Graham and Dodd, tech
analysis grows. Charting gains popularity. Richard Donchian.
Wyckoff volume. Granville OBV. “If we could only use computers”.
1970’s Computerized trading analysis grows as does tech analysis.
Multiple Ma’s Victoria Feed 4, 9, 28 Van Nice absconds. If we could
only enter orders and get all data by computers
1980s to early 1990’s Market profile, AI, electronic order entry. If we
could only do this faster and bypass those blood sucking brokers and
those crooked floor brokers and get lower commissions and faster
data
2000’s we got it all – but can we find out where all the orders are?
HFT, order book, DOM, ladder, volume at each tick: what’s next?
2/24/2014 ©2014 JAKE BERNSTEIN/NETWORK PRESS INC. 2
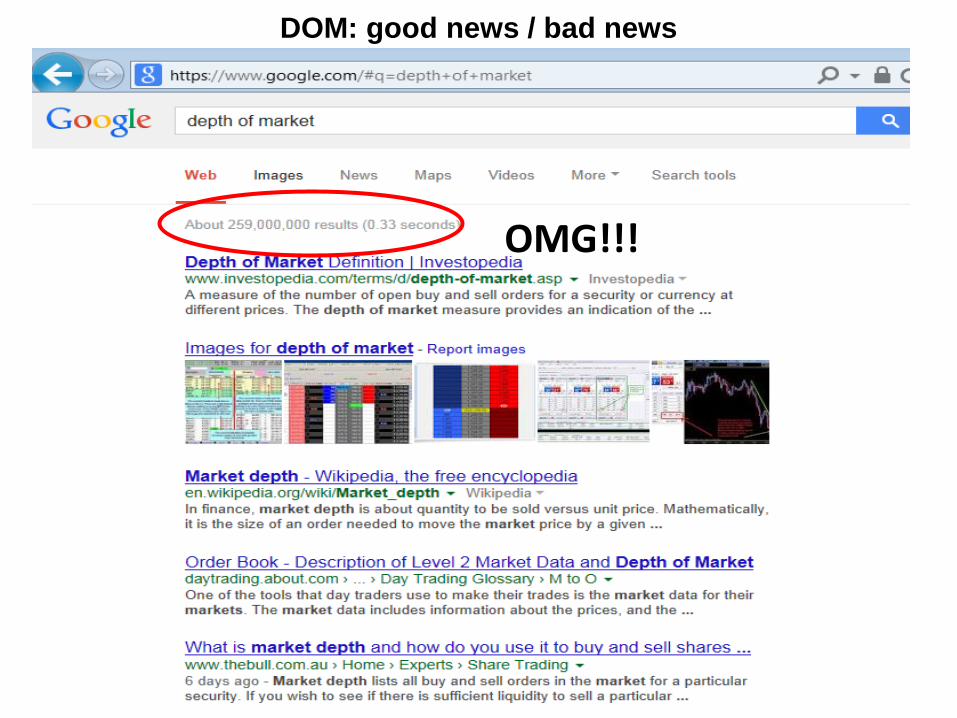
DOM: good news / bad news
2/24/2014 ©2014 JAKE BERNSTEIN/NETWORK PRESS INC. 3
OMG!!!
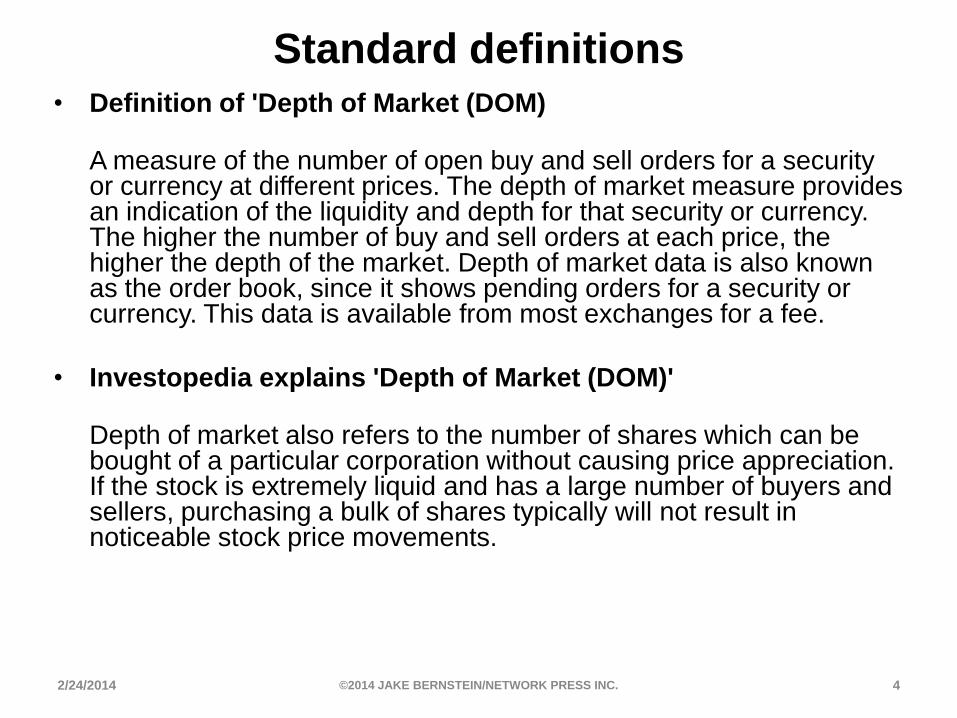
Standard definitions • Definition of 'Depth of Market (DOM)
A measure of the number of open buy and sell orders for a security or currency at different prices. The depth of market measure provides an indication of the liquidity and depth for that security or currency. The higher the number of buy and sell orders at each price, the higher the depth of the market. Depth of market data is also known as the order book, since it shows pending orders for a security or currency. This data is available from most exchanges for a fee.
• Investopedia explains 'Depth of Market (DOM)'
Depth of market also refers to the number of shares which can be bought of a particular corporation without causing price appreciation. If the stock is extremely liquid and has a large number of buyers and sellers, purchasing a bulk of shares typically will not result in noticeable stock price movements.
2/24/2014 ©2014 JAKE BERNSTEIN/NETWORK PRESS INC. 4
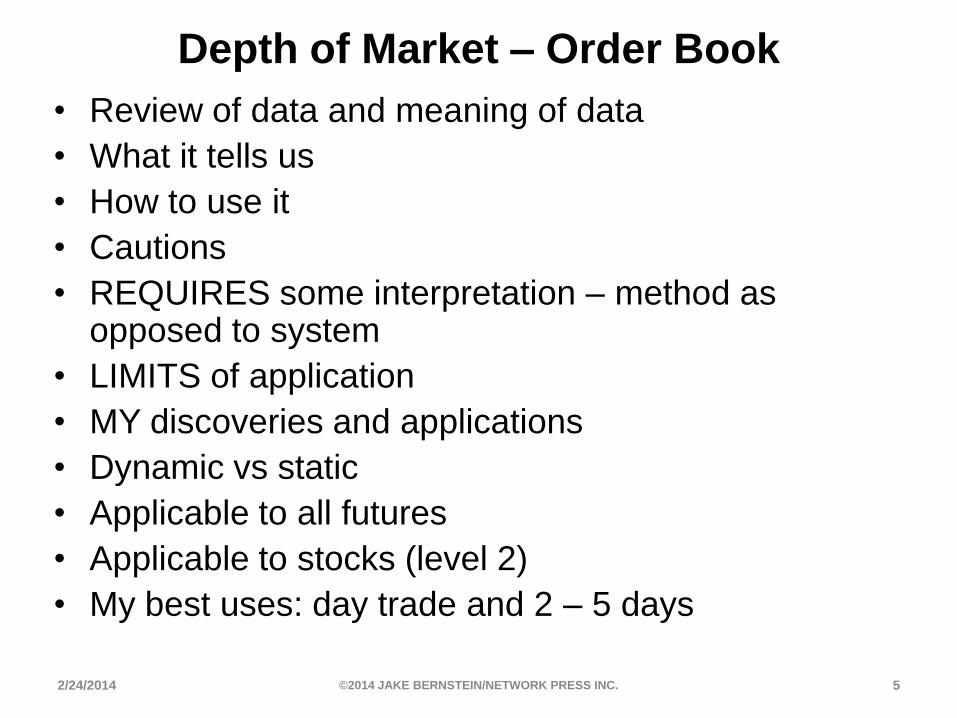
Depth of Market – Order Book
• Review of data and meaning of data
• What it tells us
• How to use it
• Cautions
• REQUIRES some interpretation – method as opposed to system
• LIMITS of application
• MY discoveries and applications
• Dynamic vs static
• Applicable to all futures
• Applicable to stocks (level 2)
• My best uses: day trade and 2 – 5 days
2/24/2014 ©2014 JAKE BERNSTEIN/NETWORK PRESS INC. 5
How I Use DOM
Not in order of importance
• Support and resistance
• Accumulation of positions
• Distribution of positions
• Optimum entry and exit prices
• Prior to major reports
• Assessment of market reaction to news
• My version of HFT day trades
• Short term trades
• Determine anomalies in balance of buy / sell intentions
• Changing stops and targets dynamically based on conditions in DOM
• More applications being developed
• FOCUS ON PROCESS and UNDERSTANDING
2/24/2014 ©2014 JAKE BERNSTEIN/NETWORK PRESS INC. 6
Market Generated Information (MGI)
• What is MGI?
• Pit traders and MGI – the edge – Tom Baldwin
• Buying the bid selling the offer
• The million widget dilemma
• Now that the floor broker is an anachronism
• What else is there?
• Levels of MGI
• How we DISTORT MGI and why
• Why MGI is the highest level of info
• HFT the ultimate application of MGI
• We can’t compete with HFT BUT we can get the edge…
• Warren Buffett acts to prevent early info access by HFTs
• DSI and HFT requests
• WAYS TO TRADE: CONSIDER THIS FIRST! It’s critical to define your space and
develop that space with powerful tools
• KNOW WHAT YOU CAN DO and maximize it
• DOM can be used by ALL TRADERS – I will show you how
• But remember DOM is a method not a system at this point
2/24/2014 ©2014 JAKE BERNSTEIN/NETWORK PRESS INC. 7
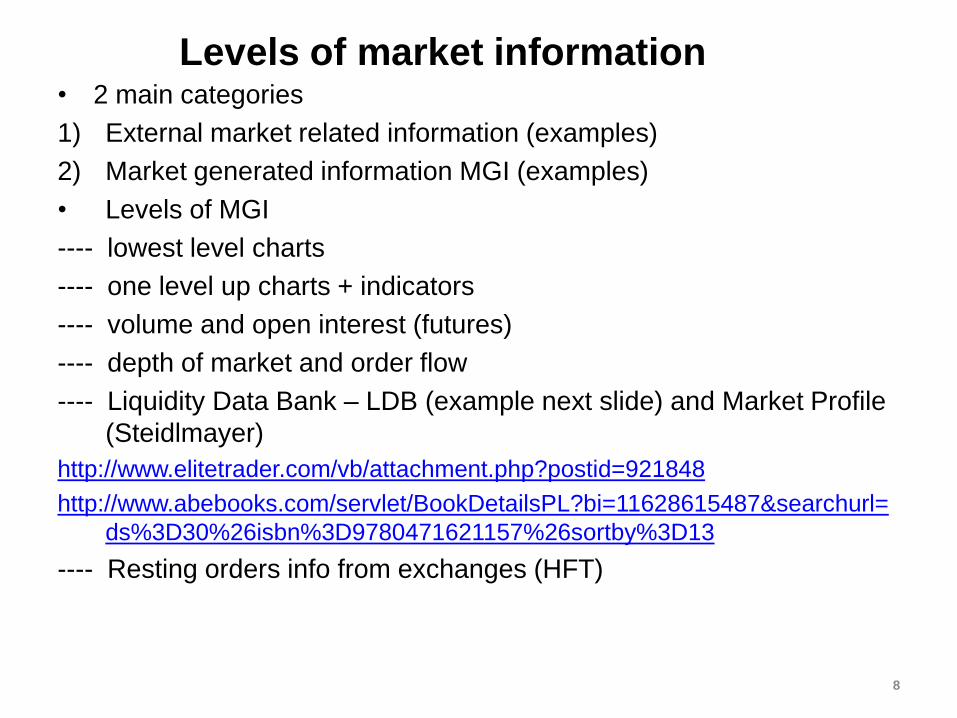
Levels of market information • 2 main categories
1) External market related information (examples)
2) Market generated information MGI (examples)
• Levels of MGI
---- lowest level charts
---- one level up charts + indicators
---- volume and open interest (futures)
---- depth of market and order flow
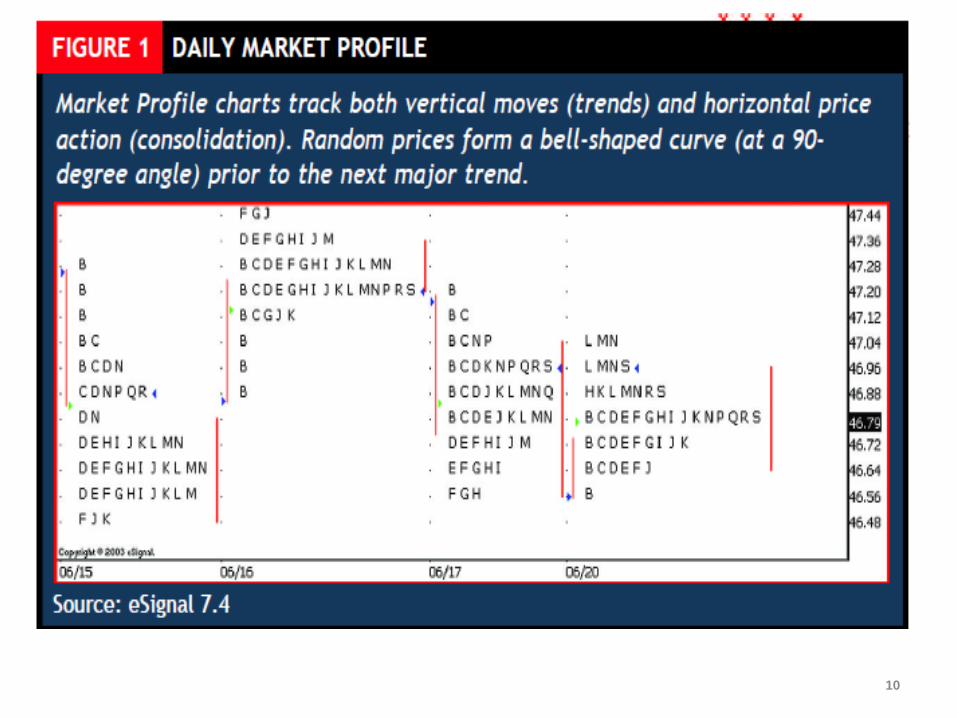
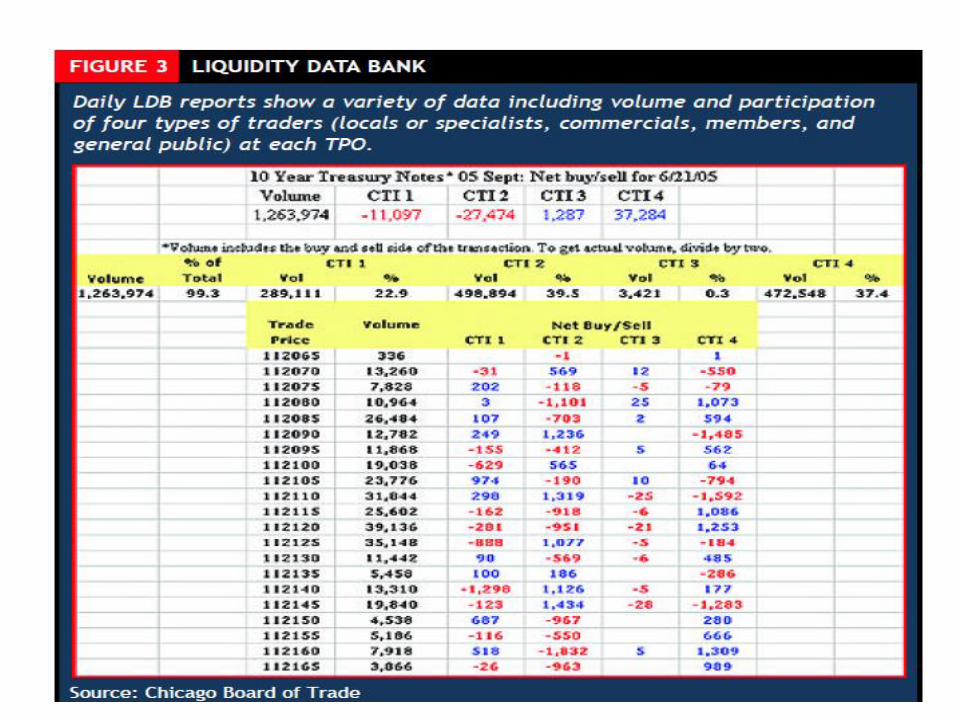
---- Liquidity Data Bank – LDB (example next slide) and Market Profile
(Steidlmayer)
http://www.elitetrader.com/vb/attachment.php?postid=921848
http://www.abebooks.com/servlet/BookDetailsPL?bi=11628615487&searchurl=
ds%3D30%26isbn%3D9780471621157%26sortby%3D13
---- Resting orders info from exchanges (HFT)
8
Markets as an auction process
• The concept
• The application
• Facilitation of trade (FT) is critical
• How to evaluate facilitation of trade
• How momentum can reveal FT
• How depth of market (DOM) reveals FT
• FT can be evaluated in any time frame
• A DOM study step by step (10 deep)
• Caveat: rule based vs analysis
9
10
11
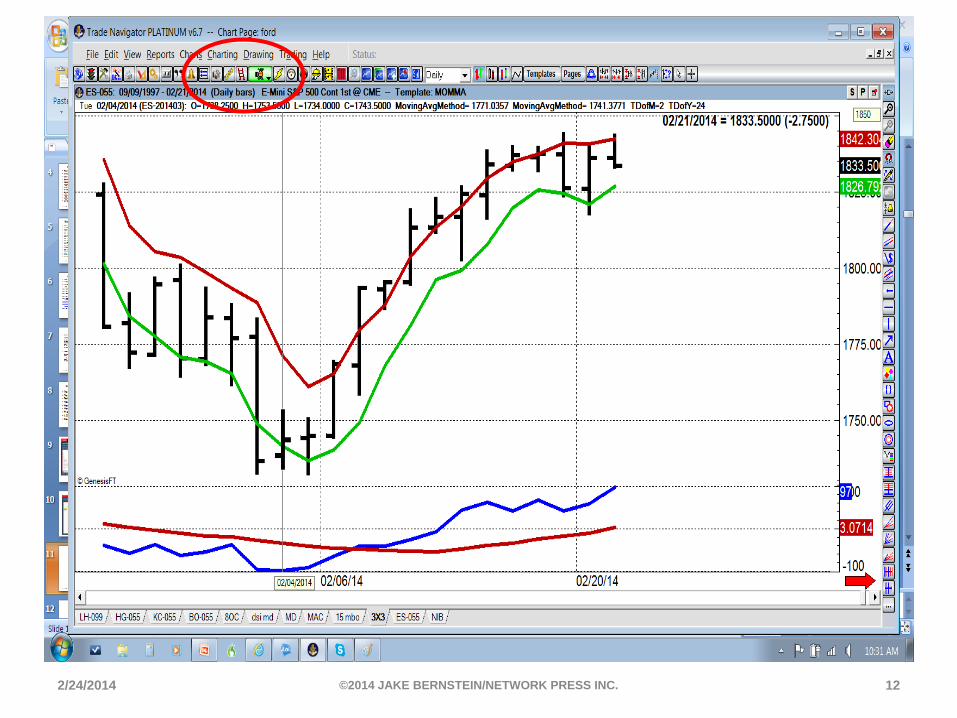
2/24/2014 ©2014 JAKE BERNSTEIN/NETWORK PRESS INC. 12
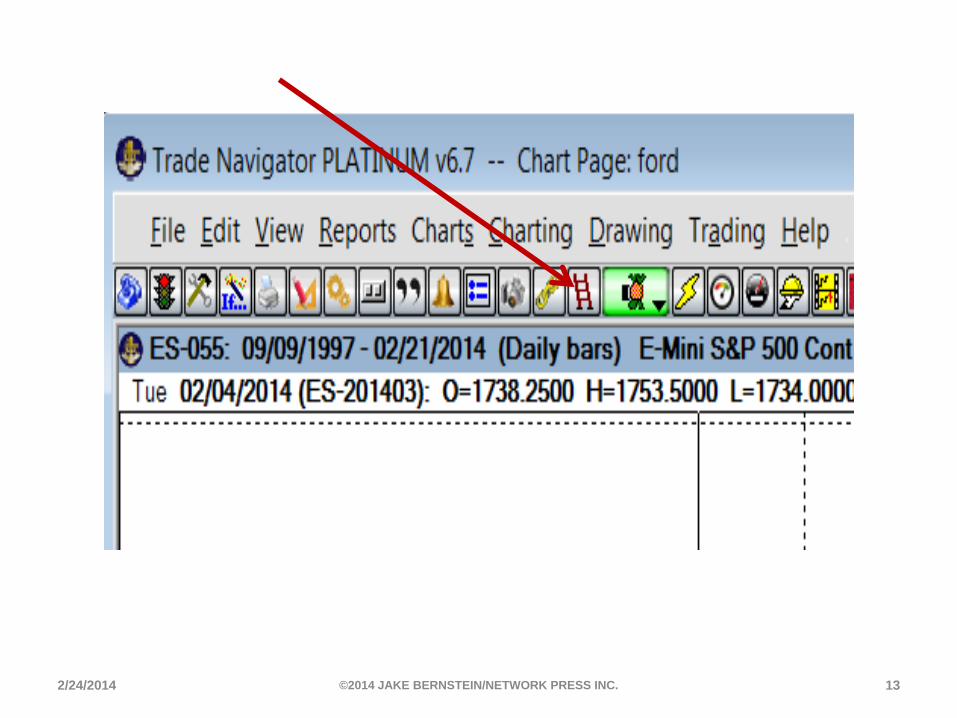
2/24/2014 ©2014 JAKE BERNSTEIN/NETWORK PRESS INC. 13
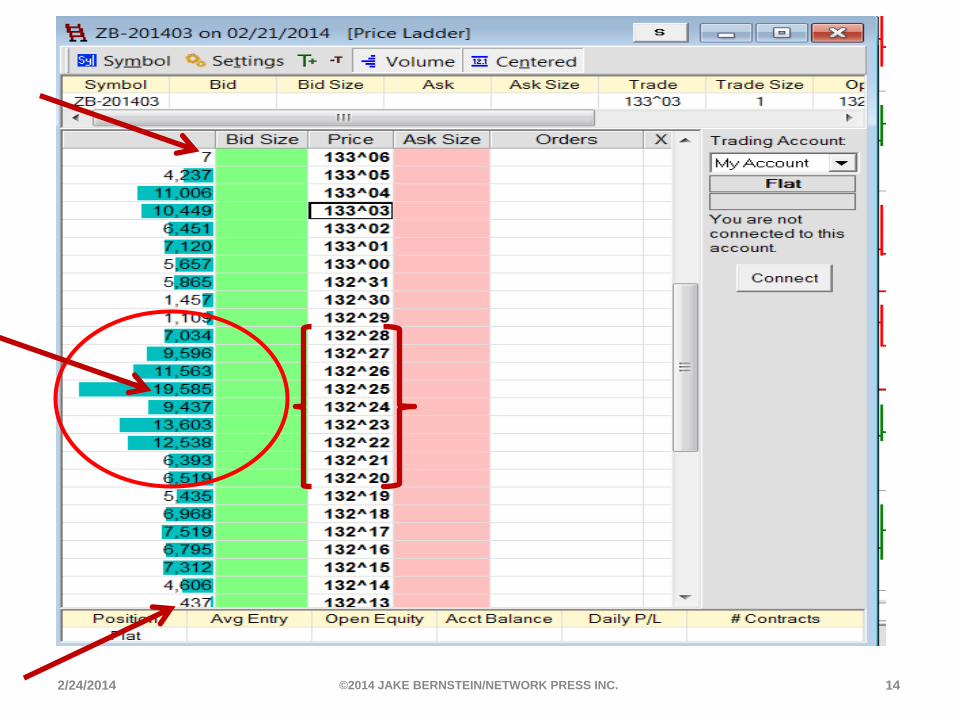
2/24/2014 ©2014 JAKE BERNSTEIN/NETWORK PRESS INC. 14
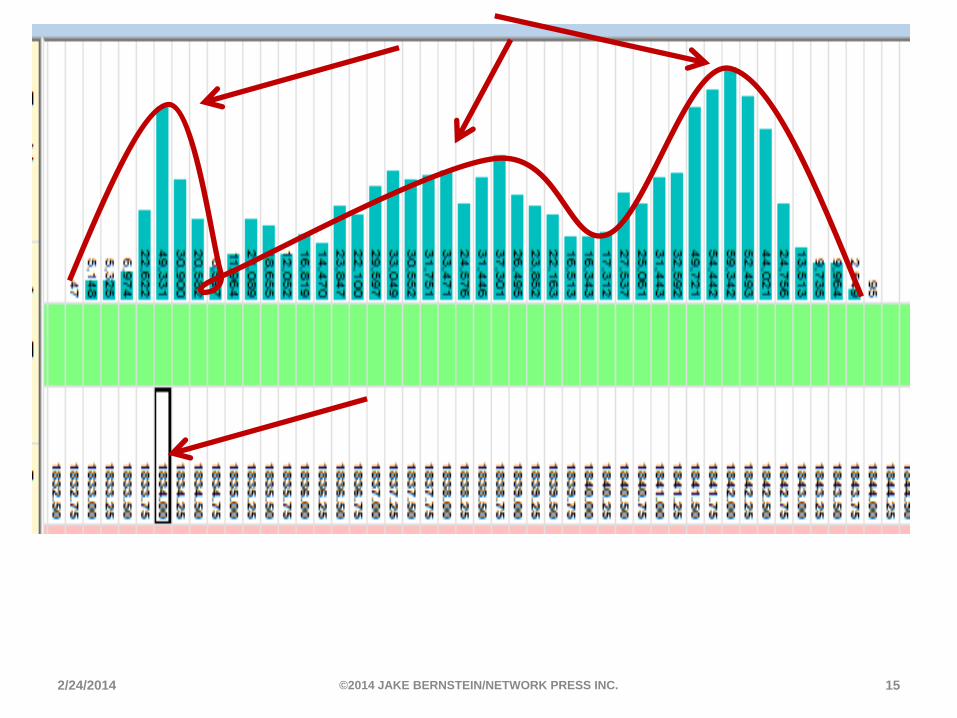
2/24/2014 ©2014 JAKE BERNSTEIN/NETWORK PRESS INC. 15
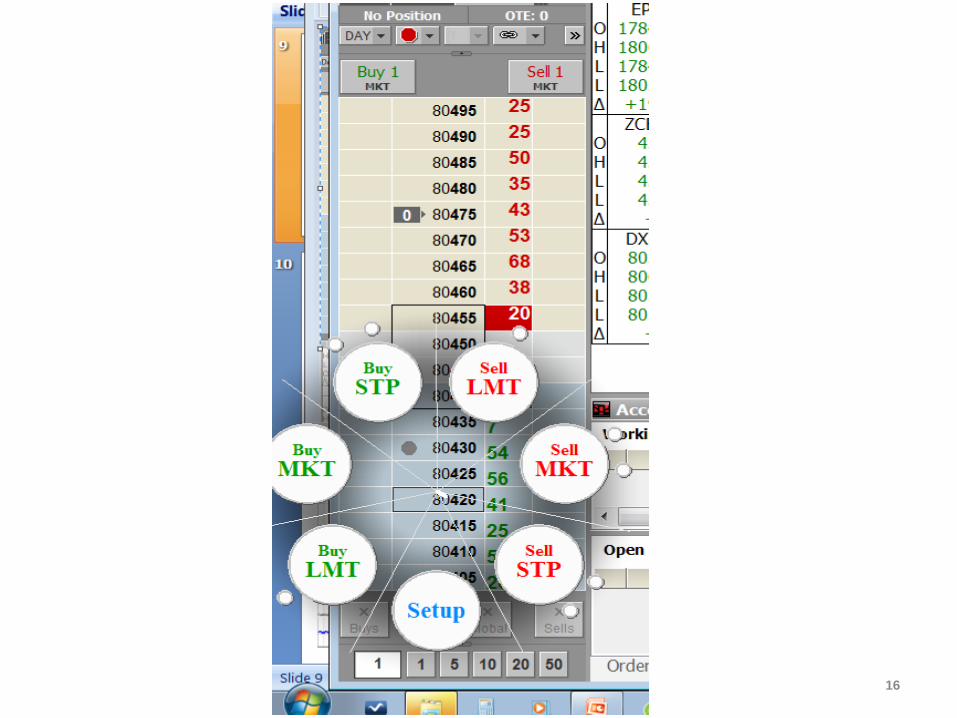
16
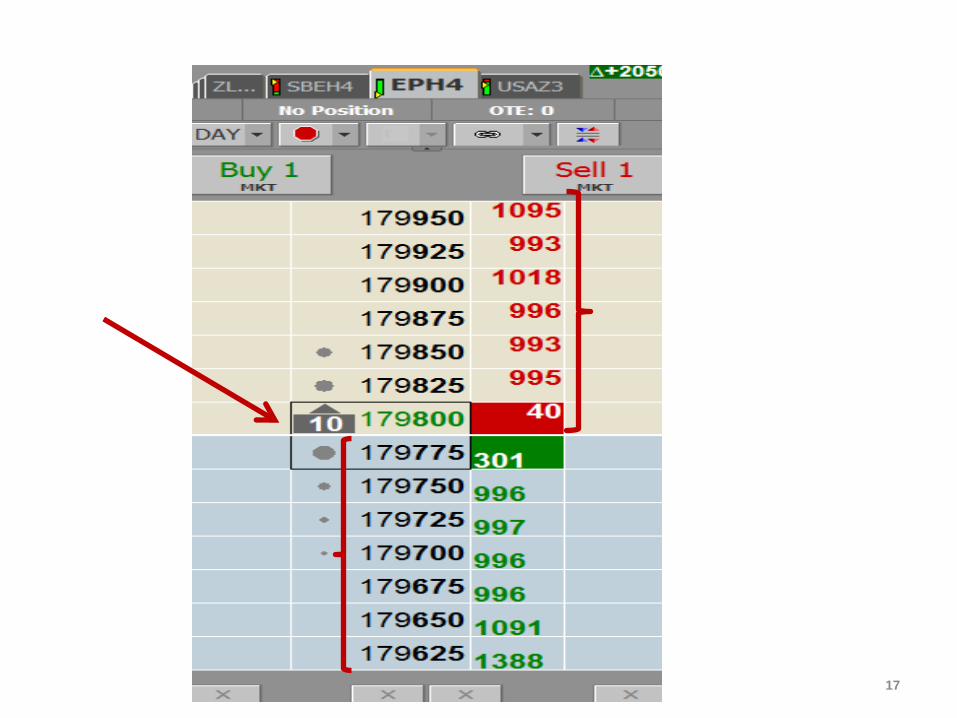
17
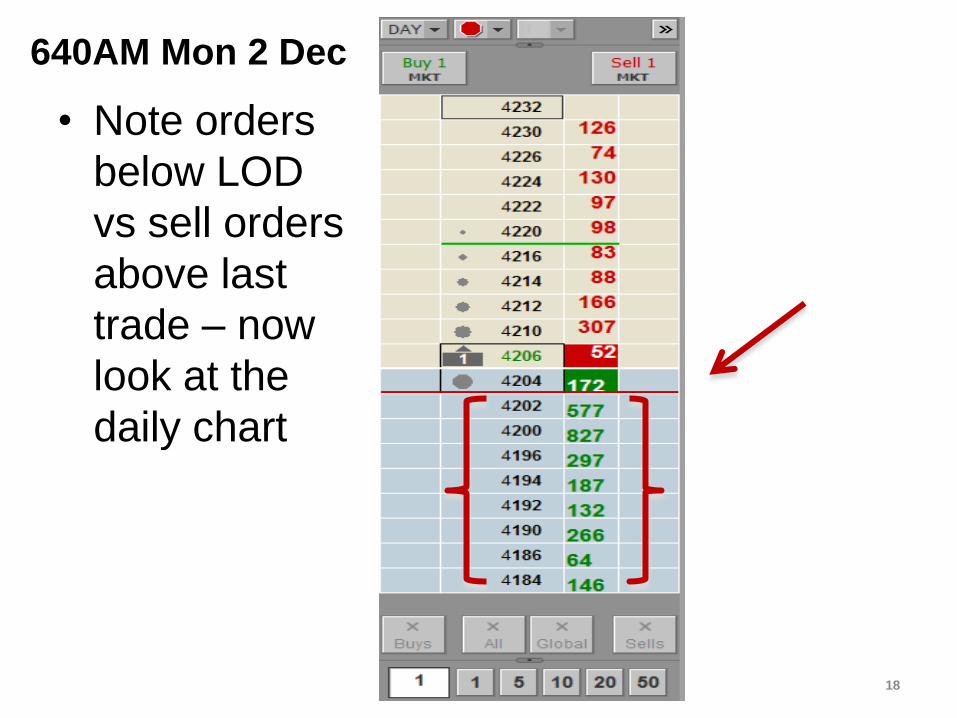
640AM Mon 2 Dec
• Note orders
below LOD
vs sell orders
above last
trade – now
look at the
daily chart
18
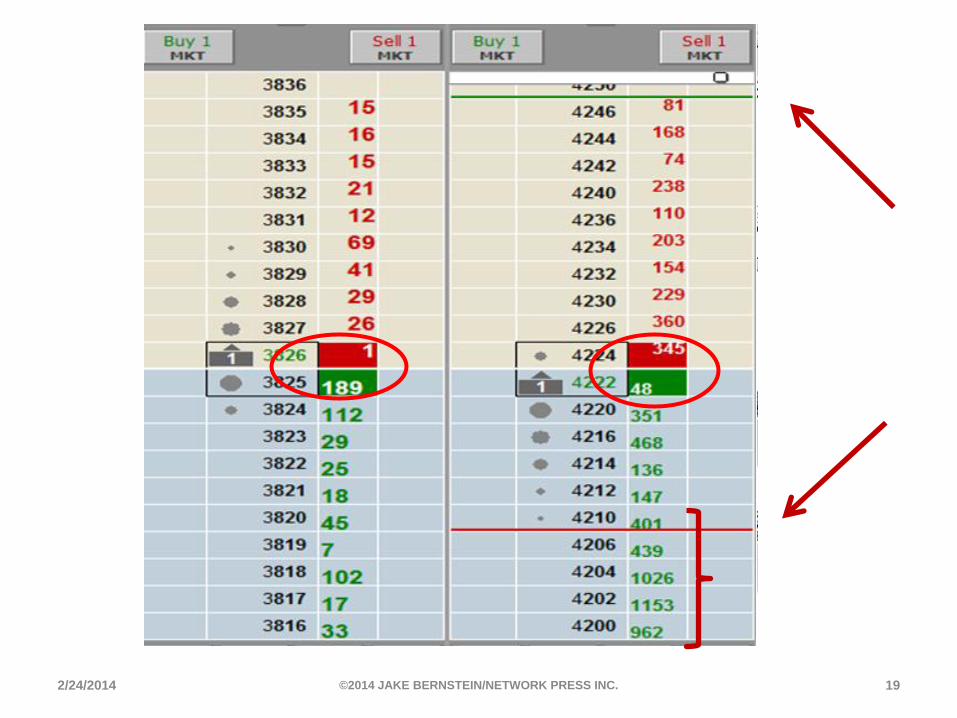
2/24/2014 ©2014 JAKE BERNSTEIN/NETWORK PRESS INC. 19
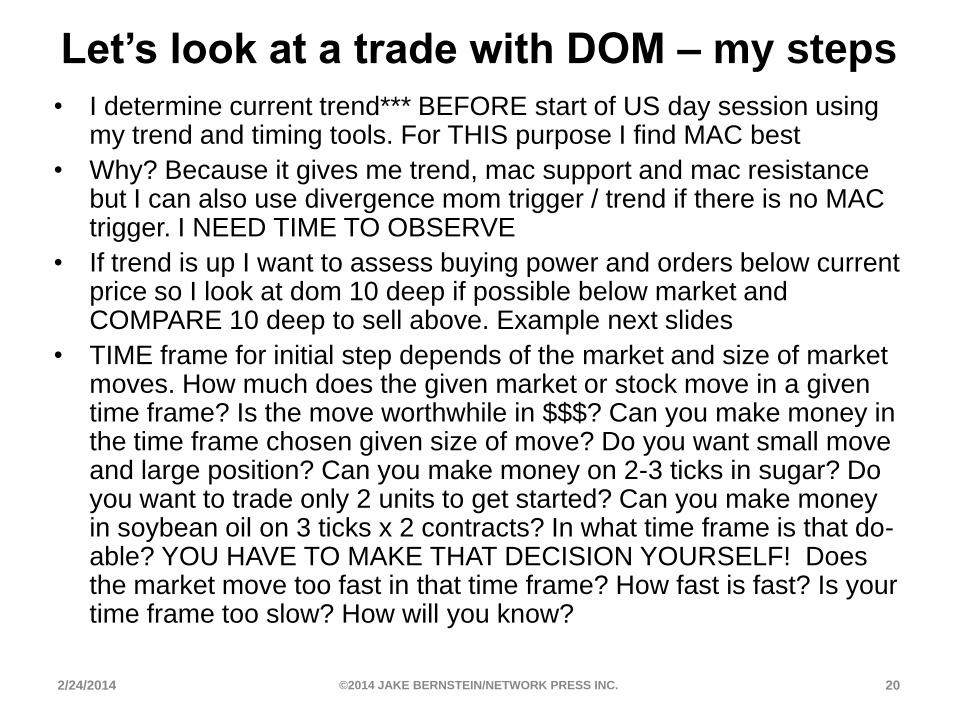
Let’s look at a trade with DOM – my steps
• I determine current trend*** BEFORE start of US day session using my trend and timing tools. For THIS purpose I find MAC best
• Why? Because it gives me trend, mac support and mac resistance but I can also use divergence mom trigger / trend if there is no MAC trigger. I NEED TIME TO OBSERVE
• If trend is up I want to assess buying power and orders below current price so I look at dom 10 deep if possible below market and COMPARE 10 deep to sell above. Example next slides
• TIME frame for initial step depends of the market and size of market moves. How much does the given market or stock move in a given time frame? Is the move worthwhile in $$$? Can you make money in the time frame chosen given size of move? Do you want small move and large position? Can you make money on 2-3 ticks in sugar? Do you want to trade only 2 units to get started? Can you make money in soybean oil on 3 ticks x 2 contracts? In what time frame is that do-able? YOU HAVE TO MAKE THAT DECISION YOURSELF! Does the market move too fast in that time frame? How fast is fast? Is your time frame too slow? How will you know?
2/24/2014 ©2014 JAKE BERNSTEIN/NETWORK PRESS INC. 20
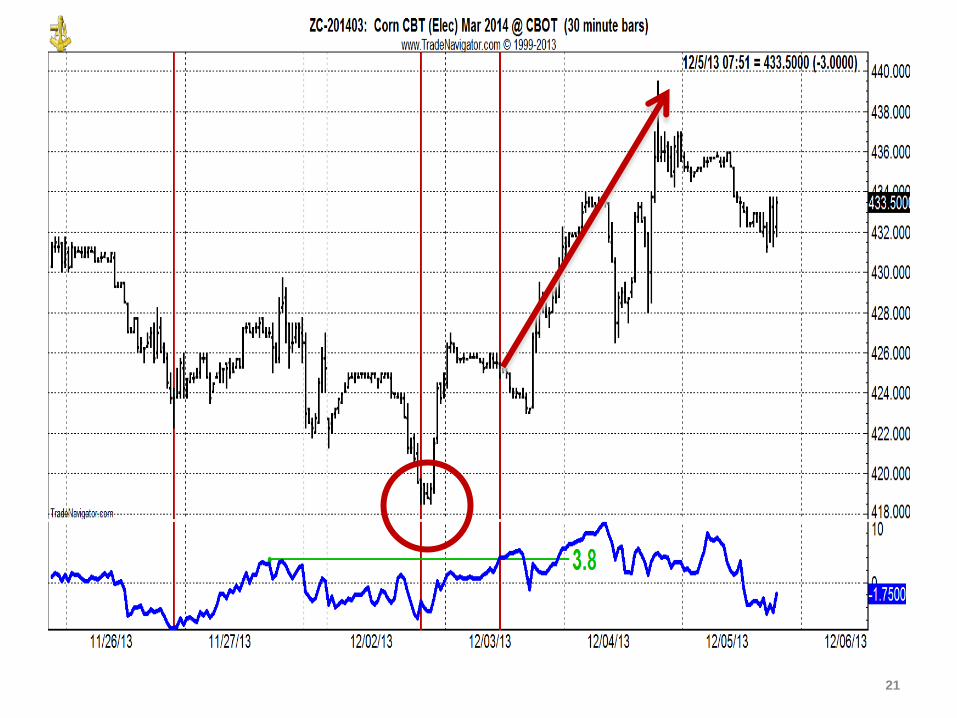
21
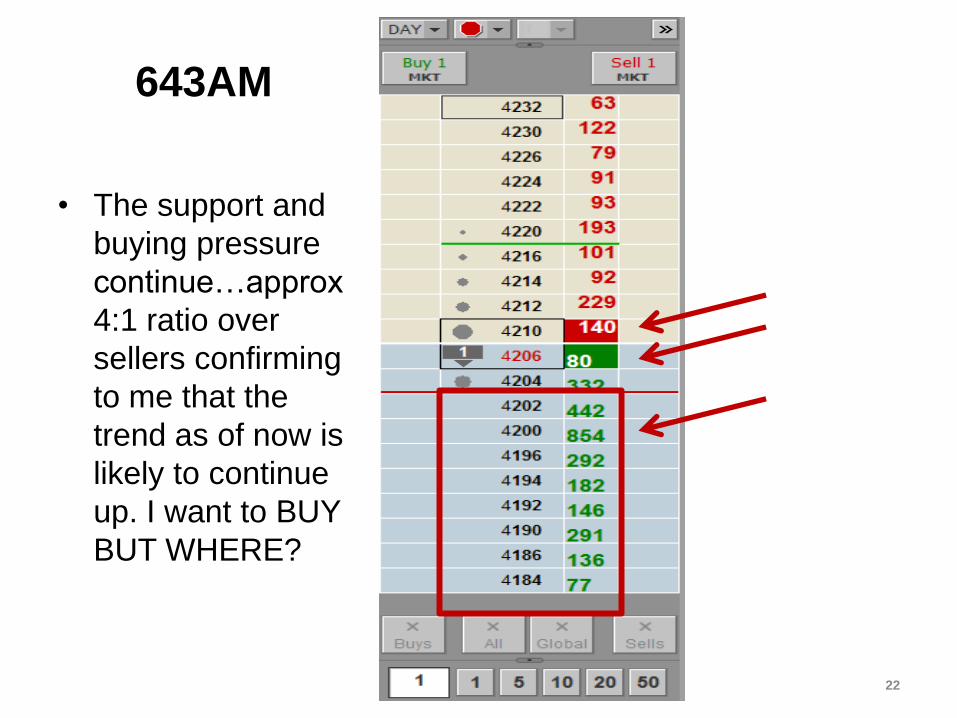
643AM
• The support and
buying pressure
continue…approx
4:1 ratio over
sellers confirming
to me that the
trend as of now is
likely to continue
up. I want to BUY
BUT WHERE?
22
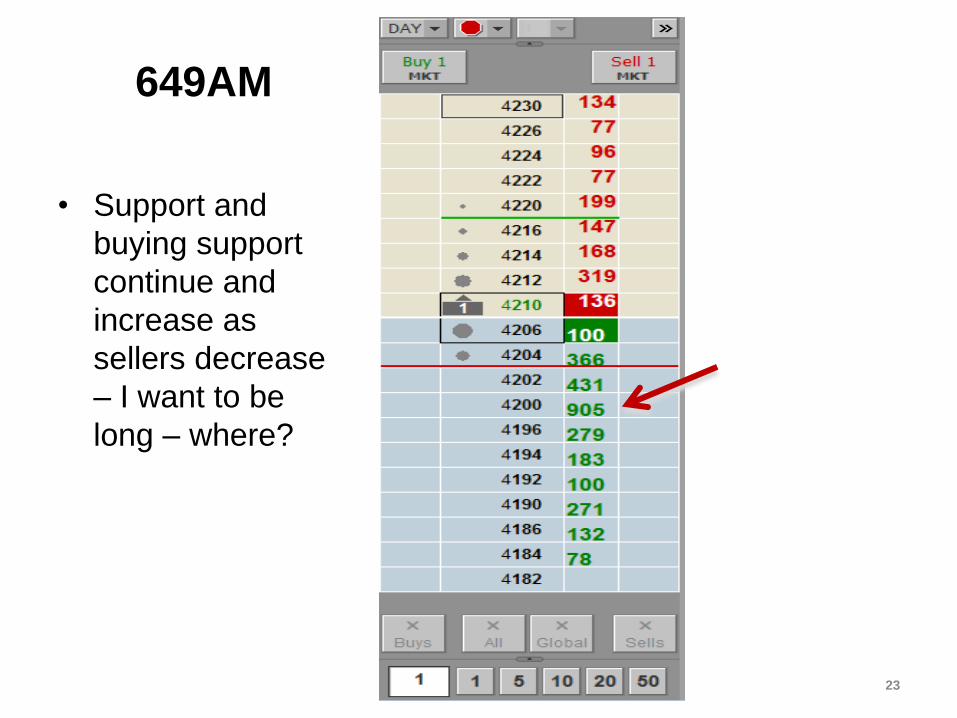
649AM
• Support and
buying support
continue and
increase as
sellers decrease
– I want to be
long – where?
23
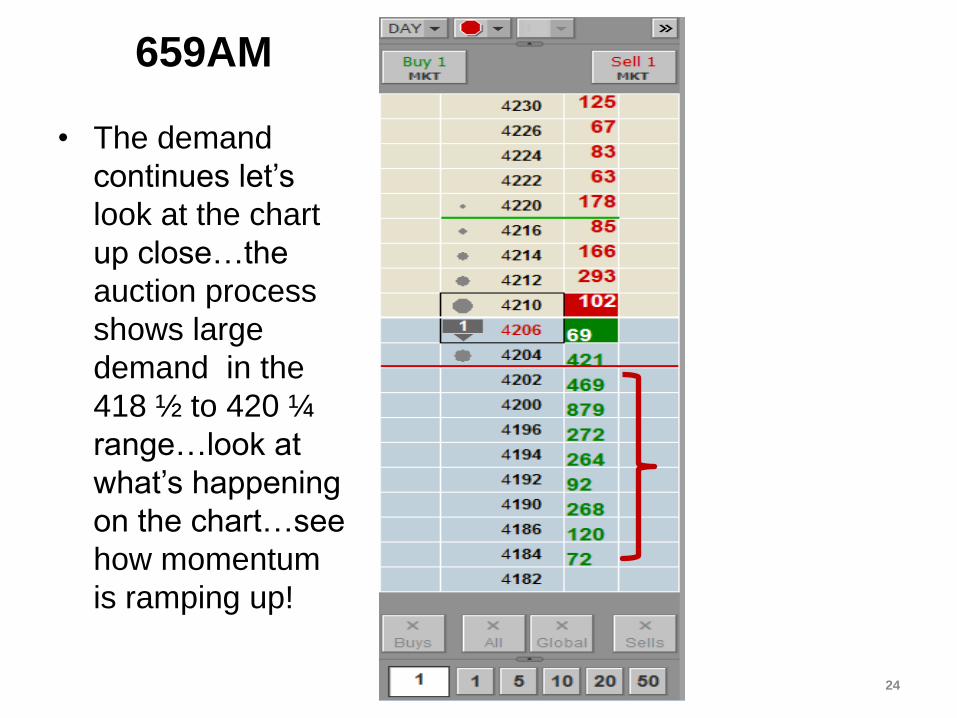
659AM
• The demand
continues let’s
look at the chart
up close…the
auction process
shows large
demand in the
418 ½ to 420 ¼
range…look at
what’s happening
on the chart…see
how momentum
is ramping up!
24

25
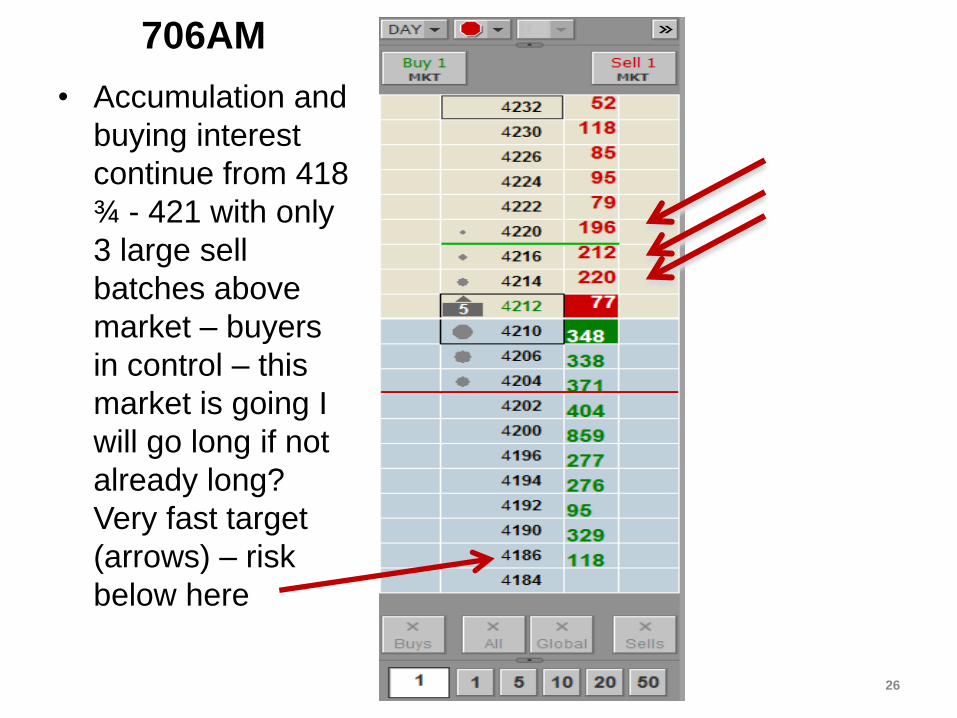
706AM
• Accumulation and
buying interest
continue from 418
¾ - 421 with only
3 large sell
batches above
market – buyers
in control – this
market is going I
will go long if not
already long?
Very fast target
(arrows) – risk
below here
26
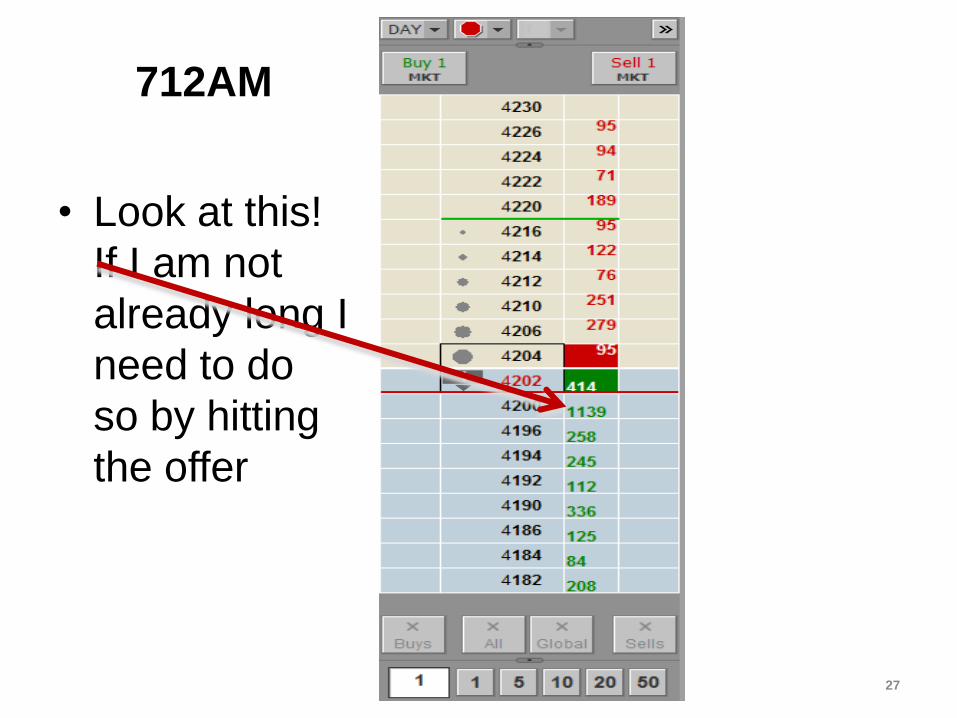
712AM
• Look at this!
If I am not
already long I
need to do
so by hitting
the offer
27
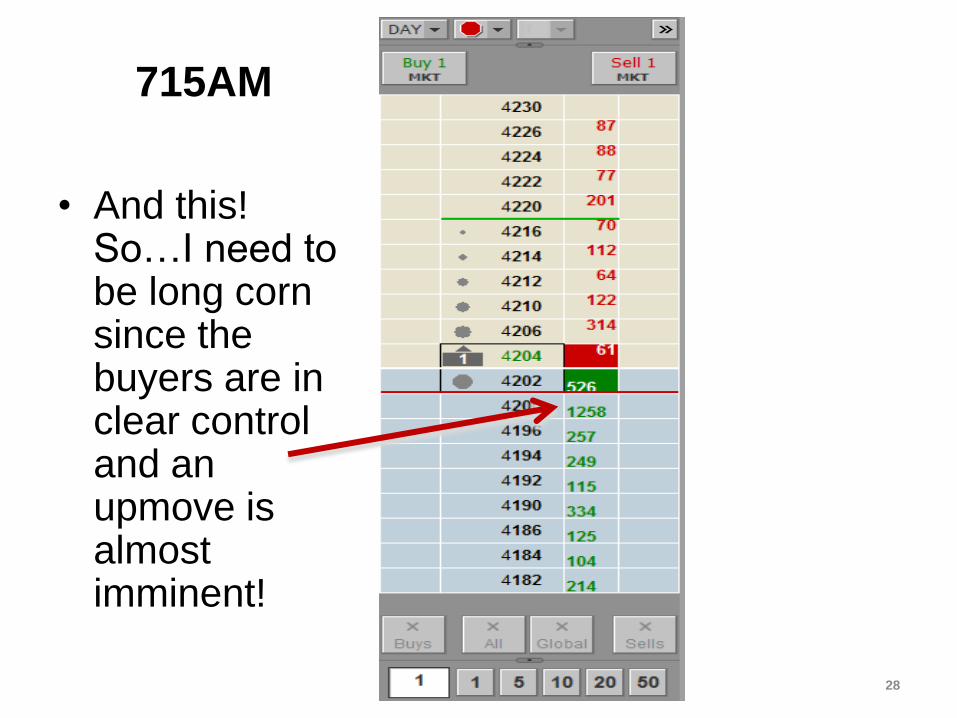
715AM
• And this! So…I need to be long corn since the buyers are in clear control and an upmove is almost imminent!
28
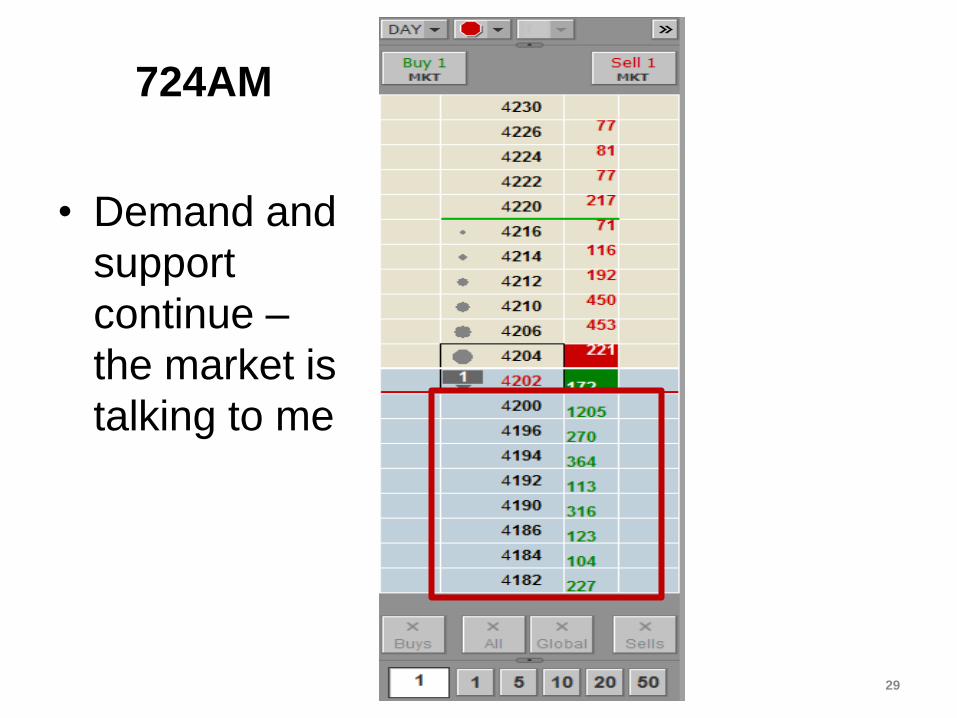
724AM
• Demand and
support
continue –
the market is
talking to me
29
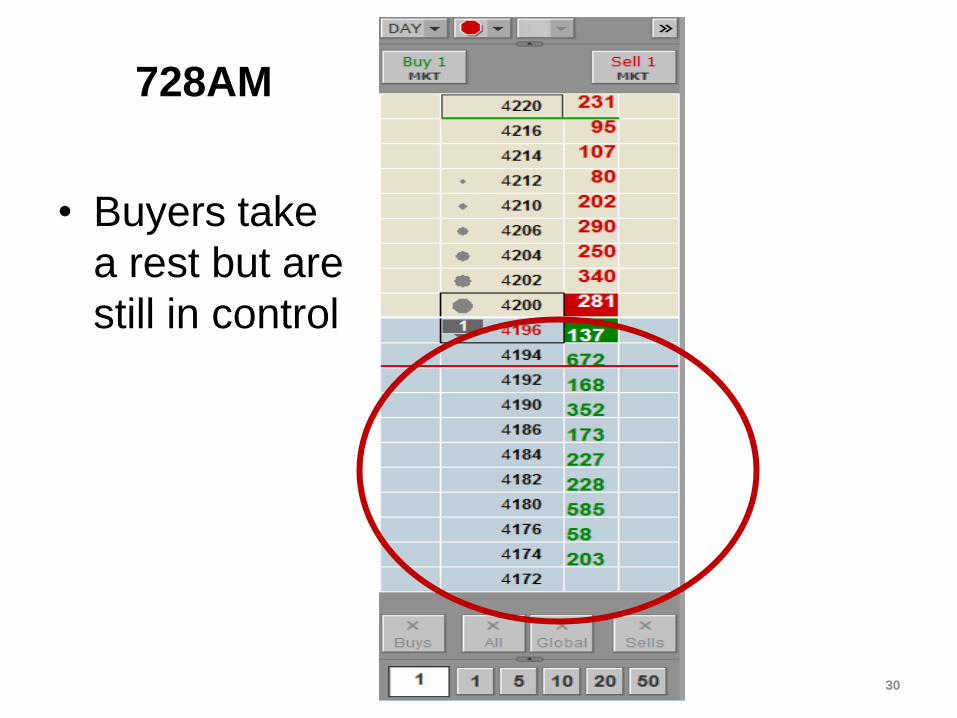
728AM
• Buyers take
a rest but are
still in control
30

738AM
• Balance returns which means the big buyers are giving the sellers a chance to show their power or intentions – the auction has reached a stalemate but the slight bias remains on buy side
31
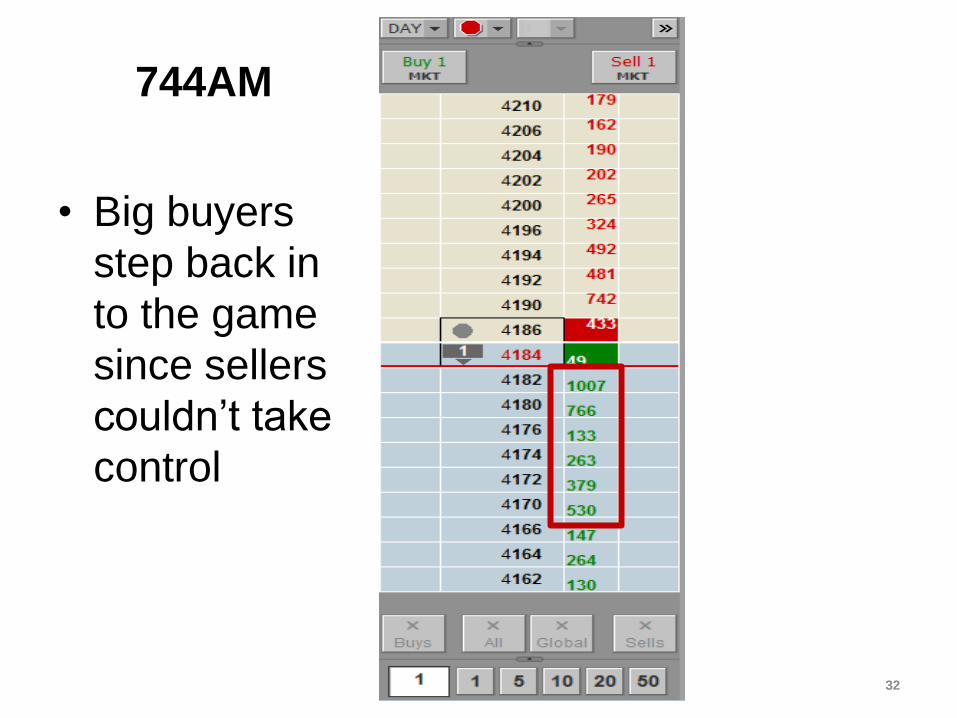
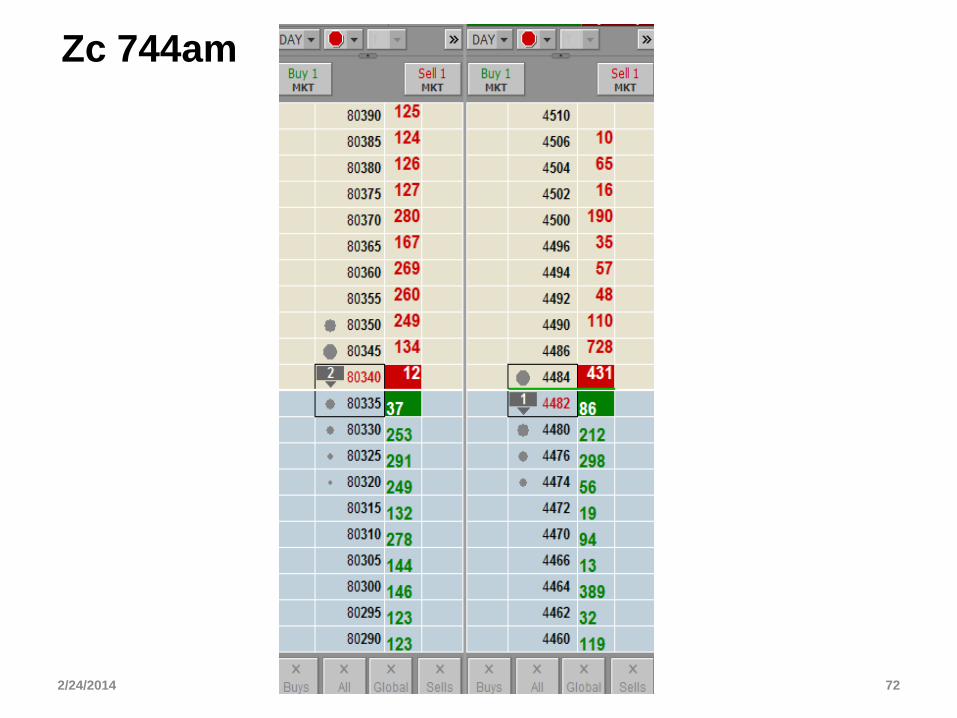
744AM
• Big buyers
step back in
to the game
since sellers
couldn’t take
control
32
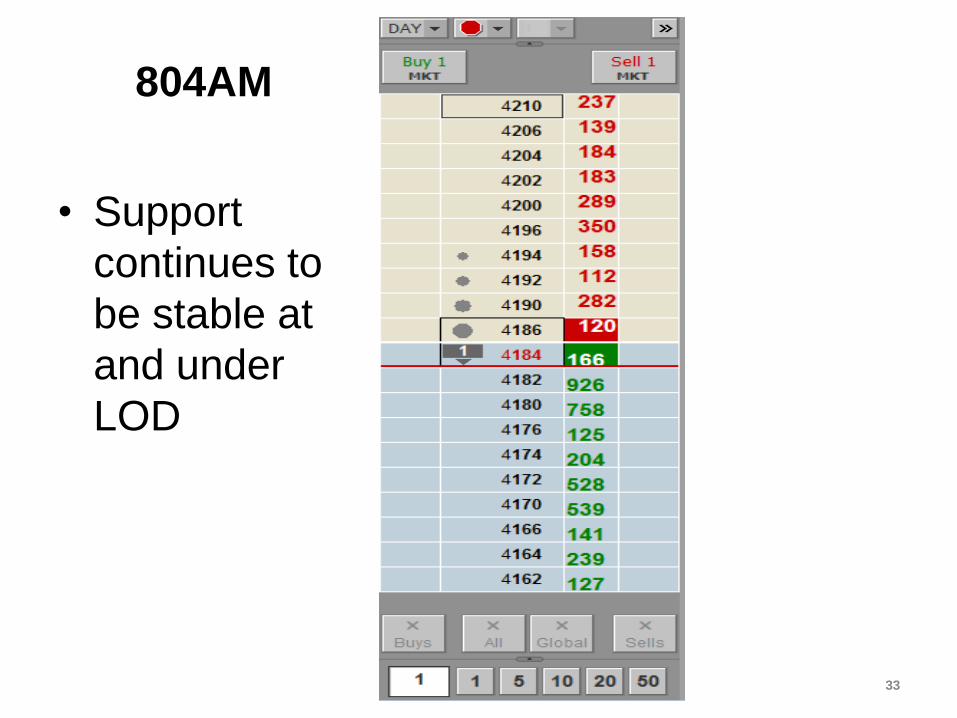
804AM
• Support
continues to
be stable at
and under
LOD
33
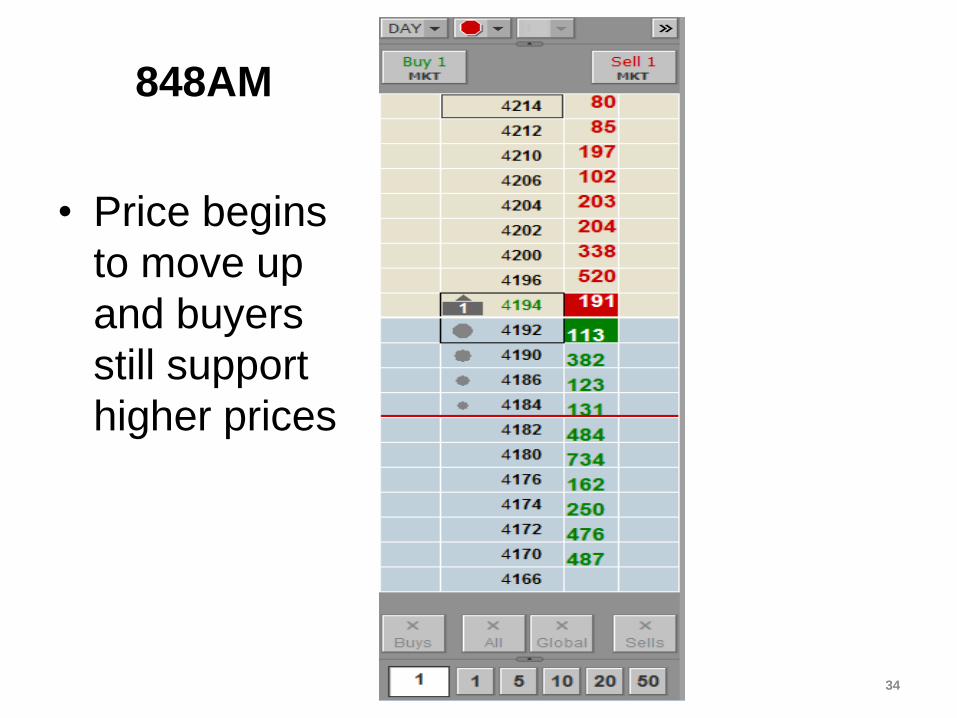
848AM
• Price begins
to move up
and buyers
still support
higher prices
34
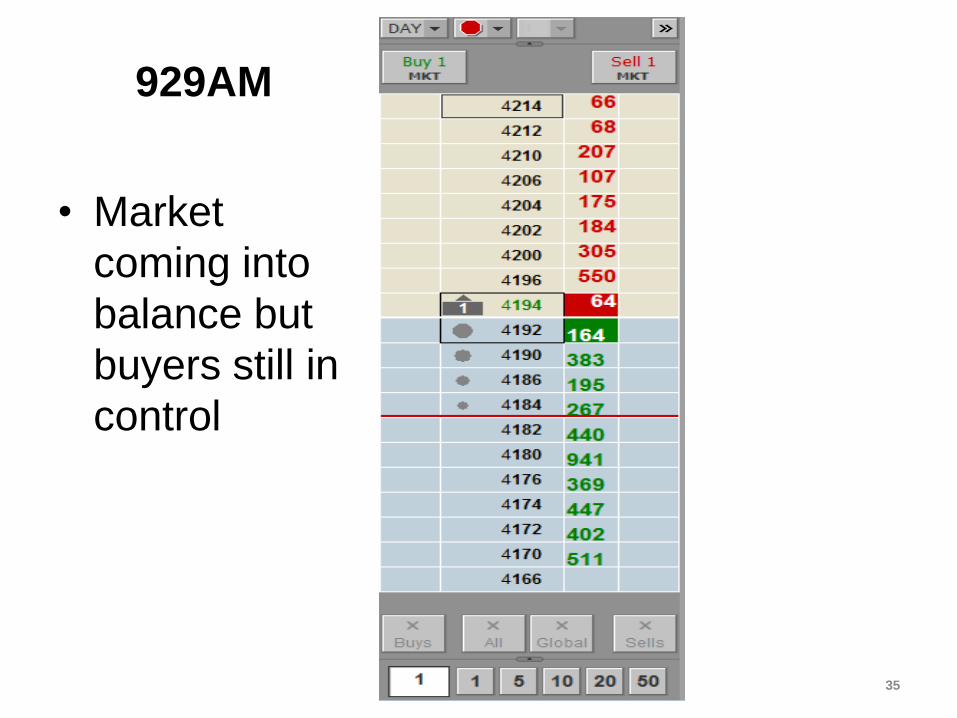
929AM
• Market
coming into
balance but
buyers still in
control
35
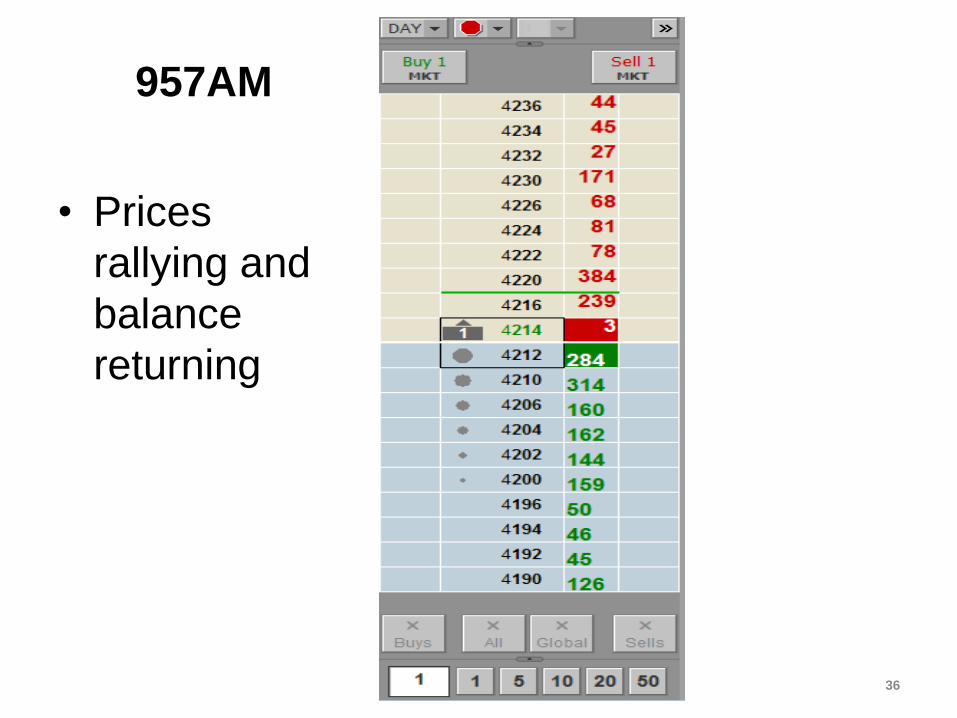
957AM
• Prices
rallying and
balance
returning
36

1005AM
• As prices rise
large sell
order
appears at
high of day
but support
still stable
37
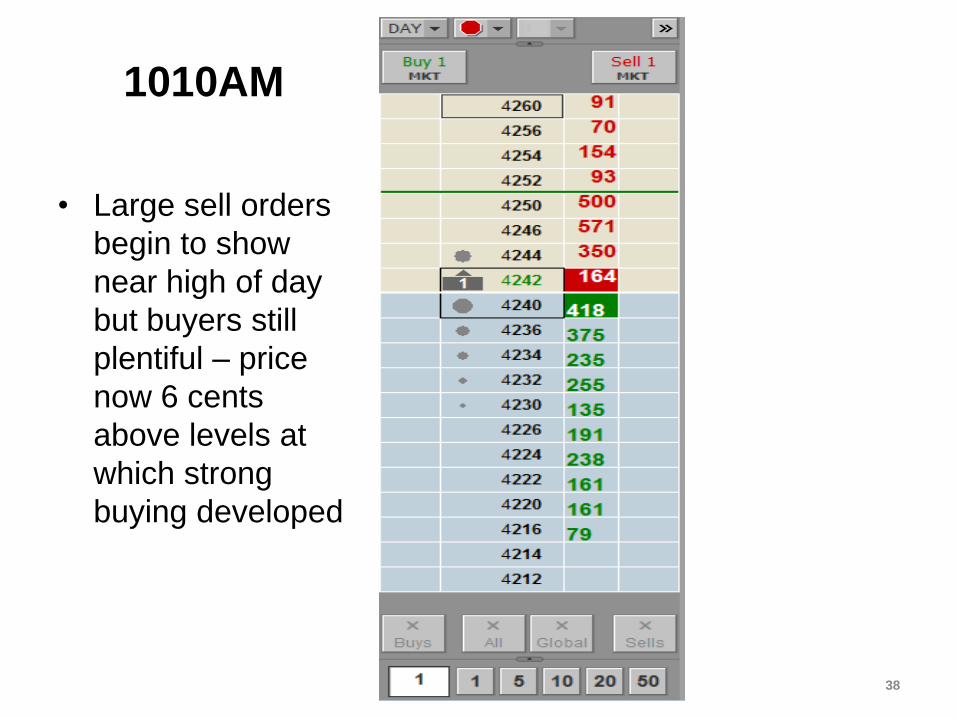
1010AM
• Large sell orders
begin to show
near high of day
but buyers still
plentiful – price
now 6 cents
above levels at
which strong
buying developed
38
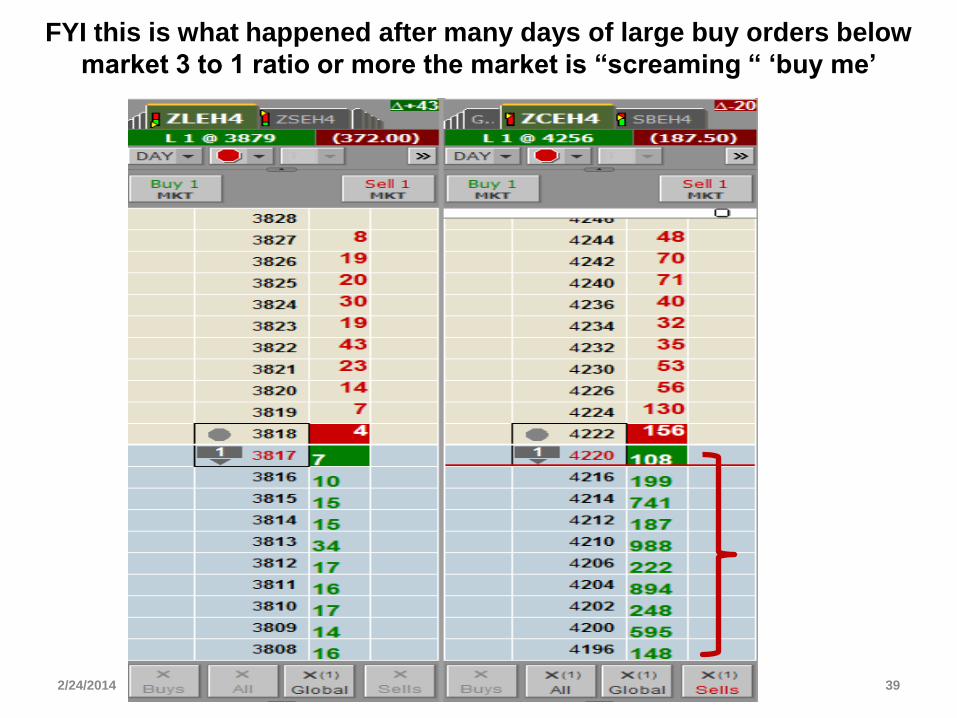
FYI this is what happened after many days of large buy orders below
market 3 to 1 ratio or more the market is “screaming “ ‘buy me’
2/24/2014 ©2014 JAKE BERNSTEIN/NETWORK PRESS INC. 39
2/24/2014 ©2014 JAKE BERNSTEIN/NETWORK PRESS INC. 40

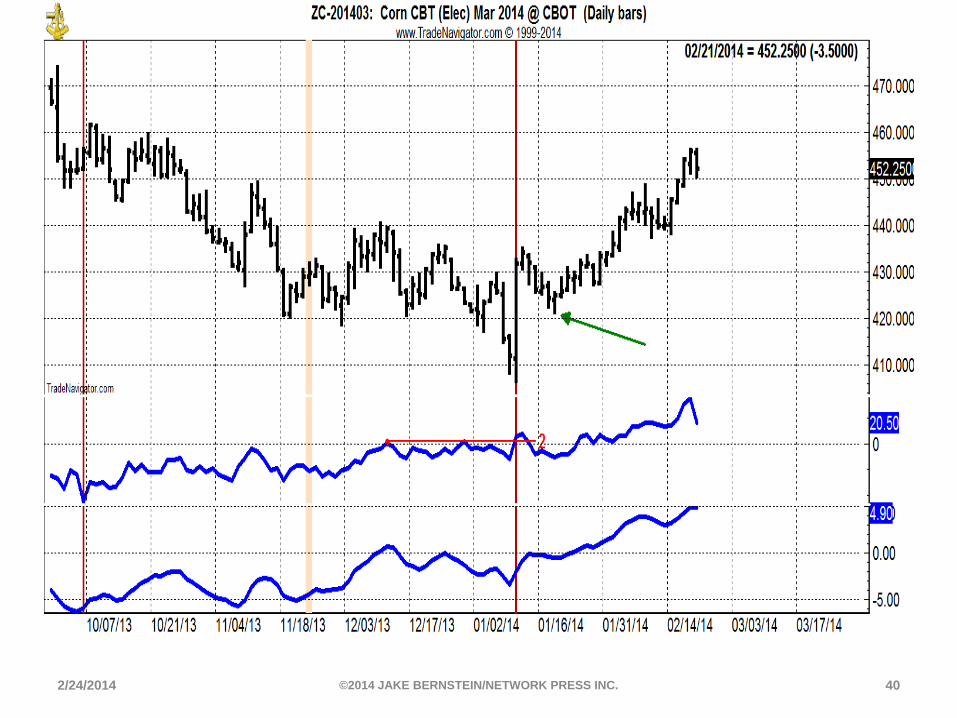
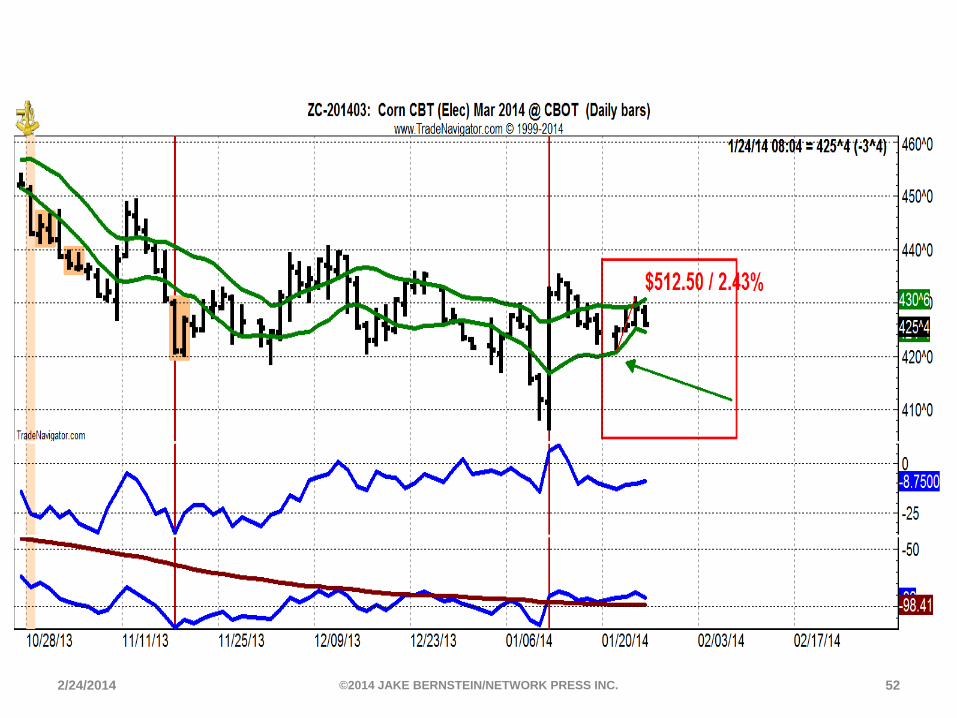
Also FYI here is where support developed in jan before $1500+ move
2/24/2014 ©2014 JAKE BERNSTEIN/NETWORK PRESS INC. 41

1043AM
• Burden of
proof is on
longs as
large sell
orders
develop at
high of day
42
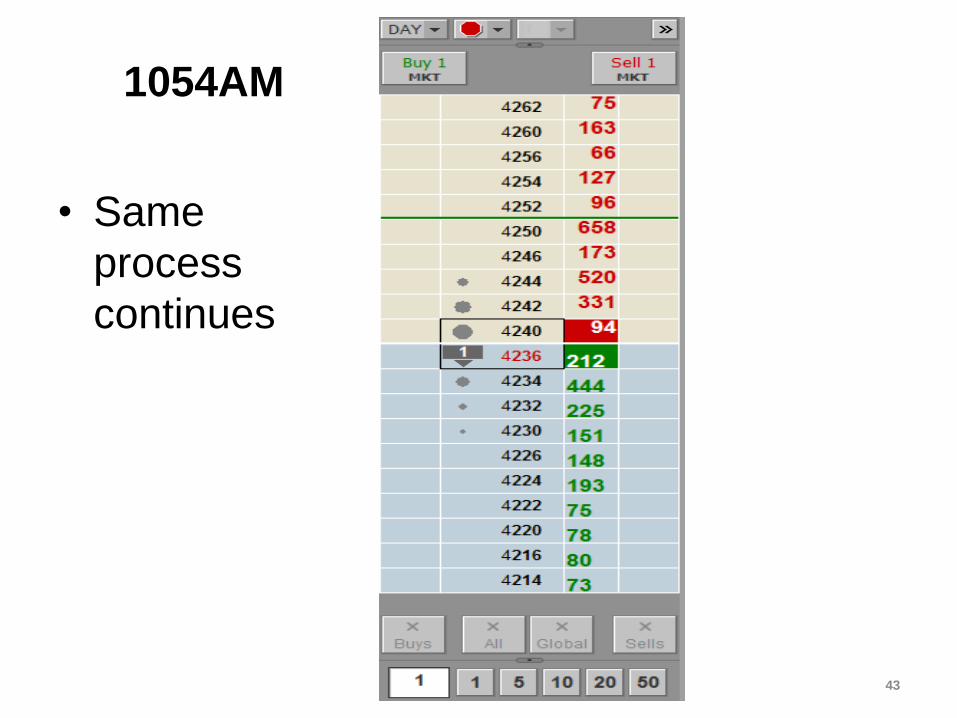
1054AM
• Same
process
continues
43
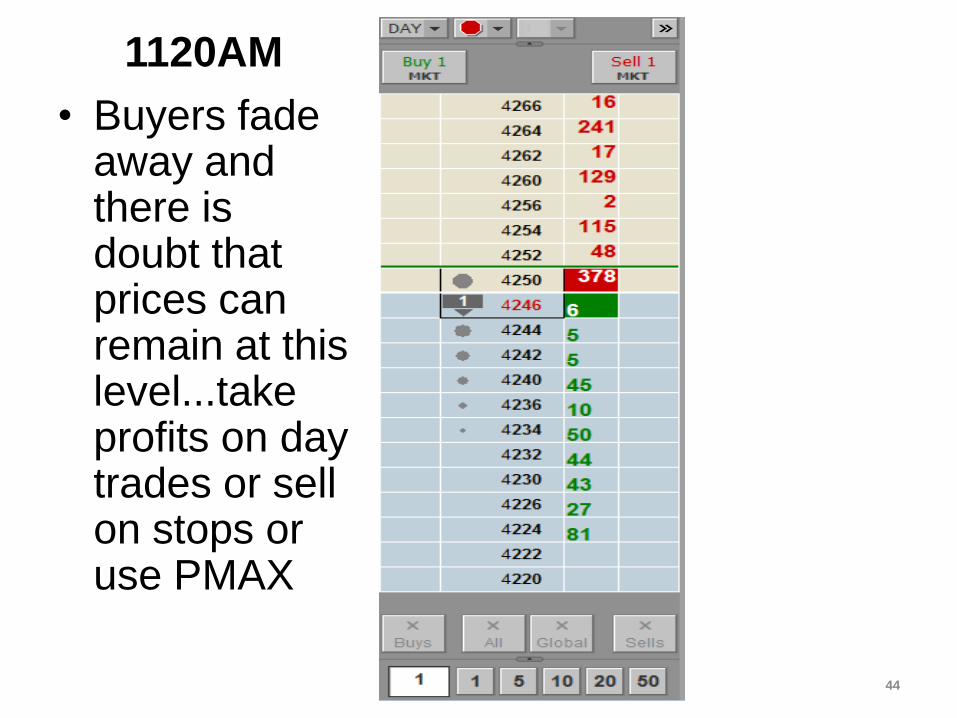
1120AM
• Buyers fade away and there is doubt that prices can remain at this level...take profits on day trades or sell on stops or use PMAX
44
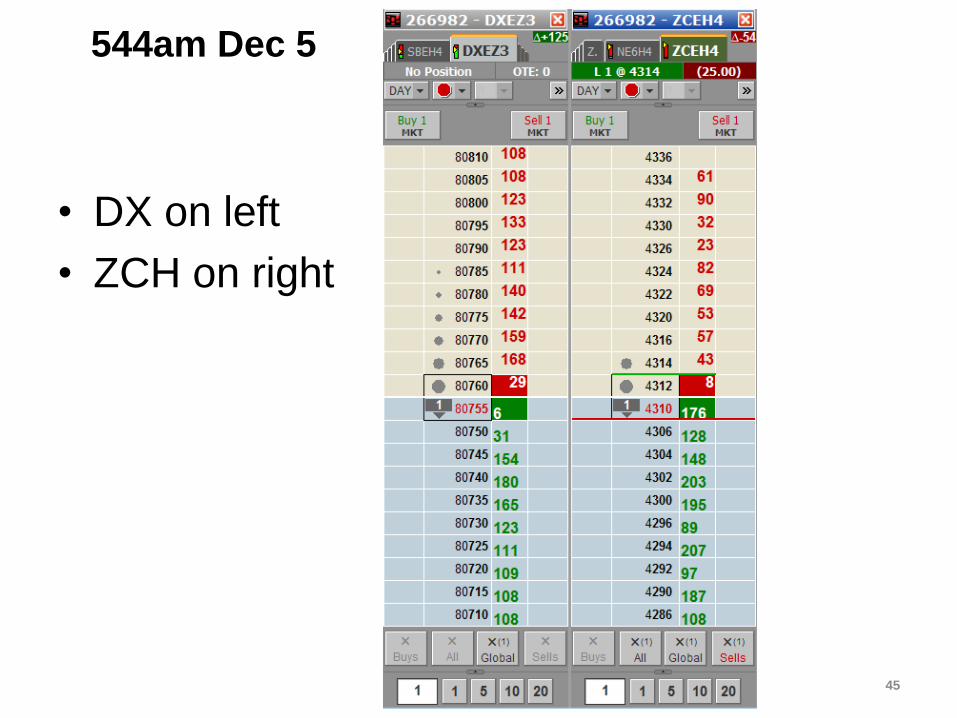
544am Dec 5
• DX on left
• ZCH on right
45

603am
• What do you
see in DX or
ZC
46
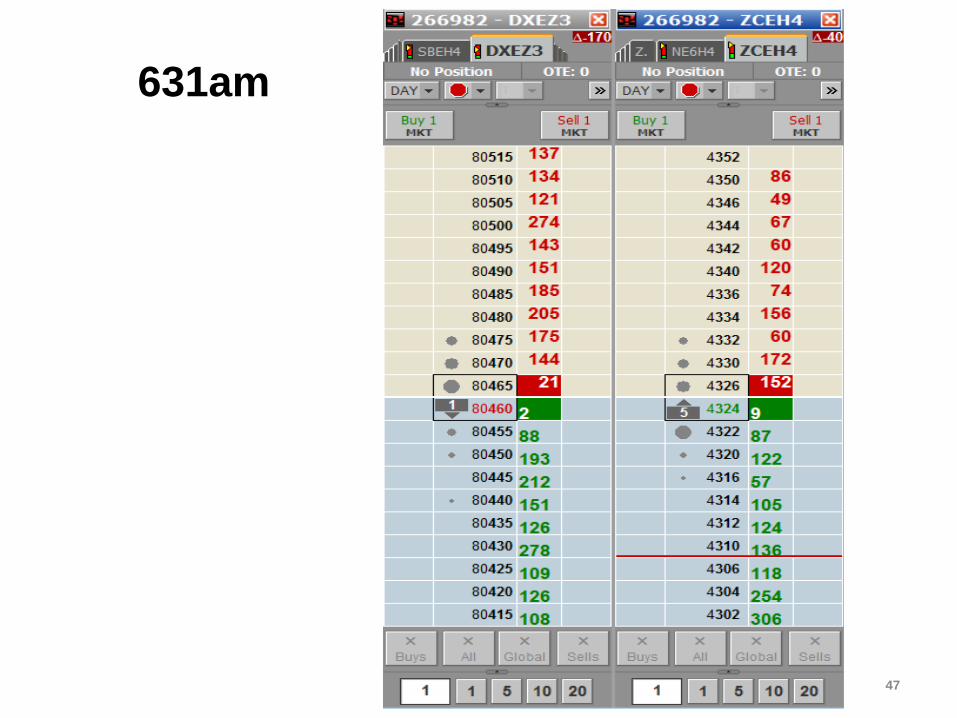
631am
47
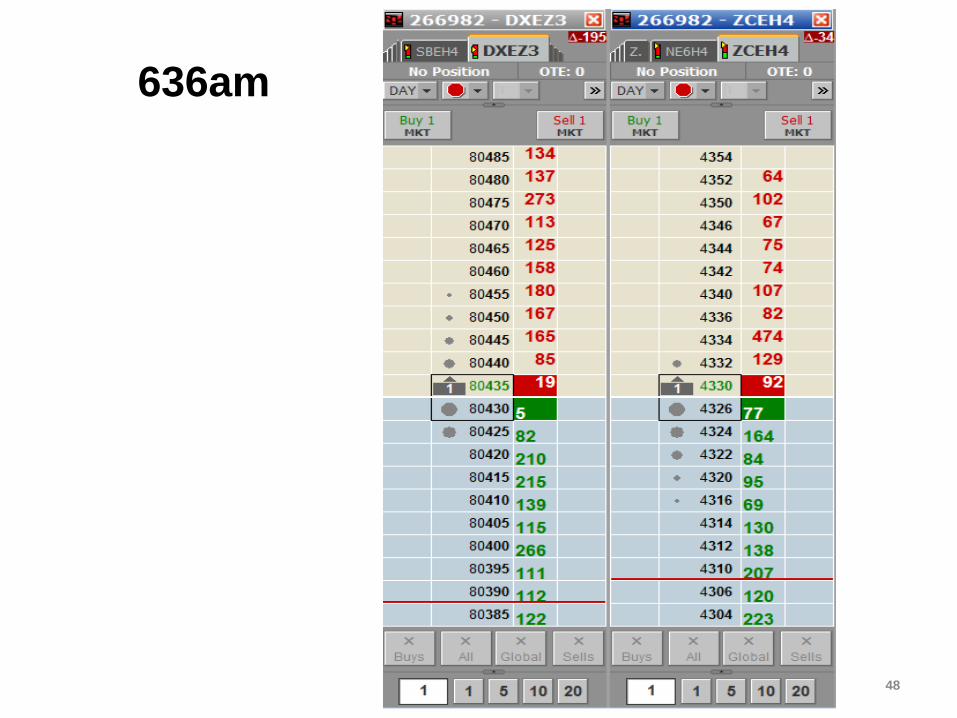
636am
48
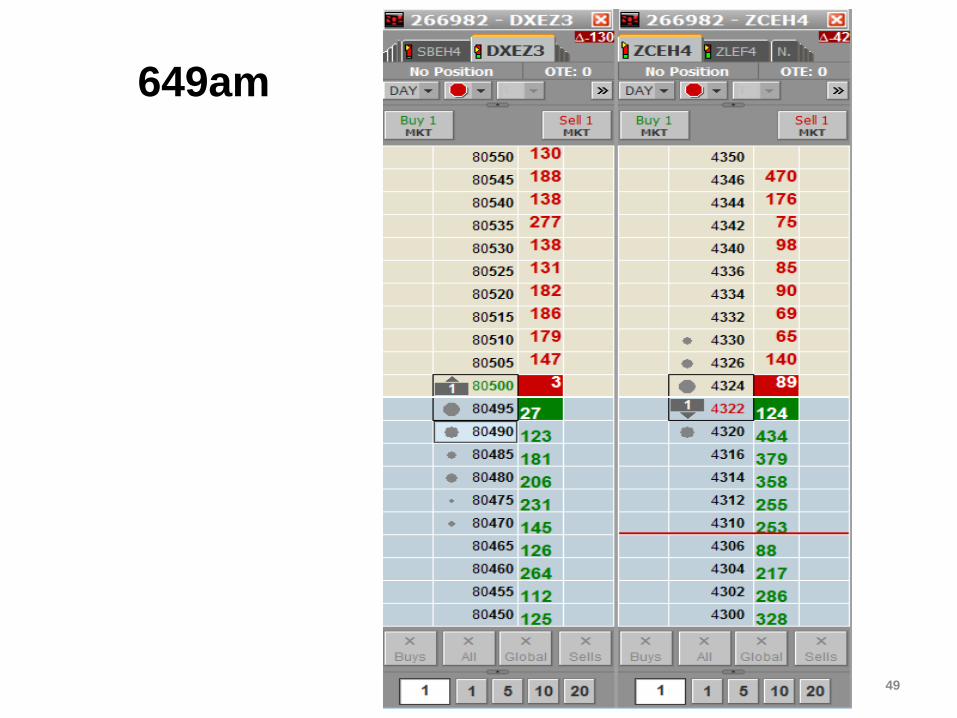
649am
49
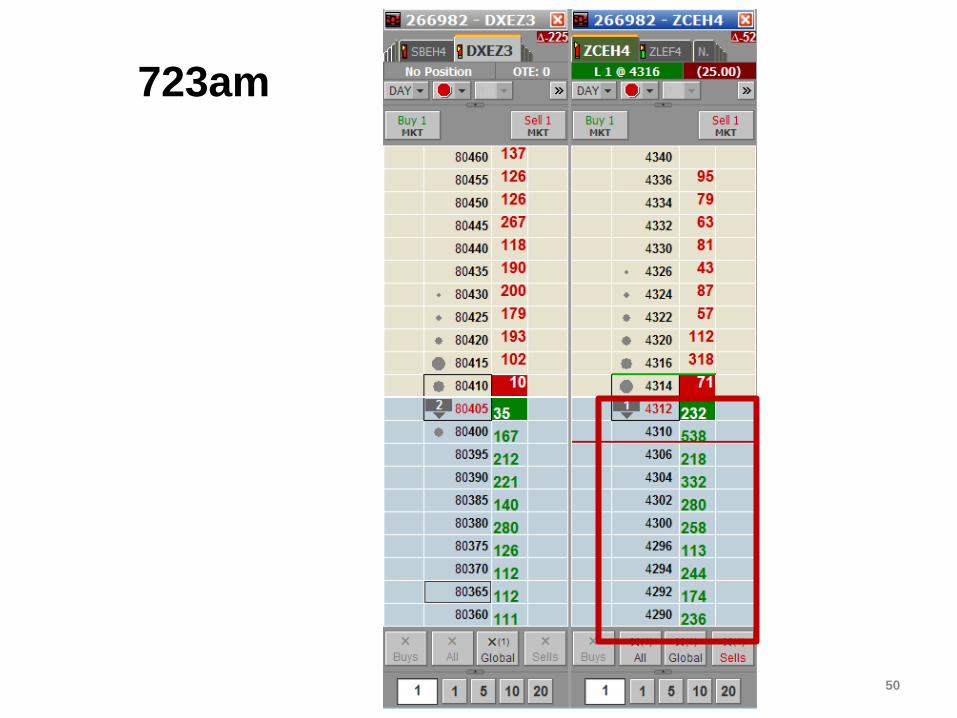
723am
50
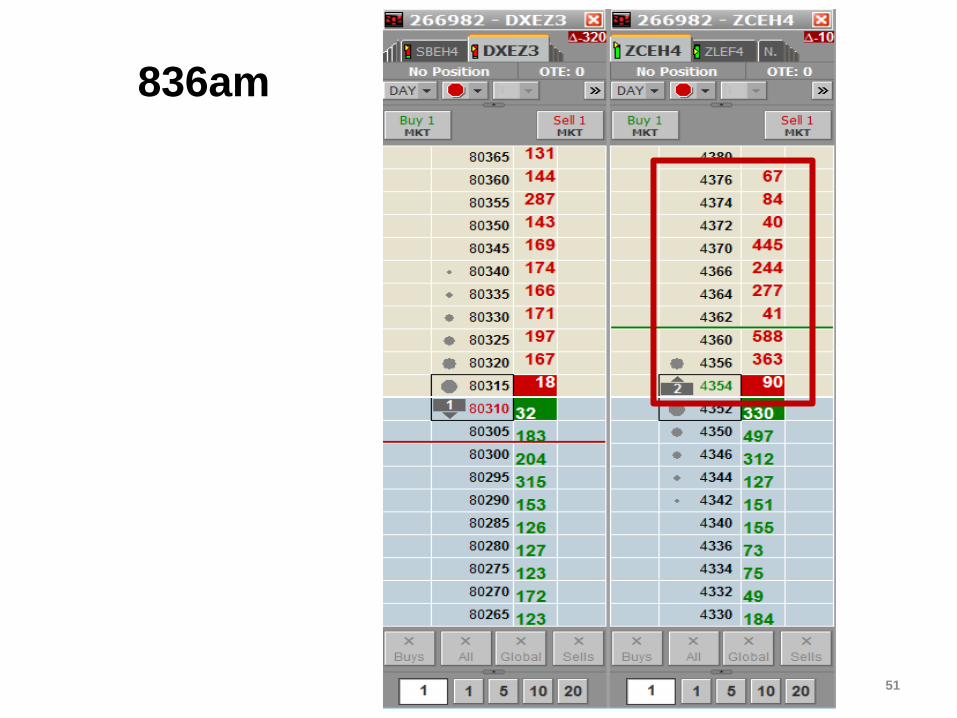
836am
51
2/24/2014 ©2014 JAKE BERNSTEIN/NETWORK PRESS INC. 52
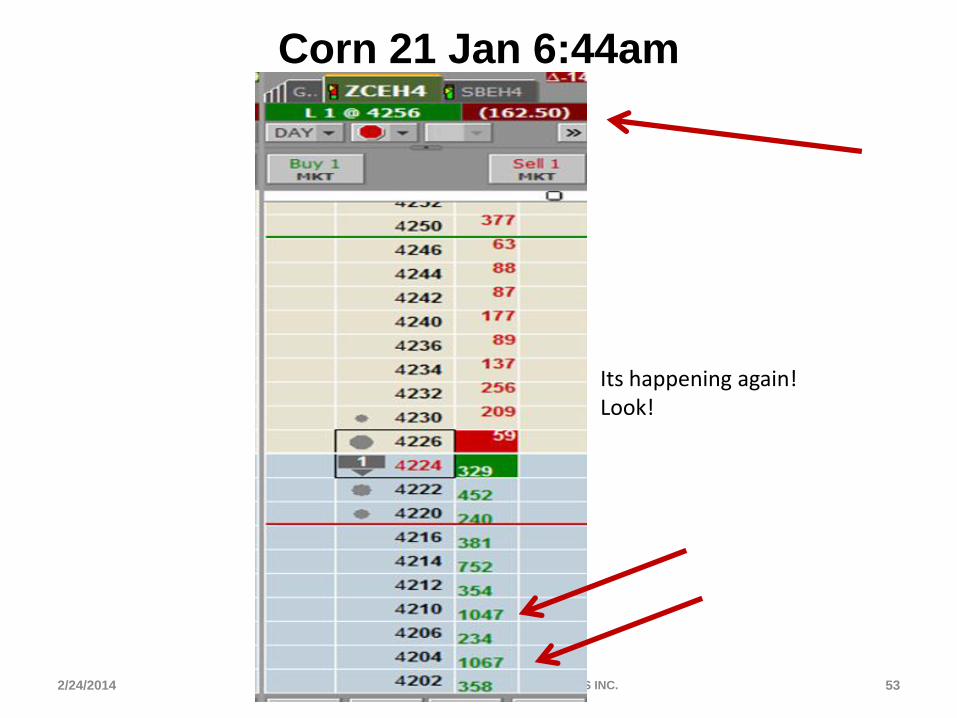
Corn 21 Jan 6:44am
2/24/2014 ©2014 JAKE BERNSTEIN/NETWORK PRESS INC. 53
Its happening again! Look!
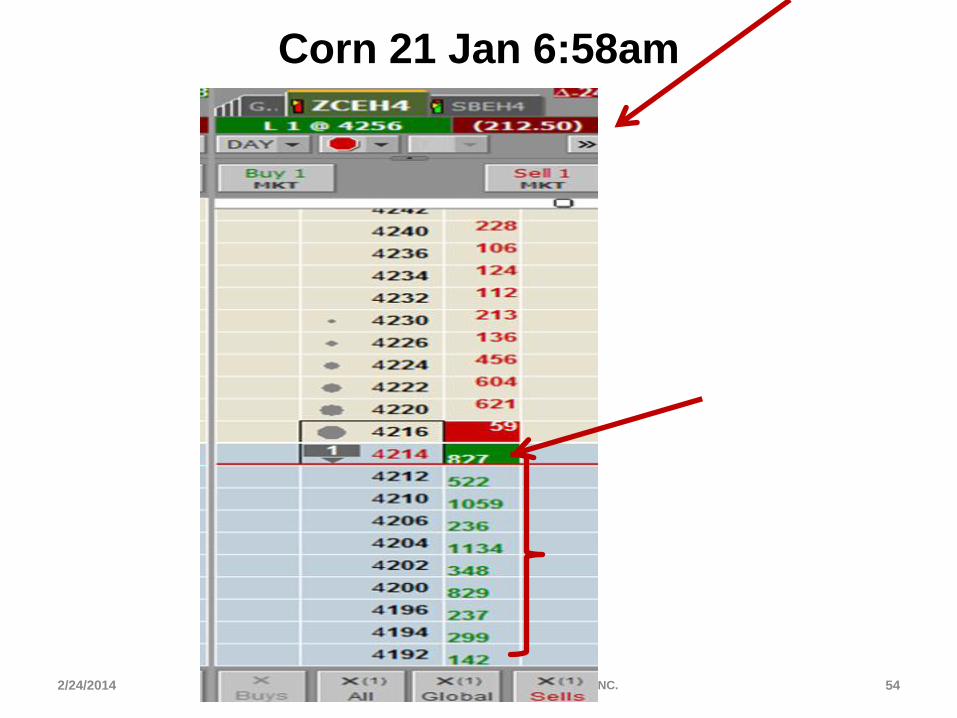
Corn 21 Jan 6:58am
2/24/2014 ©2014 JAKE BERNSTEIN/NETWORK PRESS INC. 54
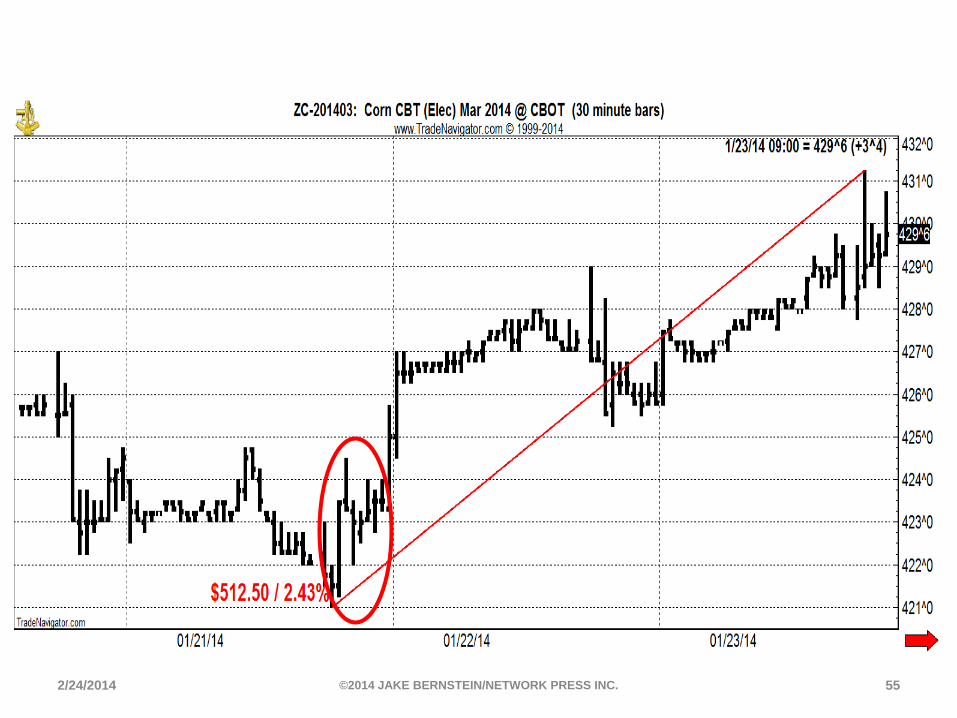
2/24/2014 ©2014 JAKE BERNSTEIN/NETWORK PRESS INC. 55
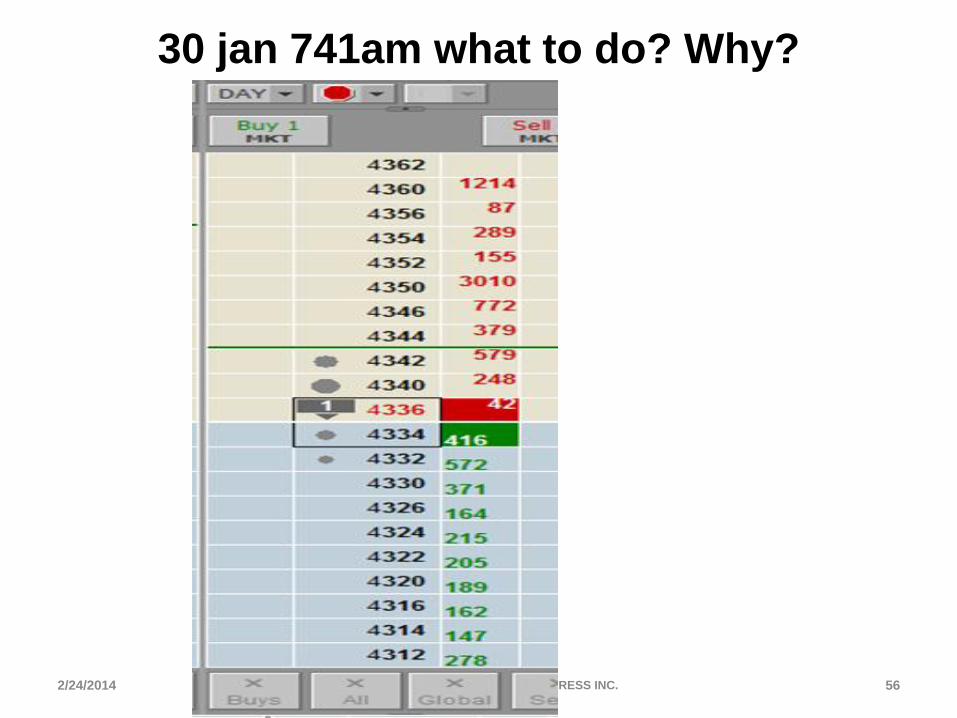
30 jan 741am what to do? Why?
2/24/2014 ©2014 JAKE BERNSTEIN/NETWORK PRESS INC. 56
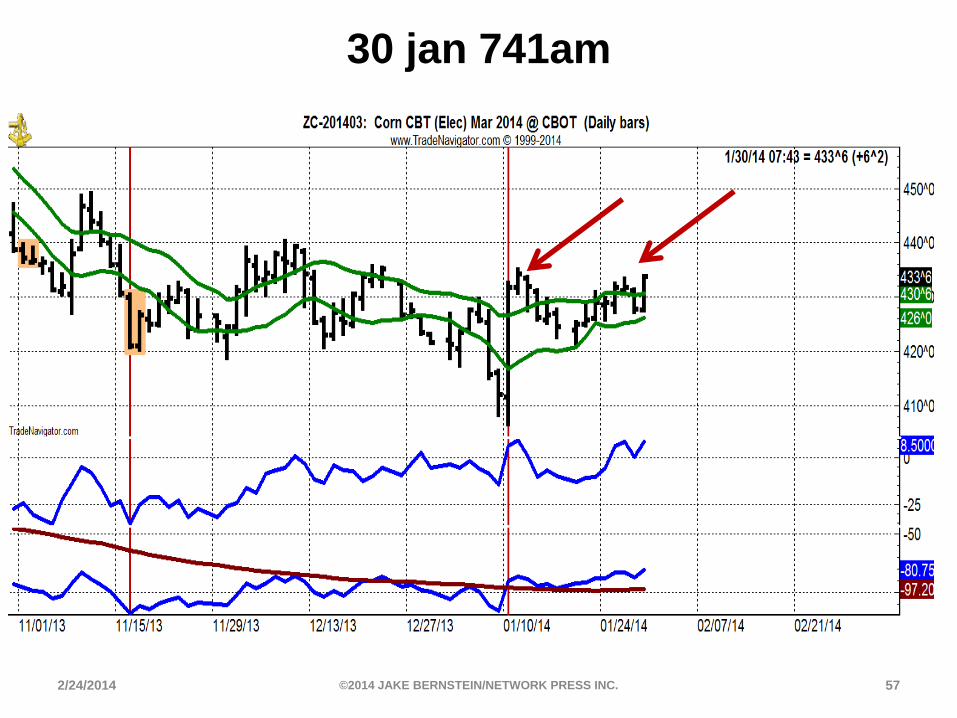
30 jan 741am
2/24/2014 ©2014 JAKE BERNSTEIN/NETWORK PRESS INC. 57

30 jan 837am
2/24/2014 ©2014 JAKE BERNSTEIN/NETWORK PRESS INC. 58
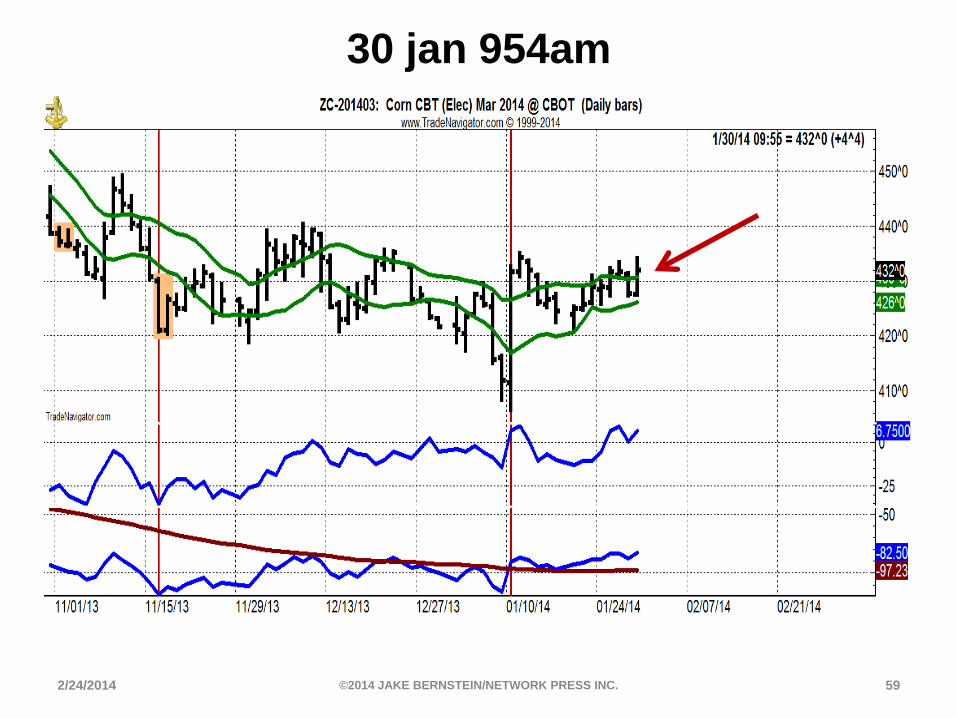
30 jan 954am
2/24/2014 ©2014 JAKE BERNSTEIN/NETWORK PRESS INC. 59
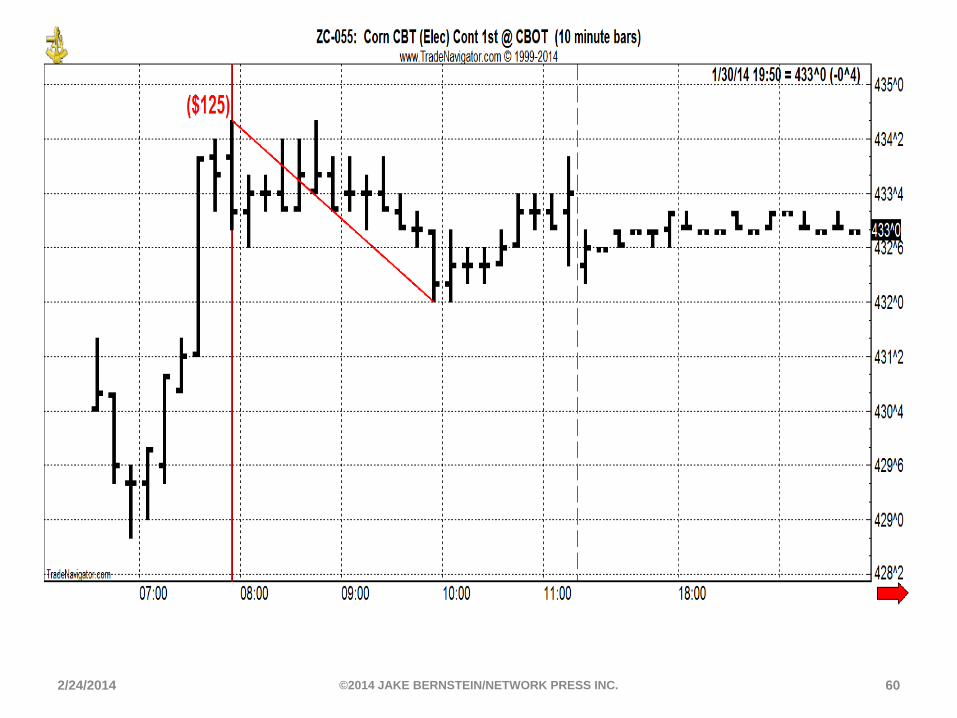
2/24/2014 ©2014 JAKE BERNSTEIN/NETWORK PRESS INC. 60
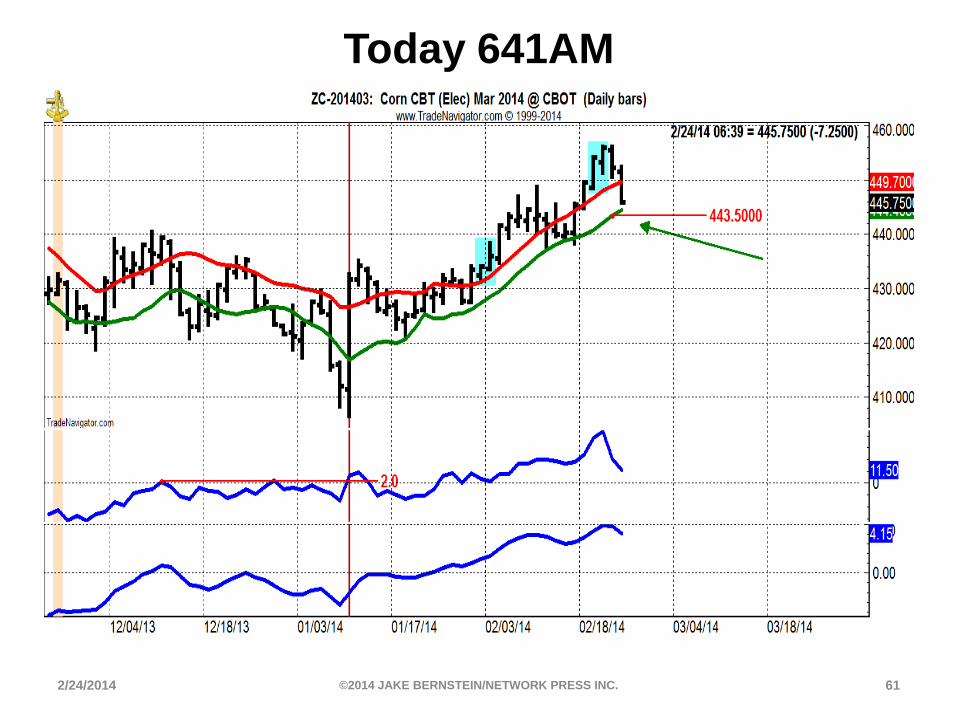
Today 641AM
2/24/2014 ©2014 JAKE BERNSTEIN/NETWORK PRESS INC. 61
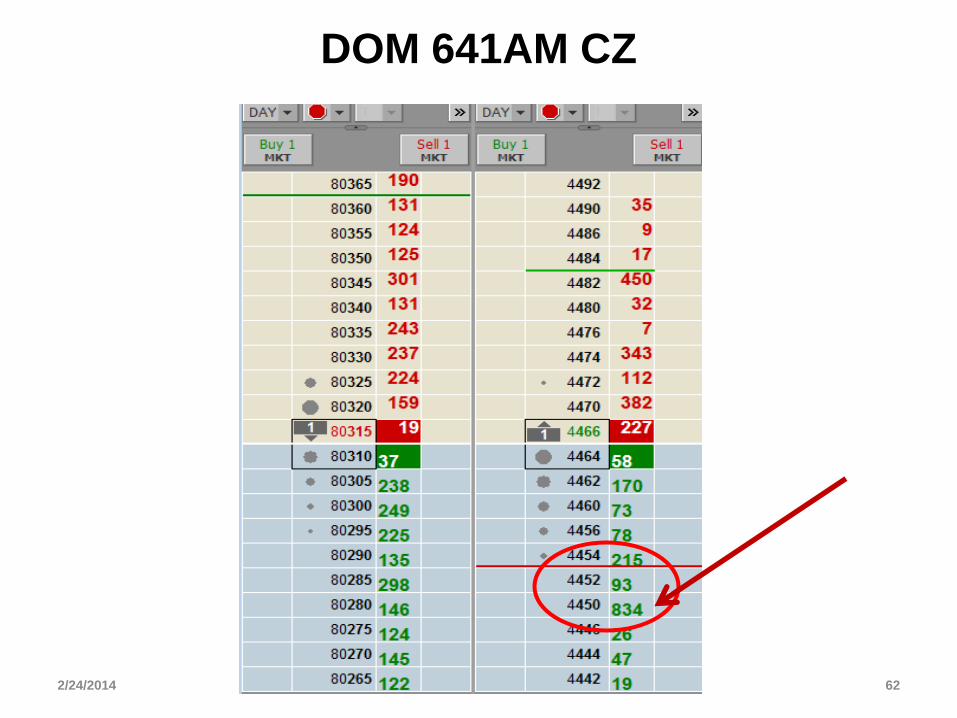
DOM 641AM CZ
2/24/2014 ©2014 JAKE BERNSTEIN/NETWORK PRESS INC. 62
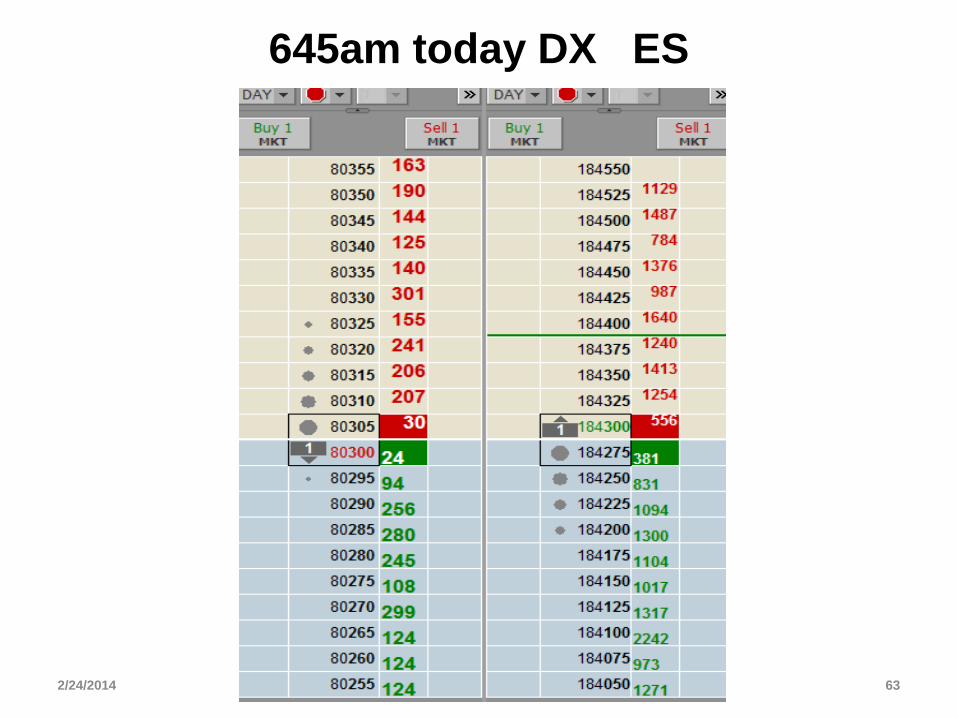
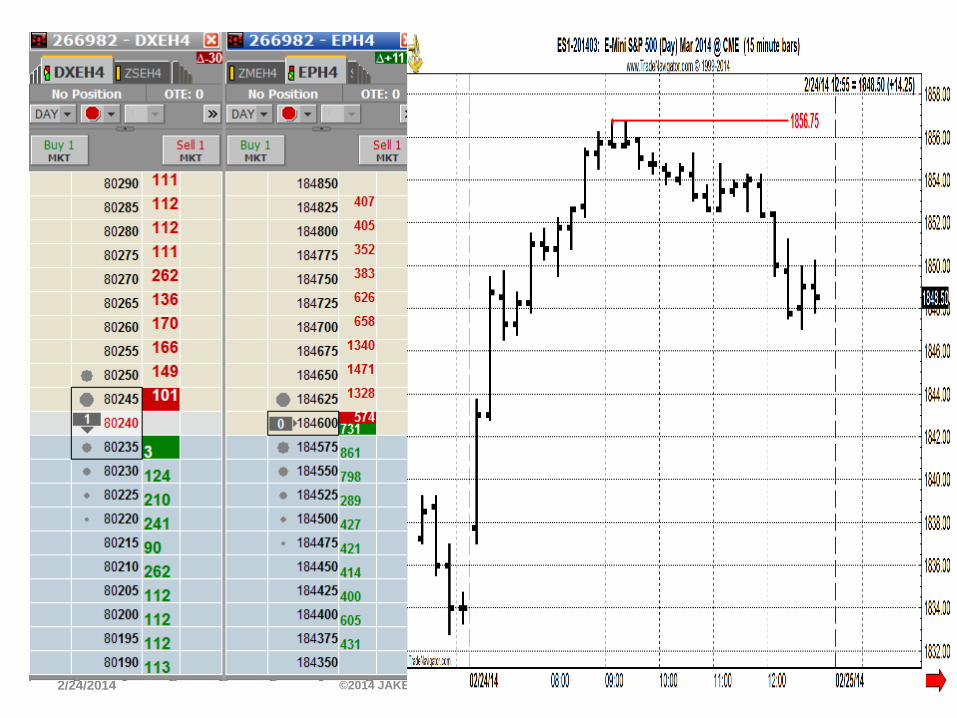
645am today DX ES
2/24/2014 ©2014 JAKE BERNSTEIN/NETWORK PRESS INC. 63
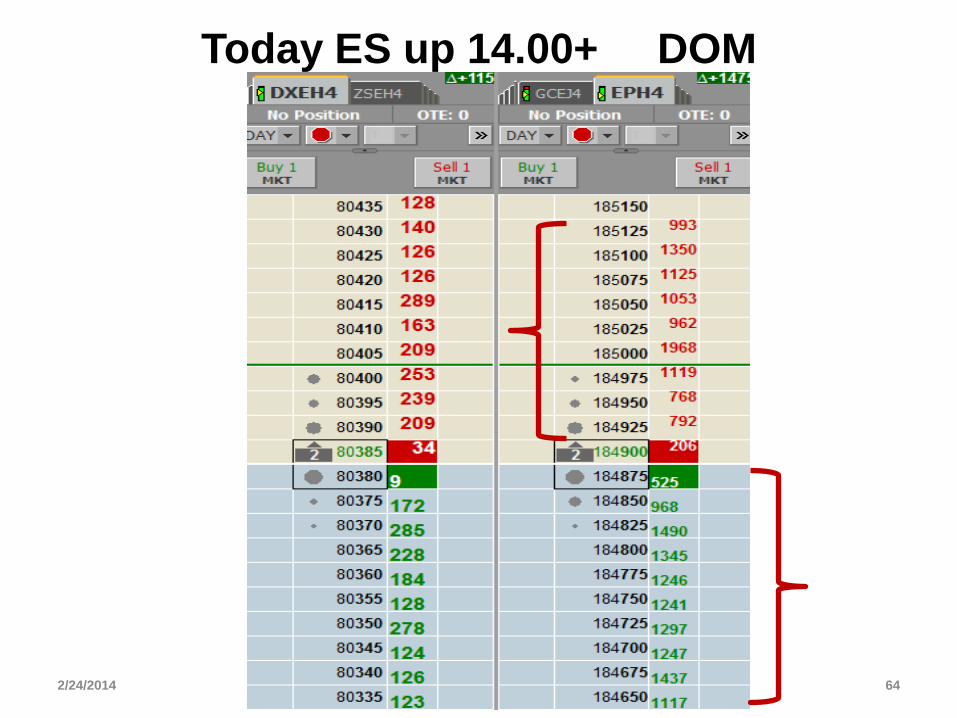
Today ES up 14.00+ DOM
2/24/2014 ©2014 JAKE BERNSTEIN/NETWORK PRESS INC. 64
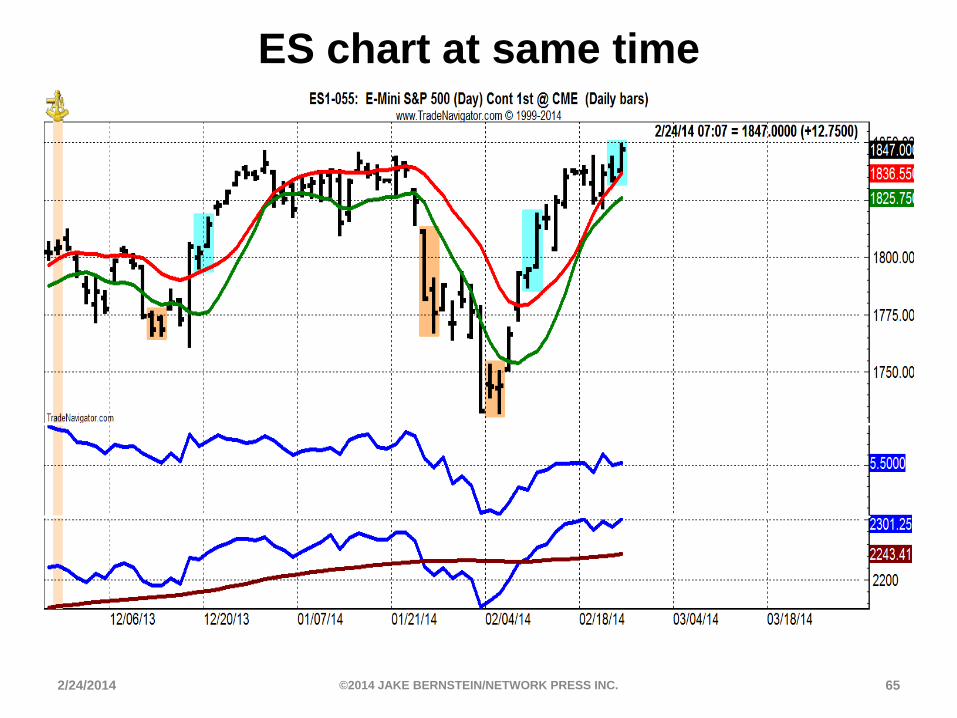
ES chart at same time
2/24/2014 ©2014 JAKE BERNSTEIN/NETWORK PRESS INC. 65
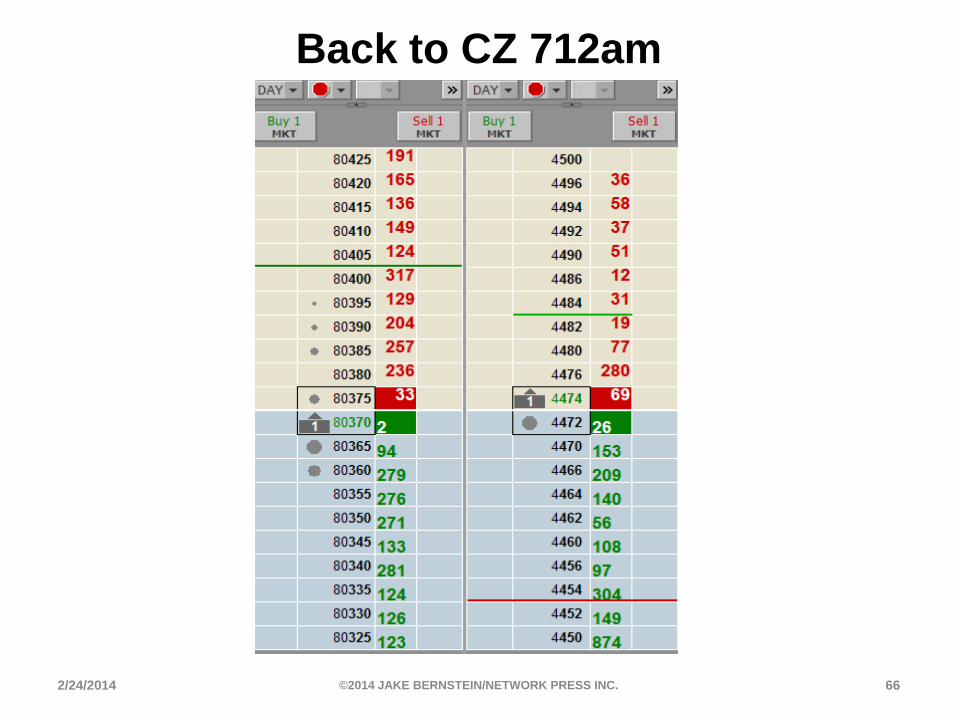
Back to CZ 712am
2/24/2014 ©2014 JAKE BERNSTEIN/NETWORK PRESS INC. 66
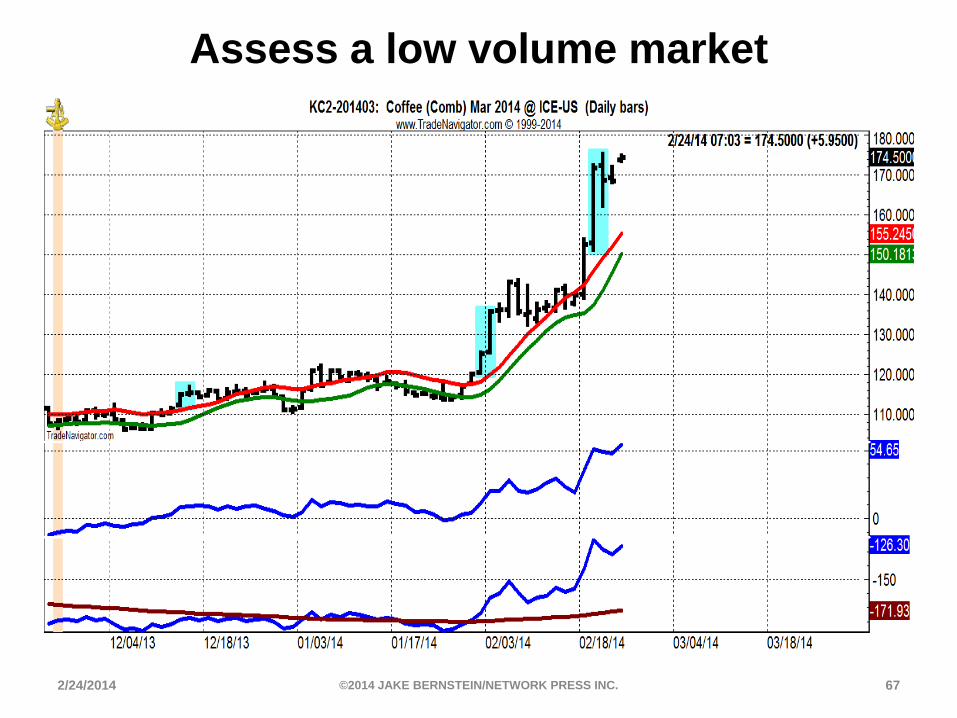
Assess a low volume market
2/24/2014 ©2014 JAKE BERNSTEIN/NETWORK PRESS INC. 67
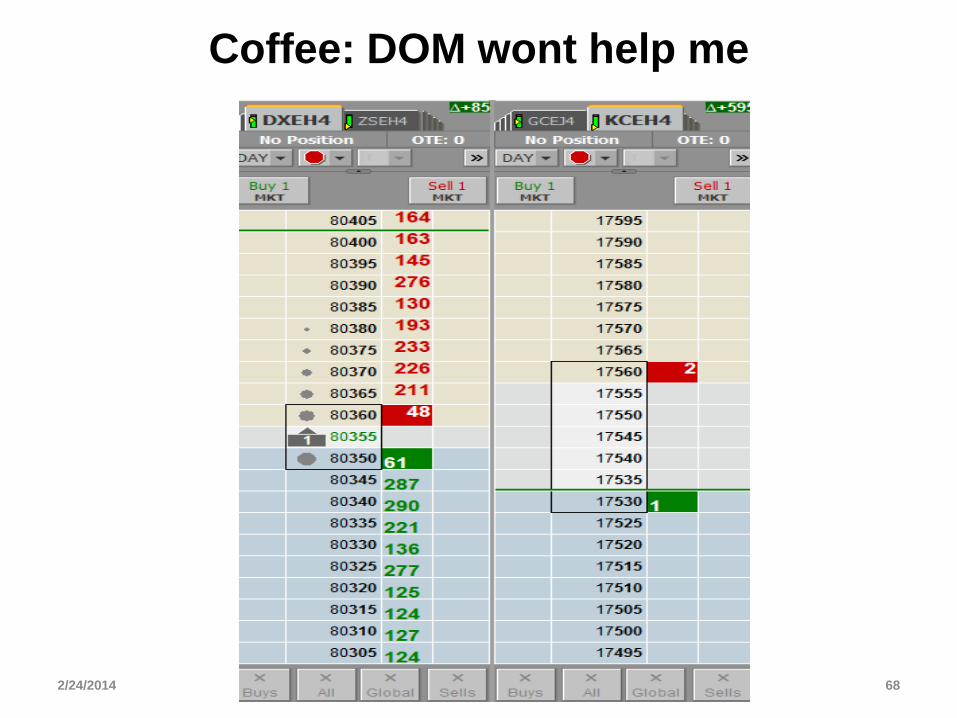
Coffee: DOM wont help me
2/24/2014 ©2014 JAKE BERNSTEIN/NETWORK PRESS INC. 68
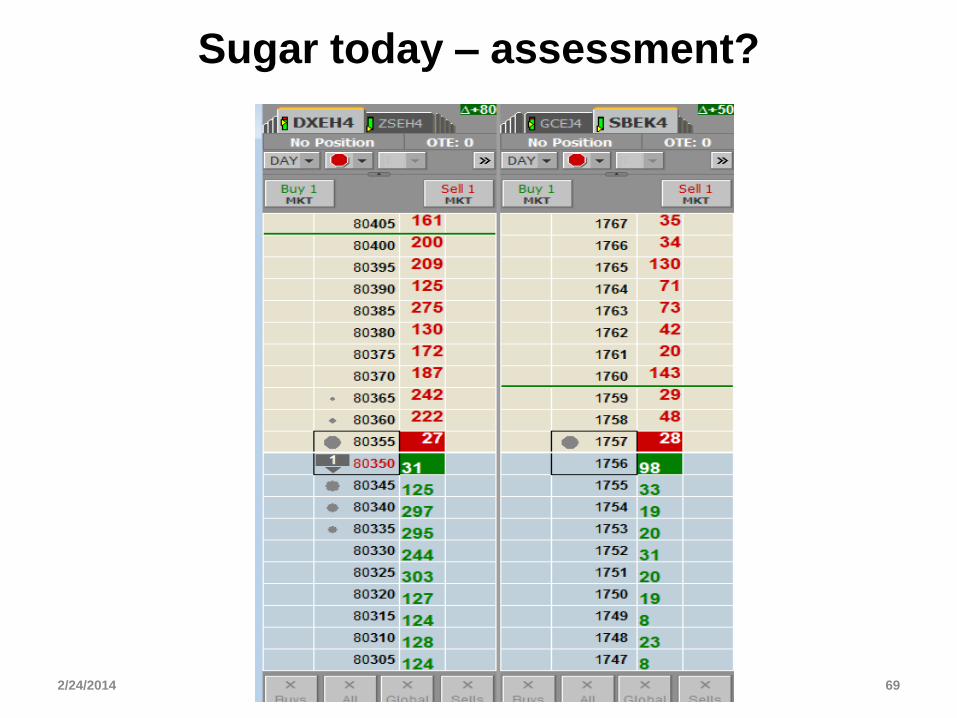
Sugar today – assessment?
2/24/2014 ©2014 JAKE BERNSTEIN/NETWORK PRESS INC. 69
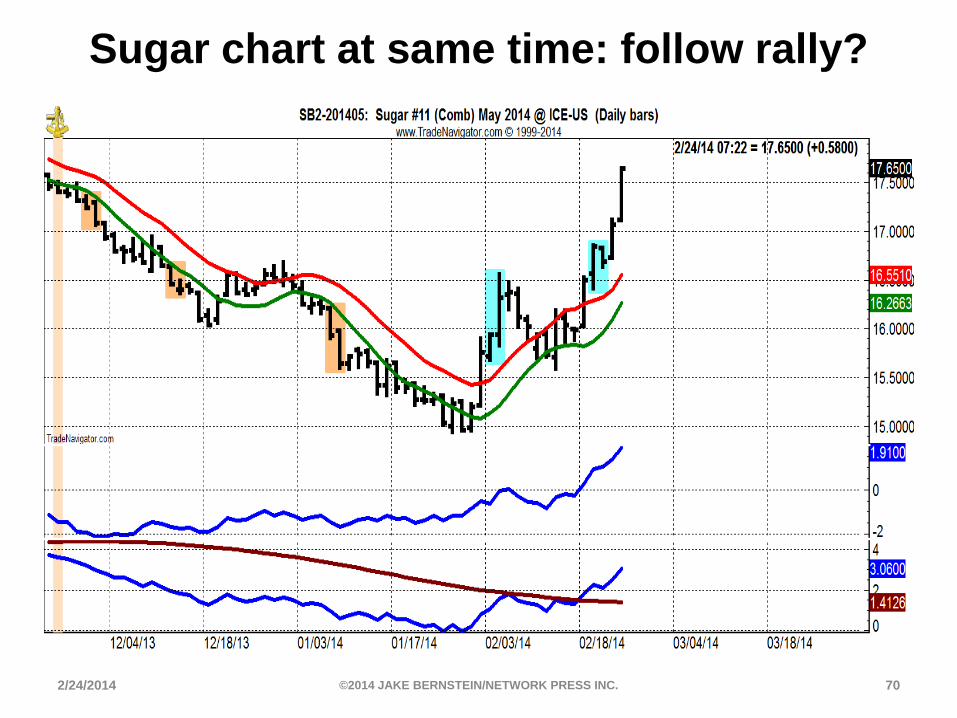
Sugar chart at same time: follow rally?
2/24/2014 ©2014 JAKE BERNSTEIN/NETWORK PRESS INC. 70
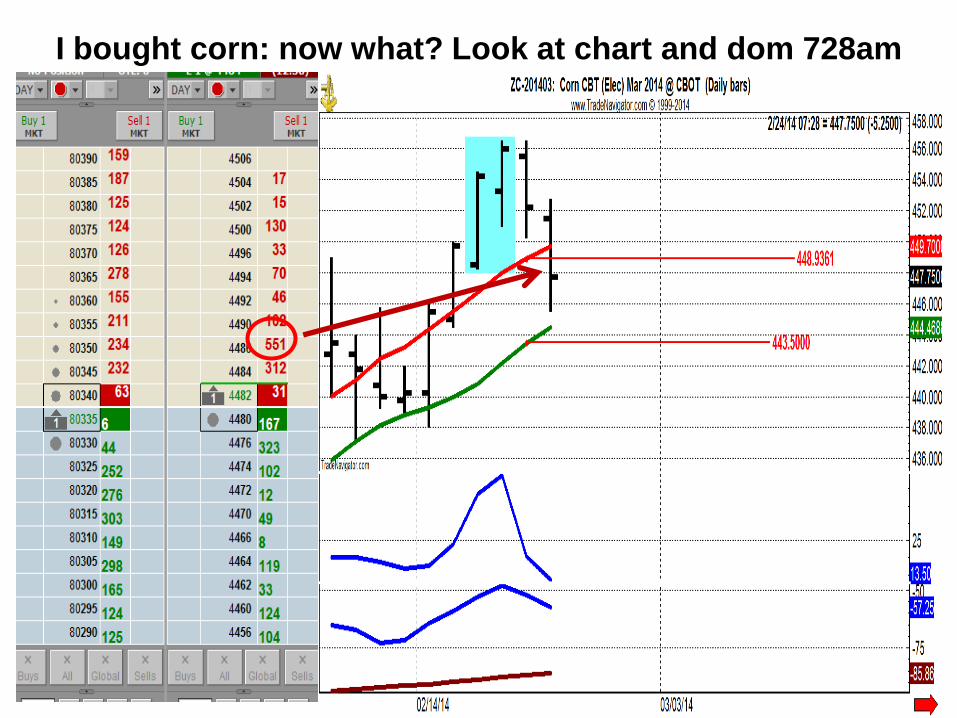
I bought corn: now what? Look at chart and dom 728am
2/24/2014 ©2014 JAKE BERNSTEIN/NETWORK PRESS INC. 71
2/24/2014 ©2014 JAKE BERNSTEIN/NETWORK PRESS INC. 72
Zc 744am
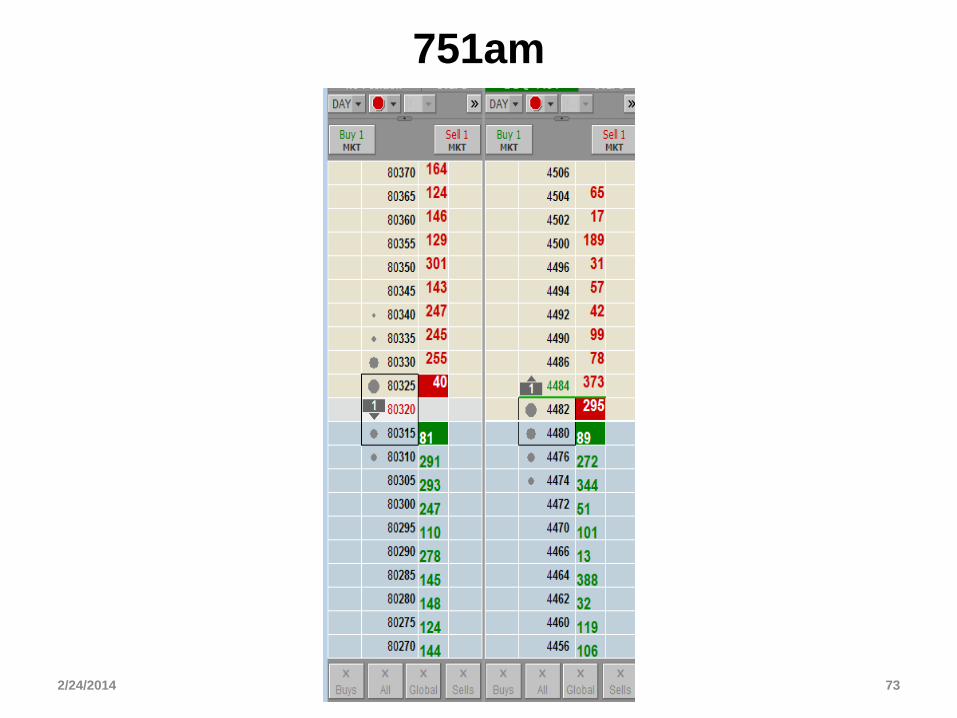
751am
2/24/2014 ©2014 JAKE BERNSTEIN/NETWORK PRESS INC. 73
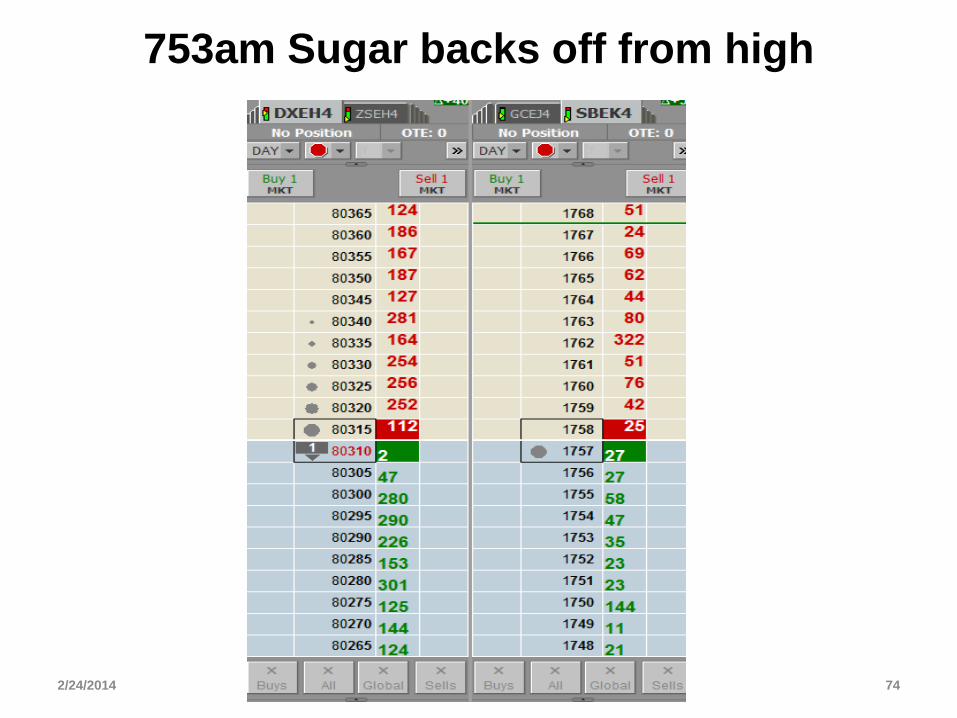
753am Sugar backs off from high
2/24/2014 ©2014 JAKE BERNSTEIN/NETWORK PRESS INC. 74
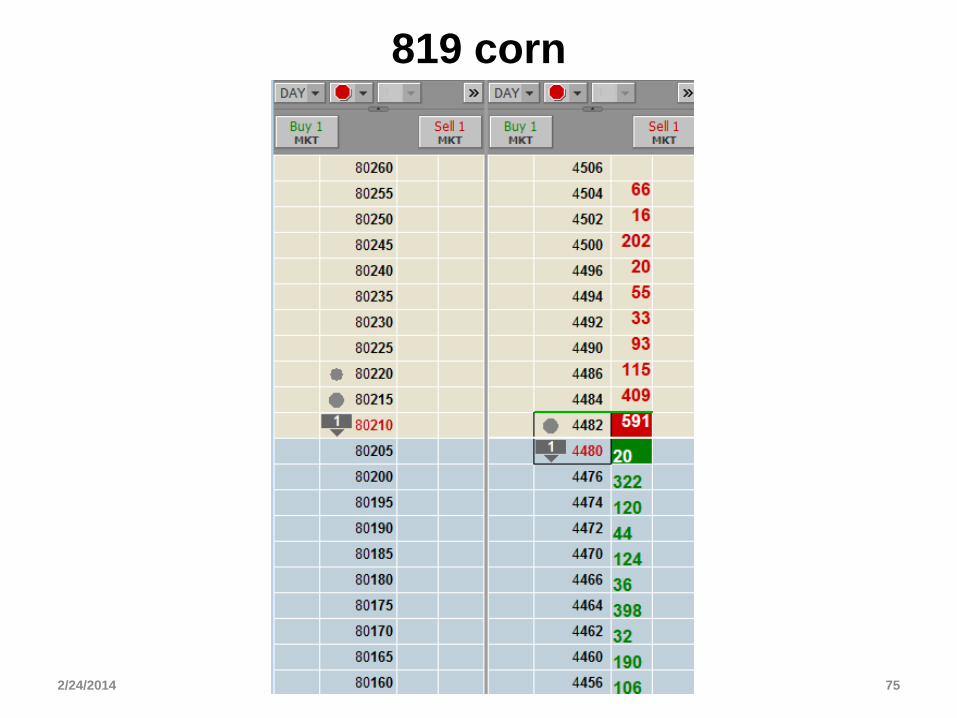
819 corn
2/24/2014 ©2014 JAKE BERNSTEIN/NETWORK PRESS INC. 75
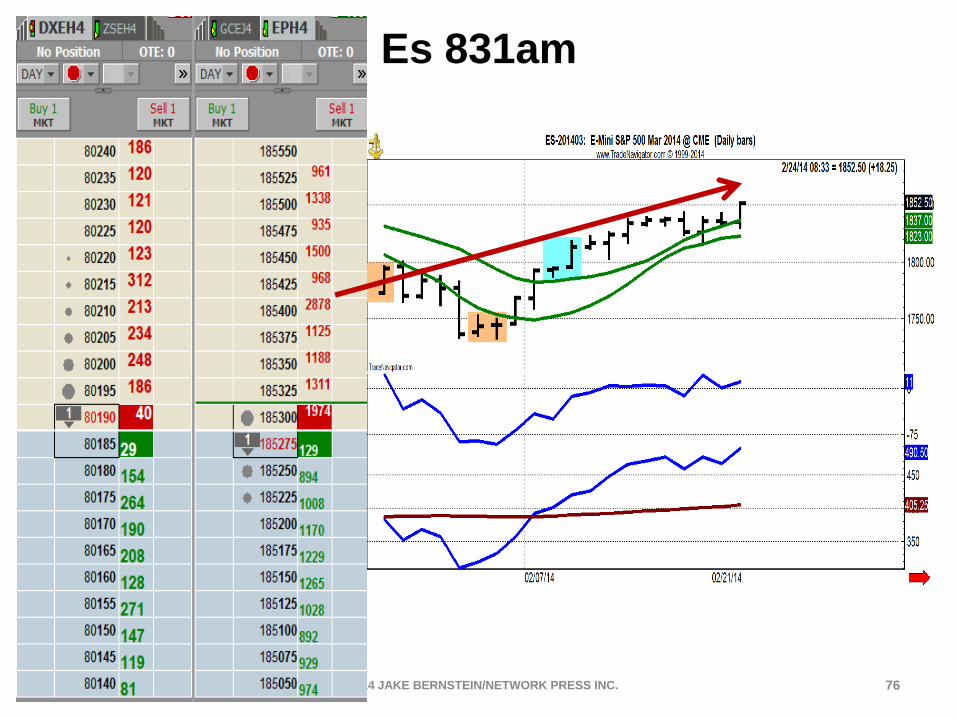
Es 831am
2/24/2014 ©2014 JAKE BERNSTEIN/NETWORK PRESS INC. 76

2/24/2014 ©2014 JAKE BERNSTEIN/NETWORK PRESS INC. 77
2/24/2014 ©2014 JAKE BERNSTEIN/NETWORK PRESS INC. 78
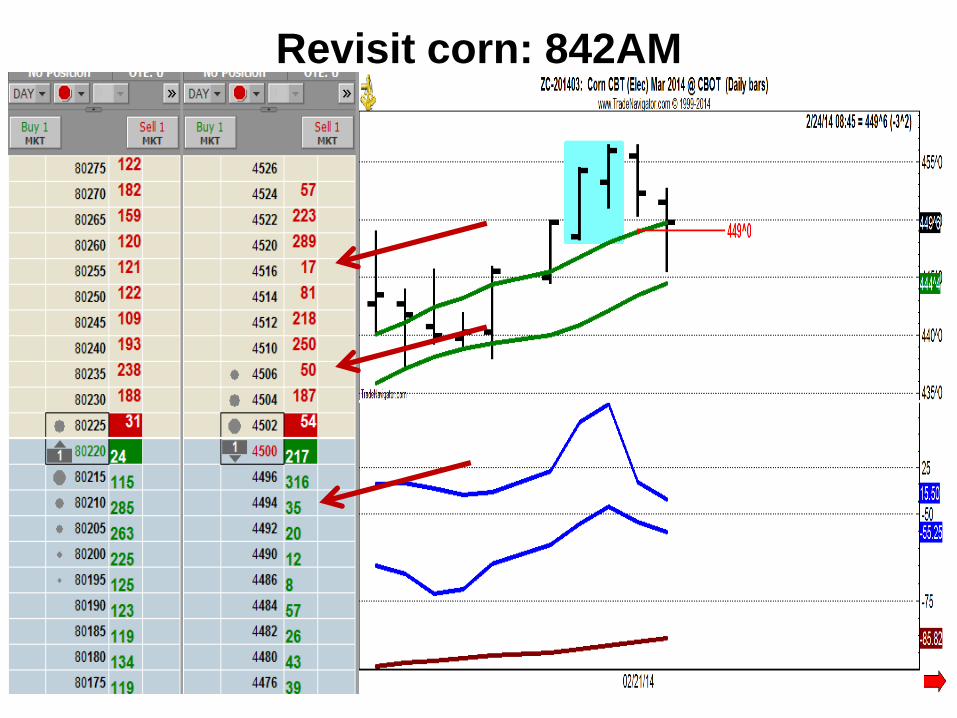
Revisit corn: 842AM
2/24/2014 ©2014 JAKE BERNSTEIN/NETWORK PRESS INC. 79
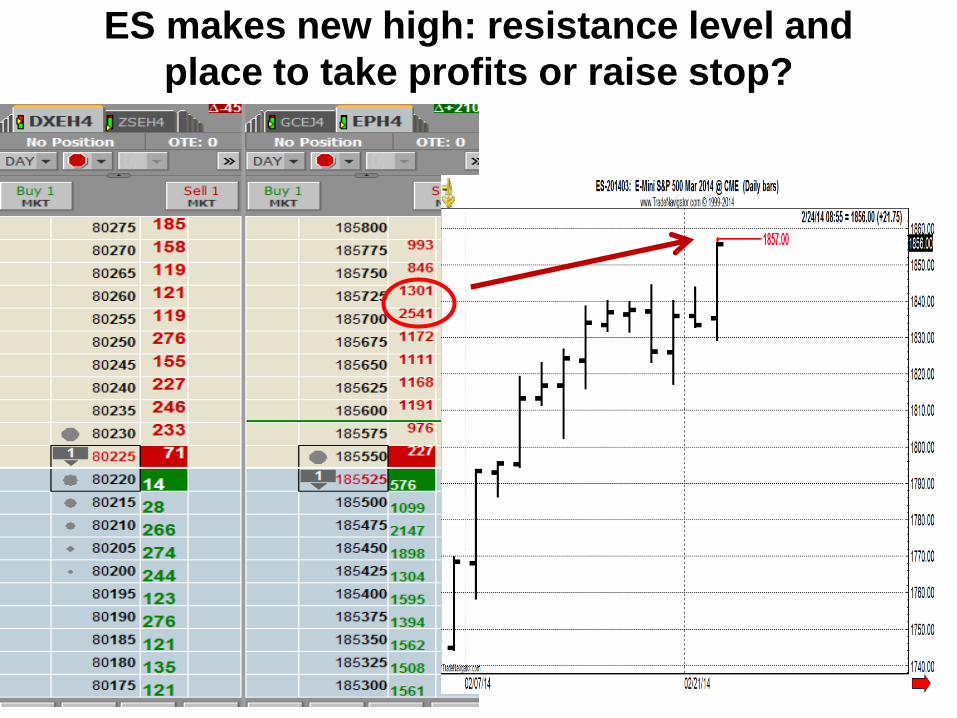
ES makes new high: resistance level and
place to take profits or raise stop?
2/24/2014 ©2014 JAKE BERNSTEIN/NETWORK PRESS INC. 80
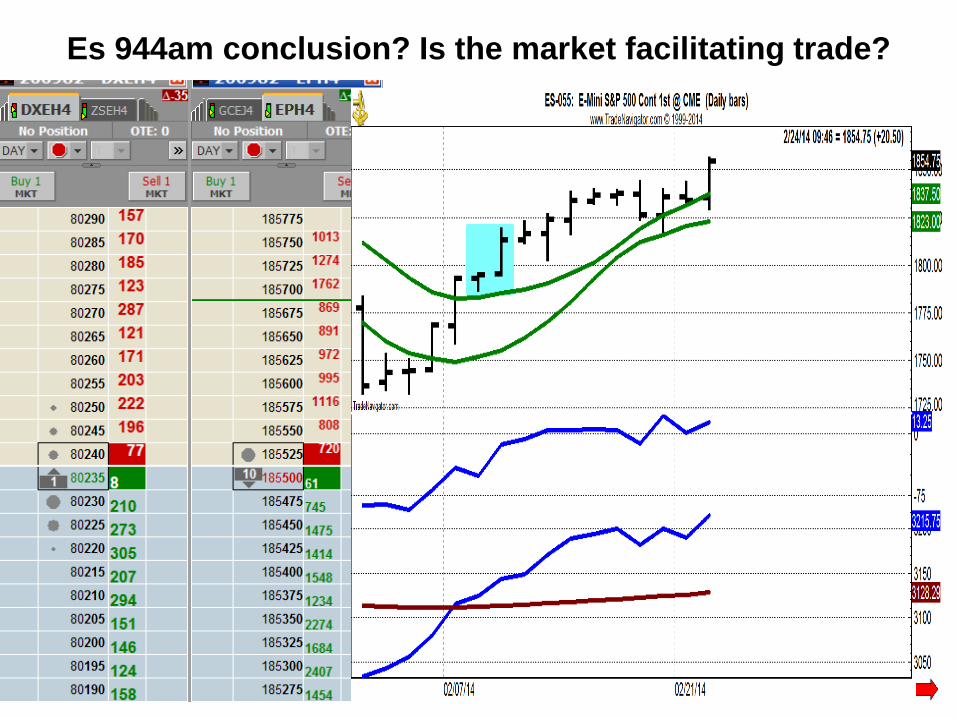
Es 944am conclusion? Is the market facilitating trade?
2/24/2014 ©2014 JAKE BERNSTEIN/NETWORK PRESS INC. 81
2/24/2014 ©2014 JAKE BERNSTEIN/NETWORK PRESS INC. 82
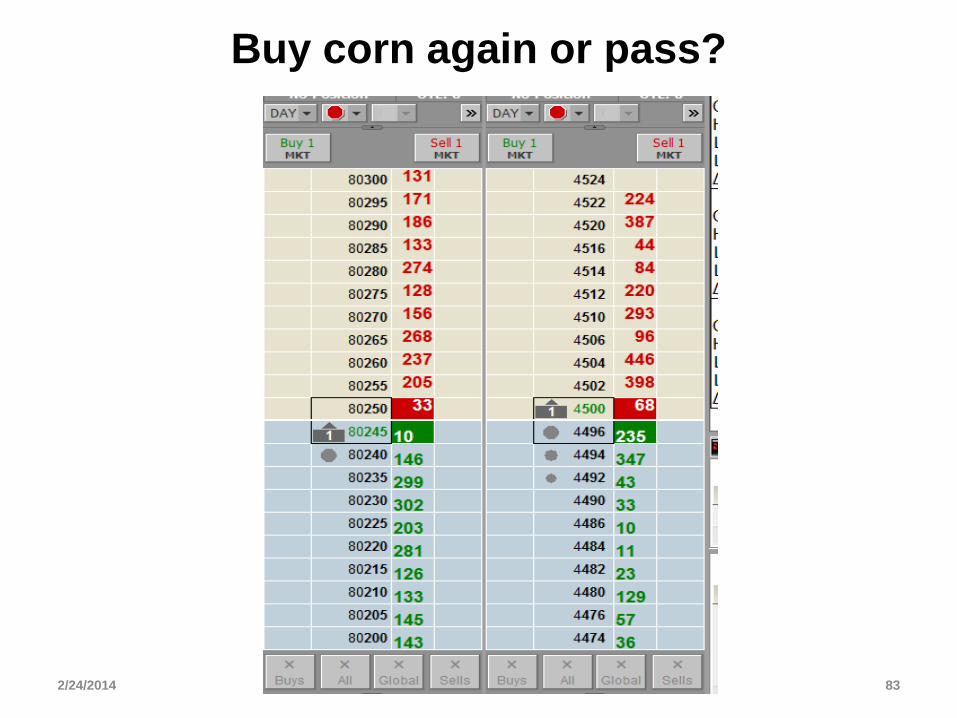
Buy corn again or pass?
2/24/2014 ©2014 JAKE BERNSTEIN/NETWORK PRESS INC. 83

• SSTT sessions are recorded
• I can be reached at 800-678-5253 or
831-430-0600
• Email me if you have questions:
• Mentoring appointment interview
– http://www.comtrade1.com/letter/
Best of trading
Jake Bernstein
• Upcoming Webinars & Events
2/24/2014 ©2014 JAKE BERNSTEIN/NETWORK PRESS INC. 84