how eco friendly is our money and is there an...
TRANSCRIPT

Scientific Article 1
How Eco friendly is our money and is there analternative?SID JOHN LEOPOLD1 AND NICLAS ENGLESSON2
1Executive Graduate School of Business, Stanford University [email protected] | Twitter | LinkedIn2Department of Mathematics, University of Stockholm, [email protected] | LinkedIn
Compiled November 27, 2017
Token money is money whose face value exceeds its costof production [1]. Examples of token money includeUnited States Dollar, Euro, Pound, Swiss Franc, Yenand, lately, there has been token money deployment ofdigital cryptocurrencies, such as Bitcoin, Ether and Rip-ple’s XRP. However, what is the cost of producing a cur-rency? How much does one transaction cost in termsof energy consumption? What carbon footprint doesmoney leave and are there more Eco friendly options?This paper will shed light on the energy consumptionof a few currencies and make comparisons to real lifeexamples. The goal is to make you look at the moneyproduction from an energy consumption point of view,and understand that there can be large economic andenvironmental benefits of choosing one currency overthe other, on a macroeconomic level.
LinkedIn article:
https://goo.gl/ge5cUu
INTRODUCTION
What carbon footprint does money leave behind and how en-ergy efficient is it? Are some currencies more environmentallyfriendly than others? We wish to make a comparison in aneasy and understandable way. We then need to quantify theunderlying efficiency of moving and upholding current moneysystems.
The following currencies will be compared :• American Dollar (USD) - on Visa network
• Bitcoin (BTC)
• Ethereum (ETH)
• Ripple (XRP)
The currencies will be measured in electricity consumptionand carbon footprint. A comparison will be made between the
currencies and households, dishwashers and the number of carmiles driven. Furthermore we will look at some Fortune top 50companies [2] such as Facebook, Alphabet (Google) and Ama-zon, and even the energy consumption of entire countries. Some(to the best of our knowledge) of the performed calculations,comparisons and conclusions have never been published before,and we hope this paper will act as a starting point for discussionsconcerning the existential purpose of money and what currencyfits that purpose the best, further we hope more calculationswill be made which will enable people to better understand andbenchmark current and future currency systems on a holisticlevel.
MONEY IS ALL ABOUT EFFICIENCY - A HISTORIC PER-SPECTIVE
One of the fundamental properties of money is that it should bea good medium of exchange. Its purpose is to enable more efficienttrade. Before the introduction of token money, welfare improv-ing trades would only occur if there existed a double coincidenceof wants. A good medium of exchange creates a situation whereagents on the market do not have to rely on the existence of saiddouble coincidence of wants. They trade goods and services forthat medium of exchange and later buy the goods and servicesthey want. Before the introduction of token money there was nostandardized value in the middle. To put it in layman’s terms:money should make it cheaper to enable trade. Keeping this inmind one could ask the question on whether we can measurewhich kind of token money costs the least.
Let us dig deeper into the efficiency and cost of money. Wecan now start looking at the comparison between currencies interms of electricity consumption and how they relate to otherbig energy consumers.
A. Macro perspectiveIn this section we look at the electricity consumption of a numberof currencies, including XRP, the cryptocurrency issued by theUnited States based company Ripple. We will later compare thecurrencies to the the electricity consumption of companies aswell as countries in order to gain some perspective on worldwide power consumption.
We begin by looking at the table 1, which shows the annualelectricity consumption of four currencies. The * indicates elec-tricity consumption via Visa network and throughout the paperwe will use USD on Visa networks as a guideline for USD. We

Scientific Article 2
Table 1. Annual electricity consumption C, [3, 4]
Currency TWh
Bitcoin (BTC) 26.05
Ether (ETH) 9.68
Visa* (USD) 0.5406
Ripple (XRP) 0.000536112
selected the Visa ledger to represent USD because it’s the cur-rent largest USD network in terms of transactions in the worldwith a total of 82.3 billion transactions in 2016 [5]. This tabledemonstrates the amount of power that is required for eachof the currencies yearly. Note that the table does not take intoaccount the number of transactions made with each currency.More on this in subsection B.
Table 2. Annual electricity consumption [3, 6–9]
Country TWh Company TWh
Syria 18.24 Apple 1.454
Ecuador 21.96 Facebook 1.83
Nigeria 25.5 Google 6.20
United States 3913 Amazon 7.2
Table 2 shows the annual electricity consumption of fourcountries and four large international companies.
It appears the amount of power required to have Bitcoin run-ning is comparable to the energy consumption of entire nations.Bitcoin is consuming substantially more electricity than Syriaand Ecuador annually, and almost equal to Nigeria’s consump-tion. Apple, Facebook, Google and Amazon have the commondenominator that they run some of the largest server farms inthe world, giving a good indicator what, so-called, "large energyusage" sums up to in TWh numbers. Notice how all these com-panies combined only use 64% of Bitcoins annual energy use,compared to Ripple’s XRP who only uses a super small fractioncompared to any of these companies.
Keeping in mind Bitcoin is not even a widely used currency(in a comparative example to USD or other big currencies), onecannot hesitate to think there must be a less costly option interms of electricity consumption.
B. Comparative section
Let’s begin by looking at how the energy consumption of thefour currencies in Table 1 compare to U.S households:
As indicated in table 3, Bitcoin seems to be very costly interms of how many households (2,4 million) could be powered,compared to Visa (41,000) and Ripple’s (XRP) with only 50 house-holds worth of energy usage to uphold its entire system.
Until this point we have only looked at how the annual en-ergy consumption of each currency compares with that of na-tions and some of the world’s largest companies. This was donein order to shed light on how costly some of the currencies canbe, even without taking into consideration the amount of trans-actions that are made for each currency. In order to create a faircomparison among the currencies one must, of course, compare
Table 3. Number of U.S. households that could be poweredby each currency (C).
Currency Households
Bitcoin (BTC) 2, 412, 037
Ether (ETH) 879, 629
Visa (USD) 41351
Ripple (XRP) 50
the consumption per transaction, rather than the total consump-tion. By doing so we can get a fair estimate of how the currenciescompare if they were used to the same extent. Then we can cre-ate real life comparisons of how much power could be saved ifone currency was used instead of another.
Let us begin by looking at how much electricity is used forone single transaction for each of the currencies. The table clearlyshows the superiority of Ripple’s XRP over for instance Bitcoin(BTC). A more intuitive way of showing the benefits of havinga lower energy consumption is to relate it to real life examples.This will be done in subsection B. Note that there are two possi-ble ways to calculate electricity per transaction. See table 14 forthe distinction between current annual transactions and potentialmaximum annual transactions.
Table 4. Electricity consumed per transaction
Currency KWh
Bitcoin (BTC) 118
Ether (ETH) 20.294
Visa (USD) 0.006490
Ripple (XRP) 0.00001133
The distribution of transactions are shown in figure 1 below,where we can see that USD is the most commonly used currencyof 2012-2014 and that none of the current cryptocurrencies yethas a noticeble amount of tranactions. Bitcoin only averagesabout 300, 000 transactions per day in 2017. [10]
Fig. 1. Worldwide international currency usage, 2012-2014
Notice how energy usage per transaction for Ripple is equiv-alent to 0.0021% of Bitcoin and 0.0056% of Ether. Even moreremarkable is that it’s significantly lower than Visa, which hasbeen around for decades and is built to be as efficient as possible.

Scientific Article 3
Fig. 2. Annual TWh consumption
Figure 2 shows the annual energy consumption of Bitcoinand some of the countries and companies mentioned above inthe tables. This gives a clearer picture on how costly Bitcoinactually is for the environment.
Hypothetical scenario
Suppose that Visa, Ether and Ripple’s XRP would have the sameamount of transactions as Bitcoins hypotetical maximum: TodayBitcoin can sustain maximum 7 transactions per second [11], thatis
7 ∗ 60 ∗ 60 ∗ 24 ∗ 365 = 220.752M
annually.How would the currencies compare in their total energy us-
age and in comparison to other electricity powered commodi-ties?
Table 5. Hypothetical annual electricity consumption with220.752M transactions
Currency TWh
Bitcoin (BTC) 26.05
Ether (ETH) 12.141
Visa* (USD) 0.001, 432, 68
Ripple (XRP) 0.000, 002, 501
In table 5, get a better understanding of the currencies energyusage with the same number of transactions (220.752M). Thisimproves our insight into how costly Bitcoin and Ether is com-pared to both Visa and Ripple’s XRP. Further we see that Rippleis the most efficient currency in terms of energy use, only using0.17% of the second most energy efficient money system (Visa).
Columns 2-4 in Table 6 show the number of light bulbs, dish-washers and car miles driven that could be powered by theenergy use of 220.752M transactions for each of the currencies.We use a Tesla Model 3 as guideline, equipped with entry model
Table 6. Number of light bulbs, dishwashers and driven carmiles that could be powered by the energy use of 220.752Mtransactions
Currency Light bulbs Dishwashers Car-miles driven
Bitcoin (BTC) 148.68M 69.577M 114.75 Billion
Ether (ETH) 69.29M 32.42M 52.48 Billion
VISA (USD) 8177 3826 6.311 Million
Ripple (XRP) 14 6 11018
battery capacity (50KWh). See appendix C for further assump-tions. A low number represents a more energy efficient currency,a direct example of this would be if you deducted the number ofdishwashers with Ripple from Bitcoins number of dishwashers:
69.5777M− 6 ≈ 69.577M
you get the number of dishwashers that could have been pow-ered by the saved energy if using Ripple instead of Bitcoin. Seecalculations C. Using the same technique, we can easily calcu-late substantial numbers. Given this hypothetical scenario, ifeverybody switched from Bitcoin to Ripple’s XRP with the savedenergy we would be able to go to the moon and back 240.000times! This assuming that the "Biohazard filter" in Tesla Model3 would enable protection from the vacuum in space, and thepower in the battery would allow the car to fly and not justspin it’s wheels. This gives a completely new perspective of acurrency actually “going to the moon".
Quantifying in terms of USD
Leaving the hypothetical scenario behind, we will now com-pare the currencies’ actual energy consumption by quantifyingthe electricity use into the cost of USD. Highlighting electricityusage in cost of USD as well as doing comparisons to cost ofcommodities gives us a better understanding of the cost of trans-actions and upholding the money systems. Highlighting costsfor basic tasks such as making a transaction makes one realizethat less cost enables more transactions and vice versa.
Furthermore, this cost have to be paid by the participatingparties using the currency. In the case of Bitcoin, Ether andRipple (XRP) the cost is added directly as a transaction fee, or itcan be added indirectly where the fee is included in the goods’or services’ price, leaving customers paying a higher price orbusinesses with lower margins or fewer sales. It’s obvious thereare benefits for all parties using a currency which enables tradewith lower costs, especially for transfers.
Table 7. Cost in USD for current annual energy usage
Currency USD
Bitcoin (BTC) 3.124 billion
Ether (ETH) 1.161 billion
VISA (USD) 64.87 million
Ripple (XRP) 64333
From a cost perspective we have several billions reasons toswitch from Bitcoin to Ripple’s XRP.
Scientific Article 4
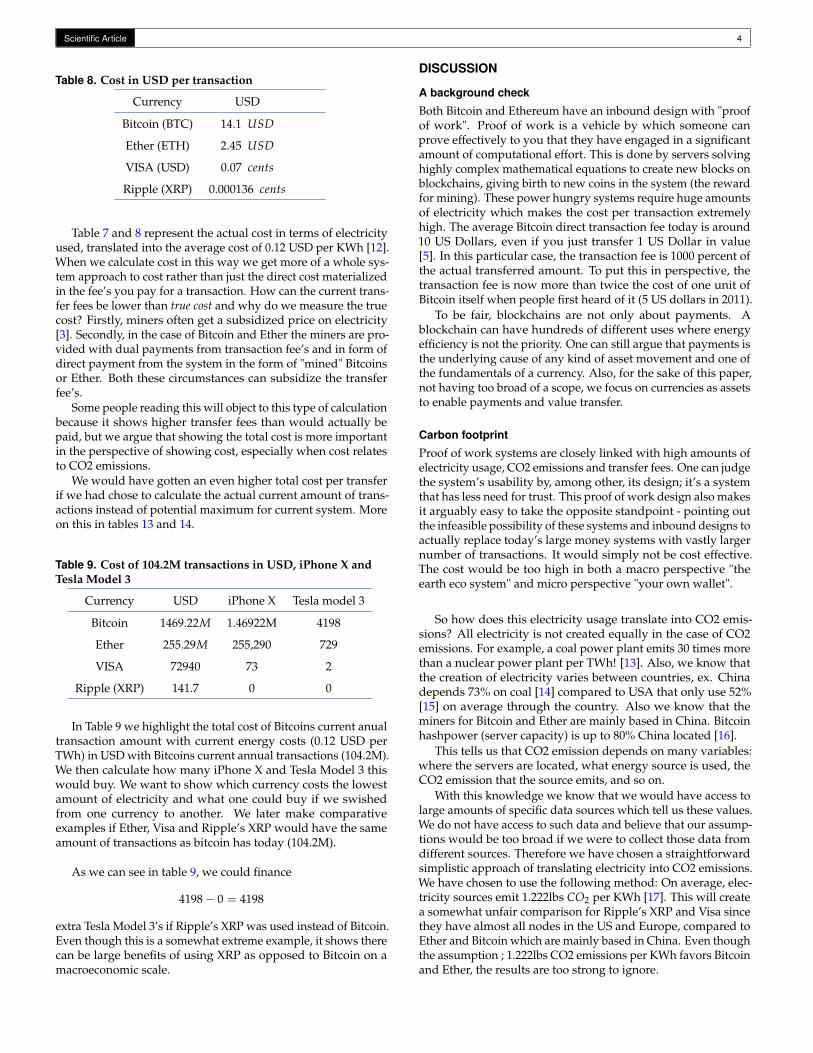
Table 8. Cost in USD per transaction
Currency USD
Bitcoin (BTC) 14.1 USD
Ether (ETH) 2.45 USD
VISA (USD) 0.07 cents
Ripple (XRP) 0.000136 cents
Table 7 and 8 represent the actual cost in terms of electricityused, translated into the average cost of 0.12 USD per KWh [12].When we calculate cost in this way we get more of a whole sys-tem approach to cost rather than just the direct cost materializedin the fee’s you pay for a transaction. How can the current trans-fer fees be lower than true cost and why do we measure the truecost? Firstly, miners often get a subsidized price on electricity[3]. Secondly, in the case of Bitcoin and Ether the miners are pro-vided with dual payments from transaction fee’s and in form ofdirect payment from the system in the form of "mined" Bitcoinsor Ether. Both these circumstances can subsidize the transferfee’s.
Some people reading this will object to this type of calculationbecause it shows higher transfer fees than would actually bepaid, but we argue that showing the total cost is more importantin the perspective of showing cost, especially when cost relatesto CO2 emissions.
We would have gotten an even higher total cost per transferif we had chose to calculate the actual current amount of trans-actions instead of potential maximum for current system. Moreon this in tables 13 and 14.
Table 9. Cost of 104.2M transactions in USD, iPhone X andTesla Model 3
Currency USD iPhone X Tesla model 3
Bitcoin 1469.22M 1.46922M 4198
Ether 255.29M 255,290 729
VISA 72940 73 2
Ripple (XRP) 141.7 0 0
In Table 9 we highlight the total cost of Bitcoins current anualtransaction amount with current energy costs (0.12 USD perTWh) in USD with Bitcoins current annual transactions (104.2M).We then calculate how many iPhone X and Tesla Model 3 thiswould buy. We want to show which currency costs the lowestamount of electricity and what one could buy if we swishedfrom one currency to another. We later make comparativeexamples if Ether, Visa and Ripple’s XRP would have the sameamount of transactions as bitcoin has today (104.2M).
As we can see in table 9, we could finance
4198− 0 = 4198
extra Tesla Model 3’s if Ripple’s XRP was used instead of Bitcoin.Even though this is a somewhat extreme example, it shows therecan be large benefits of using XRP as opposed to Bitcoin on amacroeconomic scale.
DISCUSSION
A background check
Both Bitcoin and Ethereum have an inbound design with "proofof work". Proof of work is a vehicle by which someone canprove effectively to you that they have engaged in a significantamount of computational effort. This is done by servers solvinghighly complex mathematical equations to create new blocks onblockchains, giving birth to new coins in the system (the rewardfor mining). These power hungry systems require huge amountsof electricity which makes the cost per transaction extremelyhigh. The average Bitcoin direct transaction fee today is around10 US Dollars, even if you just transfer 1 US Dollar in value[5]. In this particular case, the transaction fee is 1000 percent ofthe actual transferred amount. To put this in perspective, thetransaction fee is now more than twice the cost of one unit ofBitcoin itself when people first heard of it (5 US dollars in 2011).
To be fair, blockchains are not only about payments. Ablockchain can have hundreds of different uses where energyefficiency is not the priority. One can still argue that payments isthe underlying cause of any kind of asset movement and one ofthe fundamentals of a currency. Also, for the sake of this paper,not having too broad of a scope, we focus on currencies as assetsto enable payments and value transfer.
Carbon footprint
Proof of work systems are closely linked with high amounts ofelectricity usage, CO2 emissions and transfer fees. One can judgethe system’s usability by, among other, its design; it’s a systemthat has less need for trust. This proof of work design also makesit arguably easy to take the opposite standpoint - pointing outthe infeasible possibility of these systems and inbound designs toactually replace today’s large money systems with vastly largernumber of transactions. It would simply not be cost effective.The cost would be too high in both a macro perspective "theearth eco system" and micro perspective "your own wallet".
So how does this electricity usage translate into CO2 emis-sions? All electricity is not created equally in the case of CO2emissions. For example, a coal power plant emits 30 times morethan a nuclear power plant per TWh! [13]. Also, we know thatthe creation of electricity varies between countries, ex. Chinadepends 73% on coal [14] compared to USA that only use 52%[15] on average through the country. Also we know that theminers for Bitcoin and Ether are mainly based in China. Bitcoinhashpower (server capacity) is up to 80% China located [16].
This tells us that CO2 emission depends on many variables:where the servers are located, what energy source is used, theCO2 emission that the source emits, and so on.
With this knowledge we know that we would have access tolarge amounts of specific data sources which tell us these values.We do not have access to such data and believe that our assump-tions would be too broad if we were to collect those data fromdifferent sources. Therefore we have chosen a straightforwardsimplistic approach of translating electricity into CO2 emissions.We have chosen to use the following method: On average, elec-tricity sources emit 1.222lbs CO2 per KWh [17]. This will createa somewhat unfair comparison for Ripple’s XRP and Visa sincethey have almost all nodes in the US and Europe, compared toEther and Bitcoin which are mainly based in China. Even thoughthe assumption ; 1.222lbs CO2 emissions per KWh favors Bitcoinand Ether, the results are too strong to ignore.

Scientific Article 5
In the following tables we show the current annual CO2emissions for each of the currencies given their current annualconsumption of electricity.
Table 10. Current annual C02 emissions
Currency LBS of CO2
Bitcoin (BTC) 31833.1M
Ether (ETH) 11828.96M
VISA (USD) 660.61321
Ripple (XRP) 655128
Table 11. C02 emissions per transaction
Currency LBS of CO2
Bitcoin (BTC) 144.2029
Ether (ETH) 20.003
VISA (USD) 0.00794
Ripple (XRP) 0.0000138
We will now compare a number of things with the emissionsfrom the different currencies, given 220.752M transactions (thecurrent maximum for Bitcoin). Firstly, we compare them withthe number of car miles that could be driven for the same CO2.A typical passenger vehicle emits 0.9060 lbs per mile driven[18]. We also look at the number of times a Boeing 747 cantravel around the world with the same emission as the differentcurrencies, given 220.752M transactions. According to [19] aBoeing 747 emits 10.1kg/km = 35.83lbs/mile. Also, the radiusof Earth at the equator is 3,963 miles [20]. This tells us that theemission for flying around the globe once is
35.83× 3963 = 141994.29
lbs of CO2. Looking at table 12 we see the calculations of thesecomparisons given the current amount of maximum TPS (trans-actions per second) for Bitcoin.
Table 12. Annual CO2 emissions and comparative examplesof car miles driven and trips around the world in a Boeing747
Currency CO2 Car miles Boeing 747
Bitcoin (BTC) 31833.1M 35135M 224,185.7
Ether (ETH) 4415.70M 4873M 31,097.7
VISA (USD) 1.7527M 1.9345M 12.34
Ripple (XRP) 3057.26 3374.5 0.021
Table 12 shows the annual number car miles driven andtrips around the globe in a Boeing 747 one can get for the sameamount of CO2 as the different currencies emit, given 220,079Mtransactions. A Boeing 747 can take around 550 passengers ona flight. [21]. This means that if we switched from Bitcoin toRipple’s XRP the entire population of Japan (126M [22]) couldtravel around the globe once each year.
A greener alternative?
Running a validator (server) on Ripple’s network does not re-quire any fees and it is comparable in cost in terms of electricityto running an email server [23]. High trade fee gives peopleincentive to hold assets instead of trading. This compares to, forexample, when governments implement contractionary mone-tary policy and increase the interest rate on loans and savingsaccounts. This, ceteris paribus, tends to make people hold onto money instead of spending or trading. One could ask if it’sgood for a currency to have a built-in design that disincentivizespeople of trading?
If high fees disincentivize trade the opposite can be statedfor low fees. It will enable more trade and higher economicmovement, resulting in the exchange of more goods and servicesat a low cost.
Thinking back on the foundation of money as a medium ofexchange, we can look at exchange feasibility as a utility wherelower fees further utilize the asset potentially making us allwealthier when lower barrier to trade is enabled.
Here we argue that the asset utility is at the core of its valua-tion because this is what enables efficient trade.
The value of Ripple’s XRP lies in its ability to handle trans-actions and payments at a lower electricity cost and thereforelower CO2 emissions combined with lower trade fees.
CONCLUSION
The aim with this paper is to open a discussion on the topic ofsustainability of different currencies. We will briefly touch onthe topic of utility because the utility of a currency is bound toits efficiency. A low efficient, energy hungry, carbon emitting,currency is by design more limited than an efficient currencywhen it comes to some of the most fundamental utilities thata currency enables: trade and payments. It becomes apparentthat for a currency to be adopted in the widest way possible,efficiency is on top of the list for having a high yield of utility(payment and trade possibilities). But is it just utility that isbehind the actual value? Recall the reasons why money cameinto existence. It provided agents on the market with an easyand widely accepted medium of exchange. The main point tobe made here is that money should increase efficiency no matterwhat trust model the currency uses. It needs to be efficient inorder to have a chance of being widely adopted and functionalfor us all and the planet Earth. Our aim is not to embrace ordiscredit any model for trust on the basis of its trust componentalone. We would rather state that if there is trust (regardless ofmodel enabling it), the main value driver behind this trustedasset is going to be its utility and scalability along with the costsassociated with a further utilization and scaling of this asset. Inthis frame of reference Ripple’s XRP is way ahead of it’s currentcompetition.
A lot of digital assets lack a clear purpose. They may be usedto store value, purchase commodities or for consumer transac-tions, but were not created with a single explicit applicationin mind. In contrast, XRP is specifically about the transfer ofvalue and built for banks, financial institutions, payment ser-vices, providers and enterprises, making it one of the few digitalassets with a real, clear use case behind it. XRP is also in aunique space where it’s not built to replace current currenciesbut to work as a bridge currency where the systems upholdingthe current currencies can utilize Ripple’s XRP for moving theirnative assets more efficiently and consequently costing less in

Scientific Article 6
terms of electricity, C02 emissions and cost less in any currencyof your choice that you utilize with XRP.
Bitcoin can process up to maximum seven transactions persecond [11], any of which can take more than four hours to clear.Compare that with a traditional payments service, for exampleVISA, that averages 2,000 transactions per second. It’s clear thatBitcoin in it’s current state does not have the scalability to meettypical customer demands.
SustainabilityThe continuous block mining cycle gives people all over theworld incentive to mine Bitcoin. As mining can provide a solidstream of revenue, people (and more lately large companies) arevery willing to run power-hungry machines to get a piece of it.Over the years this has caused the total energy consumption ofthe Bitcoin network to grow to epic proportions, as the price ofthe currency has reached new highs. The entire Bitcoin networknow consumes more energy than a number of countries. IfBitcoin were a country, it would be ranked 67th in the world byenergy consumption, see figure 3.
Fig. 3. Energy consumption by countries (and bitcoin) [3].
Bitcoin is a mined digital asset, meaning that new coins arecreated by huge data centers processing complex math problems.This inefficient system demands massive amounts of electricity:the cost of producing one coin could power 3.67 U.S. homesfor a day, or 46.75 Hong Kong homes and 25.7 mainland Chinahomes, respectively. [24]
Final thoughtsHow big a carbon footprint per transaction do you find accept-able? What is the most sustainable and trustable way of creatinga store of value? Do we really need a proof of work to placevalue into a currency or can utility in itself be the creator ofvalue? High utility in this case is associated with a high numberof possible transactions per second and no or little energy cost.Can a currency with high cost in electricity have a sustainablevalue and is that value worth the cost in the long run? Can weaccept (by design) natural resource destruction made by moneysystems? Should we trust a value more because it costs morefor us all or should we place trust in something that costs less,and how would that model look? These are some questions we
hope you all ask yourself and continue to have as a guidelineforward.
We would argue that new technology should be about mak-ing the world a better place for most, if not all people. Withprovided information in this paper, Which currency does best fitthis purpose from a payment perspective according to you andwhy?
REFERENCES INFORMATION
Some of the references listed below have up to date inputs, whichmeans that they will change at any given time period. Our datawas obtained the 13th of November 2017.
REFERENCES
1. Principles of Money and Banking (Motilal Banarsidass Publishe).2. “Fortune 500 list,” (2017).3. Bitcoin Energy Consumption Index, International Energy Agency (In-
ternational Energy Agency).4. Ether Energy Consumption Index, International Energy Agency (Inter-
national Energy Agency).5. VISA, “Us securities and exchange commission, file: Visa inc. annual
report 2016,” .6. Statista, “Electricity consumption by facebook from 2011 to 2016, us
energy information administration,” .7. Amazon, “The state of green business 2017 report, january 31, 2017,
p. 30. (for year 2016),” .8. Google, “Environmental report 2017 progress update (for 2016, ),” .9. Appleinc, “Environmental responsibility report 2017 progress report,
covering fiscal year 2016, appleinc,” .10. “Blockchain.info, timespan: 1 year,” (2017).11. Scalability- Bitcoin wiki, Scalability targets (Bitcoin Wiki).12. US-Energy-Information-Administration, “How much electricity does an
american home use?, us energy information administration,” .13. “Greenhouse gas emissions avoided through use of nuclear energy,” .14. “Energy policy of china, wikipedia.com,” .15. “Fossil fuel power station, wikipedia.com,” .16. “Blockchain pools, blockchain.info/sv/pools,” .17. “Epa (2017) avert, u.s. national weighted average co2 marginal emis-
sion rate, year 2016 data. u.s. environmental protection agency, wash-ington, dc.” .
18. “United states environmental protection agency, greenhouse gas emis-sions from a typical passenger vehicle,” .
19. “How many cars equal the co2 emissions of one plane?, sciencefo-cus.com,” .
20. “How big is earth? by tim sharp, space.com,” .21. “Boeing 747. wikipedia.com,” .22. “List of countries and dependencies by population, wikipedia.com,” .23. “Technical faq: Xrp ledger, ripple.com,” .24. J. Lilic, “Bitcoins energy consumption an unsustainable protocol that
must evolve?, blockgeeks,” .25. “Etherum transaction chart. etherscan.io,” .26. “Xrp charts, transactions, ripple.com,” .27. J. Swartz, “Top secret visa data center banks on security, even has
moat, usa today,” .28. “Visa inc. annual report 2011,” .29. Ripple.com, “Validator registry xrp charts,” .30. T. Maddox, “Data center server power usage, editor: Between the
lines,” .31. Ripple, “Xrp consistently handles 1,500 transactions per second, rip-
ple.com,” .32. “School home energy audit-measuring energy usage, national teacher
enhancement project,” .33. P. George, “The tesla model 3 will launch with 50 kwh and 75 kwh
batteries.” .34. “Tesla model 3 reservations faq, tesla.com/support,” .35. “How far is the moon?, by tim sharp, october 27, 2017: Space.com,” .

Scientific Article 7
36. “Iphone x starting at 999 usd. apple.com,” .37. “Tesla model 3 starting at 35,000 usd . tesla.com/model3,” .
APPENDIX
C. CalculationsThis subsection derives all the figures that we calculatedthroughout the paper. Links to references are provided in eachstep of the calculation.
TransactionsIn terms of calculations for transactions, there is one fun-damental difference in the comparison of Visa to the others(Bitcoin, Ether and Ripple (XRP)). For Visa’s transactions weused the current amount 83.2 billion [5] and for the others weused the maximum transactions per second (TPS) the currentinfrastructure could potentially uphold.
This has the following implications:
1. Visa potentially can handle more transactions under it’s cur-rent infrastructure. But it wouldn’t be sensible from a busi-ness perspective having much more power than needed,because this creates unnecessary overhead costs. Still werecognize that Visa’s current system probably can handle abit more transactions for scalability reasons. The compari-son is has therefore the potential to be a bit tilted to Bitcoin,Ether and Ripple (XRP) advantage.
2. Bitcoin, Ether and Ripple (XRP) is currently under utilizingit’s potential maximum TPS (transactions per second).
Table 13. Maximum potential transactions annually and Cur-rent annual transactions. See subsection calculations for ta-ble 4 for sources.
Currency Maximum Potential Current
Bitcoin (BTC) 220.752M 104.2M
Ether (ETH) 473.04M 91.25M
VISA (USD) Unknown 83.2 billion
Ripple (XRP) 47304M 401.5M
Therefore we are also in this case tilted in favoring Bitcoin,Ether and Ripple (XRP) with current design of the calculations.We encourage anyone that want to calculate current use withcurrent energy usage to do so. But we firmly believe the bestway is to calculate current maximum TPS with current energyuse to be the best way where possible. Unfortunately (for Visa)in this case this data is not shared by them. When looking atdaily graphs of how many transactions Ether [25, 26] and Ripple(XRP) has, we see that they have been averaging about 250k and1.1M respectively. This gives
250k× 365 = 91, 250, 000 and 1.1M× 365 = 401.5M
Table 14. KWh per transaction (current) and maximum TPS
Currency KWh per Maximum potential KWh per current number
Bitcoin (BTC) 118 250
Ether (ETH) 55 106
VISA (USD) Unknown 0.006490
Ripple (XRP) 0.00001133 0.0013352
Calculations for Table 1 (Annual TWh)
Visa
According to USA Today [27], the Visa network electricityconsumption equals to the electricity consumption of 25,000 UShouseholds in the year 2011, that same year the Visa networkhad about 50.9 billion number of transactions [28]. In 2016 therewere 83.2 billions transactions on the Visa network [5]. Thus weassume that since the number of transactions nearly doubled,the number of US households energy equivalent also nearlydoubled. The increase was 80.3
50.9 ≈ 1.65, or 65%. This gives25000× 1.65 = 41351 Households the year 2106.
Households has an average of 10800 KWH [12]. This gives
X10800
= 41351 ⇒ X ≈ 540MKWh = 0.54TWh, (1)
where X represents the annual energy consumption of the Visanetwork. Digiconomist [3] calculated a similar number estimat-ing Visa network annual energy consumption equal to that of50,000 U.S. households in 2016.
Ripple (XRP)
In order to calculate the annual TWh of Ripple we reasoned asfollows: In the words of the creators of XRP (Ripple), "How muchdoes it cost to run a validator? - It is comparable in cost to runningan email server in terms of electricity." [23]
• Current amount of validators : 72 [29]
• Current amount of verified validators : 22 [29]
Average electricity consumption for a mail server is 7,446kWh per year. [30]. This gives
7446kWh ∗ 72nodes = 536112kWh = 0.000536112TWh. (2)
Currently, only the verified validators are needed to sustain1500 TPS (transactions per second), which means only 22 valida-tors are needed to sustain current throughput in TPS. We chooseto include all validators including the non-verified because wesee their current state as a necessary first step to become a veri-fied validator, therefore should be calculated in the total TWh.
Scientific Article 8
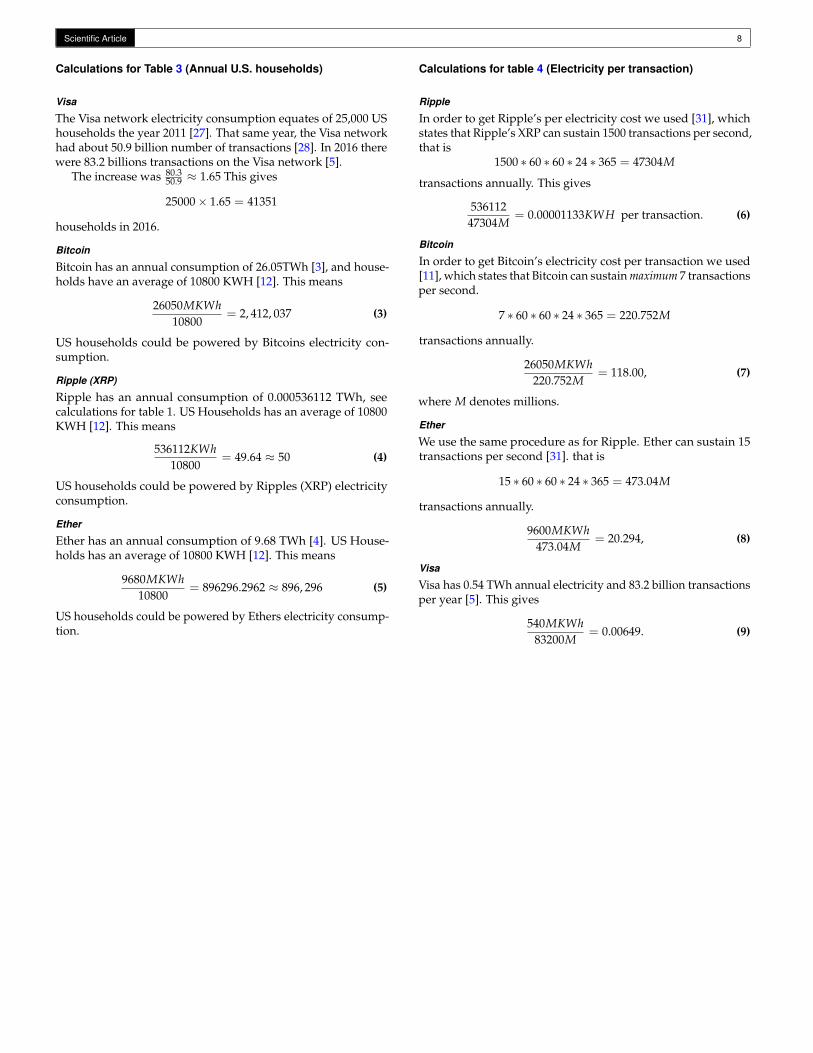
Calculations for Table 3 (Annual U.S. households)
Visa
The Visa network electricity consumption equates of 25,000 UShouseholds the year 2011 [27]. That same year, the Visa networkhad about 50.9 billion number of transactions [28]. In 2016 therewere 83.2 billions transactions on the Visa network [5].
The increase was 80.350.9 ≈ 1.65 This gives
25000× 1.65 = 41351
households in 2016.
Bitcoin
Bitcoin has an annual consumption of 26.05TWh [3], and house-holds have an average of 10800 KWH [12]. This means
26050MKWh10800
= 2, 412, 037 (3)
US households could be powered by Bitcoins electricity con-sumption.
Ripple (XRP)
Ripple has an annual consumption of 0.000536112 TWh, seecalculations for table 1. US Households has an average of 10800KWH [12]. This means
536112KWh10800
= 49.64 ≈ 50 (4)
US households could be powered by Ripples (XRP) electricityconsumption.
Ether
Ether has an annual consumption of 9.68 TWh [4]. US House-holds has an average of 10800 KWH [12]. This means
9680MKWh10800
= 896296.2962 ≈ 896, 296 (5)
US households could be powered by Ethers electricity consump-tion.
Calculations for table 4 (Electricity per transaction)
Ripple
In order to get Ripple’s per electricity cost we used [31], whichstates that Ripple’s XRP can sustain 1500 transactions per second,that is
1500 ∗ 60 ∗ 60 ∗ 24 ∗ 365 = 47304M
transactions annually. This gives
53611247304M
= 0.00001133KWH per transaction. (6)
Bitcoin
In order to get Bitcoin’s electricity cost per transaction we used[11], which states that Bitcoin can sustain maximum 7 transactionsper second.
7 ∗ 60 ∗ 60 ∗ 24 ∗ 365 = 220.752M
transactions annually.
26050MKWh220.752M
= 118.00, (7)
where M denotes millions.
Ether
We use the same procedure as for Ripple. Ether can sustain 15transactions per second [31]. that is
15 ∗ 60 ∗ 60 ∗ 24 ∗ 365 = 473.04M
transactions annually.
9600MKWh473.04M
= 20.294, (8)
Visa
Visa has 0.54 TWh annual electricity and 83.2 billion transactionsper year [5]. This gives
540MKWh83200M
= 0.00649. (9)

Scientific Article 9
Calculations for table 5 (Annual electricity consumption with220.752M transactions)
Bitcoin
Bitcoin’s annual energy consumption is stated in table 1, and itsequal to 26.05 TWh per year with 104.2M transactions, but canpotentially uphold 220.752M transactions with current infras-tructure and coding.
Ether
Ether costs 55KWh per transaction, see calculations for table 4.Using the same amount of transactions as Bitcoin can currentlysustain, i.e 220.752M, we get the following annual consumption:
220.752M× 55 = 12141MKWh = 12.141TWh. (10)
Visa
The Visa network costs 0.00649 KWh per transaction. Given220.752M annual transactions (bitcoins potential sustainablemaximum), we get
220.752M× 0.00649 = 1.43268MKWh = 0.00143268TWh (11)
of annual consumption.
Ripple (XRP)
Ripple (XPR) costs 0.00001133 KWh per transaction. Given220.752M annual transactions (bitcoins potential sustainablemaximum), we get
220.752M× 0.00001133 = 2501.12KWh = 0.000002501TWh(12)
of annual consumption.
Calculations for table 6 (Number of light bulbs, dishwashersand driven car miles that could be powered by the energy useof 220.752M transactions)
Here we calculate the number of light bulbs and dishwashersthat could be powered for one year by the electricity usage ofthe different currencies in table 5. We also calculate the numberof car miles that could be driven by that electricity.
According to [32], a dishwasher uses 1200 W. A standardlight bulb uses 40 W. We use the following formula in order tocalculate the TWh per year:
Watts×Hours used per day× days per year1000
= KWh Consumption
Assuming that a light bulb is on 12 hours per day, every dayof the year, we get 40×12×365
1000 = 175.2. We also assume that adishwasher is used 3 times per week, assuming 2 hours of usageeach time, we get: 1200×2×156
1000 = 374.4.
A tesla model 3 has a standard battery of 50 KWh [33] andit has a range of 220 miles. [34]. This tells us that is uses 50
220 =0.227 KWh per driven mile.
Bitcoin
Bitcoins annual usage is 26.05 TWh. This gives
X× 175.2 = 26050MKWh → X = 148.687M (13)
light bulbs could be powered every year.Moreover,
Y× 374.4 = 26050MKWh → Y = 69.5779M (14)
dishwashers could be powered every year.Lastly, let’s look at the number of car-miles that could have
been driven for the same electricity consumption:
Z× 0.227 = 26050MKWh → Z = 114.755Billion (15)
car miles could be driven.
Ether
Ethers annual usage given the hypothetical scenario is 12.141TWh. This gives
X× 175.2 = 12141MKWh → X = 69.297M (16)
light bulbs could be powered every year.Moreover,
Y× 374.4 = 12141MKWh → Y = 32.427M (17)
dishwashers could be powered every year.Lastly, let’s look at the number of car miles that could have
been driven for the same electricity consumption:
Z× 0.227 = 12141MKWh → Z = 52.484Billion (18)
car miles could be driven.

Scientific Article 10
Visa network
Visas annual usage given the hypothetical scenario is 0.00143268TWh. This gives
X× 175.2 = 1432680KWh → X = 8177 (19)
light bulbs could be powered every year.Moreover,
Y× 374.4 = 1432680KWh → Y = 3826 (20)
dishwashers could be powered every year.Lastly, let’s look at the number of car-miles that could have
been driven for the same electricity consumption:
Z× 0.227 = 1432680KWh → Z = 6.3113Million (21)
car miles could be driven.
Ripple (XRP)
Ripple (XRP)’s annual usage given the hypothetical scenario is0.000002501 TWh. This gives
X× 175.2 = 2501KWh → X = 14 (22)
light bulbs could be powered every year.Moreover,
Y× 374.4 = 2501KWh → Y = 6.7 (23)
dishwashers could be powered every year.Lastly, let’s look at the number of car miles that could have
been driven for the same electricity consumption:
Z× 0.227 = 2501KWh → Z = 11018 (24)
car miles could be driven.
Calculations for Round-trips to the moonOn average, the distance from Earth to the moon is about 238,855miles [35]. The difference between using Bitcoin and usingRipple (XRP) in amount of car miles driven is
114.75 Billion− 11018 ≈ 114749990000.
This means the amount of times we could go to the moon ifRipple (XRP) was used instead of Bitcoin (in this hypotheticalscenario) is
114749990000X
= 238, 855Miles → X = 480, 416.94. (25)
We could actually go to the moon 240208 times back and forth ifripple (XRP) was used instead of Bitcoin, given that the milagewas the same as a Tesla model 3.
Calculations for table 712 cents per KWh is a typical residential rate [12], we thereforeuse this number when calculating prices of KWh.
Bitcoin
26050MKWh× 0.12 USD = 3.124 billion USD (26)
Ether
9680MKWh× 0.12 USD = 1.161 billion USD (27)
Visa network
540.6MKWh× 0.12 USD = 64.87 million USD (28)
Ripple (XRP)
536112KWh× 0.12 USD = 64333.44 USD (29)
Calculations for table 8 (Cost in USD per transaction)We use the hypothetical maximum number of transaction foreach of the currencies.
Bitcoin
3.124 billion USD220.752M
= 14.1USD (30)
Ether
1.161 billion USD473.03M
= 2.45USD (31)
Visa network
64.87 million USD83.2 billion
= 0.07cents (32)
Ripple (XRP)
64333.44 USD47304M
= 0.000136cents (33)

Scientific Article 11
Calculations for table 9 (Cost in USD for 104.2 M transactions)Bitcoin
14.1 USD× 104.2M = 1469.22M USD (34)
Ether
2.45 USD× 104.2M = 255.29M USD (35)
VISA
0.0007 USD× 104.2M = 72940USD (36)
Ripple(XRP)
0.00000136 USD× 104.2M = 141.7USD (37)
Now we look at the number of Iphone X’s we could by, weestimate the cost of the Iphone X to be 1000 USD [36].
Bitcoin
1469.22M USD1000
= 1.46922M Iphone X (38)
Ether
255.29M USD1000
= 255290 Iphone X (39)
VISA
72940 USD1000
= 72.94 Iphone X (40)
Ripple (XRP)
141.7USD USD1000
= 0.14 Iphone X (41)
Now we look at the number of Tesla model 3 we could by, weestimate the cost of the tesla model 3 to be 35,000 USD [37].
Bitcoin
1469.22M USD35, 000
= 4197.77 Model 3 (42)
Ether
255.29M USD35, 000
= 729.4 Model 3 (43)
VISA
72940 USD35, 000
≈ 2 Model 3 (44)
Ripple (XRP)
141.7USD USD35, 000
≈ 0 Model 3 (45)
Calculations for table 10On average, electricity sources emit 1.222lbs CO2 per KWh [17].
Bitcoin
26050M× 1.222lbs = 31833, 1M (46)
Ether
9680M× 1.222lbs = 11828.96, 31M (47)
VISA
540.6M× 1.222lbs = 660.61321M (48)
Ripple (XRP)
536112× 1.222lbs = 655128.864 (49)
Calculations for table 11LBS CO2 emmisions per transaction for all of the currencies.
Bitcoin31833, 1M220.752M
= 144.2029 (50)
Ether11828.9631M
473.04M= 20.003 (51)
VISA660.61321M83.2 Billion
= 0.00794 (52)
Ripple (XRP)655128.864
47304M= 0.00001384933 (53)

Scientific Article 12
Calculations for table 12CO2 emissions for Bitcoins potential maximum TPS (220.752M)transactions
Bitcoin
144.2029× 220.752M = 31833, 1M (54)
Ether
20.003× 220.752M = 4415.7022M (55)
VISA
0.00794× 220.752M = 1.7527M (56)
Ripple (XRP)
0.00001384933× 220.752M = 3057.26 (57)
Now we compare this with the number of car miles which couldbe driven for the same CO2. A typical passenger vehicle emits411 grams =0.9060 lbs per mile driven. [18]
Bitcoin
X× 0.9060lbs = 31833, 1M ⇒ X = 35135.87M (58)
Ether
X× 0.9060lbs = 4415.7022M ⇒ X = 4873.84M (59)
VISA
X× 0.9060lbs = 1.7527M ⇒ X = 1.9345M (60)
Ripple (XRP)
X× 0.9060lbs = 3057.26 ⇒ X = 3374.459 (61)
Lastly we look at the number of times that a Boeing 747 cantravel around the world with the same emission as the differentcurrencies given 220.752M transactions. According to [19] aBoeing 747 emits 10.1kg/km = 35.83 lbs/mile. Also, the radiusof Earth at the equator is 3,963 miles [20]. This gives the emissionfor flying around the globe once is
35.83× 3963 = 141994.29
lbs of CO2.
Bitcoin
X× 141994.29lbs = 31833, 1M ⇒ X = 224, 185.7 (62)
Ether
X× 141994.29lbs = 4415.7022M ⇒ X = 31097.7 (63)
VISA
X× 141994.29lbs = 1.7527M ⇒ X = 12.34 (64)
Ripple (XRP)
X× 141994.29lbs = 3057.26 ⇒ X = 0.021 (65)
Additional Tables and Graphs
Fig. 4. Total number of transactions per day made in completepayment networks
Fig. 5. Caption of how much one bitcoin transaction can cost.2017-11-12.