how fair value information changes portfolio rebalancing ... · pdf filehow fair value...
TRANSCRIPT
How Fair Value Information Changes Portfolio Rebalancing Behavior in the Property and Casualty Insurance Industry
R. Mark Alford
DePaul University
Kimberly F. Luchtenberg East Carolina University
Willie Dion Reddic DePaul University
When making investment decisions, Property & Casualty insurers (P&Cs) carefully consider the impact of the mix of taxable and tax-exempt securities on their overall tax liability. However, changes in accounting regulations may have led managers of P&Cs to make decisions based on the accounting effects rather than the economic effects. We examine a relationship among operating and investment income and portfolio rebalancing surrounding the adoption of (SSAP) No. 100 - Fair Value Measurements. Our main results indicate that the association between operating and investment losses and rebalancing investment portfolios towards taxable investments was strengthened in the (SSAP) No. 100 period. INTRODUCTION
The effect of disclosure requirements on portfolio management decisions is an important topic for
portfolio managers, academics, and policy makers. Although a considerable amount of research has been completed in this area1, the effect of increased disclosure on institutional investors' portfolio management decisions remains an open question. To address this gap in the literature, this study examines the effect fair value2 measurement and disclosure requirements have on institutional investors' portfolio rebalancing decisions. In particular, we are interested in understanding whether increased financial disclosure requirements influence tax-motivated rebalancing activities of Property and Casualty insurers (P&Cs).
Insurance companies are regulated by the National Association of Insurance Commissioners (NAIC) as well as state insurance agencies. The Statement of Standard Accounting Practices (SSAP) governs financial reporting in the insurance industry and is designed to satisfy the industry's specific needs. Recently, there has been an important change in the procedure for accounting for investments in the insurance industry. Effective December 2010, (SSAP) No. 100, Fair Value Measurements, adopted ASC 820-10 (with modification) for statutory reporting. As a result of this change, P&Cs are now required to disclose certain information regarding securities reported at fair value.
This paper employs a natural experiment made possible by these new reporting requirements. Specifically, we examine whether the increased financial disclosures mandated by the implementation of
Journal of Accounting and Finance Vol. 16(4) 2016 11

(SSAP) No. 100 had an influence on P&Cs' portfolio rebalancing activities. Since the intent of (SSAP) No. 100's adoption of ASC 820-10 was to increase financial statement transparency and comparability surrounding fair value measurements, the new disclosure requirements may have provided additional incentive for P&Cs to maximize profit by employing tax-efficient portfolio rebalancing strategies. Alternatively, P&Cs may have been reluctant to rebalance their portfolios due to a concern of revealing a perhaps unwelcome change in investment strategy to investors and regulators or having to recognize an operating or investment loss. In general, P&Cs tend to invest in a variety of short and long-term assets, including taxable and tax-exempt fixed income securities, real estate holdings, and equities, among others [e.g., Lambert and Hofflander (1966); Lambert and Hofflander (1967)]. Portfolio theory suggests that P&Cs should rebalance from tax-exempt securities towards taxable securities when facing operating and investment losses because tax-exempt securities no longer provide tax advantages [Hendershott and Koch (1980); Cummins and Grace (1994)]. For example, Smith (1989) indicates that P&Cs with operating or investment losses could realign their portfolios by liquidating their tax-exempt securities and purchasing taxable securities. However, P&Cs may be less willing to change their financial strategies3 and rebalance from tax-exempt securities towards taxable securities because they do not want to recognize investment losses that would result from selling the tax-exempt securities on their financial statements.4 This would imply that P&C firms' rebalancing decisions were driven by the desire to maintain stability in their accounting statements instead of maximizing the value of their portfolios. In other words, they would be concerned with the accounting effects of those decisions rather than the economic effects.
This study is motivated by the NAIC’s adoption of the ASC 820-10 framework though (SSAP) No. 100 and explores whether or not fair value disclosures and measurements5 impact P&Cs’ decisions to rebalance their portfolios. Fair value reporting in (SSAP) No. 100 gives managers the ability to use their investment losses to offset operating or investment gains. It also may encourage more timely loss recognition (Laux and Leuz, 2010). Both of these possibilities may have an impact on portfolio managers' rebalancing actions. For example, based on portfolio rebalancing theory, P&Cs should shift away from tax-exempt securities towards taxable securities when operating or investment losses occur, which implies a negative relationship between operating and investment income and the ratio of taxable securities to total securities. Additionally, portfolio changes between taxable and tax-exempt securities should be driven by a combination of inputs such as business operations (operating and investment income), government regulation on investments, taxes, growth, and risk [Hendershott and Koch (1980), Cummins and Grace (1994); PonArul and Viswanath (1995); Gibson, Safieddine, and Titman (2000); Petroni, Ryan and Whalen (2000)]. Although theory suggests that P&Cs will make these portfolio adjustments using all relevant inputs, it is also possible that they may be reluctant to rebalance toward taxable securities out of a concern that regulators and investors may react negatively to this decision. Similarly, they may want to avoid recognizing investment losses that occur when securities are liquidated during portfolio rebalancing. If so, the increased disclosures required by (SSAP) No. 100 should reduce these concerns and encourage tax-efficient rebalancing strategies because investors and regulators will have greater visibility into the fair value of the securities. Accordingly, this paper poses the following research question: Do the increased disclosure requirements of (SSAP) No. 100 influence P&Cs' portfolio rebalancing efforts?
We conduct our investigation into the effect of fair value disclosures on P&Cs' portfolio rebalancing activities using data from 2000 to 2013 that were collected from the National Association of Insurance Commissioners (NAIC) annual statement database. This database provides a unique opportunity to access the extensive financial data that are provided to insurance regulators. Prior to December 2010 when (SSAP) No. 100 became effective, we find that operating and investment income, government regulation on investments, taxes, growth, and risk contribute to changes in the weight of taxable investments in the portfolio. However, after the adoption of (SSAP) No. 100, the magnitude of the coefficient(s) operating and investment income becomes a significant factor in the P&Cs' rebalancing actions. P&C operating and investment income is negatively related to increases in taxable securities relative to the total portfolio. These results are consistent with the Laux and Leuz (2010) finding that adopting fair value reporting can encourage firms to recognize investment losses in a timely manner. In response to lower operating or
12 Journal of Accounting and Finance Vol. 16(4) 2016
investment income, P&Cs are rationally rebalancing portfolios to include a higher proportion of taxable securities. This common tax sheltering strategy is also consistent with portfolio rebalancing theory.
This study contributes to the literature related to both accounting disclosures and accounting issues in the insurance industry in several important ways. First, this paper is the first to examine the effect of the implementation of (SSAP) No. 100 in the P&C industry. Second, our findings suggest that (SSAP) No. 100 implementation may have had the effect of increasing transparency and encouraging operating and investment loss recognition, resulting in both operating and investment income being strong determinants of the changes in taxable/tax-exempt ratios in investment portfolios. This is an important finding for investors, regulators, and policymakers. Third, we shed light on the effect of the different inputs from the fair value hierarchy and ownership structures on portfolio rebalancing. Fourth, we believe that our study is the first of its sort to use a database of P&C firms heretofore not widely used by academic researchers because of the unique complexity of the data.6
The remainder of this paper is organized as follows: The following section reviews the relevant literature and presents the research hypotheses. Section 3 discusses the research design. Section 4 describes the sample selection process, defines the variables, and provides descriptive statistics. Section 5 reports the results while Section 6 provides a conclusion and as well as a discussion of the limitations of this study.
LITERATURE REVIEW AND HYPOTHESES
This study discusses two streams of research: (1) research related to the rebalancing of P&Cs’
portfolios between taxable and tax-exempt investments, and (2) research focusing on fair value accounting in the insurance industry.
Portfolio Rebalancing with Taxable and Tax-Exempt Securities
Beginning with Miller’s (1977) study of the impact of debt on corporate taxes, a rich stream of literature examining the impact of taxes on portfolio investment decisions has developed. There is strong theoretical and empirical support showing that tax consequences play an important role in decisions related to the content of firms’ investment portfolios. Black (1980) and Tepper (1981) argue that firms use tax laws to create arbitrage opportunities by overfunding pension funds. Research shows similar findings in mutual fund portfolios. For example, Gibson, Safieddine, and Titman (2000) report that after the 1986 Tax Reform Act, mutual funds sold holdings with capital losses to take advantage of tax benefits. This component of the literature also includes theories that formalize the role of taxes in insurers' portfolio decisions. Hendershott and Koch (1980) develop and test a theory suggesting that financial institutions can use tax laws to develop income sheltering strategies. They find that net income is one of the largest determinants for including tax-exempt holdings in a portfolio. Furthermore, they find that financial services firms are able to maximize profits by using tax laws to shelter net income. Building on this theory, Cummins and Grace (1994) develop a model of profit maximization incorporating the provisions of the Tax Reform Act (TRA) of 1986 applicable to P&Cs. Their theoretical framework shows that P&Cs can effectively employ portfolio rebalancing strategies that use operating losses to offset taxable investment income.
As portfolio theory suggests, P&Cs generally invest in both taxable and tax-exempt securities (Markowitz, 1952). Due to their tax-exempt status, these latter securities usually yield less than taxable investments. As the earnings of P&Cs’ decline (or becomes a loss) these insurers should liquidate their tax-exempt investments as the P&Cs may no longer benefit from the tax savings, and the tax-exempt investments have a lower yield [Hendershott and Koch (1980), Cummins and Grace(1994)]. However, capital markets may perceive the rebalancing of a P&C’s portfolio of investments as a negative indication of a changed investment strategy (Oakland, 1972).
Prior literature discusses additional reasons why P&Cs rebalance their portfolios between tax-exempt securities and taxable securities. In an early article, Leibowitz (1981) explains that tax-exempt yield curves have steeper slopes than yield curves of taxable securities. This suggests that P&Cs invest in tax-
Journal of Accounting and Finance Vol. 16(4) 2016 13

exempt securities because the cost of taxable securities is too high. Poterba (1986) examines alternative theories concerning the tax-exempt/taxable yield spread and argues that the tax-exempt securities market is segmented. Furthermore, Poterba suggests that changes in expected future tax rates can influence yield spreads between long-term taxable and tax-exempt securities. Smith (1989) finds evidence suggesting that tax-exempt/taxable yield ratios influence P&Cs’ returns, a finding that is robust to the effect of taxable interest rates. PonArul and Viswanath (1995) and Harrington and Niehaus (2003) report a positive relation between firms’ holdings of tax-exempt securities and the yield differential between taxable and tax-exempt securities resulting in an increase in net income. In an empirical paper, Bradford and Logue (1998) document the notion that P&Cs may increase taxable income in order to take advantage of tax shelters provided by operating losses. In summary, the literature suggests that a firm’s overall tax liability, impacted by the mix of tax-exempt and taxable securities, is an important factor in P&Cs' portfolio rebalancing decisions.7 The Recognition of Fair Value
The literature on fair value accounting in the P&C industry is in the developmental stage. An article published by PriceWaterhouseCoopers indicates that “…the majority of actuarial papers published to date on the topic of fair value accounting for P&Cs have focused on the theoretical aspects and conceptual framework of such modeling” (Littman, Thomas, Tarrant, and Gutterman, 2004). However, there have been mixed reviews in the academic literature regarding fair value accounting in regulated environments (e.g., the banking industry) [e.g., Barth (1994); Nelson (1996); Barth, Beaver, and Landsman (1996)] and especially during the financial crisis [Ryan (2008); Laux and Leuz (2010); Song, Thomas, and Yi (2010); Riedl and Serafiem (2011)]. Riedl and Serafiem (2011) find that banks with higher costs of capital have more assets that are measured at Level 3 in the fair value hierarchy. Laux and Leuz (2010) investigate the role of fair value accounting during the financial crisis. The authors determine that fair value reporting was not a primary contributor to the severity of the most recent financial crisis. They also find that fair value reporting requirements may force firms to recognize investment losses more quickly than they may have done without the new reporting requirements. Finally, additional studies concerning the use of fair value measurements and their relation to financial reporting quality are inconsistent [Whalen (2008); Song, Thomas, and Yi (2010)].
(SSAP) No. 100 attempts to remove some of the ambiguity surrounding fair value estimates by improving reporting quality in the insurance industry. Conversely, some insurance companies do not believe that fair value accounting produces greater transparency; instead these insurers argue that better clarity would result from removing the impact of market movements from operating earnings (Rosner and Freedman, 2013). Therefore, (SSAP) No. 100 provides academic researchers the opportunity to empirically examine the relationships that exist between fair value measurement and disclosures and the investment strategies of P&Cs. The next logical step for these researchers is to explore the value relevance of fair value measurements and disclosures with respect to the disaggregation of fair value information demanded by the new standard. Several studies support the FASB’s assertion that fair value information is relevant but results vary with the type of security subject to fair value measurement and its place in the fair value hierarchy. Barth’s (1994) results suggest that the fair values of investment securities of banks and P&Cs are value relevant, while Petroni and Wahlen (2000) find that fair values of both treasury securities and equities are value relevant, unlike the fair values of corporate and municipal bonds. In the same vein, Kolev (2009) and Song, Thomas, and Yi (2010) find that fair value information at all three levels of the fair value hierarchy is value relevant; however, Level 3 fair value estimates of assets and liabilities are valued less than those at Level 1 or Level 2, irrespective of security type. In all, these results show that fair value estimates are reliable and value relevant.
Hypotheses
P&Cs invest in a mix of taxable and tax-exempt securities and rebalance their portfolios between the two types of securities for several reasons including business operations (operating and investment income), government regulation on investments, taxes, growth, and risk. Prior portfolio rebalancing
14 Journal of Accounting and Finance Vol. 16(4) 2016

theory predicts that P&Cs will use operating and investment losses to shelter taxable investment income and invest the balance of their portfolios in taxable securities [Hendershott and Koch (1980); Cummins and Grace (1994)]. However, before (SSAP) No. 100 was adopted, firms may have been reluctant to engage in some portfolio rebalancing behaviors in order to maintain the appearance of a more stable investment philosophy. Specifically, firms may not have used investment losses to determine the proportion of taxable (and therefore tax-exempt) securities in their investment portfolios. Thus, our first hypothesis, stated in null form is:
H1a: Prior to the implementation of (SSAP) No. 100, operating income and investment
income are both determinants of P&Cs' changes in the proportion of taxable securities relative to their total portfolios.
We are also interested in the changes in the proportion of taxable securities relative to the total
portfolios due to the increased transparency from the new fair value reporting requirements. If P&Cs did not use investment income as an input in the portfolio rebalancing decisions in an effort to avoid recognizing investment losses, then (SSAP) No. 100 should diminish or eliminate this concern. Per Laux and Leuz (2010), fair value reporting can force firms to recognize investment losses earlier than they otherwise would. Hence, we expect that after (SSAP) No. 100 becomes effective, P&Cs will change the inputs in their portfolio rebalancing strategies. As investment losses are being recognized, portfolio managers should adjust the portfolio to include a higher proportion of taxable securities. Therefore, the second hypothesis, stated in the null is:
H1b: The determinants of P&Cs' changes in the proportion of taxable securities relative to
their total portfolios are the same before and after the adoption of (SSAP) No. 100. Finally, since P&Cs have discretion over the type of fair value information they report, it is important
to determine how they behave when reporting the fair value information related to these measurements.8 Unfortunately, prior to this study there is no existing evidence concerning the portfolio rebalancing strategies of P&Cs reporting securities measured at fair value. Therefore, we will attempt to address this gap in the literature by examining whether P&Cs with operating or investment losses that report securities reflecting Level 1, 2, or 3 fair value measurements will rebalance towards taxable securities. We expect that P&Cs reporting fair value information will behave as portfolio rebalancing theory suggests, and rebalance their portfolios toward taxable investments when faced with operating or investment losses. The final hypothesis, stated in null form, is:
H2: P&Cs reporting Level 1, Level 2, or Level 3 fair value measurements will rebalance
the proportion of taxable securities relative to their total portfolios when both operating and investment losses occur.
RESEARCH DESIGN
To investigate the magnitude of portfolio rebalancing and determine how it relates to operating and
investment losses, (SSAP) No. 100, and reporting fair value information, we employ two regression models:
∆𝑇𝑎𝑥𝑎𝑏𝑙𝑒𝑖,𝑡 = 𝛼0 + 𝛼1𝑂𝑝𝑒𝑟𝑎𝑡𝑖𝑛𝑔𝑖,𝑡−1 + 𝛼2𝐼𝑛𝑣𝑒𝑠𝑡𝑚𝑒𝑛𝑡𝑖,𝑡−1 + 𝛼3𝐺𝑟𝑜𝑤𝑡ℎ𝑖,𝑡−1 + 𝛼4𝑇𝑎𝑥𝑒𝑠𝑖,𝑡−1
+ 𝛼5𝐺𝑜𝑣𝑒𝑟𝑛𝑚𝑒𝑛𝑡𝑖,𝑡−1 + 𝛼6𝑅𝐵𝐶𝑖,𝑡−1 + 𝛼7𝑅𝑒𝑖𝑛𝑠𝑢𝑟𝑎𝑛𝑐𝑒𝑖,𝑡−1 + 𝛼8𝑆𝑖𝑧𝑒𝑖,𝑡−1
+ � +𝑌𝑒𝑎𝑟
𝐹.𝐸.
𝜀𝑗,𝑡 (1)
Journal of Accounting and Finance Vol. 16(4) 2016 15

where 𝑖 indexes P&Cs, 𝑡 indexes year, and ∆𝑇𝑎𝑥𝑎𝑏𝑙𝑒 is the dependent variable. The independent variables are 𝑂𝑝𝑒𝑟𝑎𝑡𝑖𝑛𝑔 and 𝐼𝑛𝑣𝑒𝑠𝑡𝑚𝑒𝑛𝑡. For equation (1), we divide data into two time periods (e.g., before and after (SSAP) No. 100). As fair value information pertains directly to investments, portfolio managers should adjust the portfolio to include a higher proportion of taxable securities investment income when either operating or investment losses occur. Therefore, we expect the magnitude of the coefficient 𝛼2 to be greater than 𝛼1 in the after (SSAP) No. 100 period. ∆𝑇𝑎𝑥𝑎𝑏𝑙𝑒𝑖,𝑡= 𝛽0 + 𝛽1𝑂𝑝𝑒𝑟𝑎𝑡𝑖𝑛𝑔𝑖,𝑡−1 + 𝛽2𝐼𝑛𝑣𝑒𝑠𝑡𝑚𝑒𝑛𝑡𝑖,𝑡−1 + 𝛽3𝐺𝑟𝑜𝑤𝑡ℎ𝑖,𝑡−1 + 𝛽4𝑇𝑎𝑥𝑒𝑠𝑖,𝑡−1+ 𝛽5𝐺𝑜𝑣𝑒𝑟𝑛𝑚𝑒𝑛𝑡𝑖,𝑡−1 + 𝛽6𝑅𝐵𝐶𝑖,𝑡−1 + 𝛽7𝑅𝑒𝑖𝑛𝑠𝑢𝑟𝑎𝑛𝑐𝑒𝑖,𝑡−1 + 𝛽8𝑆𝑖𝑧𝑒𝑖,𝑡−1 + 𝛽9𝐿𝑒𝑣𝑒𝑙 1𝑖,𝑡+ 𝛽10𝐿𝑒𝑣𝑒𝑙 2𝑖,𝑡 + 𝛽11𝐿𝑒𝑣𝑒𝑙 3𝑖,𝑡 + 𝛽12𝐿𝑒𝑣𝑒𝑙 1𝑖,𝑡 ∗ 𝑂𝑝𝑒𝑟𝑎𝑡𝑖𝑛𝑔𝑖,𝑡−1 + 𝛽13𝐿𝑒𝑣𝑒𝑙 2𝑖,𝑡 ∗ 𝑂𝑝𝑒𝑟𝑎𝑡𝑖𝑛𝑔𝑖,𝑡−1+ 𝛽14𝐿𝑒𝑣𝑒𝑙 3𝑖,𝑡 ∗ 𝑂𝑝𝑒𝑟𝑎𝑡𝑖𝑛𝑔𝑖,𝑡−1 + 𝛽15𝐿𝑒𝑣𝑒𝑙 1𝑖,𝑡 ∗ 𝐼𝑛𝑣𝑒𝑠𝑡𝑖𝑛𝑔𝑖,𝑡−1 + 𝛽16𝐿𝑒𝑣𝑒𝑙 2𝑖,𝑡 ∗ 𝐼𝑛𝑣𝑒𝑠𝑡𝑖𝑛𝑔𝑖,𝑡−1+ 𝛽17𝐿𝑒𝑣𝑒𝑙 3𝑖,𝑡 ∗ 𝐼𝑛𝑣𝑒𝑠𝑡𝑖𝑛𝑔𝑖,𝑡−1
+ � +𝑌𝑒𝑎𝑟
𝐹.𝐸.
𝜂𝑗,𝑡 (2)
For equation (2), we observe the effect of the different levels of fair value inputs and ownership
structures on portfolio rebalancing. The coefficients of interest are the interaction term between operating income, investment income, and fair value inputs (Level 1, 2, or 3).
DATA Sample Selection
Statutory accounting data were collected from the NAIC annual statement database for the years 1996-2013. These data are available from statutory accounting financial statements. Included in the sample are both affiliated and unaffiliated single P&C’s. The NAIC annual statement database includes all financial information needed to calculate the dependent variable, ΔTaxable, which is the change in the ratio of earned taxable investment income to total earned income from year t-1 to year t.9 The three independent variables are operating income, investment income, and fair value information (e.g., Level 1, 2, or 3 fair value measurements). The operating and investment income variables (Operating and Investment) are continuous and scaled by net admitted assets.10 Finally, the third independent variable, Level 1, 2, and 3, is the ratio of the total fair value of securities measured at Level 1, Level 2, or Level 3 divided by the sum of the total fair value of securities measured at Level 1, 2, and 3.11 To test H1a and H1b, available data for P&Cs are available to calculate all relevant variables, both independent and dependent (26,910 observations were excluded – see Table 1). The final sample for testing H1a and H1b consists of 23,462 insurer-year observations. For testing H2, 201012 was used as the starting point as 2010 is the first year that data were available for fair value information using statutory accounting financial statements due to the issuance of (SSAP) No. 100 (effective in December 2010). The sample to test this hypothesis began with 10,618 insurer-year observations in the NAIC property-casualty insurer files that reported fair value data (441 observations are excluded – see Table 1 below). To be included in the final sample, the remaining observations must not have missing control variables (3,411 observations are excluded). The final sample consists of 6,766 observations.
16 Journal of Accounting and Finance Vol. 16(4) 2016
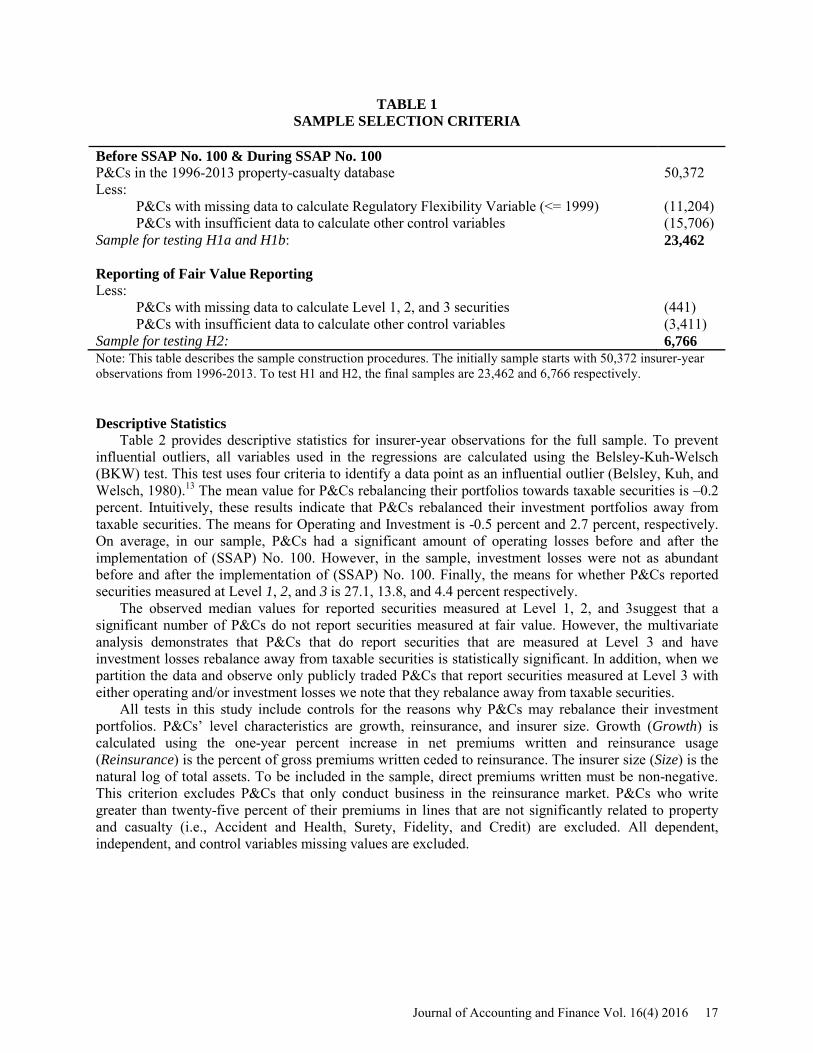
TABLE 1 SAMPLE SELECTION CRITERIA
Before SSAP No. 100 & During SSAP No. 100 P&Cs in the 1996-2013 property-casualty database
50,372
Less: P&Cs with missing data to calculate Regulatory Flexibility Variable (<= 1999) (11,204) P&Cs with insufficient data to calculate other control variables (15,706) Sample for testing H1a and H1b: 23,462 Reporting of Fair Value Reporting
Less: P&Cs with missing data to calculate Level 1, 2, and 3 securities (441) P&Cs with insufficient data to calculate other control variables (3,411) Sample for testing H2: 6,766 Note: This table describes the sample construction procedures. The initially sample starts with 50,372 insurer-year observations from 1996-2013. To test H1 and H2, the final samples are 23,462 and 6,766 respectively. Descriptive Statistics
Table 2 provides descriptive statistics for insurer-year observations for the full sample. To prevent influential outliers, all variables used in the regressions are calculated using the Belsley-Kuh-Welsch (BKW) test. This test uses four criteria to identify a data point as an influential outlier (Belsley, Kuh, and Welsch, 1980).13 The mean value for P&Cs rebalancing their portfolios towards taxable securities is –0.2 percent. Intuitively, these results indicate that P&Cs rebalanced their investment portfolios away from taxable securities. The means for Operating and Investment is -0.5 percent and 2.7 percent, respectively. On average, in our sample, P&Cs had a significant amount of operating losses before and after the implementation of (SSAP) No. 100. However, in the sample, investment losses were not as abundant before and after the implementation of (SSAP) No. 100. Finally, the means for whether P&Cs reported securities measured at Level 1, 2, and 3 is 27.1, 13.8, and 4.4 percent respectively.
The observed median values for reported securities measured at Level 1, 2, and 3suggest that a significant number of P&Cs do not report securities measured at fair value. However, the multivariate analysis demonstrates that P&Cs that do report securities that are measured at Level 3 and have investment losses rebalance away from taxable securities is statistically significant. In addition, when we partition the data and observe only publicly traded P&Cs that report securities measured at Level 3 with either operating and/or investment losses we note that they rebalance away from taxable securities.
All tests in this study include controls for the reasons why P&Cs may rebalance their investment portfolios. P&Cs’ level characteristics are growth, reinsurance, and insurer size. Growth (Growth) is calculated using the one-year percent increase in net premiums written and reinsurance usage (Reinsurance) is the percent of gross premiums written ceded to reinsurance. The insurer size (Size) is the natural log of total assets. To be included in the sample, direct premiums written must be non-negative. This criterion excludes P&Cs that only conduct business in the reinsurance market. P&Cs who write greater than twenty-five percent of their premiums in lines that are not significantly related to property and casualty (i.e., Accident and Health, Surety, Fidelity, and Credit) are excluded. All dependent, independent, and control variables missing values are excluded.
Journal of Accounting and Finance Vol. 16(4) 2016 17

TABLE 2 DESCRIPTIVE STATISTICS
Percentiles Variables Mean Std. Min 10th 25th 50th 75th 90th Max Taxable -0.002 0.050 -0.212 -0.047 -0.010 0.000 0.006 0.037 0.196 Operating Income -0.005 0.062 -0.250 -0.069 -0.026 0.000 0.020 0.058 0.184 Investment Income 0.027 0.032 -0.063 -0.004 0.011 0.026 0.041 0.060 0.173 Growth 0.195 1.242 -1.999 -0.338 -0.076 0.035 0.170 0.510 9.655 Taxes 0.008 0.017 -0.047 -0.006 0.000 0.005 0.015 0.029 0.076 Government 0.505 0.358 0.000 0.000 0.036 0.566 0.774 0.998 1.000 RBC 2.658 9.616 0.001 0.008 0.046 0.233 1.041 4.616 76.026 Size 10.980 1.951 6.913 8.554 9.567 10.818 12.267 13.647 16.140 Public Insurer 0.275 0.446 0.000 0.000 0.000 0.000 1.000 1.000 1.000 Stock Insurer 0.760 0.427 0.000 0.000 1.000 1.000 1.000 1.000 1.000 Mutual Insurer 0.187 0.390 0.000 0.000 0.000 0.000 0.000 1.000 1.000 Level 1 0.271 0.413 0.000 0.000 0.000 0.000 0.698 1.000 1.000 Level 2 0.138 0.309 0.000 0.000 0.000 0.000 0.013 0.806 1.000 Level 3 0.044 0.175 -0.002 0.000 0.000 0.000 0.000 0.018 1.000 Note: All variables are defined in Appendix A.
Due to the fact that P&Cs are required to be conservative in regards to their investment strategies, one
would assume that the decision to rebalance their portfolio would be subject to regulatory interference.14 Therefore, using the description of the investment limitations for the different investments classes (i.e., taxable and tax-exempt investments) per state and year subject to Limitations on P&Cs’ Investment in the NAIC’s Compendium of State Laws on Insurance Topics, the percent of total investments subject to these regulations is calculated for each insurer. The regulatory flexible investment variable for P&C 𝑖, in year 𝑡, in different investment categories 𝑐, having licenses in particular states indexed by 𝑠 is given by:
𝐺𝑜𝑣𝑒𝑟𝑛𝑚𝑒𝑛𝑡 = ∑ ∑ ∑ (𝐼𝑛𝑣𝑒𝑠𝑡𝑚𝑒𝑛𝑡𝑖,𝑐,𝑡𝑇𝑡=1
𝐶𝑐=1
𝑆𝑠=1 ∗𝑅𝑒𝑔𝑢𝑙𝑎𝑡𝑜𝑟𝑦 𝐹𝑙𝑒𝑥𝑖𝑏𝑖𝑙𝑖𝑡𝑦𝑠,𝑐,𝑡)
𝑆∗∑ ∑ 𝐼𝑛𝑣𝑒𝑠𝑡𝑚𝑒𝑛𝑡𝑖,𝑐,𝑡𝑇𝑡=1
𝐶𝑐=1
(3)
where 𝑅𝑒𝑔𝑢𝑙𝑎𝑡𝑜𝑟𝑦 𝐹𝑙𝑒𝑥𝑖𝑏𝑖𝑙𝑖𝑡𝑦 is a dichotomous variable set equal to one if state 𝑠 has a flexible investment regulatory environment per the statutes applied to different investment categories 𝑐, in year 𝑡, and zero otherwise.15 𝐼𝑛𝑣𝑒𝑠𝑡𝑚𝑒𝑛𝑡 is a continuous variable that applies to each P&C 𝑖, in year 𝑡, in different investment categories 𝑐. As mentioned earlier, P&Cs’ investment strategies are typically conservative in nature in regards to their investment decisions. For this reason, the NAIC designated an office, called the Securities Valuation Office (SVO), to manage the valuation of different securities.16
Therefore, depending on the different investment classes for fixed income securities the regulatory flexible investment variable could vary from zero to one. For example, some states allow medium and low investment grade (e.g., SVO designation class “3, 4, 5, and 6”) corporate and U.S. obligations, while other states place limitations on these types of investments.17 There are different factors to consider when using this measure. First, P&Cs invest in multiple investment classes: (e.g., bonds, equities, real estate, contract loans, etc.) therefore, all investments classes should be carefully accounted for, per the NAIC’s Exhibit of Net Investment Income Pages. Second, P&Cs are not necessarily licensed or chartered in certain states; therefore P&Cs are not subject to investment limitation regulation in that particular state of domicile. Finally, dissimilar to Born’s (2001) investment limitation variable, the regulatory investment flexible variable used in this study is more detailed as each investment category a P&C can invest in based on the NAIC’s Exhibit of Net Investment Income Pages, the number of licenses or charters in each
18 Journal of Accounting and Finance Vol. 16(4) 2016
state a P&C can conduct business in per year, and the changes to the NAIC’s Compendium of State Laws on Insurance Topics over the years is accounted for.18
The tax variable (Taxes) is defined as, the taxes paid divided by net income. Tax management strategies play an important role in P&Cs’ portfolio rebalancing decisions [Cummins and Grace (1994); Leland (1999)]. For example, Cummins and Grace (1994) empirically show that P&Cs continued to invest in tax-exempt securities after the Tax Reform Act of 1986, suggesting that corporate tax rates were still low enough to entice P&Cs to invest in tax-exempt securities. Another study not specifically related to the P&C industry (Leland, 1999), showed that firms with capital gain taxes rebalanced towards lower optimal initial investments (i.e., tax-exempt securities). There is an abundant amount of finance and insurance--related literature that discusses how tax strategies assist P&Cs and other firms engaging in portfolio rebalancing; however, there are limited studies addressing the investment limitations an insurer has with regard to portfolio rebalancing.
The regulatory compliance variable (RBC) is calculated using the Total Adjusted Capital divided by an Authorized Control Level Risk-Based percentage.19, 20Prior studies focus on financial solvency regulation and regulation efficiency (NAIC, 1995). There are different monitoring mechanisms to detect insolvency among P&Cs. Various ratios such as the Financial Analysis and Solvency Tracking (FAST) scores, Insurance Regulatory Information Systems (IRIS), and Risk Based Capital (RBC) ratios have been implemented to help identify P&Cs heading toward financial difficulties and to help identify P&Cs that may be undercapitalized. A diverse set of studies have adopted both the FAST scores [e.g., Cummins, Grace, and Phillips (1999); Cummins and Phillips (2009)] and IRIS ratios [(e.g., Petroni (1992); Beaver, McNichols, and Nelson (2003); Gaver and Patterson (1999, 2004, 2007)] to measure P&Cs’ solvency. However, RBC ratios directly account for asset risk.21
The NAIC’s RBC system was implemented "...to provide a capital adequacy standard that is related to risk, raises a safety net for insurers, is uniform among the states, and provides regulatory authority for timely action."22 The premise behind RBC is that P&Cs with uncertain financial solvency profiles, in terms of assets and underwriting risk, should hold higher levels of RBC’s (Leverty and Grace, 2014). The level of required RBC is calculated and reported annually. Within the RBC calculation, investment and other asset risk are included because these factors are important to regulators (NAIC, 2009). Other studies have provided evidence that RBC ratios do not add much in predicting financial solvency among P&Cs’ [e.g., Grace, Harrington, and Klein (1998); Cummins, Harrington, and Klein (1995); Cummins, Grace, and Phillips (1999)]. However, regulators make use of Total Adjusted Capital to its Authorized Control Level Risk-Based percentage to determine whether a remedial action for the P&Cs is needed. If a P&C has an RBC ratio that is in the “No Action” category, then regulators will not intervene in P&C business operations.
Table 3 provides Pearson and Spearman correlations. Our measure of ∆𝑇𝑎𝑥𝑎𝑏𝑙𝑒 is significant –at the 0.05 level–related to 𝑂𝑝𝑒𝑟𝑎𝑡𝑖𝑛𝑔 and 𝐼𝑛𝑣𝑒𝑠𝑡𝑚𝑒𝑛𝑡 income. While this indicates that there is a relationship between ∆𝑇𝑎𝑥𝑎𝑏𝑙𝑒 and/or 𝑂𝑝𝑒𝑟𝑎𝑡𝑖𝑛𝑔 and 𝐼𝑛𝑣𝑒𝑠𝑡𝑚𝑒𝑛𝑡 income, this univariate relationship is not the most accurate way to capture the interaction between the two periods (i.e., Before/After SSAP No. 100). In the next section we, therefore, control for other incentives in order to isolate the impact of SSAP No. 100, operating and investment income on portfolio rebalancing.
Journal of Accounting and Finance Vol. 16(4) 2016 19

TABLE 3 CORRELATION MATRIX
Panel A: Taxable Securities - Before SSAP No. 100 1 2 3 4 5 6 7 8 9 (1) Taxable
-0.103 0.096 0.003 -0.107 -0.067 0.001 -0.001 -0.020
(2) Operating Income -0.063
-0.576 -0.023 0.667 0.032 -0.027 -0.069 0.045
(3) Investment Income 0.051 -0.551
-0.113 -0.461 -0.140 0.001 0.049 -0.016
(4) Growth -0.020 -0.047 -0.081
0.092 0.035 0.021 -0.052 -0.005 (5) Taxes -0.074 0.660 -0.465 0.041
0.006 -0.001 -0.057 0.066
(6) Government -0.063 0.029 -0.118 0.033 0.017
-0.156 0.089 -0.148 (7) RBC 0.011 -0.034 0.038 -0.028 -0.044 -0.064
-0.236 0.902
(8) Reinsurance 0.010 -0.050 0.057 -0.007 -0.077 0.095 -0.064
-0.100 (9) Size 0.008 0.029 -0.010 -0.066 0.025 -0.065 0.549 -0.130
Note: This table provides the pairwise correlations years 2000 to 2013. Pearson correlations are shown below the diagonal and Spearman correlations shown above the diagonal. Coefficients in bold indicate significance at the 0.05 level.
Panel B: Taxable Securities - After SSAP No. 100
1 2 3 4 5 6 7 8 9 (1) Taxable
-0.058 0.048 -0.031 -0.069 -0.011 0.064 0.008 0.090
(2) Operating Income -0.061
-0.520 -0.018 0.664 0.034 -0.043 -0.015 0.041
(3) Investment Income 0.035 -0.527
-0.134 -0.429 -0.088 0.160 -0.031 0.133
(4) Growth -0.024 -0.074 -0.080
0.085 0.002 0.023 -0.009 -0.000 (5) Taxes -0.058 0.620 -0.468 0.038
0.030 -0.010 0.008 0.053
(6) Government -0.005 0.018 -0.051 0.001 0.031
-0.148 0.119 -0.127 (7) RBC 0.047 0.004 0.046 -0.014 -0.014 -0.074
-0.216 0.891
(8) Reinsurance 0.004 0.007 -0.018 -0.006 -0.033 0.112 -0.069
-0.061 (9) Size 0.073 0.060 0.061 -0.053 0.033 -0.082 0.539 -0.092 Note: This table provides the pairwise correlations years 2000 to 2013. Pearson correlations are shown below the diagonal and Spearman correlations shown above the diagonal. Coefficients in bold indicate significance at the 0.05 level. RESULTS Full Sample
Table 4 presents the results from estimating equation (1). Column (1), reports the full sample. The coefficient(s) 𝛼1 and 𝛼2, the effect of operating and investment income, is negative and significant, implying that P&Cs with operating and investment losses are more likely to rebalance toward taxable securities. The economic intuition is that P&Cs that are reporting operating or investment losses should sell tax-exempt securities and replace them with taxable securities since they can no longer benefit from any tax savings associated with the former. Column (2) and (3), reports the P&Cs before and after the
20 Journal of Accounting and Finance Vol. 16(4) 2016
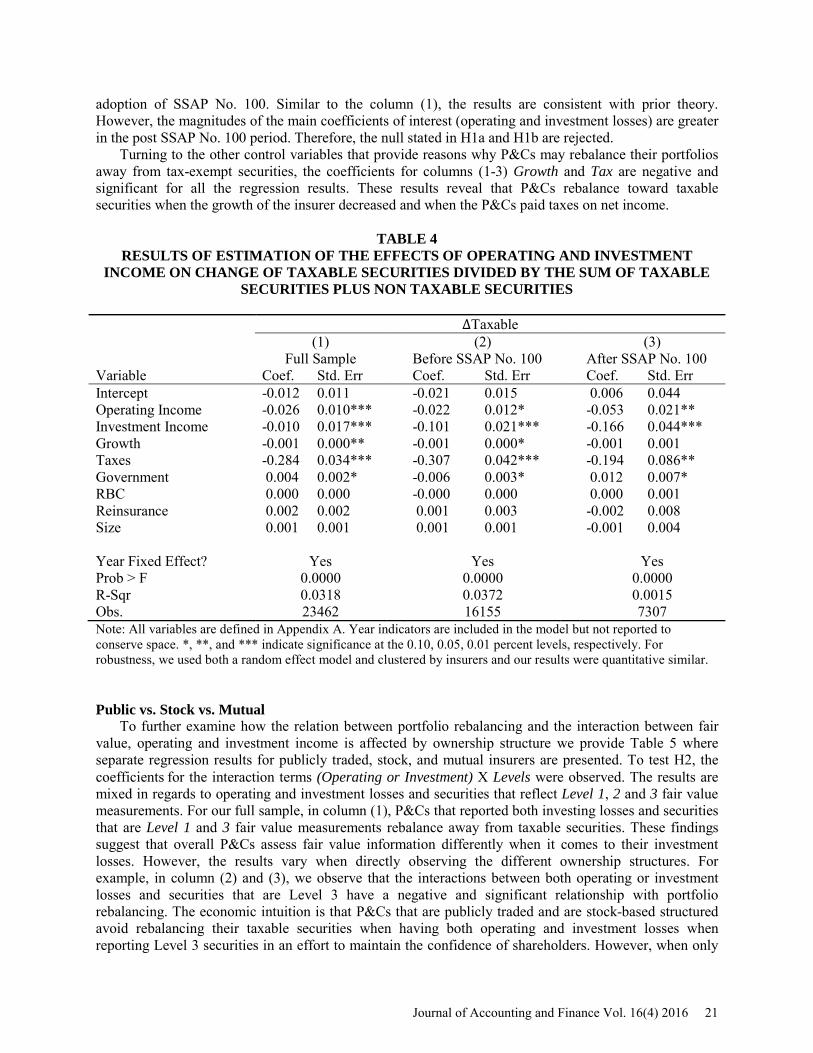
adoption of SSAP No. 100. Similar to the column (1), the results are consistent with prior theory. However, the magnitudes of the main coefficients of interest (operating and investment losses) are greater in the post SSAP No. 100 period. Therefore, the null stated in H1a and H1b are rejected.
Turning to the other control variables that provide reasons why P&Cs may rebalance their portfolios away from tax-exempt securities, the coefficients for columns (1-3) Growth and Tax are negative and significant for all the regression results. These results reveal that P&Cs rebalance toward taxable securities when the growth of the insurer decreased and when the P&Cs paid taxes on net income.
TABLE 4
RESULTS OF ESTIMATION OF THE EFFECTS OF OPERATING AND INVESTMENT INCOME ON CHANGE OF TAXABLE SECURITIES DIVIDED BY THE SUM OF TAXABLE
SECURITIES PLUS NON TAXABLE SECURITIES
∆Taxable (1) (2) (3) Full Sample Before SSAP No. 100 After SSAP No. 100 Variable Coef. Std. Err Coef. Std. Err Coef. Std. Err Intercept -0.012 0.011 -0.021 0.015 0.006 0.044 Operating Income -0.026 0.010*** -0.022 0.012* -0.053 0.021** Investment Income -0.010 0.017*** -0.101 0.021*** -0.166 0.044*** Growth -0.001 0.000** -0.001 0.000* -0.001 0.001 Taxes -0.284 0.034*** -0.307 0.042*** -0.194 0.086** Government 0.004 0.002* -0.006 0.003* 0.012 0.007* RBC 0.000 0.000 -0.000 0.000 0.000 0.001 Reinsurance 0.002 0.002 0.001 0.003 -0.002 0.008 Size 0.001 0.001 0.001 0.001 -0.001 0.004 Year Fixed Effect? Yes Yes Yes Prob > F 0.0000 0.0000 0.0000 R-Sqr 0.0318 0.0372 0.0015 Obs. 23462 16155 7307 Note: All variables are defined in Appendix A. Year indicators are included in the model but not reported to conserve space. *, **, and *** indicate significance at the 0.10, 0.05, 0.01 percent levels, respectively. For robustness, we used both a random effect model and clustered by insurers and our results were quantitative similar. Public vs. Stock vs. Mutual
To further examine how the relation between portfolio rebalancing and the interaction between fair value, operating and investment income is affected by ownership structure we provide Table 5 where separate regression results for publicly traded, stock, and mutual insurers are presented. To test H2, the coefficients for the interaction terms (Operating or Investment) X Levels were observed. The results are mixed in regards to operating and investment losses and securities that reflect Level 1, 2 and 3 fair value measurements. For our full sample, in column (1), P&Cs that reported both investing losses and securities that are Level 1 and 3 fair value measurements rebalance away from taxable securities. These findings suggest that overall P&Cs assess fair value information differently when it comes to their investment losses. However, the results vary when directly observing the different ownership structures. For example, in column (2) and (3), we observe that the interactions between both operating or investment losses and securities that are Level 3 have a negative and significant relationship with portfolio rebalancing. The economic intuition is that P&Cs that are publicly traded and are stock-based structured avoid rebalancing their taxable securities when having both operating and investment losses when reporting Level 3 securities in an effort to maintain the confidence of shareholders. However, when only
Journal of Accounting and Finance Vol. 16(4) 2016 21

observing mutual insurers we see that the interaction between investment income and Level 2 securities is positive and significant, indicating that these P&Cs rebalance their portfolios toward taxable securities. Since mutual insurers do not have traditional shareholders, their managers may be more focused on long-term performance and more willing to perform economically sound portfolio rebalancing, as predicted by theory.
TABLE 5 RESULTS OF ESTIMATION OF THE EFFECTS OF OPERATING AND INVESTMENT
INCOME AND LEVEL 1, 2 AND 3 SECURITIES ON CHANGE OF TAXABLE SECURITIES DIVIDED BY THE SUM OF TAXABLE SECURITIES
PLUS NON TAXABLE SECURITIES
∆Taxable (1) (2) (3) (4) Full Sample Public Ownership Stock Ownership Mutual Ownership Variable Coef. Std. Err Coef. Std. Err Coef. Std. Err Coef. Std. Err Intercept -0.009 0.047 0.223 0.104** -0.014 0.069 -0.212 0.215 Operating Income -0.033 0.026 0.030 0.065 0.019 0.042 -0.103 0.068 Investment Income -0.120 0.060** -0.105 0.145 -0.104 0.089 -0.150 0.130 Growth -0.001 0.001 0.002 0.002 0.001 0.001 -0.001 0.002 Taxes -0.229 0.091** -0.290 0.279 -0.311 0.162* -0.063 0.202 Government 0.013 0.007* 0.097 0.049** 0.031 0.015** -0.015 0.017 RBC -0.000 0.001 0.000 0.001 -0.000 0.001 0.002 0.003 Reinsurance -0.001 0.009 0.016 0.012 0.011 0.010 -0.022 0.035 Size 0.000 0.004 -0.021 0.008*** 0.000 0.006 0.019 0.019 Level 1 0.002 0.004 0.006 0.008 0.006 0.005 0.001 0.009 Level 2 -0.000 0.005 0.005 0.009 0.005 0.006 -0.013 0.011 Level 3 -0.000 0.010 0.040 0.013*** 0.003 0.011 0.044 0.045 Operating Income X Level 1
-0.063 0.040 -0.092 0.135 -0.086 0.081 -0.077 0.105
Operating Income X Level 2
-0.060 0.055 -0.114 0.113 -0.116 0.077 0.149 0.114
Operating Income X Level 3
-0.240 0.148 -0.558 0.171*** -0.373 0.211* 0.391 0.341
Investment Income X Level 1
-0.207 0.091** -0.246 0.259 -0.380 0.171** -0.179 0.220
Investment Income X Level 2
0.045 0.112 0.156 0.198 -0.151 0.138 0.600 0.250**
Investment Income X Level 3
-0.576 0.272** -1.352 0.391*** -0.594 0.350* -1.522 1.470
Year Fixed Effect? Yes Yes Yes Yes Prob > F 0.0000 0.0000 0.0016 0.0000 R-Sqr. 0.0020 0.0073 0.0001 0.0155 Obs. 6766 1325 3905 1064 All variables are defined in Appendix A. Year indicators are included in the model but not reported to conserve space. *, **, and *** indicate significance at the 0.10, 0.05, 0.01 percent levels, respectively. For robustness, we used both a random effect model and clustered by insurers and our results were quantitative similar.
Overall, the results suggest that P&Cs with operating and investment losses transition towards taxable securities prior to and after the adoption of (SSAP) No. 100 which is consistent with portfolio rebalancing theory. Conversely, P&Cs that have different ownership structures reporting fair value securities having either operating or investment losses are less likely to rebalance their portfolio towards taxable securities.
22 Journal of Accounting and Finance Vol. 16(4) 2016
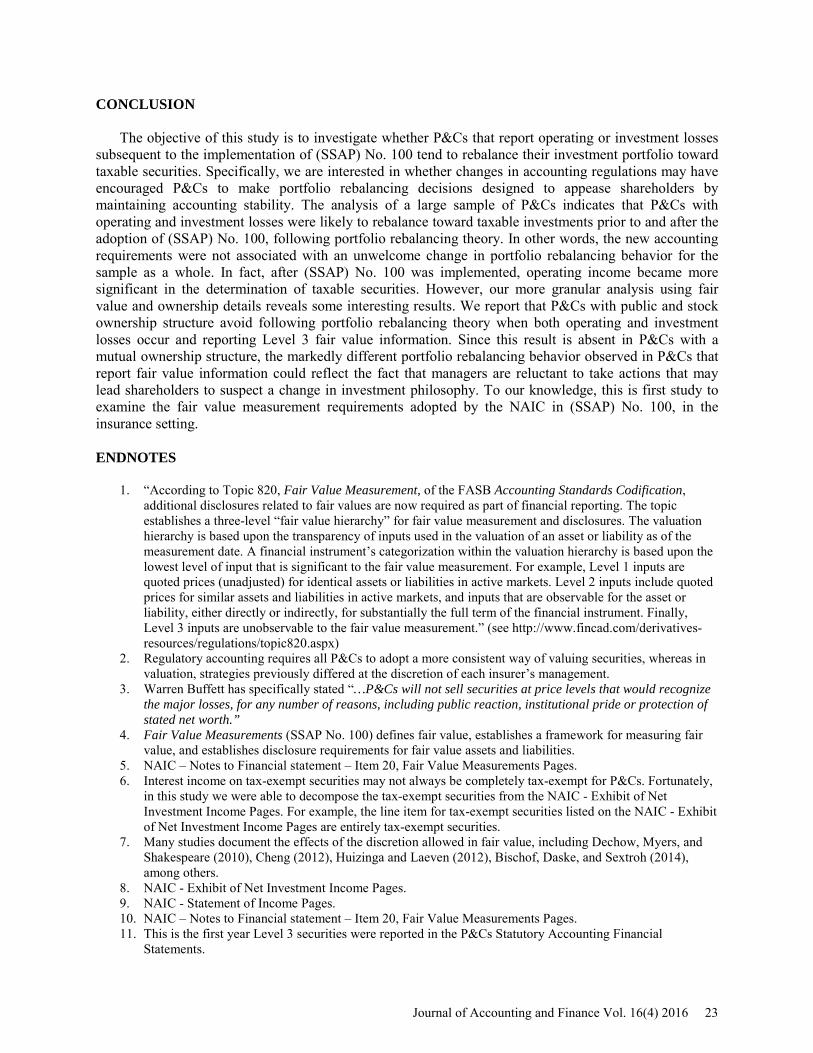
CONCLUSION The objective of this study is to investigate whether P&Cs that report operating or investment losses
subsequent to the implementation of (SSAP) No. 100 tend to rebalance their investment portfolio toward taxable securities. Specifically, we are interested in whether changes in accounting regulations may have encouraged P&Cs to make portfolio rebalancing decisions designed to appease shareholders by maintaining accounting stability. The analysis of a large sample of P&Cs indicates that P&Cs with operating and investment losses were likely to rebalance toward taxable investments prior to and after the adoption of (SSAP) No. 100, following portfolio rebalancing theory. In other words, the new accounting requirements were not associated with an unwelcome change in portfolio rebalancing behavior for the sample as a whole. In fact, after (SSAP) No. 100 was implemented, operating income became more significant in the determination of taxable securities. However, our more granular analysis using fair value and ownership details reveals some interesting results. We report that P&Cs with public and stock ownership structure avoid following portfolio rebalancing theory when both operating and investment losses occur and reporting Level 3 fair value information. Since this result is absent in P&Cs with a mutual ownership structure, the markedly different portfolio rebalancing behavior observed in P&Cs that report fair value information could reflect the fact that managers are reluctant to take actions that may lead shareholders to suspect a change in investment philosophy. To our knowledge, this is first study to examine the fair value measurement requirements adopted by the NAIC in (SSAP) No. 100, in the insurance setting. ENDNOTES
1. “According to Topic 820, Fair Value Measurement, of the FASB Accounting Standards Codification, additional disclosures related to fair values are now required as part of financial reporting. The topic establishes a three-level “fair value hierarchy” for fair value measurement and disclosures. The valuation hierarchy is based upon the transparency of inputs used in the valuation of an asset or liability as of the measurement date. A financial instrument’s categorization within the valuation hierarchy is based upon the lowest level of input that is significant to the fair value measurement. For example, Level 1 inputs are quoted prices (unadjusted) for identical assets or liabilities in active markets. Level 2 inputs include quoted prices for similar assets and liabilities in active markets, and inputs that are observable for the asset or liability, either directly or indirectly, for substantially the full term of the financial instrument. Finally, Level 3 inputs are unobservable to the fair value measurement.” (see http://www.fincad.com/derivatives-resources/regulations/topic820.aspx)
2. Regulatory accounting requires all P&Cs to adopt a more consistent way of valuing securities, whereas in valuation, strategies previously differed at the discretion of each insurer’s management.
3. Warren Buffett has specifically stated “…P&Cs will not sell securities at price levels that would recognize the major losses, for any number of reasons, including public reaction, institutional pride or protection of stated net worth.”
4. Fair Value Measurements (SSAP No. 100) defines fair value, establishes a framework for measuring fair value, and establishes disclosure requirements for fair value assets and liabilities.
5. NAIC – Notes to Financial statement – Item 20, Fair Value Measurements Pages. 6. Interest income on tax-exempt securities may not always be completely tax-exempt for P&Cs. Fortunately,
in this study we were able to decompose the tax-exempt securities from the NAIC - Exhibit of Net Investment Income Pages. For example, the line item for tax-exempt securities listed on the NAIC - Exhibit of Net Investment Income Pages are entirely tax-exempt securities.
7. Many studies document the effects of the discretion allowed in fair value, including Dechow, Myers, and Shakespeare (2010), Cheng (2012), Huizinga and Laeven (2012), Bischof, Daske, and Sextroh (2014), among others.
8. NAIC - Exhibit of Net Investment Income Pages. 9. NAIC - Statement of Income Pages. 10. NAIC – Notes to Financial statement – Item 20, Fair Value Measurements Pages. 11. This is the first year Level 3 securities were reported in the P&Cs Statutory Accounting Financial
Statements.
Journal of Accounting and Finance Vol. 16(4) 2016 23

12. In addition, we winsorized (at the 1% and 99% percentiles) all the variables used in the regressions and obtained similar results.
13. For example, if P&Cs that are in flexible investment regulatory environments can rebalance their portfolios into any different type of security without regulatory interference, then P&Cs could be subject to potential lawsuits if their portfolios are not in line with their investors risk/return preferences.
14. Another study that observes the limitations on investment is Born, 2001. In her study she uses a dichotomous variable equal to one if the state has any investment limitations, zero otherwise. She finds that P&Cs in states with investment limitations (i.e., less flexible investment regulation) have higher profitability, on average, than P&Cs in states without such limitations (i.e., more flexible investment regulation). The limitation on the investments variable is substantially different since we adopt the variable similar to Reddic, Boyer, and Cowins Reddic (2014) who accounts for each investment class, per insurer, per year. In addition, each statutory law provision on different investment categories, per state, per year is addressed.
15. “The NAIC’s Securities Valuation Office (SVO) is responsible for the day-to-day credit quality assessment and valuation of securities owned by state regulated insurance companies. The SVO conducts credit analysis on these securities for the purpose of assigning an NAIC class rating designation. These designations are produced solely for the benefit of members who may utilize them as part of the member’s monitoring of the financial condition of its domiciliary P&Cs.” Unlike other rating agencies, the NAIC does not produce the designations to aid investment decisions for investors (NAIC, 2014).
16. See Appendix A for detailed information. 17. NAIC - Five Year Historical Data Pages. 18. There are five distinctive outcomes to the RBC calculation. For more information about the general
overview of RBC see http://www.naic.org/documents/committee_e_caped_RBCoverview.prdf or a critique see (Feldblum, 1996).
- “No Action” – If an insurer’s RBC ratio is greater than 200 percent - “Company Action Level” – If an P&Cs’ RBC ratio is between 150 to 200 percent - “Regulatory Action Level” – If an P&Cs’ RBC ratio is between 100 to 150 percent - “Authorized Control Level” – If an P&Cs’ RBC ratio is between 70 to 100 percent - “Mandatory Action Level” – If an P&Cs’ RBC ratio is less than 70 percent
19. Since only two IRIS ratios (Investment Yield and Liabilities to Liquid Assets) have a direct impact on asset risk, we decided the use of IRIS ratios would not be the most appropriate measure for this study. Therefore, we use RBC ratios to account for asset risk.
20. Since only two IRIS ratios (Investment Yield and Liabilities to Liquid Assets) have a direct impact on asset risk, we decided the use of IRIS ratios would not be the most appropriate measure for this study. Therefore, we use RBC ratios to account for asset risk.
21. http://www.naic.org/cipr_topics/topic_risk_based_capital.htm REFERENCES Barth, M.E. (1994). Fair value accounting: Evidence from investment securities and the market
valuation of banks. The Accounting Review, 69, (1), 1-25. Barth, M.E., W.H. Beaver, and W.R. Landsman (1996). Value-relevance of banks’ fair value
disclosures under SFAS No. 107. The Accounting Review, 71, (4), 513-537. Beaver, W., M. McNichols, and K. Nelson (2003). Management of the loss reserve accrual and the
distribution of earnings in the property-casualty insurance industry. Journal of Accounting and Economics, 35, 347-376.
Belsley, D., E. Kuh, and R. Welsch (1980). Regression Diagnostics. Wiley, New York. Berger, A.N., J.D. Cummins, M.A. Weiss, and H. Zi (2000). Conglomeration versus strategic focus:
Evidence from the insurance industry. Journal of Financial Intermediation, 9, (4), 323-362. Berger, P.G., and E. Ofek (1995). Diversification’s effect on firm value. Journal of Financial Economics,
37, (1), 39-65. Bischof, J., H. Daske, and C. Sextroh (2014). Fair value‐related information in analysts’ decision
processes: Evidence from the financial crisis. Journal of Business Finance & Accounting, 41, (3), 363-400.
24 Journal of Accounting and Finance Vol. 16(4) 2016

Black, F. (1980). The tax consequences of long-run pension policy. Financial Analysts Journal, 36, (4), 21-28.
Born, P.H. (2001). Insurer profitability in different regulatory and legal environments. Journal of Regulatory Economics, 19, (3), 211-237.
Bradford, D.F. and K.D. Logue (1998). The effects of tax-law changes on property-casualty insurance prices, in The Economics of Property-Casualty Insuranceed. David F. Bradford (Chicago: University of Chicago Press).
Cheng, K. (2012). Accounting discretion and fair value reporting: A study of US banks’ fair value reporting of mortgage‐backed‐securities. Journal of Business Finance & Accounting, 39, (5), 531-566.
Comment, R., and G.A. Jarrell (1995). Corporate focus and stock returns. Journal of Financial Economics, 37, (1), 67-87.
Cummins, J.D., and E. Grace (1994). Tax management and investment strategies of property-liability P&Cs. Journal of Banking and Finance, 18, (1), 43-72.
Cummins, J.D., E. Grace, and R.D. Phillips (1999). Regulatory solvency prediction in property-liability insurance: Risk-based capital, audit ratios, and cash flow simulation. Journal of Risk and Insurance, 66, (3), 417-458.
Cummins, J.D., S.E. Harrington, and R.W. Klein (1995). Insolvency experience, risk based capital, and prompt corrective action in property-liability insurance. Journal of Banking and Finance, 19, (3), 511-528.
Cummins, J.D., and R.D. Phillips (2009). Capital adequacy and insurance risk-based capital system. Journal of Insurance Regulation, 28, (1), 25-72.
Feldblum, S. (1996). NAIC Property/Casualty Insurance Company Risk-Based Capital Requirements. Retrieved from http://casualtyactuaries.com/pubs/proceed/proceed96/96297.pdf.
Gaver, J.J., and J.S. Patterson (1999). Managing insurance company financial statements to meet regulatory and tax reporting goals. Contemporary Accounting Research, 16, (2), 1-40.
Gaver, J.J., and J.S. Patterson (2004). Do P&Cs manipulate loss reserves to mask solvency problems. Journal of Accounting and Economics, 37, (3), 393-416.
Gaver, J.J., and J.S. Patterson (2007). The influence of large client on office-level auditor oversight: Evidence from the property-casualty insurance industry. Journal of Accounting Economics, 43, (2), 299-320.
Gibson, S., A. Safieddine, and S. Titman (2000). Tax-motivated trading and price pressure: An analysis of mutual fund holdings. Journal of Financial and Quantitative Analysis, 35, (3), 369-386.
Grace, M.F., S.E. Harrington, and R.W. Klein (1998). Risk-based capital and solvency screening in property-liability insurance: Hypotheses and empirical test. Journal of Risk and Insurance, 65, (2), 213-243.
Harrington, S.E., and G. Niehaus (2003). Capital, corporate income taxes, and catastrophe insurance. Journal of Financial Intermediation, 12, (4), 365-389.
He, E., and D.W Sommer (2010). Separation of ownership and control: Implications for board composition. Journal of Risk and Insurance, 77, (2), 265-295.
Hendershott, P.H., and T.W. Koch (1980). The demand for tax-exempt securities by financial institutions. The Journal of Finance, 35, (3), 717-727.
Huizinga, H., and L. Laeven (2012). Bank valuation and accounting discretion during a financial crisis. Journal of Financial Economics, 106, (3), 614-634.
Kolev, K. (2009). Do Investors perceive marking-to-model as marking-to-myth? Early evidence from FAS 157 disclosure. Working paper. New York University.
Kwon, W.J., H. Kim, and S.J. Lee (2005). Can insurance firms easily exit from the market? A global comparative analysis of regulatory structures. The Geneva Papers on Risk and Insurance – Issues and Practice,30, (2), 268-284.
Lambert, E.W., and A.E. Hofflander (1966). Impact of new multiple line underwriting on investment portfolios of property-liability insurers. Journal of Risk and Insurance, 33, (2), 209-233.
Journal of Accounting and Finance Vol. 16(4) 2016 25

Lambert, E.W., and A.E. Hofflander (1967). Portfolio management of property-liability companies. Financial Analysts Journal, 23, (5), 141-146.
Laux, C., and C. Luez (2010). Did fair-value accounting contribute to the financial crisis? Journal of Economic Perspectives, 24, (1), 93-118.
Leibowitz, M.L. (1981). Volatility in tax-exempt bonds: Estimating and using volatility factors. Financial Analysts Journal, 37, (6), 31-52.
Leland, H.E. (1999). Optimal portfolio management with transactions costs and capital gains taxes. Research Program in Finance Working Papers University of California, Berkeley.
Leverty J.T., and M.F. Grace (2014). Do elections delay regulatory action? Working Paper. Littman, M., D. Thomas, M. Tarrant, and S. Gutterman (2004). An investigation of practical matters
related to implementing fair value accounting for property/casualty loss reserves, in Fair Value of P&C Liabilities: Practical Implications (Casualty Actuarial Society, Arlington, Virginia). Retrieved from: https://www.casact.org/pubs/fairvalue/115.pdf.
Markowitz, H. M. (1952). Portfolio selection. Journal of Finance, 7, (1), 77-91. Mayers, D., and C.W. Smith (2010). Compensation and board structure: Evidence from the insurance
industry. Journal of Risk and Insurance, 77, (2), 297-327. Miller, M.H (1977). Debt and taxes, Journal of Finance, 32, (2), 261-275. National Association of Insurance Commissioners (NAIC) (1995). Using the NAIC Insurance Regulatory
Information System: Property and Liability Edition. NAIC, Kansas City, MO. National Association of Insurance Commissioners (NAIC) (2007). Financial Condition (E) Committee.
Retrieved from: http://www.naic.org/documents/committees_ex_isftf_isawg_iasb_tenative_positions_contract.pdf.
National Association of Insurance Commissioners (NAIC) (2009). Using the NAIC Insurance Regulatory Information System: Property and Liability Edition. NAIC, Kansas City, MO.
National Association of Insurance Commissioners (NAIC) (2014). Capital Markets & Investment Analysis Office. Retrieved from: http://www.naic.org/svo.htm.
Nelson, K.K. (1996). Fair value accounting for commercial banks: An empirical analysis of SFAS No. 107. The Accounting Review, 71, (2), 161-182.
Nelson, K.K. (2000). Rate regulation, competition, and loss reserve discounting by property-casualty insurers. The Accounting Review, 75, (1), 115-138.
Nissim, D. (2010). Analysis and valuation of insurance companies. Center for Excellence in Accounting & Security Analysis, Columbia Business School.
Oakland, W.H. (1972).Corporate earnings and tax shifting in U.S. manufacturing, 1930-1968. Review of Economics and Statistics, 54, (3), 235-244.
Petroni, K. (1992). Management’s response to the differential costs and benefits of optimistic reporting in the property-casualty insurance industry. Journal of Accounting and Economics, 15, (4), 485-508.
Petroni, K., S.G. Ryan, and J.M. Wahlen (2000). Discretionary and non-discretionary revisions of loss reserve by property-casualty P&Cs: Differential implications for future profitability, risk, and market value. Review of Accounting Studies, 5, (2), 95-125.
Petroni, K.R., and J.M. Wahlen (2000). Information about future cash flows in fair value disclosures of equity and debt securities of property-liability insurance companies. Working Paper.
PonArul, R., and P.V. Viswanath (1995). Solvency risk and the tax sheltering behavior of property- liability P&Cs. Journal of Risk and Insurance, 62, (3), 575-584.
Poterba, J.M. (1986). Explaining the yield spread between taxable and tax-exempt bonds: The role of expected tax policy. NBER Reprint no. 746. Cambridge, Mass.: National Bureau of Economic Research.
Powell, L.S., D.W. Sommer, and D.L. Eckles (2008). The role of internal capital markets in financial intermediaries: Evidence from insurer groups. Journal of Risk and Insurance, 75, (2), 439-461.
Reddic, W.D., M.M. Boyer, and E. Cowins (2014). Portfolio rebalancing behavior under operating losses and investment limitations. Working Paper, DePaul University.
26 Journal of Accounting and Finance Vol. 16(4) 2016
Riedl, E.J., and G. Serafeim (2011). Information risk and fair values: An examination of equity betas. Journal of Accounting Research, 49, (4), 1083-1122.
Rosner, B.B., and M.J. Freedman (2013). How fair value measurement changes risk management behavior in the insurance industry. Financial Reporting Section – Society of Actuaries.
Ryan, S.G. (2008). Accounting in and for the subprime crisis. The Accounting Review, 83, (6), 1605–1638.
Scholes, M.S., G.P. Wilson, and M.A. Wolfson (1990). Tax planning, regulatory capital planning, and financial reporting strategy for commercial banks. Review of Financial Studies, 3, (4), 625-650.
Smith, M.L. (1989). Investment return and yields to holders of insurance. The Journal of Business, 62, (1), 81-98.
Sommer, D.W. (1996). The impact of firm risk on property-liability insurance prices. Journal of Risk and Insurance, 63, (3), 501-514.
Song, C.J., W.B. Thomas, and H. Yi (2010). Value relevance of FAS 157 fair value hierarchy information and the impact of corporate governance mechanism. The Accounting Review, 85, (4), 1375-1410.
Whalen, R.C. (2008). The subprime crisis-cause, effect and consequences. Journal of Affordable Housing & Community Development Law, 17, (3), 219-235.
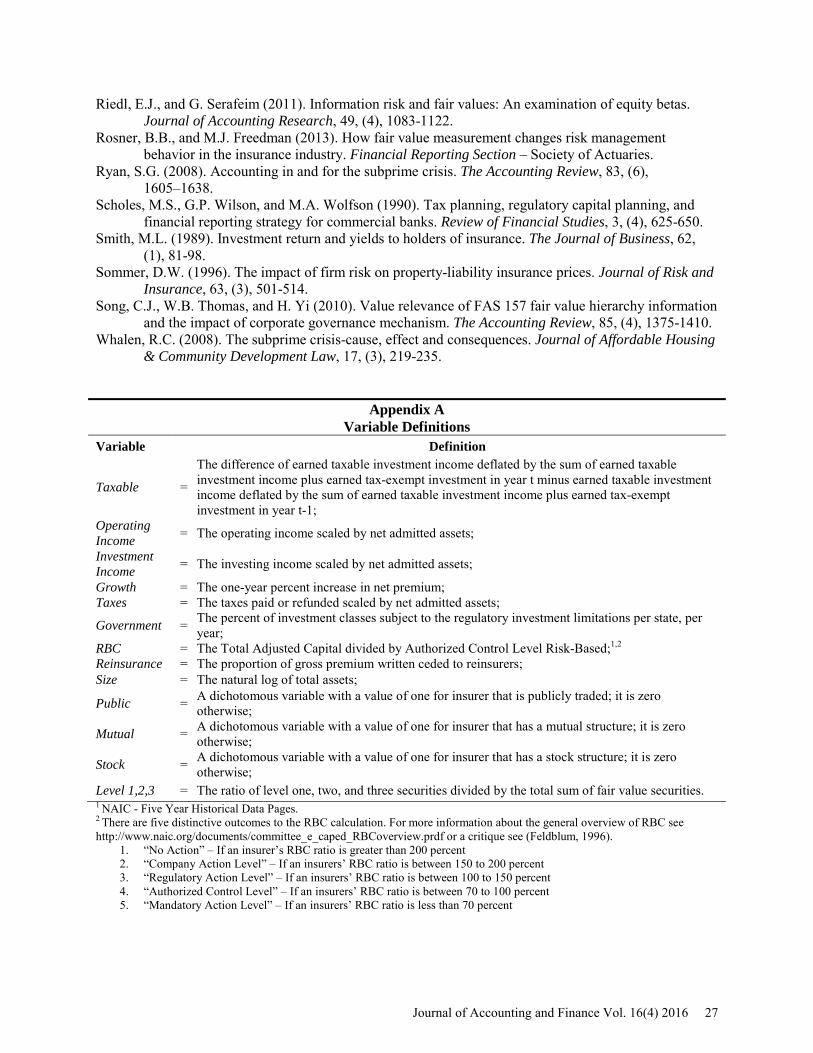
Appendix A Variable Definitions
Variable Definition
Taxable =
The difference of earned taxable investment income deflated by the sum of earned taxable investment income plus earned tax-exempt investment in year t minus earned taxable investment income deflated by the sum of earned taxable investment income plus earned tax-exempt investment in year t-1;
Operating Income = The operating income scaled by net admitted assets;
Investment Income = The investing income scaled by net admitted assets;
Growth = The one-year percent increase in net premium; Taxes = The taxes paid or refunded scaled by net admitted assets;
Government = The percent of investment classes subject to the regulatory investment limitations per state, per year;
RBC = The Total Adjusted Capital divided by Authorized Control Level Risk-Based;1,2
Reinsurance = The proportion of gross premium written ceded to reinsurers; Size = The natural log of total assets;
Public = A dichotomous variable with a value of one for insurer that is publicly traded; it is zero otherwise;
Mutual = A dichotomous variable with a value of one for insurer that has a mutual structure; it is zero otherwise;
Stock = A dichotomous variable with a value of one for insurer that has a stock structure; it is zero otherwise;
Level 1,2,3 = The ratio of level one, two, and three securities divided by the total sum of fair value securities. 1 NAIC - Five Year Historical Data Pages. 2 There are five distinctive outcomes to the RBC calculation. For more information about the general overview of RBC see http://www.naic.org/documents/committee_e_caped_RBCoverview.prdf or a critique see (Feldblum, 1996).
1. “No Action” – If an insurer’s RBC ratio is greater than 200 percent 2. “Company Action Level” – If an insurers’ RBC ratio is between 150 to 200 percent 3. “Regulatory Action Level” – If an insurers’ RBC ratio is between 100 to 150 percent 4. “Authorized Control Level” – If an insurers’ RBC ratio is between 70 to 100 percent 5. “Mandatory Action Level” – If an insurers’ RBC ratio is less than 70 percent
Journal of Accounting and Finance Vol. 16(4) 2016 27