how far did africa’s first generation trade...
TRANSCRIPT

How Far Did Africa’s First Generation Trade Reforms Go?
An Intermediate Methodology for Comparative Analysis of Trade Policies
Volume II: Annexes
Lawrence Hinkle Alberto Herrou-Aragon
Keiko Kubota
June 2003

How Far Did Africa’s First Generation Trade Reforms Go? An Intermediate Methodology for Comparative Analysis of Trade Policies Africa Region Working Paper Series No. 58b (Volume II) June 2003 Abstract
his paper presents an intermediate methodology for evaluating trade regimes in Sub-Saharan Africa. The methodology
permits a quantitative instrument-by-instrument assessment of the conventional border instruments of trade policy. Measuring the impact of each policy instrument on the average prices of import-competing and export goods, we arrive at an estimate of the B index of anti-export bias developed by Bhagwati (1978) and Krueger (1978). The B index is used as a summary measure for an overall assessment of the trade policies of 13 sample countries. The paper finds that, although the best practice countries in our sample had not yet caught up with all of the best practices observed elsewhere
in the developing world, “first generation trade reforms” in the 1990s had led to significant liberalization. Despite progress in rationalizing tariff structures, however, lowering rates and eliminating quantitative restrictions, trade policies maintain a bias in favor of import-competing activities over exports. The paper also presents a comparison with the IMF and the African Competitiveness Report’s methodologies for assessing trade policies.
Volume 1 develops the above methodology and presents the findings for the thirteen sample countries. Volume 2 provides background notes on various points concerning the application of the methodology and the sample countries.
Authors’Affiliation and Sponsorship
Lawrence E. Hinkle Lead Economist Email: [email protected] Alberto Herrou-Aragon Universidad Siglo 21 Email: [email protected] Keiko Kubota Economist Email: [email protected] The Africa Region Working Paper Series expedites dissemination of applied research and policy studies with potential for improving economic performance and social conditions in Sub-Saharan Africa. The Series publishes papers at preliminary stages to stimulate timely discussion within the Region and among client countries, donors, and the policy research community. The editorial board for the Series consists of representatives from professional families appointed by the Region’s Sector Directors. For additional information, please contact Paula White, managing editor of the series, (81131), Email: [email protected] or visit the Web site: http://www.worldbank.org/afr/wps/index.htm.
The findings, interpretations, and conclusions expressed in this paper are entirely those of the author(s), they do not necessarily represent the views of the World Bank Group, its Executive Directors, or the countries they represent and should not be attributed to them.
T

Acknowledgements
he authors would like to thank Francesca Castellani for valuable suggestions and support which improved the paper substantially. Luc de Wulf , Philip English, Faezeh Foroutan, Alan Gelb, Bernard
Hoekman, Arvind Panagariya, Stephen O’Brien, Arvind Subramanian, and Alexander Yeats also provided helpful comments on drafts of this paper. Ali Zafar and Vargha Azad assisted with the research, and Josiane Luchmun provided logistical support.
T

Abbreviations
ACR: The African Competitiveness Report BEC: Broad Economic Classification CAEMC: Central African Economic and Monetary Community COMESA: Common Market for Eastern and Southern Africa ECOWAS: Economic Community of West African States EAC: East African Economic Community EPZs: Export Processing Zones HS: Harmonized System IMF: International Monetary Fund ISIC: International Standard Industrial Classification MFN: Most Favoured Nation NPR: Nominal Protection Rate NPTR: Nominal Protection Tax Rate NTB: Non-Tariffs Barriers PTA: Preferential Trade Agreement QRs: Quantitative Restrictions RTA: Regional Trade Area SACU: South Africa Customs Union SADC: Southern African Development Community SSA: Sub-Saharan Africa TI: Transparency International UEMOA: Union Économique et Monétaire Ouest Africaine UNCTAD: United Nations Conference on Trade and Development TRAINS: Trade Analysis and Information System WAEMU: West African Economic and Monetary Community WTO: World Trade Organization

How Far Did Africa’s First Generation Trade Reforms Go ? An Intermediate Methodology for Comparative
Analysis of Trade Policies
Volume II
Table of Contents
List of Annexes
Annex A: A Background Note on Methodologies for Assessing Trade Policies............ 1
Annex B A Note on the Data Required for Measuring Trade Reform .......................... 11
Annex C: Protectionist Quantitative Restrictions in the Sample Countries .................... 26
Annex D: The Tariff Regimes of the Sample Countries ................................................. 27
Annex E: Summary Indicators of Tariff Barriers............................................................ 32
Annex F: Alternative Calculations of the B and B* Indices ........................................... 43
Annex G: Comparison Between Tariff Drawback (Rebate) and Tariff Suspension
(Temporary Admission) Schemes................................................................... 48
Annex H: Dysfunctional EPZ Arrangements .................................................................. 49 List of Tables Table A1: IMF1997 Classification Scheme for Tariff Restrictiveness ....................... 4
Table A2: IMF 1997 Classification Scheme for NTB Restrictiveness ....................... 4
Table A3: IMF 1997 Classification Scheme for Overall Trade Restrictiveness ......... 5
Table A4: IMF 2000 Classification Scheme for Tariff Restrictiveness ...................... 6
Table A5. Summary of Overall Ratings According to the IMF Methodologies
and the Normalized B Index....................................................................... 6
Table A6: The Heritage Foundation Index’s Trade Policy Grading Scale .................. 9
Table B1: Zimbabwe – Estimation of Percentage of Manufacturing Production
Subject to NTBs ......................................................................................... 14
Table B2: Example of Treatment of Discrimination against Imports in Domestic
Indirect Taxation in Computing Nominal Protection Tax Rates (%) ......... 16
Table B3: Example of Treatment of Exemptions in Computing Average Tariffs ...... 21
Table D1: Tariff Regimes – Summary of Policies ...................................................... 27

ii
Table D2: Import Tariff Barriers – Average Tariffs, Collection Rates, and NPTRs .. 30
Table D3: Structure of Protection by Economic Use .................................................. 31
Table E1: Distortionary Resource Allocation Effects of Tariffs -- Multivariate
Indicator (MVI) .......................................................................................... 34
Table E1A: Distortionary Resource Allocation Effects of Tariffs -- Normalized Values
of Multivariate Indicator............................................................................. 35
Table E2: Multivariate Summary Indicator of Tariff Barriers .................................... 37
Table E2A: Multivariate Summary Indicator of Tariff Barriers -- Normalized Values 38
Table E3: Partial Correlation between Measures of Tariff Barriers and TI Corruption
Index........................................................................................................... 39
Table E4: Three Variable Summary Tariff Indicator.................................................. 41
Table E5: Comparison of One, Three, and Multivariate Summary Tariff Indicators –
Normalized Values ..................................................................................... 42
Table F1: B Index........................................................................................................ 44
Table F1A: Components of B Index (Numerator) ......................................................... 45
Table F1B: Components of B Index (Denominator) ..................................................... 46
Table F2: B* Index Calculations ................................................................................ 47
References ......................................................................................................................... 51

Annex A
A Background Note on Methodologies for Assessing Trade Policies 1. Measuring Trade Distortions. It should be recognized form the outset that measuring the distortions caused by trade policies is not an easy task. Besides import duties and export taxes, there are other impediments to trade such as quantitative and foreign exchange restrictions, tariff exemptions affecting imports of inputs and capital goods, and preferential tariffs under regional free trade arrangements. Quantifying these is always a challenge for a trade policy analyst.
2. Various different approaches have been followed in dealing with the problem of measuring trade policy distortions. Most of these methodologies are subject, in one way or another, to criticism either because their indicators of trade distortions are limited to only particular aspects of commercial policies that are the most readily measurable or because they are based on subjective judgments concerning the harder to measure aspects of trade policies. Without trying to make an overall assessment here of all of the various methodologies, a summary of six of the most recently used ones is presented below, that is: the Krueger-Bhagwati B index of anti-export bias, the IMF’s trade restrictiveness index, Narasimhan’s and Pritchett’s (1997) notional import volume indicator, the Sachs-Warner (1995) openness indicator, the Heritage Foundation’s trade policy index, and the World Economic Forum’s African Competitiveness Index.
3. The B Index of Relative Prices. The classic study directed by A. Krueger (1978) and J. Bhagwati (1978) provides the first attempt at classifying trade regimes according to their restrictiveness. Trade orientation is measured by the degree by which protection to import-competing activities biases trade policy against exports. A formal index was defined as the ratio of domestic prices of imports to domestic prices of exports. For this index to be a relevant indicator of the magnitude of restrictions of the trade regime, domestic prices of imports should be calculated taking into account their c.i.f. border price plus import tariff rates, the impact of quantitative restrictions on domestic prices of similar products, and any differential in domestic taxation of imports versus domestically produced commodities. On the exportable side, export prices should take into account foreign exchange rationing as it affects the net price received by exporters, how domestic indirect taxation (i.e., VAT) affects exporters, and finally how exporters get tariff rebates on their imports of inputs.
4. This measure of trade restrictions can be summarized in the following expression:
(1) ( )( )rtsE
PRntEB
Ix
m
+−++++
=11
where Em and Ex are nominal exchange rates applied on imports (m) or exports (x); t is the average import duty, n is any additional discriminatory indirect taxes, PR is the differential between the domestic and border prices of importable commodities subject to non tariff barriers, s reflects any export subsidy (s>0) or export tax (s<0), tI is the tax on inputs used in production of exportable goods (i.e. import duties and any discriminatory domestic taxes on tradable inputs,

2
including VAT that are not reimbursed, multiplied by the share of that tradable inputs in total costs), and r is any import tariff rebate granted to producers of exportable goods. 5. The B index allows a commercial policy analyst to classify trade regimes according to their degree of trade restrictiveness. If B is higher than one, the indicator captures the fact that commercial policies support import substitution. If B is less than one, then the country is involved in export promotion strategy. Finally, if B is equal to one, then commercial policies are neutral regarding export incentives. Thus the index permits a ranking of countries according to the openness of their trade policies and avoids a dichotomized view of trade regimes.
6. In calculating the B index, careful attention needs to be paid to some technical difficulties in order to arrive at a satisfactory indicator of the degree of trade restrictions in a country. First, if the import tariff rate t is considered a weighted average of all tariff rates, say t , then two countries with the same t may have different degrees of anti-export bias depending on the levels of effective protection created by the different structure of protection in the two countries. If, for instance, country A imposes a tariff of 100% on imports competing with locally produced consumer goods and 0% on imports of inputs and capital goods that are not produced at home, and their weights in total imports are 33 and 66%, respectively, then its import-weighted average nominal import tariff rates will be around 30%. If country B taxes imports competing with locally produced consumer goods at 40% and imports of inputs and capital goods at around 25%, then the two countries would have the same average nominal import tariff (30%). If the B index is calculated using the average nominal protection rates, then the index would be equal to 1.30 for both countries, assuming that exporters are able to get full reimbursement for the tariffs and taxes paid on inputs. Thus, if the B index is calculated using average nominal tariffs, the two countries would be ranked equally in terms of anti-export bias.
7a. However, because of the greater escalation of tariffs in country A than in country B, the effective protection rates for import-competing activities (and, consequently, the incentives to shift resources from production of exportable goods to import-competing activities) would be significantly higher in A than B. For instance, if the proportions of domestic value added in output were 50% for import-competing and exportable activities in both countries, then the effective protection rates in country A would be 200% for import-competing activities and zero for exportable activities. The B index for country A calculated in terms of effective protection rates would be 3. In country B, in contrast, the effective protection rates would be 55% for import-competing activities and zero for exportable activities assuming that exporters are able to get tariff reimbursements on their purchases of inputs. Hence, if the B index is computed using average effective protection rates, country A would be ranked as implicitly taxing exports significantly more heavily than country B, rather than ranked equally as with average nominal protection rates. Therefore, if possible, the B index should be calculated taking into account effective protection rates as well as nominal protection rates in order to fully reflect the anti-export bias of commercial policies in different countries. One practical problem with this approach is that input-output data required for computing effective protection rates are not available for all the countries; and, as a result, calculations of effective protection rates are not always feasible.

3
7b. A second issue is how to calculate the average tariff rate t . If t is calculated using imports as weights, then the average tariff would tend to be underestimated as imports of inputs, capital goods, and final products that are not locally produced, usually taxed at lower rates than locally-produced commodities, would receive a relatively larger weight. Alternatively, t can be computed using domestic output shares to reflect the average protection granted to locally produced goods. Weighting by domestic output shares tends to overestimate the average protective effects of tariff, as both the domestic price and output will be inflated by the effects of import duties. This problem can be corrected by evaluating output at international prices and adjusting the quantity of output using the price elasticity of supply. However, we felt that the difficulty of obtaining the data required for making these adjustments would not be justified by the knowledge gains from such fine-tuning. In our opinion, the uncorrected output-weighted average is still a much better summary indicator of the protective effects of tariffs than the import-weighted average.
8. A third problem is that the calculation of the tariff equivalent of non-tariff restrictions (PR) is not a straightforward task, particularly when the qualities of the locally-produced and imported commodities are not the same (for example, Heineken versus Budweiser beer). Problems in calculating the B index are compounded by the existence of preferential trade and tariff exemptions regimes. Taking averages across customs data pertaining to different customs regimes could lead to misleading indicators of trade policy openness.
9. The IMF’s Trade Restrictiveness Indices. A 1997 IMF study and an update in 2000 evaluate trade regimes in selected African countries. The 1997 study reviews programs supported by IMF arrangements for assessing the ambitiousness of trade reforms. The trade regime for each country is examined at the outset of the program and its overall trade restrictiveness is assessed, based on a 10-point scale, with a rating of 1 indicating an open trade regime and a rating of 10 indicating a highly restrictive regime. The 2000 update evaluates the trade regimes in eastern and southern African countries, using a slightly modified method.
10. The 1997 index of overall trade restrictiveness combines measures of trade restrictiveness of import tariffs and non-tariff barriers. Five ranges are specified for average nominal import tariffs, with the lowest range (0-10%) being the least restrictive and the highest range (25% and above) being the most restrictive (see Table A1). Three categories have been specified for non-tariff barriers, ranging from open to restrictive. These categories are based on the number of sectors covered by non-tariff barriers (whether they cover a few or many sectors of the economy), on their impact on the production process (whether they cover single products or entire stages of production), on the percentage of trade covered by the barriers, and on their restrictiveness (see Table A2).

4
Table A1: IMF 1997 Classification Scheme for Tariff Restrictiveness
Restrictiveness Unweighted Average Tariff Range (t)1
Open 100 <≤ t percent
Relatively Open 1510 <≤ t percent
Moderate 2015 <≤ t percent
Relatively Restrictive 2520 <≤ t percent
Restrictive 25 percent or higher
Table A2: IMF 1997 Classification Scheme for NTB Restrictiveness
NTB Regime
Classification Criteria
Open • NTBs are either absent or minor.
• Less than 1 percent of production or trade is subject to NTBs.
Moderate
• NTBs are significant, covering at least one important sector of the economy (e. g., agriculture or textiles) but not pervasive (e.g., all consumer goods).
• Between 1 and 25 percent of production or trade is subject to NTBs.
Restrictive • Many sectors or entire stages of production (e. g., all consumer goods) are
covered by NTBs.
• More than 25 percent of production or trade is subject to NTBs.
1 Sharer (1998) reports that “[t]he amount of information available on the tariff regime varies considerably
among countries. In many cases, there was enough information to compute an average tariff rate but insufficient information to assess the degree of tariff dispersion or the prevalence of discretionary customs duty exemption. The preferred approach was to use, where possible, and unweighted average based on statutory tariff rates and including any other duties and charges applicable to imports. An average of statutory tariff rates is preferable to an average based on customs duties collected since the latter reflect (often extensive) exemptions. An unweighted average is preferable to a trade-weighted average since items with high tariffs would likely have small trade weights. Other duties and charges should be included because these have the same restrictive effects as tariffs.”

5
11a. The tariff and non-tariff ratings are combined into a 10-point scale by assigning a relative ranking from 1 to 10, representing the estimated overall restrictiveness of the trade regime. The most open import tariff and non-tariff barriers regimes were assigned the number 1, and the most restrictive tariff and non-tariff regimes were assigned the number 10 (see Table A3). In view of data limitations, the study adopts a pragmatic approach and utilizes the unweighted average statutory tariff rate as basis to cla ssify the tariff regime. Other trade variables such as tariff dispersion, export taxes, and customs duty exemptions are not taken into account in the overall index because of data limitations and added complexity.
Table A3: IMF 1997 Classification Scheme for Overall Trade Restrictiveness
Non-Tariff Barriers Tariffs
Open Moderate Restrictive
Open 1 4 7
Relatively Open 2 5 8
Moderate 3 6 9
Relatively Restrictive 4 7 10
Restrictive 5 8 10
11b. The IMF 2000 update takes into consideration import surtaxes and discriminatory domestic indirect taxes (“quasi- tariffs”), as well as export taxes in addition to import tariffs in evaluating the “tariff” regime.2 Also, a new range of 25-35% is added at the high end, to make six tariff bands instead of the five in the 1997 version (see Table A4). Non-tariff barriers also have an additional category, to make four altogether. These categories are based on the share of trade covered by the barriers and on their restrictiveness. Barriers to both imports and exports are taken into account when NTBs are evaluated. The tariff and non-tariff ratings are combined into a 10-point scale, slightly modified from the 1997 original scale. Conceptually, the modifications are an improvement over the 1997 original. However, the matrix that assigns the ratings (Table A4) is somewhat arbitrary: not only are the ratings not cardinal in any way (that is, a regime with 12% average tariff and export tax rate and NTBs that cover 30% of trade (rated “6” by the IMF 2000) is not “twice as restrictive” as a regime with 17% average tariff and export tax rate and absolutely no NTB restrictions (rated “3”)), but also they are not even ordinal in all parts of the matrix (it is not clear if a regime with 10% average tariff and export tax rate and NTBs that affect 2% of trade (rated “4”) is “worse” than a regime with 17% tariff but no NTB restrictions (rated “3” )). In addition, the rating system assigns “10” to all but three of our sample countries (Uganda and South Africa (5), and Cameroon (7)). While it may be justifiable to rate most of our sample countries as “highly restrictive” compared to free trade, we find this particular methodology not terribly useful for evaluating the not so insignificant differences 2 IMF (2000) methodology uses “[w]henever possible, an unweighted average of statutory tariff rates including
other duties and charges.”

6
among trade regimes in SSA countries. The overall ratings according to the two IMF methodologies and the normalized B index are summarized in Table A5 below.
Table A4: IMF 2000 Classification Scheme for Tariff Restrictiveness
Non-Tariff Barriers1
Trade taxes2 Absolutely no restrictions
Few restrictions;
0-20 % trade coverage3
Substantial restrictions;
20-40% trade coverage3
Pervasive restrictions;
> 40% trade coverage3
% 100 <≤ t 1 3 5 7
% 1510 <≤ t 2 4 6 8
% 2015 <≤ t 3 5 7 9
% 2520 <≤ t 4 6 8 10
% 3525 <≤ t 5 7 9 10
% 53 or higher 10 10 10 10
1. Includes restrictions on exports and imports and other NTBs. 2. Includes customs duties and other charges levied exclusively on imports, as well as export taxes. 3. Refers to the share of total trade being affected by NTBs.
Table A5: Summary of Overall Ratings According to the IMF Methodologies and the Normalized B Index
Country IMF 1997 IMF 2000 Normalized B Index1
Uganda 1 5 1 South Africa 2 5 1.0 Cameroon 8 7 1.9 Ghana 2 10 2.2 Mali 7 10 2.7 Senegal 3 10 3.0 Malawi 3 10 3.4 Tanzania 4 10 4.2 Côte d’Ivoire 2 10 4.9 Benin 5 10 5.6 Zimbabwe 7 10 6.3 Mauritius 5 10 7.7 Burkina Faso 10 10 10
1. To be comparable with the IMF indices, the B index is normalized so that the score for the country with the most distorted regime equals 10 and for the least distorted 1.
12. The Notional Import Volume Indicator. Another measure of trade openness is the one employed by B. Narasimhan and L. Pritchett (1997). Instead of quantifying price differentials as does the B index, they rather focus on import volume differentials. They define import

7
restrictiveness as the difference between actual imports and the so-called notional demand for imports. The latter is defined as the equilibrium level of imports given their international prices, import tariffs, the level of income, and the real exchange rate. Then, the difference between actual and the predicted value of imports is attributed to import rationing. The logarithm of the demand for imports (
dM ) is specified as follows:
(2) RERYM d δβα ++=
where Y and RER are the logarithms of GDP and the real exchange rate, respectively
β is the income elasticity of demand for imports ( 0>β ) δ is the real exchange rate elasticity ( )0<δ .
13. The parameters α , β and δ are estimated with time series data, and these values are utilized to calculate the equilibrium values of imports. Sometimes, the values of the parameters β and δ estimated with country-specific data are used to calculate the equilibrium values of imports for other countries for which data are not available and the parameter α is calibrated in order to achieve equality between actual and notional demand for imports in a baseline scenario.
14. The usefulness of this approach in assessing trade policies depends in part on the following issues:
(i) Import demand specification: As demand for imports is an excess demand, the parameter β should not be identified as the income elasticity of demand. For instance, if economic growth is biased against imports (i.e., biased in favor of non-traded services) but β is assumed equal to one, then equation (2) would predict an increase of imports over time but actual imports would decrease leading to the wrong inference that import restrictions have increased through time. Although this problem might not be significant for analyzing short-run episodes, it could lead to the wrong assessment of trade restrictiveness if the analysis covers a longer period of time.
This misspecification of the import function may lead to the wrong inferences if there are exogenous changes in the composition of aggregate expenditure. If, for instance, there is an increase in government expenditure financed, say, by the international donor community, then the resulting increase in imports would not be fully reflected in the volume of imports as predicted by (2). Although import restrictions for the private sector are held constant, it would appear as if they had been relaxed; and
(ii) Relative price variable: in equation (2), the real exchange rate (RER) is used as the relevant relative price and not the domestic price of importable goods relative to exportable or non-traded goods. It is well-known that if a country liberalizes its commercial policies, then both imports and the real exchange rate (measured in domestic currency terms) would increase.3 According to 3 This increase in RER is needed to give expand exports to match the increase in imports and to avoid any
incipient deficit (or increase in the deficit) in the balance of trade. The latter is mainly determined by overall macroeconomic conditions as it is equal to the difference between aggregate expenditure and output under equilibrium in the market for non-traded goods. As the real exchange rate is the relative price of non-traded goods, any incipient disequilibrium in this market would be eliminated by changes in RER.

8
equation (2), an increase in RER would tend to reduce the notional volume of imports and thus to overestimate the extent of trade liberalization.
15. The Sachs and Warner Openness Indicator. Sachs and Warner (1995) characterize trade policies according to five indicators. A closed trade policy is characterized as one for which at least one of the following five conditions holds:
• Non-tariff barriers covering 40% or more of trade. • Average nominal tariff rates of 40% or more. • A black market exchange rate that is depreciated by 20% or more relative to the official
exchange rate, on average, during the 1970s or 1980s. • A socialist economic system. • A state monopoly on major exports.
An open economy is defined as one in which none of the five above conditions holds.
16. The main limitation of this approach is that it dichotomizes different trade regimes into two categories (closed or open regimes) and does not provide for more variety in characterizing trade policy as does the B index. Another problem with this indicator is that a closed trade policy is measured on the basis of black-or-white judgments that may in some case be subjective (why average tariff rates higher than 40%?). Non-tariff barriers are also quantified as an import-weighted average of the customs lines subject to these barriers; this measure does not explicitly take into consideration the severity of the NTBs that are applied.
17. The Heritage Foundation’s Trade Policy Index. Another index measuring trade distortions is calculated by the Heritage Foundation as a component of its overall index of economic freedom. Heritage’s openness sub-index takes into account three factors, namely, the average tariff rate, non-tariff barriers, and corruption in the customs service. What Heritage Foundation uses as “the average tariff rate” appears to be collection rates when this variable is available. When it is not available, information about the overall tariff structure is used to estimate the collection rate. A score is then given based on a country’s “average tariff rate” – the higher the rate, the worse (or higher) the score (Table A6). This index suffers from the same limitations as the B index computed with average nominal tariffs because it does not take into account the impact of the structure of protection granted to different industries. In addition, Heritage Foundation’s index, unlike the B index, does not take into consideration export taxes or subsidies.
18. A country’s score based solely on tariff rates receives an additional point on the scale (representing decreased economic freedom) if non-tariff barriers exist in sufficient quantity. The trade analysis also considers corruption within the customs service. Corruption is included in the index because, even though countries may have lower published tariff rates and no official non-tariff barriers, their customs officials may be corrupt and require bribes to allow products to enter. Or there may be instances in which customs officials steal the goods for themselves, which also constitutes a barrier to trade. Unfortunately, the Heritage data on corruption have not been made publicly available.

9
Table A6: The Heritage Foundation Index’s Trade Policy Grading Scale
Score
Levels of Protectionism
Criteria
1 Very low Average tariff rate of less than 4% and/or very low Non-Tariff Barriers
2 Low Average tariff rate from 5 to 9% and/or low Non-Tariff Barriers
3 Moderate Average tariff rate from 10 to 14% and/or moderate Non-Tariff Barriers
4 High Average tariff rate from 15 to 19% and/or high Non-Tariff Barriers
5 Very high Average tariff rate of 20% or higher and/or very high Non-Tariff Barriers that virtually close the market to imports
19. According to the index calculated in 1997, protection in most of the countries included in the sample of this report was classified as high (Benin, Ghana, Uganda) and very high (Burkina Faso, Côte d’Ivoire, Senegal, Zimbabwe, Cameroon, Malawi, South Africa). On the other hand, Tanzania, Mali and Zambia are classified as countries with moderate or low protection levels.
20. The World Economic Forum’s African Competitiveness Index. In 1998 the World Economic Forum (WEF) started publishing an annual report on the competitiveness of African economies (World Economic Forum, 2000) containing an index of competitiveness developed by Andrew Warner based on the earlier work of Sachs and Warner (1995). This index measures six broad sets of factors affecting competitiveness, that is: openness, government, finance, infrastructure, labor, and institutions. Sub- indices of these six broad factors are constructed in two ways: (a) from publicly available published quantitative data and (b) from survey data collected by the WEF from a representative sample of 1800 firms operating in the countries participating in the survey. Each sub- index is an average of the quantitative data and the survey results and is published separately. The overall competitiveness index is a simple average of the six sub- indexes. It is thus a much broader measure than the other methodologies, taking into account both the conventional border instruments of trade policy considered by the other methodologies and the various wider behind-the-border factors affecting competitiveness.
21. The WEF’s narrower openness sub- index is, however, more directly comparable to the other trade policy indicators discussed above. The survey component of the openness sub- index aggregates the responding firms ratings (perceptions) of nine factors affecting openness: hidden import barriers, import tariffs, foreign exchange availability (two questions), exchange rate misalignment and volatility (three questions), export credit and insurance, and the priority given to exports in government policy. The survey results provide useful information about trade policy as it is actually implemented and firms’ perception of this. Most trade policy analysts, unfortunately, do not themselves have the resources to undertake such surveys independently.

10
22. The quantitative component of the WEF’s openness sub- index is, however, similar to the IMF’s index of trade restrictiveness. Like the IMF’s index, the WEF’s sub- index takes into account two variables – non-tariff barriers and average tariff rates. Each country’s non-tariff barriers (defined to include both import and export restrictions, including licensing requirements and foreign exchange controls) are rated on a scale from 0, most open, to 3, least open. These ratings are based on the author’s calculations using data contained in the IMF’s annual report on “Exchange Arrangements and Exchange Restrictions,” but there is not enough information in the WEF’s competitiveness report to permit other analysts to replicate these ratings. Again as in the IMF’s index, tariffs are assessed using nominal rates, but unlike the IMF, which uses unweighted average tariff rates, the WEF uses collection rates (see paragraph 17 above). The country ratings for non-tariff barriers and the average tariffs are then combined into a single index of trade openness in a way that is not explained in the WEF’s competitiveness report.
23. The Methodology Used in This Study. To permit detailed cross-country comparisons of trade policy practices, an instrument-by- instrument assessment of trade policies is made as explained in the text. The approach adopted for arriving at an overall measure of trade policy openness is largely determined by the availability of data for most of the conventional instruments of trade policies in most of the sample countries and the pros and cons of the various indicators discussed above. When, as in this case, most of the data required for computing the B index are available, the B index is probably the most accurate available single indicator of the restrictiveness of the conventional border instruments of trade policy because it quantifies all of the policies affecting relative prices. An approximation to the B index has thus been used as the summary measure of trade policy in this study.

11
Annex B
A Note on the Data Required for Measuring Trade Reform 1. In order to measure progress in trade reform in sub-Saharan Africa, this study develops a quantitative methodology using data from national and international sources. For the study’s sample group of 13 countries, data were collected to provide an empirical basis for assessing quantitative restrictions, exchange controls, import monopolies, import protection rates, export taxes and monopolies, and exporters’ access to duty free inputs. 2. Most of the data used came from national sources in the sample group countries, and two to three weeks of field work per country were required for collecting the data. National data came primarily from customs departments, ministries of trade-commerce, central banks, and national statistical and accounts offices. Supplementary information was obtained from chambers of commerce, producers’ organizations, and individual enterprises in the sample countries.
3. The following standard international sources were also used for certain data series: the International Financial Statistics of the IMF and the Global Currency Report (New York) for the official and parallel exchange rates, and the IMF’s Annual Report on Exchange Controls and Currency Restrictions for information on these. UNCTAD’S TRAINS database on quantitative restrictions was used for one country (Cameroon) but did not have any usable data for the other sample countries. World Bank and IMF country economic reports were also reviewed for information on the trade policies of the sample countries.
4. This note provides a detailed description of the data that are needed per country in order to facilitate applying the study’s methodology to additional countries not included in the original sample group of thirteen. The data required are discussed below trade policy instrument by policy instrument.
Foreign Exchange Controls
5. The severity of foreign exchange controls is measured in this study by the premium in the parallel market of foreign exchange over the official rate. Data on parallel market exchange rates can be found in the Global Currency Report, which collects and publishes information about parallel exchange rates regularly for most of the countries in the world. Data on official exchange rates comes from the International Financial Statistics, line rf (average nominal exchange rate) of the country pages.
6. In order to interpret the parallel market premium, it is important to understand the nature of a country’s exchange rate regime and its rules and restrictions on foreign exchange transactions. Foreign exchange controls affect both exporters and importers. Controls usually (a) require that all or part of the foreign exchange derived from exports or other sources be surrendered to the central bank in exchange for local currency and (b) provide for allocating the foreign exchange thus obtained for approved imports and other “priority” transactions. Since the demand for

12
foreign exchange at the (overvalued) official exchange rate usually exceeds the amount surrendered to the central bank, foreign exchange rationing is required to prioritize imports of some commodities (for example, basic needs, inputs for certain industries) for which foreign exchange is provided at the official rate. Since central banks usually administers such schemes, they are the primary source of information and data about these schemes, which are also summarized in the IMF’s annual report on currency restriction. Information about the actual functioning of a country’s foreign surrender requirements for exports and its exchange controls on imports can also often be obtained from exporters and importers.
Non-Tariff Barriers 7. Quantitative Import Restrictions. These are defined as measures to prohibit imports of specified products or to limit the volume of these imports. Three possible indicators of the severity of QRs that could be used are (a) the percentage of imports covered by quantitative restrictions; (b) the percentage of production of import-competing activities covered by QRs; and (c) the tariff equivalent of non-tariff barriers. These three indicators are alternative measures of the severity of QRs. In practice, the choice between them depends to a large extent upon data availability. Table B1 gives an example, for Zimbabwe, of the calculation of the percentage of production of import substituting industries covered by QRs. 8. For this study we calculate those of the above indicators for which we could obtain the required data. The only indicator for which comparable data were available for use in cross-country comparisons for the sample was the percentage of imports covered by QRs. The obvious limitation of this measure is that it tends to underestimate the severity of QRs as imports subject to QRs are restrained or even prohibited. Thus, spending resources on obtaining data on the other two indicators may be a good investment when QR’s are important for a particular country.
9. Identifying imports of goods subject to QRs requires information about both formal and informal restrictions. Formal restrictions usually take the form of import quotas and import prohibitions. Informal import restrictions may include seasonal import prohibitions, quality controls that are not applied symmetrically on imports and on similar domestically-produced goods, labeling requirements for imported goods that significantly increase their costs to importers, controls for health reasons that are applied in a non-transparent, discriminatory manner by the authorities, etc.
10. For a few SSA countries, data to identify formal QRs can be found in the Trade Analysis and Information System (TRAINS) of UNCTAD. 4 TRAINS is a comprehensive computerized information system at the HS tariff- line level covering tariff, surcharges, quasi-tariff, and non-tariff measures as well as import flows by origin for more than 100 countries. The data include both the Harmonized System code for imports subject to QRs and the percentage of total import codes covered. In principle, the data cover all non-tariff barriers including import prohibitions and controls for security (weapons, ammunition, etc.), health (medicines, food), and environmental (flowers, food, seeds, etc.) reasons. The protective effect of these types of
4 These data are also available in CD-Rom form from UNCTAD. There is an ongoing joint project between the
World Bank and UNCTAD to improve the access to tariff and non-tariff barriers data for a group of countries.

13
precautionary restrictions is difficult to assess, and they are usually left aside unless the analyst has specific information about their use as informal devices to grant protection to similar domestically produced goods. In this study, TRAINS data are used only for Cameroon as TRAINS data are not available or not reliable for the other sample countries.
11. Other sources for data on QRs are national customs departments, ministries of trade-commerce, and central banks or other agencies administering the QRs in a particular country. Sources for commodity import and production data are the national customs department and the statistical offices, respectively. 5 Information about QRs can also be found in some World Bank reports when Bank staff have collected these data for as part of their economic work on the country concerned. Information on informal QRs can usually be gathered from local private importers, private pre-shipment inspection companies, and local chambers of commerce.
12. Tariff equivalents of non-tariff barriers are usually difficult to calculate because of the data that they require. The data required include domestic producer’s prices of the individual commodities and the CIF prices of comparable imports. Identifying individual products competing with imports subject to quantitative restrictions usually requires a mapping of the HS codes into the product classification of the national accounts system. 6 The Statistical Division of the United Nations provides this mapping from the 6-digit HS classification of imports and 4-digit ISIC categories (International Standard Industrial Classification – versions 2 and 3). The local versions of this mapping that can usually be obtained from the National Accounts Office. Data about domestic producers’ prices of individual commodities are usually available from the local national accounts office.
13. Sometimes, QRs are accompanied by (arbitrary) administrative determination of import values by customs or use of reference prices. In these cases, a distinction is made between the price declared by the importer and the price used by customs to assess tax liabilities. In this situation, one can sometimes use data from the exporting country (FOB price) plus an estimate of the cost of freight and insurance to make reasonable estimates of true import values, but these data should be used with care. In this study, we did not have complete data for all the sample countries that imposed QRs; and, for some countries where only partial information was available, we do not have data for all the commodities protected by QRs. Only for four commodities for which we were able to collect the required data (sugar in Côte d’Ivoire, wheat flour, vegetable oils and sugar in Burkina Faso), are we able to make sample calculations of the tariff equivalents of non-tariff barriers and use these in the calculations of nominal and effective protection rates.
14. Import Monopolies. Ideally, the analytical treatment used in measuring the severity of quantitative import restrictions should also be used for import monopolies. That is, the coverage of imports or of the production of import-competing domestic activities should be the measure of the coverage of import monopolies whenever the required data are available. For assessing the impact of import monopolies, we use only qualitative scores for the countries without and with import monopolies because of the lack of quantitative data on the effects of these monopolies on
5 See the section on tariff barriers below.
6 This mapping is also needed in the calculation of the percentage of local production affected by QRs.

14
domestic prices. The sources of our data are World Bank reports that, in turn, are based on information collected by Bank staff working on the sample countries.
15. The above indicators of non-tariff barriers (quantitative restrictions and import monopolies) are combined by estimating their combined coverage of imports or of the value of production of import-competing activities. In the case of Cameroon, since no data were available on the value of domestic production, we use import coverage data. In the case of Benin, the available import data do not include imports of petroleum products. In this case, we assume that the percentage of imports covered by QRs was equal to that in Cameroon where the situation appeared broadly similar.
Table B1: Zimbabwe – Estimation of Percentage of Manufacturing Production Subject to NTBs
Manufacturing ISIC Code Production NTBs
applied? Type of Industry
Meat and by-products 31111-8 447,624 Yes Ici Dairy products 31121-9 175,111 Yes Ici Canned, preserved & bottled fruits & vegetables
31131 28,185 Ici
Canned, frozen, dried & other preserved & processed fish
31141 3,312 Ici
Veg. Oil and cottonseed cake 31151-2 167,003 Ici Grain mill products 31161-9 339,983 Ici Bakery products 31171/9 155,265 Ici Sugar and by products 31181-9 103,116 Yes Ici Sweets, Cocoa, chocolates 31191/2 33,401 Ici Tea and Coffee 31211/2 31,556 Ici All other food products 31219 35,049 Ici Sprits- distilled, rectified and blended- potable 31311 14,397 Ici Wine, cider etc 31321 6,045 Ici Malt, Beer (opaque & clear) 31331-3 171,488 Ici Other non- alcoholic drinks 31341/2 79,670 Ici Packing & grading of tobacco leaf for factory 31411 436,145 Exportable Cigarettes, cigars & smoking tobacco 31421 40,839 Ici Prod. of spin., weave & fin. 32111-9 569,360 Ici Knitwear and products 32131/2/9 33,120 Ici Carpets and floor rugs, except those of cork, rubber or plastic
32141 6,633 Ici
Rope, cable, cordage, twine, net related products (other than those of metal)
32151 9,820 Ici
Other textiles 32191-9 35,543 Ici Clothing 32201-9 257,788 Ici Leather, and by-products 32301-9 61,918 Ici Footwear (including miners' boots ) of all materials
32401 130,407 Ici
Wood and wood products 33101-9 109,409 Ici

15
Manufacturing ISIC Code Production NTBs
applied? Type of Industry
Furniture and fixtures including upholstered furniture
33201 75,291 Ici
Pulp, paper and paper board 34111,34191/9 181,269 Ici Published and Printed products 34201/9 130,613 Ici Basic Chemicals 35111/9,35121/2 311,061 Ici Synthetic rubber, resins, manmade fibers 35131/9 5,124 Ici Paints, varnishes, lacquers, stins etc; thinners, paint strippers etc
35211 46,948 Ici
Medical & pharmaceutical products for human or veterinary use
35221 57,818 Ici
Soap, deterg., perf. & cosmetics 35231/2 153,937 Ici Other chemical products 35291-9 50,820 Ici Petroleum and products 35301-3 289 Ici Products of petroleum & coal 35401/9 11,896 Ici Rubber products 35501-9 93,258 Ici Plastic products 35601-9 158,630 Ici Pottery, china and earthenware products 36101 4,365 Ici Glass products 36201-9 22,571 Ici Structural clay products 36911-9 34,245 Ici Cement, clinker, lime, plaster 36921-3 57,141 Ici Non-metallic mineral products 36991-9 80,411 Ici Iron and steel products 37101-9 660,314 Ici Non-ferrous metals & their alloys 37201-9 27,433 Ici Fabricated metal products 38101-9,38201/9 402,347 Ici Radio, televIcion & comm. eq. 38321-9 25,246 Ici Electr. machinery, apparatus, app. 38391-9 125,835 Ici Railroad equipment 38421-9 16,831 Ici Motor vehicles, spare and parts 38431-6 139,884 Ici Motor cycles & Bicycles 38442-3 5,221 Ici Aircraft, equipment and parts 38451 0 Ici All other transport equipment 38491-9 3,021 Ici Prof. Sc. eq, watches, phot. opt. eq. 38501-3 4,259 Ici All other manufactured goods 39001-9 51,647 Ici
Value of Ici manufacturing production 5,983,767 % of Ici manufacturing under NTBs 12.1%
Source: Ministry of Commerce Notes: ICI=Import-Competing Industries

16
Discrimination Against Imports in Domestic Taxation 16. In addition to employing non-tariff barriers to imports, countries may protect domestic producers against imports through the design or implementation of their indirect taxes. To assess the importance of this type of barrier, data were collected on the discrimination against imports through domestic indirect taxes – that is, excise and general sales or value added taxes. The main sources of these data are the national customs directorates of the sample countries.
17. The degree of discrimination against imports is calculated as the difference between the sales, excise, or value added tax rates applied on imports and those on the local production. That is,
( )( ) 11
1−
+
+=
lj
mjdj t
tt
where tdj is the discrimination rate against imports of good j
tmj is the sales, excise, or value added tax rate applied on imports of good j tlj is the sales, excise, or value added tax rate applied on local production of j.
Domestic taxes are applied to duty- inclusive price of imports. 18. Table B2 gives an example of calculating the effect of discriminatory domestic indirect taxes on imports. For example, the NPTR on Margarine is 43.52. This is arrived at by multiplying one plus 0.37 (the MFN tariff rate) by one plus 0.10 (the sales tax rate on imports) divided by one plus 0.05 (the sales tax on domestic margarine) minus 1.
Table B2: Example of Treatment of Discrimination against Imports in Domestic Indirect Taxation in Computing Nominal Protection Tax Rates (%)
Commodity Tariff Rate
(MFN)
Excise tax rate on domestic
goods
Excise tax rate
on imports
Sales tax on domestic
goods
Sales tax on imports
Nominal Protection Tax Rate
Yogurt 40.00 - - 5.00 5.00 40.00
Margarine 37.00 - - 5.00 10.00 43.52
Cooking Oils 25.00 - 5.00 5.00 5.00 31.25
Wheat Flour 22.13 - - - 5.00 28.24
Cigarettes 40.00 40.00 40.00 - - 40.00
Bed sheets 44.61 - 30.00 5.00 5.00 87.99
Blankets 40.00 - 30.00 5.00 5.00 82.00
Tires 40.00 10.00 25.00 5.00 15.00 70.43
Inner Tubes for Tires 41.20 10.00 10.00 5.00 5.00 41.20

17
Tariff Regimes 19. As tariff regimes are quite complex policy instruments, a number of different summary measures were used for assessing them: average import tariffs, the standard deviation of tariffs, nominal and effective protection rates, tariff escalation, tariff collection rates, and exemption rates. These measures and the data required for computing them are discussed in turn in the following sub-paragraphs. 20. Average Import Tariffs. Because of the multiplicity of tariff rates in most countries and the widespread granting of tariff exemptions, average import tariffs are often used as a summary indicator for assessing tariff regimes. Various measures of average import tariff rates are presented in Table 5 of the main text. The data for computing these averages were collected from national customs and statistical offices and covered all imports and tariff revenue of the countries (sometimes customs offices do not collect data about imports of petroleum products, and these must be then obtained from other national sources).
21. The data are typically cla ssified by customs offices according to the 8 digit categories of the Harmonized System (HS) nomenclature and by import regime.7 The different types import regimes are typically: (i) imports subject to the MFN tariff rates; (ii) imports that are subject to MFN rates but are granted exemptions from or reductions of duties because of special regimes such as investment promotion; (iii) imports by the government; (iv) imports for externally financed investment projects; (v) imports by embassies and non-governmental organizations; (vi) imports subject to temporary admission regime for re-export after processing; (vii) temporary admission of imports for re-export without further processing; (viii) imports by firms operating under export processing zone arrangements; (ix) any other ad-hoc exemption regime; and (x) imports under preferential trade agreements. 22. To determine the average import tariff on dutiable imports, we select only those imports from categories (i)-(x) on which standard MFN tariffs can potentially be collected and which would have an impact on the effective protection granted to import-competing activities. These categories vary somewhat from country to country. Usually, imports by embassies, by non-governmental organizations (NGOs), and for re-export without further processing are excluded from dutiable imports (that is, they are “non-dutiable” in our terminology) in the calculations of average tariffs. The definition of dutiable imports include imports in categories (i), (ii), (ix), and (x). The definition of dutied imports is limited just to those in categories (i) and (x) (see paragraph 31-32 for the treatment of imports under PTA regimes).
7 The customs data in Senegal (1996) and Mali (1995) were in HS 10 digit level, with the last two digit used to indicate
goods imported as inputs even though they are normally considered consumer goods (such as beds for hotels) and vice versa (such as some soap products). As such special cases represented a very small fraction of the total tariff lines, we treat a consumer good imported as an input (typically taxed at a lower rate) as if it were just another consumer good and vice versa. This would lead to a slight underestimation (overestimation) of the protection rate on consumer goods (inputs).

18
Summary of Import Classification
Total imports = non-dutiable imports + dutiable imports
where non-dutiable typically includes imports by the government (iii), externally financed projects (iv), embassies and NGOs (v), as well as various forms of tariff suspension (vi and vii) including imports for export processing zones (viii).
Dutiable imports = dutied imports + exemptions
where exemptions include ad hoc reduction or waiver of duties (ix) as well as special treatment for investment promotion (ii).
23. The computation of meaningful average import tariffs is complicated by duties other than ad valorem tariffs, such as administrative valuation of imports or the use of reference prices, and preferential trade agreements as well as by the various types of exemptions discussed above. The analytical complexities created by these practices are dealt with as explained below.
24. Exemptions. the appropriate treatment of tariff exemptions in computing average import tariff is a rather complicated question. We treat exemptions granted for imports of consumer goods as rents to the beneficia ries which do not have a significant effect on domestic market price of the good and, therefore, on resource allocation across activities as long as the same good was also imported at the statutory tariff rates: if some share of the imports pay the statutory duty while others enter without paying, the rate applied to the marginal import is the full statutory rate, which, in turn determines the domestic market price. Hence, the tariff rates under the exemptions schemes are used in computing the average for consumer goods only if the same commodities were not imported at the statutory tariff rates.
25. In contrast, exemptions granted to firms for imported inputs and capital goods are, in general, aimed at granting additional effective protection to import-competing activities. Often such exemptions are granted to firms through investment codes. They are typically granted for imports of capital goods, spare parts, and inputs for a number of years and are designed to increase the profitability of domestic production. Consequently, these exemptions are taken into account in the calculation of average import tariff rates on inputs and capital goods.8 Such discretionary exemptions create, in fact, a two-tier price system by which firms receiving the discretionary exemptions can benefit from lower prices on their imported inputs vis-à-vis excluded firms. Table B3 gives an example of the calculation of the average tariff rates on consumer and intermediate goods.
8
The classification of imports under investment codes is made by matching HS codes with those of the Broad Economic Classification (BEC) of the United Nations. Some of these imports can also be classified as consumer goods by BEC (for instance, passenger cars or beverages for hotels). In these cases, they can be reclassified as inputs or capital goods as long as they are imported by firms operating under investment codes. The HS-BEC mapping is available from the World Bank. Jerzy Rozanski (World Bank) should have the latest version of the mapping between HS codes and those of BEC and ISIC versions 2 and 3.
19
26. Exemptions may also include special regimes for certain firms and/or individuals.9 In these cases, we follow the above procedure regarding the treatment of consumer goods and inputs and capital goods. That is, consumer goods imported under exemption regimes (non-Investment Code exemptions) that were also imported under MFN tariff rates are assigned the MFN rate; imports of consumer goods that were imported only under these special exemption regimes are assigned the tariff rate of these special regimes. Exempt intermediate and capital goods are regarded as granting additional effective protection to firms benefiting from them, and import-weighted average of the MFN and exempt (reduced) rates are used to calculate the average tariffs on intermediate and capital goods. 27. Types of Duties. Import duties often include statistical taxes and import surtaxes as well as MFN tariffs. MFN tariffs themselves may include not only ad-valorem rates but also specific duties. Data on import volumes as well as import values are required for taking into account specific duties in computing average tariffs. The description of the units in which quantities imported are reported is usually found in the official publication containing the statutory rates.
28. Import Valuation. The valuation of imports may be based on the value declared by the importer or, in some cases, by their administrative valuation by customs officials. In addition, some countries impose reference prices for certain imports (usually ones that compete with local production), and import duty liabilities are calculated using these reference prices.
29. Reference prices are defined as minimum prices decreed by the authorities of the importing country in order to protect local producers against less expensive foreign goods. Information about reference prices and the commodities subject to them can usually be obtained from the ministry of trade or customs department that is responsible for administering these schemes. Imports subject to reference prices can be identified by their 8 digit HS codes. The tariff equivalent of these reference prices can be determined when there is unit value data from the exporting country or the value declared by the importer is available and reliable. If the commodities subject to reference prices are homogenous (agricultural commodities, for instance), then it may be feasible to obtain comparable international price data. For this study, the tariff equivalent of reference prices for refined sugar in Côte d’Ivoire and Senegal are determined using price data obtained from agricultural experts in the World Bank’s country offices.
30. An additional problem resulting from administrative valuation of imports by customs officials and reference prices is differentiating between protection of import-competing activities and legitimate customs intervention to avoid under invoicing of imports. Sometimes, governments explicitly state that the purpose of reference prices is to grant protection to local production, but reference prices may not always have significant protective effects. Matching the HS lines subject to reference prices with data on locally produced commodities can be helpful in identifying the possible use of these prices as protective devices. Price data from private pre-shipment companies can also be very helpful as these companies maintain up-to-date information about international prices.
9 For instance, the regime X990 in Côte d’Ivoire grants, in a non-transparent manner, partial or total tariff
exemptions to imports that can be classified as both inputs and consumer goods.

20
31. Preferential Trade Agreements. The effect of preferential trade agreements on average tariffs depends upon which countries are supplying the commodities concerned. Under the assumption of homogeneous goods, there would be only one price for a particular good, and the country that is the marginal supplier of the good would determine its price. If a good is only imported from partner countries in a preferential trade arrangement, then the appropriate tariff rate to use in calculating the average would be that of the preferential agreement because the marginal import will have paid the preferential tariff &sc rate. If, on the other hand, a good is imported both from a member of the PTA and from the rest of the world, then the tariff applied on the imports from the rest of the world would be the relevant one for determining the domestic price of the commodity and thus for using in computing the average tariff. In practice, there was only a negligible amount of imports under the PTA regimes for our sample countries. For this reason, we do not distinguish the impact of preferential trade policies on the domestic price between consumer and intermediate goods, although in principle, exemptions and imports under PTA regime should be treated as discussed in paragraphs 24-26. 32. In calculating average tariffs in this study, we filter the customs data in order to determine which imports came only from partner countries and which also came from the rest of the world. We first organize customs data in such a way that for each HS line one can see if imports come from PTA and non-PTA (that is, MFN) countries as illustrated by Table B3. The rows of this table show HS lines, and the columns show PTA and non-PTA imports, and customs revenues collected from these imports. For each tariff line, if there are any imports from non-PTA countries, we calculate the “average tariff” by applying the non-preferential tariff rate to all imports of this particular HS line. If imports are exclusively from PTA partners, we use the tariff under the PTA regime in computing the average as shown below:

21
Table B3: Example of Treatment of Exemptions in Computing Average Tariffs
HS category BEC
Category Customs regimea
CIF value of imports
Tariff revenues
Adjusted “revenues b”
Applied tariff rate
“Average tariff rate”
30211000 cg 12742 2936 3186 0.25
of which MFN 11742 2936 0.25
PTA 1000 0 0
30233000 cg 10868175 0 0 0
of which Exempt 10868175 0 0
30235100 cg 5000 0 0 0
of which PTA 5000 0 0
30239000 cg 7448730 1392166 1862182 0.25
of which MFN 5568664 1392166 0.25
Exempt 1880066 0 0
40210000 ig 970936253 149005702 149005702 0.15
of which MFN 595515594 149000000 0.25
Exempt 47524 5702 0.12
Exempt 375373135 0 0
40231000 ig 51056272 11330000 12238800 0.24
of which MFN 45320000 11330000 0.25
Exempt 2101072 0 0
PTA 3635200 0 0
40330000 ig 46500 0 0 0
of which PTA 46500 0 0
a In this example, imports are classified by economic use (BEC category) and by customs regime. Under our assumptions that exemptions
for imports of consumer goods grant rents to importers, if a consumer good is imported under both the MFN regime and PTA and/or exemption regimes (or only under the MFN regime), the tariff rate that will be reflected in domestic price is the MFN rate. The relevant tariff rates on goods imported only under PTA and/or exemption regimes are the reduced or exemption rate. Exemptions on imports of intermediate goods, on the other hand, are regarded as granting additional effective protection to domestically produced goods. As such, the relevant tariff rate on intermediate goods imported under exemption regimes are the actual applied tariff rate (revenue/cif import value). Intermediate goods imported under PTA regime are assumed to grant rents on importers (that is, the relevant tariff rate is the MFN rate) if the same good is also imported under the MFN regime. If the good is imported only under the PTA regime, the relevant rate is the PTA rate (in this example “0”).
b Adjusted “revenues” are hypothetical value that includes both the actual tariff revenues and rents accruing to privileged importers.

22
34. Dispersion of Tariffs. The measure of dispersion of tariff rates used in this study is the standard deviation of the tariff rates on dutiable imports. The coefficient of variation, another measure of dispersion preferred by some researchers, can easily be calculated as the ratio of the standard deviation to their arithmetic mean. 35. Nominal Protection Tax Rate. The nominal protection tax rate (NPTR) is defined in this study as all duties (including “quasi-tariffs”), expressed as a percentage, imposed on products with domestic production as it enters a country. The objective of this indicator of trade restrictiveness is to provide a summary measure of the degree of protection on output prices granted to local import-competing activities by the various instruments of trade policy. For this study overall nominal protection tax rates for individual goods are calculated by taking into account, to the extent possible, all the various types of import tariffs and surcharges, discriminatory domestic indirect taxes, and reference prices but not tariff equivalent rates of NTBs. 36. Choosing an appropriate weighting scheme for computing a meaningful average nominal protection tax rate is as tricky an analytical problem as computing such an average for tariff rates themselves. As is well known, import-weighted average tariffs are biased downward because imports that compete with domestically produced goods tend to be reduced by protection. For this reason, unweighted average NPTRs are often used and are reported in this study. However, an unweighted average of NPTRs treats important (or potentially important) and minor imports equally. Hence, output-weighted average nominal protection tax rates are computed and reported as an alternative measure whenever available. Unfortunately, these tend to be biased upward because the shares of local import-competing activities in total value added are inflated by protection. 10
37. For all of the sample countries, we obtained a list of goods that were produced domestically. However, classifying these into import-competing goods or exportable is not always easy. First, domestically produced goods are identified, and imports and exports of them are estimated using the correspondence between the International Standard Industrial Classification (ISIC) and HS categories. Goods for which a country was a net importer are then classified as import-competing goods. Some goods that were exported to other member countries under preferential trade agreements are also considered as import-competing activities at the regional level as they were protected from imports from non-PTA countries. In a free trade area where a partner country (or countries) has a higher tariff on a product than the home country, the home country producing such goods may find it to its advantage to produce for export to other PTA members and then to import the same product for its domestic market from non-PTA countries. In these circumstances, we use the tariffs applied on imports from non-PTA countries in computing the home country’s NPTRs. Goods that were exported both to PTA and non-PTA countries are classified as true exportable. 38. The most common source of data on locally produced goods is the national accounts department of the local statistical office. In all the cases, we were able to identify the activities
10 We do not have import-price elasticities to use as an alternative in weighting nominal protection tax rates.
23
that could be regarded as import-competing. However, we were able to obtain data on the value of the production of import-competing products for only six of the sample countries (Côte d’Ivoire, Benin, Burkina Faso, Mali, Senegal, and South Africa11). For the rest of the sample countries, we were able to identify the commodities that were locally produced, but we could not weight NPTRs on local products by their shares in the total production of the import-competing sector because production value data were not available. 39. Effective Protection Rates. The effective protection rate (EPR) is another very useful analytical concept. It measures the protection afforded by an import restriction expressed as a percentage of the value added in producing the item concerned. The (well-known) formula for calculating the effective protection rate ( e
it ) granted to the value-added of economic activities used in the calculations is:
−
−
=
∑
∑
=
=
n
jij
j
n
jiji
ei
a
tat
t
1
1
1
where ti is the nominal protection rate to activity i; tj is the nominal protection rate to input j; aij is the share of the cost of tradable input j in total costs of the final product i. As we did not have the data for the individual aij’s for the sample countries, we calculate indicative rates of effective
protection using an assumption that the sum ∑j
ja is identical for all countries, and that there are
only two types of tradable good production, namely, agriculture and manufacturing. The sum (the share of tradable inputs in production) is estimated from input-output data for the countries for which these data were available.12 For computing indicative EPRs for import-competing agriculture and manufacturing, we assume that representative indicative sums of the aij are (0.12) and (0.60), respectively. We use NPR (NPTR plus NTB) for ti, unweighted-average tariff on dutiable intermediate goods for manufacturing tj, tariffs on fertilizer (weight 0.04) and non-fertilizer agricultural inputs (weight 0.08) for agricultural tj. 40. An important point to bear in mind when interpreting effective protection rates is that they can be very high if value added to the imported commodity is a small percentage. Effective rates of protection also tend to be higher than nominal rates because most countries levy higher tariffs on final products than on inputs (tariff escalation is discussed further below).
41. Escalation of Import Tariffs. Table 7b in the main text gives data on import duties according to the BEC classification of imports (consumer, intermediate, and capital goods) as a rough indicator of tariff escalation for import-competing activities. The classification of imports 11 The Statistical Office of South Africa has a website with the latest manufacturing economic census (1989)
through which we were able to identify the locally produced goods that could be regarded as import-competing activities with the help of customs import and export data.
12 For our sample group, some input-output data were available for Côte d’Ivoire, Senegal, Benin, Burkina Faso, Uganda, and South Africa.

24
and locally-produced goods as consumer, intermediate, and capital goods is made using the correspondence among BEC, ISIC, and HS categories.13 Nominal protection tax rates are calculated in the way described above. As noted previously, data on the value of production of individual import-competing goods were only available for six of the sample countries, and thus for the sample as a whole we have to use unweighted averages of import tariffs and of nominal protection tax rates for locally produced goods.
42. Tariff Collection Rates on Dutiable Imports. Table 9 in the main text gives tariff collection rates on dutiable imports for the sample countries. These rates are calculated as a ratio of total import tariff revenues to dutiable imports (categories (i), (ii), (ix) and (x) in paragraphs 21-22 above). . 43. Import-weighted Average Tariff &sc Rates on Dutiable Imports. Table 9 also gives import-weighted average tariff and surcharge rates on dutiable imports. We use the calculation method detailed above to derive this indicator, which attempts to determine the tariff and surcharge rate on the marginal imports. The tariff rate of each tariff line (HS 8 digit) is then weighted by dutiable imports to arrive at the import-weighted average.
44. Exempted Imports as a Percent of Dutiable Imports. The differences between the collection and import-weighted average tariff &sc rates result from the granting of partial or complete exemptions to imports (categories (ii) and (ix) above). Exemptions in percentage of dutiable imports are reported in Table 9.
Export Policies 45. Export policies are evaluated using the data that measure the impact of export taxes and monopolies, and those that assess the access of exporters to duty-free inputs. As in the case with imports, most of the information had to be obtained in the field from national sources. 46. Export Taxes and Monopolies. The analytical problems involved in determining an appropriate method for computing average export taxes (Table 13 in the main text) are similar to those discussed earlier concerning average import tariffs. Unweighted averages of export taxes assign equal importance to major and minor exportable and thus do not take into account the relative importance of the taxes on different products. In contrast, export-weighted averages of export tax rates do take into account the relative importance of the different exportable but they also reflect the export reducing effects of export taxation and can thus underestimate the importance of export taxes. Hence, in assessing the severity of export taxation, this study uses both unweighted and export-weighted averages of tax rates on individual exportable commodities. In cases where significant quantities of exportable are consumed domestically as well as exported, output weighted averages of export taxes would also be useful. However, we do not have data about the value of production of exportable and so cannot calculate output weighted average export taxes.
13 The BEC leaves it up to the user to determine if certain imports are consumer or capital goods. For instance,
passenger cars can be regarded as durable consumer goods for a country but a capital good in another country (passenger cars for the tourism industry).

25
47. Sources of data on export taxes and monopolies include IMF Article IV consultation reports, World Bank country economic reports, and national ministries of commerce. In the case of cotton export monopoly-monopsonies in Benin, Côte d’Ivoire, Cameroon, Burkina Faso, Mali and Senegal, the information about the implicit taxation of cotton from a World Bank study (Pursell, 1998) is also used. 48. Exporter’s Access to Duty-free Inputs. Four types of schemes were in use in the sample countries to offset the direct impact of import tariffs and domestic indirect taxes on inputs on the production costs of exportable goods: that is, tariff suspension (temporary admission) schemes, tariff drawbacks (rebates), export processing zones, and tax credits for value-added tax on inputs. Information describing these schemes was obtained from the government agencies concerned. We were able to obtain only qualitative information on how well these schemes actually function in practice. The sources of these qualitative data were private chambers of commerce and exporting firms.
26
Annex C
Protectionist NTBs in Use in the Sample Countries
1. As discussed in the text (Table 2), five of the sample countries employed various types of NTBs for protectionist purposes. Burkina Faso (1997) imposed quality controls on imported goods competing with local production such as vegetable oils, wheat flour, powdered milk, yogurt, rice, refined sugar, electrical batteries, tires, and inner tubes for tires although it had no formal quantitative restrictions. These quality controls were not symmetrically applied to the locally produced goods. The proportion of the value of domestically produced import-competing manufactured goods competing covered by these restrictions is estimated to be 23 percent. According to the available data, these controls result in substantial increase in nominal protection rates compared to statutory import tariff rates. For example, in the case of refined cotton oil, the tariff equivalent of quantitative restrictions is estimated to be 33 percent compared to the MFN tariff rate of 15 percent. Similarly, local production of wheat flour is protected at a rate equivalent of 57 percent by quality controls compared to the MFN tariff rate of 22 percent. 2. Cameroon (1995) applied quantitative restrictions on imports of wheat flour, meats and fishery products, edible oils, sugar refining, soap, insecticides, medicines and guns. The list of products affected is similar in its coverage of import- competing activities to that in Burkina Faso (1997) and the percentage of import-competing production affected (21 percent) is also close to that estimated for Burkina Faso (23 percent). 3. In Zimbabwe (1997), non-tariff barriers affected about 11 percent of the value of import-competing output. Goods under these barriers included animal oils, meats, live cattle, dairy products and ice cream, fruits, honey, corn and corn meal, and sugar. Zimbabwe’s monopoly on imports of corn was estimated to affect about 30 percent of the output of import- competing agriculture and 3 percent of output of all import-competing activities. 4. Mali (1997) imposed quantitative restraints on imports of cigarettes, tobacco, and matches. These restraints affected about an estimated 15 percent of the value of production of import-competing manufacturing activities. 5. Benin (1996) required permits for imports of portland cement competing with local production. Portland cement accounted for 12 percent of import-competing output, and the impact of this NTB on its price was about 10 percent. The NTB makes the nominal protection rate of portland cement twice as high as its MFN tariff rate of 10 percent.

27
Annex D: The Tariff Regimes of the Sample Countries
Table D1: Tariff Regimes – Summary of Policies
Import Tariff Exemptions as % of Imports by Useb
Country
Year
Import Tariff Rates
(in %)
Import Surtaxesa
(in %) CG IG KG Total
Discrimination Against Imports in Domestic Indirect Taxesa
(in %)
Benin 1996 Fiscal duties: 0-5-10-15-20 A 1% surtax is applied on imports from non preferential regional trade agreements .. 18.9 9.8 14.1 none
Côte d’Ivoire 1996
Customs duties: 0-5 Fiscal duties: 0-5-10-15-25-30 Statistical tax: 5
Meats 14.3 (37.1) Tomato Preserves 5.6 (33.2) Vegetable Oils 9.6 (41.7) Cigarettes 236.2 (273.8) Cigars 14.8 (52.5) Smoking Tobacco 56.1 (93.7)
0.15 10.2 28.3 14.6 Beer 3.2 (40.0) Soft Drinks 10.0 (40.3) Fruit Juices 10.9 (38.7)
Burkina Faso 1996 Customs duty: 5 Fiscal duties: 0-4-26 Statist ical Tax: 4
Special Intervention Tax (TSI) of 2.0% applied over all dutiable imports .. 24.6 6.0 15.0 Cigarettes 70.3 (119.0)
Mali 1997 Customs duties: 0-5 Fiscal duties: 0-10-25 Statistical tax: 0-5
None .. 18.9 24.6 14.1 none
Senegal 1996 Fiscal Duties: 0-10-20-30-50 Customs Duties: 0-10 Statistical Tax: 0-5
A 20% surcharge is applied on imports of several luxury goods. A reference price is applied on imports of refined sugar.
- 18.6 48.9 20.1 Cigarettes 13.0 (75.0)
Cameroon 1996 0-5-10-20-30
Wheat Flour: 19.3 (50.0) Portland Cement: 14.2 (35.4) Detergents: 15.4 (46.6) Maize Meal: 29.6 (40.7)
.. 22.2 34.9 19.1 none

28
Import Tariff Exemptions as % of Imports by Useb
Country
Year
Import Tariff Rates
(in %)
Import Surtaxesa
(in %) CG IG KG Total
Discrimination Against Imports in Domestic Indirect Taxesa
(in %)
Uganda 1997 0-5-10-20-30-60 None 0.2 23.5 31.4 21.2 none
Tanzania 1996 Fiscal duties: 5-20-25-30-40-50 None .. 15.6 41.7 21.8
Margarine 6.9 (43.9) Vegetable Oils 5.9 (30.9) Wheat Flour 5.8 (27.9) Sugar 6.1 (36.5) Iron Sheets 6.5 (36.5) Tires 24.8 (65.0) Inner Tubes 24.8 (66.0) Bicycles 6.5 (36.5) Beerd 42.8 Whisky 6.8 Blankets 42.0 Bed Sheets 42.0 Cement 16.8
Mauritius 1996 Customs duties: 0-5-10-15-20-30-40-55-80
A 20% surcharge is applied on imports from several countries including Japan, South Korea and Switzerland.
- 18.8 21.6 13.2
Beer 124.3 (204.3) Wine 36.0 (116.0) Alcohol 360.0 (440.0) Cigarettes 113.0 (193.0) Cigars 461.9 (560.0)
Malawi 1995 Customs duties: 0-5-7.5-10-15-20-25-30-35-40-45 none - 16.6 34.1 18.8 none
South Africa 1996
Customs duties are in 45 bands ranging from 0 to 57.5. Specific and a combination of specific and ad-valorem duties apply on several items.
none - 6.3 1.3 4.2 Mineral Waters Lemonade

29
Import Tariff Exemptions as % of Imports by Useb
Country
Year
Import Tariff Rates
(in %)
Import Surtaxesa
(in %) CG IG KG Total
Discrimination Against Imports in Domestic Indirect Taxesa
(in %)
Zimbabwe 1997 0-5-10-15-20-25-30-35-40-45-50-55-60-65-70-75-80-85-90-95-100
Mostly on consumer goods 10.0% Specific duties on Textiles (consumer goods) 50.9 (160.9)
.. 13.1 30.2 17.4 Sales tax with no fiscal credit for services
Ghana 1996
Fiscal duties: 0-10-25 Specific duties on: milk, wheat flour, vegetable oils, sugar confectionery, fruit juices, sauces, soft drinks, beer, spirits, cigarettes, soaps, fabrics, worn clothing, iron and steel bars and rods, and petroleum products.
A 17.5% surcharge is applied mostly on imports of consumer goods 5.3c 58.1 73.8 52.3 none
Mean 1.9 20.4 27.3 18.9
Median 0.2 18.8 30.2 17.4
Source: Data obtained by Bank staff from the countries in the study.
Notes: (a) The numbers in parenthesis are NPTR (tariff plus the surcharges and any differential excise taxation). (b) The exemption regimes are handled as explained in Annex B. (c) Includes exemptions granted by the Ministry of Finance for goods that are not imported under statutory rates. (d) No information is available to calculate NPTR independently.

30
Table D2: Import Tariff Barriers – Average Tariffs, Collection Rates, and NPTRs
Unweighted average
Import-weighted average
Standard deviation
Unweighted average
Output-weighted average
Standard deviation
Benin 1996 1.1 5.1 10.1 7.2 7.0 14.2 14.9 4.6
Uganda 1997 0.8 8.0 7.1 9.3 9.6 25.4 na 10.3
South Africa 1996 0.8 4.9 12.2 5.2 15.2 27.3 32.9 22.1
Ghana 1996 1.1 6.9 11.2 7.3 15.6 29.7 na 22.7
Mali (a) 1997 2.2 8.8 20.2 12.9 13.2 30.2 31.0 9.7
Cameroon 1996 1.3 9.6 11.5 10.5 10.8 30.6 na 4.9
Burkina Faso 1996 3.3 14.8 28.9 19.6 11.6 32.9 na 16.1
Côte d’Ivoire 1996 1.8 9.4 14.7 14.5 13.6 34.7 44.4 30.6
Malawi 1995 3.0 8.2 16.3 10.9 35.1 38.0 na 18.2
Zimbabwe 1997 6.1 7.1 23.8 16.2 42.6 40.8 na 24.8
Tanzania 1996 2.0 8.0 21.6 13.3 23.9 42.9 na 25.8
Senegal 1996 4.2 14.2 19.5 14.6 17.4 46.6 44.9 18.9
Mauritius Domestic Industry 1996 6.2 16.2 26.4 20.3 30.4 65.4 na 80.1
Mean 2.6 9.3 17.2 12.4 18.9 35.3 33.6 22.2
Median 2.0 8.2 16.3 12.9 15.2 32.9 32.9 18.9
Source: Authors’ calculations based on data obtained from the countries in the study.
Notes: (a) NPTR calculated on manufacturing only because agricultural sector is non-traded.
Country YearTariff &sc revenues as % of GDP
Average tariff &sc rates on dutiable imports
Nominal Protection Tax Rates on import competing activities
Collection rates on all
imports
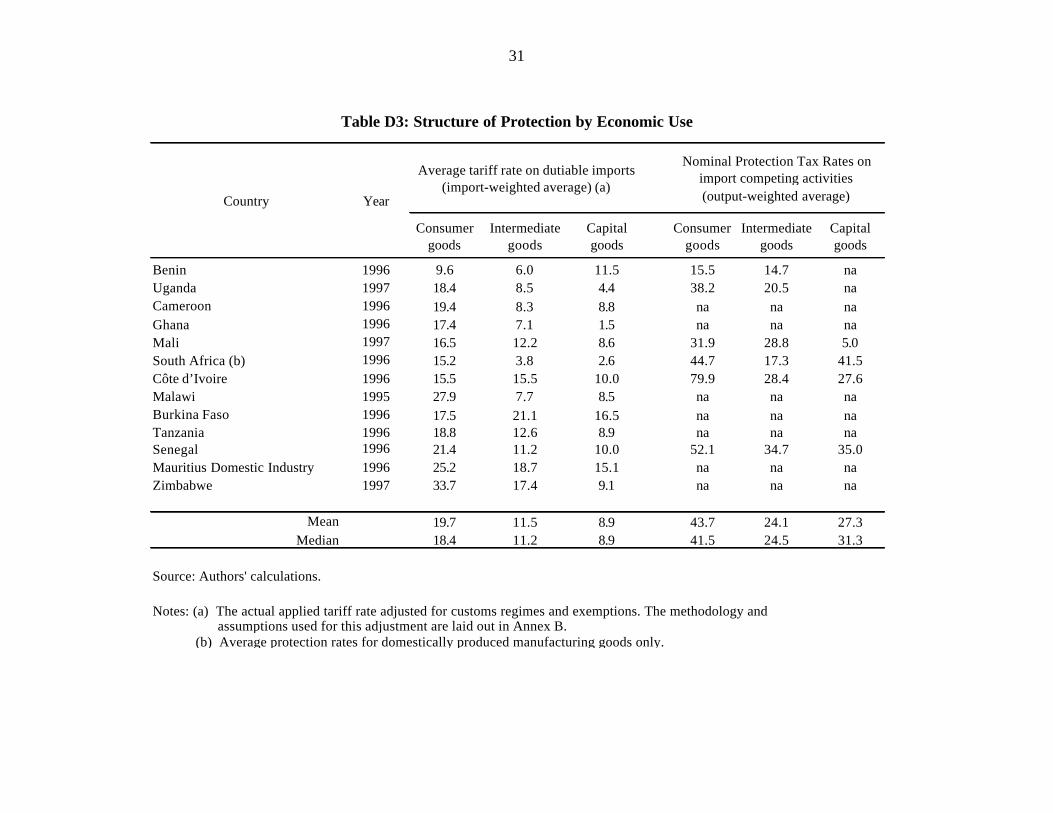
31
Table D3: Structure of Protection by Economic Use
Consumer goods
Intermediate goods
Capital goods
Consumer goods
Intermediate goods
Capital goods
Benin 1996 9.6 6.0 11.5 15.5 14.7 naUganda 1997 18.4 8.5 4.4 38.2 20.5 naCameroon 1996 19.4 8.3 8.8 na na naGhana 1996 17.4 7.1 1.5 na na naMali 1997 16.5 12.2 8.6 31.9 28.8 5.0South Africa (b) 1996 15.2 3.8 2.6 44.7 17.3 41.5Côte d’Ivoire 1996 15.5 15.5 10.0 79.9 28.4 27.6Malawi 1995 27.9 7.7 8.5 na na naBurkina Faso 1996 17.5 21.1 16.5 na na naTanzania 1996 18.8 12.6 8.9 na na naSenegal 1996 21.4 11.2 10.0 52.1 34.7 35.0Mauritius Domestic Industry 1996 25.2 18.7 15.1 na na naZimbabwe 1997 33.7 17.4 9.1 na na na
Mean 19.7 11.5 8.9 43.7 24.1 27.3Median 18.4 11.2 8.9 41.5 24.5 31.3
Source: Authors' calculations.
Notes: (a) The actual applied tariff rate adjusted for customs regimes and exemptions. The methodology and
(b) Average protection rates for domestically produced manufacturing goods only.
Nominal Protection Tax Rates on import competing activities (output-weighted average)Country Year
Average tariff rate on dutiable imports (import-weighted average) (a)
assumptions used for this adjustment are laid out in Annex B.
32
Annex E
Summary Indicators of Tariff Barriers
1. Measures of the resource allocation, consumer welfare, fiscal dependence, and corruption effects of the sample countries’ tariff regimes are examined separately in the text. To derive an overall measure of tariff policy for each country, this Annex combines these separate measures into a multi-variable summary indicator of the distortionary effects of the sample countries’ tariff barriers. Subsequently, the best candidates for simpler three-variable and one-variable indicators are considered to see how much of the variation in the multi-variable indicator these simpler measures captured. Resource Allocation Inefficiencies 2. Assessing the overall effects of tariffs in creating distortions and inefficiencies in resource allocation is fairly complex. In order to arrive at a reasonable summary indicator of these effects, both the average level of protection created by tariffs and the variations from this average need to be taken into account. 3. The two best summary measures of the level of protection available for the sample countries are (a) the unweighted average nominal protection tax rate on domestically produced goods and (b) the indicative effective protection rate for manufactured goods.14 We believe that on balance the indicative EPR is probably a more representative measure than the average NPTR on domestically produced goods since it takes tariff escalation into account, even if somewhat crudely. To test the sensitivity of the results to the choice between these two measures, we report in Table E1 alternative calculations using each of them. 4. Three measures of the distortionary effects on resource allocation caused by variations in the level of protection granted to different industries and firms were used in Table E1 – the average anti-agriculture bias of effective protection, the standard deviation of nominal protection tax rates on domestically produced goods, and exemptions. First, pronounced anti-agriculture bias was one of the most important distortions in the sample countries’ tariffs. The difference between the indicative average protection rates for import-substituting manufacturing and that for agriculture is used as an indicator of this distortion. Second, the standard deviation of the actual EPRs for different industries in each country would probably be the most informative measure of the distortions on resource allocation caused by variations in tariff rates among different import-substituting industries. However, the lack of input-output coefficients for domestically produced goods, which limited us to calculations of only indicative effective protections rates, also prevented us from calculating the dispersion of effective protection rates. Instead, the overall dispersion of unweighted average nominal protection tax rates on domestically produced goods is used as a proxy. Third, exemptions have distortionary effects on 14 Indicative effective protection rates for manufacturing activities are used as the summary measure of the level
of protection because of the general anti-agriculture bias of the sample countries’ import policies.

33
resource allocation that are partially taken into account in the calculation of the indicative effective protection rates. However, variations in the granting of exemptions may also create differences in protection between firms in the same industry, which would not be reflected in the dispersion of NPTRs for domestically produced goods. The possibility of obtaining ad hoc tariff exemptions may result in additional incentives for firms to devote resources to rent-seeking activities. Hence, the full effect of exemptions may not be completely accounted for by the indicative effective protection rates. To address this issue, exemptions of dutiable imports from import duties are used in Table E1 as an additional indicator of the distortionary effects on resource allocation and the variations in these. 5. For each of the above measures of the level and variations in protection, normalized values are computed in Table E1A. To obtain a summary indicator of the overall distortionary effects on resource allocation, a weighted average of the normalized values of these measures is calculated. A weight of 60 percent is assigned to the level of protection and 40 percent to the variations in it. Since substantial anti-agriculture bias is probably the single most important distortion resulting from variations in protection, it is given a weight of 20 percent. Because the protection of domestic industries tended to be high but fairly uniform in the sample countries, weights of 10 percent each are assigned to the standard deviation of tariffs and tariff exemptions. The sensitivity of the results to using alternative weights that give greater and lesser importance to variations in tariffs is also tested and reported in Table E1. 6. Table E1 shows that nominal and effective protection rates produced broadly similar results when used in calculating the summary indicator of resource allocation inefficiencies, which is not surprising given the correlation of above 0.9 between these two variables. Only the score of Mali (1997) change by more than one unit when nominal and indicative effective protection rates are used. Similarly, variations in the weighting scheme did not affect greatly the summary indicator of distortionary effects on resource allocation. 7. To determine how a simpler one-variable measure of distortionary effects on resource allocation related to our multi-variable summary measure of resource allocation effects, we calculate the correlation of our summary measure of distortionary resource allocation effects in Table E1 with the indicative EPRs for manufacturing, the most representative single indicator of protection that we had for the sample countries. The correlation coefficient between these two variable was 0.99 suggesting that the indicative EPRs for manufacturing, which are given a weight of 60 percent in the multi-variable indicator, accounted for much of the variation in it.

34
Table E1: Distortionary Resource Allocation Effects of Tariffs -- Multivariate Indicator (MVI)
Unweighted average NPTR
on all domestically
produced goods
Indicative Effective Protection
Rates (manufac)
Standard deviation of NPTR on
domestically produced goods
Anti-agriculture
bias (a)
Exemptions as % of dutiable imports
Overall distortions in
resource allocation
(using NPTR) (b)
Overall distortions in
resource allocation
(using EPR)
Sensitivity test 1
Sensitivity test 2
Benin 1996 14.2 34.6 4.6 21.9 14.1 0.2 0.2 0.4 0.2Mali (c) 1997 30.2 50.5 9.7 na 14.1 2.4 1.4 1.4 1.4Cameroon 1996 30.6 68.8 4.9 34.6 19.1 2.6 2.4 2.2 2.5South Africa 1996 27.3 67.6 22.1 67.6 4.3 2.6 2.8 2.4 2.8Uganda 1997 25.4 72.6 10.3 50.2 14.8 2.2 2.8 2.5 3.0Ghana 1996 29.7 67.2 22.7 39.3 50.0 3.4 3.3 4.0 3.2Burkina Faso 1996 32.9 83.7 16.1 60.3 15.0 3.3 3.7 3.2 3.8Tanzania 1996 42.9 84.2 25.8 55.3 21.8 4.7 3.9 3.7 4.0Côte d’Ivoire 1996 34.7 92.4 30.6 70.5 10.3 3.8 4.4 3.9 4.6Malawi 1995 38.0 89.8 18.2 88.4 32.1 4.8 4.9 4.7 4.9Senegal 1996 46.6 103.3 18.9 71.1 16.8 5.2 5.0 4.3 5.2Zimbabwe 1997 40.8 107.0 24.8 92.9 13.8 4.9 5.6 4.8 5.8Mauritius Domestic Industry 1996 65.4 149.0 80.1 127.6 12.4 9.2 9.2 8.4 9.4
Mean 35.3 82.4 22.2 65.0 18.4 3.8 3.8 3.5 3.9Median 32.9 83.7 18.9 63.9 14.8 3.4 3.7 3.7 3.8
Source: Staff estimates.
Sensitivity Test 2: Lower weights for variations in protection: EPR=70%, Anti-Agricultural Bias=15%, Dispersion=7.5%, Exemptions=7.5%. (c) No weight on anti-agriculture bias, and 20% each on dispersion and exemptions (60% on NPTR).
Notes: (a) Amount by which indicative EPR for domestic manufacturing exceeds indicative EPR for domestic agriculture. (b) Weighted average of normalized value of individual indicators (in Table E1A) using the following weights: Base Case: NPTR or EPR=60%, Anti-Agricultural Bias=20%, Dispersion=10%, Exemptions=10%; Sensitivity Test 1: Higher weights for variations in protection: EPR=45%, Anti-Agricultural Bias=15%, Dispersion=20%, Exemptions=20%;

35
Table E1A: Distortionary Resource Allocation Effects of Tariffs -- Normalized Values of Multivariate Indicator
Unweighted average NPTR
on all domestically
produced goods
Indicative Effective Protection
Rates (manufac)
Standard deviation of NPTR on
domestically produced goods
Anti-agriculture
bias (a)
Exemptions as % of dutiable imports
Overall distortions in
resource allocation
(using NPTR) (b)
Overall distortions in
resource allocation
(using EPR)
Benin 1996 0 0 0 0 2.1 0 0Mali 1997 3.1 1.4 0.7 na 2.1 2.5 1.3Cameroon 1996 3.2 3.0 0.0 1.2 3.2 2.6 2.5South Africa 1996 2.6 2.9 2.3 4.3 0 2.7 2.9Uganda 1997 2.2 3.3 0.8 2.7 2.3 2.2 2.9Ghana 1996 3.0 2.8 2.4 1.6 10 3.5 3.4Burkina Faso 1996 3.7 4.3 1.5 3.6 2.3 3.4 3.9Tanzania 1996 5.6 4.3 2.8 3.2 3.8 5.0 4.1Côte d’Ivoire 1996 4.0 5.1 3.4 4.6 1.3 4.0 4.7Malawi 1995 4.6 4.8 1.8 6.3 6.1 5.2 5.3Senegal 1996 6.3 6.0 1.9 4.7 2.7 5.5 5.3Zimbabwe 1997 5.2 6.3 2.7 6.7 2.1 5.3 6.0Mauritius 1996 10 10 10 10 1.8 10 10
Mean 4.1 4.2 2.3 4.1 3.1 4.0 4.0Median 3.7 4.3 1.9 4.0 2.3 3.5 3.9
Anti-Agricultural Bias=20%, Dispersion=10%, Exemptions=10%. (b) Weighted average of normalized value of individual indicators using the following weights: EPR or NPTR=60%,
Notes: (a) Amount by which indicative EPR for domestic manufacturing exceeds indicative EPR for domestic agriculture.

36
Consumer Welfare, Fiscal Dependence, and Corruption Effects 8. The resulting normalized values of the summary indicator of the distortionary effects of tariffs on resource allocation have been carried over from Table E1 to Table E2, where the consumer welfare, fiscal dependence, and corruption effects are taken into account. In order to take into account the effects of both the relatively high tariffs on consumer goods that are produced domestically and the relative importance of the tariffs on the imports of other consumer goods, distortion of consumer choices is measured by an unweighted average of (a) the nominal protection tax rates on domestically produced consumer goods and (b) the import-weighted average tariff on consumer goods. The fiscal dependence of countries on revenues from tariffs is measured using tariff revenues as a percent of GDP. For the 10 sample countries for which the data were available, we also report the rescaled normalized value of Transparency International perceptions of corruption index from Table 10. Summary Indicator of Tariff Barriers 9. Even at the fairly low level of development of most of the sample countries, the median tariff &sc revenues collected constituted 2 percent of GDP (or 16% of government revenues before grants). Mauritius (1996) collected the highest share of both GDP and tax revenues at 6.2 percent and 33 percent respectively. At the median level of tariff collection and protection in the sample countries, concerns regarding the distortions introduced to productive resource allocation seem to outweigh those for consumer welfare effects and tax dependency on a volatile revenue source (tariff revenues), although exact magnitude of each depends obviously on the parameters of the economy. Hence, in computing an average of the normalized values of the separate indicators in Table E2, a weight of 60 percent is assigned to resource allocation inefficiencies, 20 percent to distortions in consumer choices, and 20 percent to tariff revenue dependency. An unweighted average of the indicators is computed as sensitivity tests. 10. The results of the above analyses are shown in the last three columns of Tables E2 and E2A. Benin (1996) emerged as the country with by far the least distortionary tariff barriers and represented the best observed practice in the sample. Benin had the lowest index of resource allocation inefficiencies, the lowest average import tariffs on consumer goods, and the second lowest dependency of fiscal revenues on tariffs. Mali (1997) followed at a considerable distance behind in second place. At the other end of the scale, Mauritius (1996) had the most distortionary tariffs and the worst observed practices in the sample, scoring the worst on many of the indicators.

37
Table E2: Multivariate Summary Indicator of Tariff Barriers
Country Year
Overall distortions in
resource allocation (EPR) (a)
Unweighted NPTR on
domestically produced consumer
goods
Import-weighted
average tariff &sc on dutiable
consumer goods
Distortionary effects on consumer choices
(b)
Tariff &sc revenues as % of GDP
Normalized Rescaled TI Perceptions
of Corruption Index
(c)
MVI weighted average
(d)
MVI unweighted
average
Benin 1996 0 13.7 9.6 11.7 1.1 na 0.1 0.2Mali 1997 1.3 33.6 16.5 25.1 2.2 na 1.9 2.4Cameroon 1996 2.5 30.9 19.4 25.2 1.3 10 2.4 2.4Uganda 1997 2.9 30.8 18.4 24.6 0.8 6.8 2.4 2.1South Africa 1996 2.9 39.0 15.2 27.1 0.8 0 2.5 2.2Ghana 1996 3.4 33.0 17.4 25.2 1.1 5.0 2.8 2.4Tanzania 1996 4.1 50.3 18.8 34.6 2.0 8.7 4.0 3.9Côte d’Ivoire 1996 4.7 43.0 15.5 29.3 1.8 5.5 4.0 3.5Burkina Faso 1996 3.9 43.8 17.5 30.7 3.3 na 4.1 4.3Malawi 1995 5.3 43.1 27.9 35.5 3.0 2.9 5.3 5.3Senegal 1996 5.3 51.7 21.4 36.6 4.2 5.0 5.6 5.8Zimbabwe 1997 6.0 68.4 33.7 51.1 6.1 2.6 7.6 8.6Mauritius Domestic Industry 1996 10 63.8 25.2 44.5 6.2 0.5 9.6 9.3
Mean 4.0 41.9 19.7 30.9 2.6 4.7 4.0 4.0Median 3.9 43.0 18.4 29.3 2.0 5.0 4.0 3.5
Source: Authors' calculations.
Notes: (a) Normalized value for overall distortions in resouce allocation measured using EPR from Table E1A. (b) Unweighted average of preceding two columns. (c) Normalized rescaled value of TI perceptions of corruption index from Table 10, Vol. 1.
effects of resource allocation, 20% on distortionary effects on consumer choices, and 20% on tariff revenues as a share of GDP. (d) MVI: multivariate summary indicator of tariff barriers. Weighted average of normalized values of indicators. Weights are 60% on distortionary

38
Table E2A: Multivariate Summary Indicator of Tariff Barriers -- Normalized Values
Country Year
Distortionary Effects on resource
allocation (a)
Unweighted NPTR on
domestically produced consumer
goods
Import-weighted
average tariff &sc on dutiable
consumer goods
Distortionary effects on consumer choices
(b)
Tariff & sc
Revenues as % of
GDP
Normalized Rescaled TI Perceptions
of Corruption Index
(c)
MVI weighted average
(d)
MVI unweighted
average
Benin 1996 0 0 0 0 0.6 na 0 0Mali 1997 1.3 3.6 2.9 3.3 2.5 na 1.9 2.4Cameroon 1996 2.5 3.1 4.1 3.6 1.0 10 2.4 2.4Uganda 1997 2.9 3.1 3.7 3.4 0 6.8 2.4 2.1South Africa 1996 2.9 4.6 2.3 3.5 0.1 0 2.5 2.1Ghana 1996 3.4 3.5 3.2 3.4 0.5 5.0 2.9 2.5Tanzania 1996 4.1 6.7 3.8 5.3 2.3 8.7 4.1 4.1Côte d’Ivoire 1996 4.7 5.4 2.4 3.9 2.0 5.5 4.1 3.6Burkina Faso 1996 3.9 5.5 3.3 4.4 4.6 na 4.2 4.5Malawi 1995 5.3 5.4 7.6 6.5 4.1 2.9 5.5 5.6Senegal 1996 5.3 6.9 4.9 5.9 6.3 5.0 5.8 6.2Zimbabwe 1997 6.0 10 10 10 9.8 2.6 7.9 9.3Mauritius Domestic Industry 1996 10 9.2 6.5 7.8 10 0.5 10 10
Mean 4.0 5.2 4.2 4.7 3.4 4.7 4.1 4.2Median 3.9 5.4 3.7 3.9 2.3 5.0 4.1 3.6
Source: Authors' calculations.
Notes: (a) Normalized value for overall distortions in resouce allocation measured using EPR from Table E1A. (b) Normalized figures of distortionary efficts on consumer choices from Table E2. (c) Normalized rescaled value of TI perceptions of corruption index from Table 10, Vol. 1. (d) MVI: multivariate summary indicator of tariff barriers. Weighted average of normalized values of indicators. Weights are 60% on distortionary effects of resource allocation, 20% on distortionary effects on consumer choices, and 20% on tariff revenues as a share of GDP.

39
Table E3: Partial Correlation Between Measures of Tariff Barriers and TI Corruption Index
Distortionary Effects on resource
allocation (EPR)
Unweighted NPTR on
domestically produced consumer
goods
Import-weighted
average tariff on dutiable consumer
goods
Indicative Effective
Protection Rates
(manufac)
Effective Protection Rates for Exports
Distortionary effects on consumer choices
Tariff & sc Revenues as % of GDP
MVI weighted average
MVI unweighted
average
Exemptions as % of dutiable imports
TI corruption index (scale reversed)
-0.55 -0.47 -0.33 -0.47 -0.45 -0.46 -0.46 -0.52 -0.49 0.23

40
11. The rescaled perceptions of corruption index was negatively correlated with all of the indicators of the resource allocation effects of tariffs except for exemptions as a percentage of dutiable imports, with which it had a low positive correlation (0.2). (See Table E3). Hence, the inclusion of corruption effects considerably shuffles the rankings of the sample countries. The TI data were not available for Benin (1996), which had the best performance on the summary indicators of distortion excluding corruption. Comparison with Simpler Summary Indicators 12. In Tables E4 and E5 we test a simpler three-variable approach using only one variable to measure each effect. In the computation of the 3-variable indicator (see Table E4), the indicative EPR for manufacturing is used rather than the more complex multivariable indicator of resource allocation inefficiencies; the import weighted average tariff on consumer goods is used to measure consumer welfare effects rather than two variables; and tariff revenue as a percent of GDP is used to measure fiscal dependence on imports duties. The same weights as for the multivariable indicator are employed for computing a weighted average of the three-variable indicator. 13. Table E5 compares the three-variable indicator to its multivariable counterpart and to the indicative effective protection rate for manufactured goods, our best single-variable measure of the distortionary effects of tariffs. The correlation between the three-variable and multivariable indicators is almost 1.0, and the rankings of the countries by these two indicators are very similar. The results suggest that three variable indicator does a pretty good job of tracking the multivariable one and that use of the extra variables did not add a lot of additional information to the summary indicator. 14. In contrast, the indicative EPR for manufacturing did less well in tracking the multivariable indicator. Although the correlations between the EPR and the three-variable and multi-variable indicators are very high (0.97-0.98), use of the EPR changed the rankings of many of the countries. Hence, the additional information included in both the three-variable and multi-variable indicators does appear to affect the results considerably.

41
Table E4: Three Variable Summary Tariff Indicator
Country Year
Indicative Effective
Protection Rates (manufac)
Import-weighted average tariff &sc
on dutiable consumer goods
Tariff &sc revenues as % of GDP
3 variable weighted average
(a)
Normalized value of the 3 variable
weighted average
Benin 1996 34.6 9.6 1.1 0.1 0
Mali 1997 50.5 16.5 2.2 2.4 1.8
South Africa 1996 67.6 15.2 0.8 3.2 2.4
Ghana 1996 67.2 17.4 1.1 3.4 2.6
Cameroon 1996 68.8 19.4 1.3 3.8 2.9
Uganda 1997 72.6 18.4 0.8 3.9 3.0
Tanzania 1996 84.2 18.8 2.0 5.3 4.1
Burkina Faso 1996 83.7 17.5 3.3 5.6 4.4
Côte d’Ivoire 1996 92.4 15.5 1.8 5.7 4.4
Malawi 1995 89.8 27.9 3.0 6.9 5.4
Senegal 1996 103.3 21.4 4.2 7.9 6.2
Zimbabwe 1997 107.0 33.7 6.1 10.0 7.8
Mauritius Domestic Industry 1996 149.0 25.2 6.2 12.8 10
Mean 82.4 19.7 2.6 5.5 4.2
Median 83.7 18.4 2.0 5.3 4.1
Source: Authorities of the sample countries, and staff estimates.
20% on the import-weighted average tariff on consumer goods, and 20% on tariff revenue as a share of GDP.Note: (a) 3 variable index: weighted average of normalized values with weights of 60% on indicative EPR for manufacturing,

42
Table E5: Comparison of One, Three, and Multivariate Summary Tariff Indicators -- Normalized Values
Country Year
Indicative Effective
Protection Rates (manufac)
3 variable weighted average
(a)
MVI weighted average
(b)
Benin1996 0 0 0
Mali 19971.4 1.8 1.9
Cameroon 19963.0 2.9 2.4
Uganda 19973.3 3.0 2.4
South Africa 19962.9 2.4 2.5
Ghana 19962.8 2.6 2.9
Tanzania 19964.3 4.1 4.1
Côte d’Ivoire1996
5.1 4.4 4.1
Burkina Faso1996
4.3 4.4 4.2
Malawi1995
4.8 5.4 5.5
Senegal1996
6.0 6.2 5.8
Zimbabwe1997
6.3 7.8 7.9
Mauritius Domestic Industry1996
10 10 10
Mean 4.2 4.2 4.1
Median 4.3 4.1 4.1
Source: Authors' calculations.
Notes: (a) Table E4.
(b) Table E2A.

43
Annex F
Alternative Calculations of the B and B* Indices
1. In Table 16a of the main text (vol.1), we present the B index calculated with manufacturing imports in the numerator and all exports in the denominator. This is only one way of calculating the B index. We report in Table F1 five other ways of calculating it (along with the one presented in Table 16a). The components of B index that are used in calculation are reported in tables F1A and F1B. When the import policy is averaged over all imports instead of just manufacturing imports, the anti-export bias is less pronounced, and the B index is slightly lower for all but one country (Cameroon). Exporters of agricultural goods face a particularly severe bias in Burkina Faso according to B indices. More generally, we gain insight to the idiosyncrasies of each country’s trade policies by comparing the B index computed using different combinations of import and export policies.
2. Analogously, Table F2 reports the B* indices, computed with different combinations of import and export policies. Like the B index, using the overall import policy instead of policies on manufacturing imports makes the anti-export bias less pronounced (even for Cameroon). According to B* indices, exporters of agricultural goods face a strong bias against them in Benin, Côte d’Ivoire and Cameroon.

44
Table F1: B Index
B Index
man imports/ all exports
all imports/ all exports
all imports/ man exports
all imports/ ag exports
man imports/ man exports
ag imports/ ag exports
Uganda 1997 1.5 1.4 1.5 1.3 1.6 1.3South Africa 1996 1.5 1.4 1.6 1.3 1.6 naCameroon 1996 1.5 1.6 1.7 1.5 1.7 1.5Ghana 1996 1.6 1.6 1.5 2.0 1.5 1.9Mali 1997 1.6 1.6 1.6 2.2 1.6 naSenegal 1996 1.6 1.6 1.7 1.5 1.7 1.3Malawi 1995 1.6 1.6 1.7 1.5 1.8 1.1Tanzania 1996 1.7 1.7 1.9 1.5 1.9 1.3Côte d’Ivoire 1996 1.7 1.6 1.6 1.8 1.8 1.7Benin 1996 1.8 1.7 1.4 2.0 1.4 1.9Zimbabwe 1997 1.8 1.7 1.9 1.5 2.0 1.2Mauritius Domestic Industry (a) 1996 1.9 1.9 2.0 1.7 2.0 1.3Burkina Faso 1996 2.1 1.9 1.9 2.8 2.0 2.6
Mean 1.7 1.6 1.7 1.7 1.7 1.6Median 1.6 1.6 1.7 1.5 1.7 1.3
Source: Authors' calculations.
Note: (a) For domestic firms without preferential access to the EU sugar market, the EU and US garment markets, or to foreign exchange.
Country Year
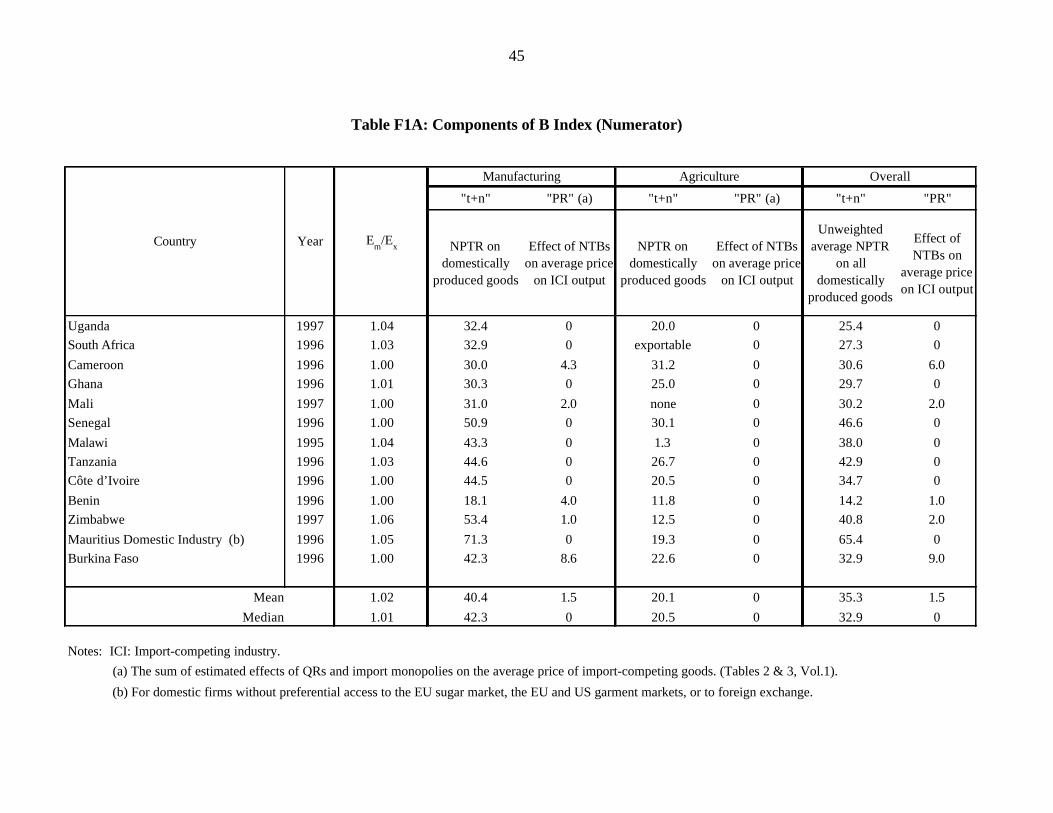
45
Table F1A: Components of B Index (Numerator)
"t+n" "PR" (a) "t+n" "PR" (a) "t+n" "PR"
NPTR on domestically
produced goods
Effect of NTBs on average price
on ICI output
NPTR on domestically
produced goods
Effect of NTBs on average price
on ICI output
Unweighted average NPTR
on all domestically
produced goods
Effect of NTBs on
average price on ICI output
Uganda 1997 1.04 32.4 0 20.0 0 25.4 0South Africa 1996 1.03 32.9 0 exportable 0 27.3 0Cameroon 1996 1.00 30.0 4.3 31.2 0 30.6 6.0Ghana 1996 1.01 30.3 0 25.0 0 29.7 0Mali 1997 1.00 31.0 2.0 none 0 30.2 2.0Senegal 1996 1.00 50.9 0 30.1 0 46.6 0Malawi 1995 1.04 43.3 0 1.3 0 38.0 0Tanzania 1996 1.03 44.6 0 26.7 0 42.9 0Côte d’Ivoire 1996 1.00 44.5 0 20.5 0 34.7 0Benin 1996 1.00 18.1 4.0 11.8 0 14.2 1.0Zimbabwe 1997 1.06 53.4 1.0 12.5 0 40.8 2.0Mauritius Domestic Industry (b) 1996 1.05 71.3 0 19.3 0 65.4 0Burkina Faso 1996 1.00 42.3 8.6 22.6 0 32.9 9.0
Mean 1.02 40.4 1.5 20.1 0 35.3 1.5Median 1.01 42.3 0 20.5 0 32.9 0
(b) For domestic firms without preferential access to the EU sugar market, the EU and US garment markets, or to foreign exchange.
(a) The sum of estimated effects of QRs and import monopolies on the average price of import-competing goods. (Tables 2 & 3, Vol.1).
Country Year Em/Ex
Notes: ICI: Import-competing industry.
Manufacturing Agriculture Overall
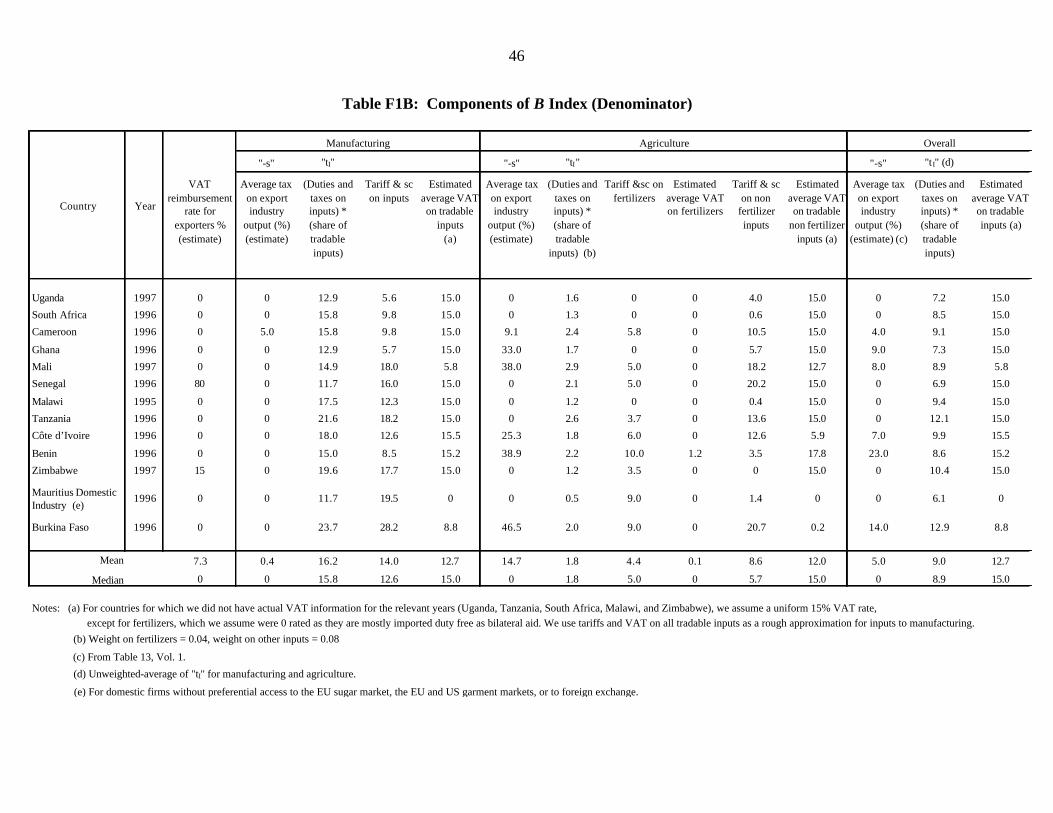
46
Table F1B: Components of B Index (Denominator)
Manufacturing Agriculture Overall
"-s" "tI" "-s" "tI" "-s" "t I" (d)
VAT reimbursement
rate for exporters % (estimate)
Average tax on export industry
output (%) (estimate)
(Duties and taxes on inputs) * (share of tradable inputs)
Tariff & sc on inputs
Estimated average VAT on tradable
inputs (a)
Average tax on export industry
output (%) (estimate)
(Duties and taxes on inputs) * (share of tradable
inputs) (b)
Tariff &sc on fertilizers
Estimated average VAT on fertilizers
Tariff & sc on non
fertilizer inputs
Estimated average VAT on tradable
non fertilizer inputs (a)
Average tax on export industry
output (%) (estimate) (c)
(Duties and taxes on inputs) * (share of tradable inputs)
Estimated average VAT on tradable inputs (a)
Uganda 1997 0 0 12.9 5.6 15.0 0 1.6 0 0 4.0 15.0 0 7.2 15.0
South Africa 1996 0 0 15.8 9.8 15.0 0 1.3 0 0 0.6 15.0 0 8.5 15.0
Cameroon 1996 0 5.0 15.8 9.8 15.0 9.1 2.4 5.8 0 10.5 15.0 4.0 9.1 15.0
Ghana 1996 0 0 12.9 5.7 15.0 33.0 1.7 0 0 5.7 15.0 9.0 7.3 15.0
Mali 1997 0 0 14.9 18.0 5.8 38.0 2.9 5.0 0 18.2 12.7 8.0 8.9 5.8
Senegal 1996 80 0 11.7 16.0 15.0 0 2.1 5.0 0 20.2 15.0 0 6.9 15.0
Malawi 1995 0 0 17.5 12.3 15.0 0 1.2 0 0 0.4 15.0 0 9.4 15.0
Tanzania 1996 0 0 21.6 18.2 15.0 0 2.6 3.7 0 13.6 15.0 0 12.1 15.0
Côte d’Ivoire 1996 0 0 18.0 12.6 15.5 25.3 1.8 6.0 0 12.6 5.9 7.0 9.9 15.5
Benin 1996 0 0 15.0 8.5 15.2 38.9 2.2 10.0 1.2 3.5 17.8 23.0 8.6 15.2
Zimbabwe 1997 15 0 19.6 17.7 15.0 0 1.2 3.5 0 0 15.0 0 10.4 15.0
Mauritius Domestic Industry (e)
1996 0 0 11.7 19.5 0 0 0.5 9.0 0 1.4 0 0 6.1 0
Burkina Faso 1996 0 0 23.7 28.2 8.8 46.5 2.0 9.0 0 20.7 0.2 14.0 12.9 8.8
Mean 7.3 0.4 16.2 14.0 12.7 14.7 1.8 4.4 0.1 8.6 12.0 5.0 9.0 12.7
Median 0 0 15.8 12.6 15.0 0 1.8 5.0 0 5.7 15.0 0 8.9 15.0
Country Year
except for fertilizers, which we assume were 0 rated as they are mostly imported duty free as bilateral aid. We use tariffs and VAT on all tradable inputs as a rough approximation for inputs to manufacturing.
(e) For domestic firms without preferential access to the EU sugar market, the EU and US garment markets, or to foreign exchange.
Notes: (a) For countries for which we did not have actual VAT information for the relevant years (Uganda, Tanzania, South Africa, Malawi, and Zimbabwe), we assume a uniform 15% VAT rate,
(b) Weight on fertilizers = 0.04, weight on other inputs = 0.08
(c) From Table 13, Vol. 1.
(d) Unweighted-average of "tI" for manufacturing and agriculture.

47
Table F2: B* Index Calculations
Indicative rates on manuf.
Indicative rates on
ag.
Unweighted average indicative
rates (b)Manuf. Agric.
Unweighted average rates on
exports
Uganda 1997 1.04 72.6 22.4 47.5 -3.1 -1.7 -1.7 1.8 1.6 na 1.6 na 1.3South Africa 1996 1.03 67.6 0.0 33.8 -5.5 -8.3 -7.7 1.9 1.5 1.5 1.5 1.8 naBenin 1996 1.00 34.6 12.7 23.6 -10.6 -52.5 -31.6 2.0 1.8 1.4 2.6 1.5 2.4Malawi 1995 1.04 89.8 1.4 45.6 -3.3 none -3.3 2.0 1.6 1.6 na 2.0 naTanzania 1996 1.03 84.2 28.9 56.6 -11.3 -3.7 -8.8 2.1 1.8 1.8 1.7 2.1 1.4Mali 1997 1.00 50.5 na 50.5 none -28.8 -28.8 2.1 2.1 na 2.1 na naGhana 1996 1.01 67.2 27.9 47.5 -21.9 -34.3 -25.0 2.2 2.0 1.9 2.3 2.2 2.0Senegal 1996 1.00 103.3 32.1 67.7 -14.2 -3.4 -10.2 2.3 1.9 2.0 1.7 2.4 1.4Zimbabwe 1997 1.06 107.0 14.0 60.5 -4.7 none -4.7 2.3 1.8 1.8 na 2.3 naCameroon 1996 1.00 68.8 34.2 51.5 -16.4 -47.8 -32.1 2.5 2.2 1.8 2.9 2.0 2.6Burkina Faso 1996 1.00 83.7 23.4 53.5 none -31.6 -31.6 2.7 2.2 na 2.2 na 1.8Côte d’Ivoire 1996 1.00 92.4 21.9 57.2 -11.2 -42.2 -29.8 2.7 2.2 1.8 2.7 2.2 2.1Mauritius Domestic Industry (c)
1996 1.05 149.0 21.4 85.2 none none na na na na na na na
Mean 1.02 82.4 20.0 52.4 -10.2 -25.4 -17.9 2.2 1.9 1.7 2.1 2.1 1.9
Median 1.01 83.7 22.2 51.5 -10.9 -30.2 -17.6 2.2 1.9 1.8 2.2 2.1 1.9
Source: Authors' calculations.
could not be computed because these exports were neglible.
B * Index
man imp/ all exp
all imp/ all exp
all imp/ manuf exp
all imp/ ag exp
manuf imp/ manuf exp
ag imp/ ag exp
Effective Protection Rates (EPR)
Imports ExportsEm/Ex
(a)
Notes: (a) The unweighted average of the parallel and official exchange rates (in domestic currency terms) divided by the official exchange rate (Table 1, Vol. 1). (b) Unweighted average of the indicative EPRs on manufacturing and agricultural goods. (c) For domestic firms without preferential access to EU sugar market, EU and US garment markets, or to foreign exchange. For these firms a meaningful EPR
Country Year

48
Annex G
Comparison between Tariff Drawback (Reimbursement) and Tariff Suspension
(Temporary Admission) Schemes 1. Firms that do not export on a regular basis or that export only a small proportion of their output often find it advantageous to operate under a duty drawback arrangement. By doing so, they can save the fees that banks usually charge to guarantee payment of the full amount of tariff liabilities usually required under tariff suspension schemes. The cost of using the duty drawback is the opportunity cost of the funds that are temporarily tied up until the up front tax payments on the imported inputs incorporated in exports are refunded. 2. In contrast, firms exporting a substantial proportion of their output on a regular basis may find that a tariff suspension or temporary admissions regime minimizes their costs of exporting by saving the opportunity cost of paying customs duty up front. The tradeoff is that these firms have to pay fees for the bank guarantees that the government will cash out if production does not end up in successful exports. If the amounts of the guarantees required are not related to actual customs duty liabilities, then occasional exporters could also benefit from operating under the suspension scheme rather than under the duty drawback as the cost of using the former is reduced for them. 3. If there are not effective controls over the final destination of goods produced by firms operating under tariff suspension schemes (or export processing zones), then import-competing firms that are occasional exporters may also find it advantageous to operate under these schemes to avoid paying tariffs on inputs and capital goods used in production sold in the domestic market. The outcome in this case will be a transfer of resources from the government to import-competing firms and an increase in effective protection rates for their activities. 4. Macroeconomic policies as well as the manner in which the two types of regimes are implemented may contribute to the selection of alternative export regimes by firms. Inflation and currency depreciation usually improve the relative attractiveness of tariff suspensions for occasional exporters when there are substantial delays in the reimbursement of import duties and no adjustment of tax liabilities for inflation. In these circumstances, a duty drawback scheme can be a high cost interest- free loan from firms to the government. Firms can avoid the increased cost of operating within the drawback by using the tariff suspension regime instead. In this case, if bank guarantees are not indexed with inflation nor linked to changes in the exchange rate, then additional protection would be granted to activities that could be mostly oriented toward the local market as the real value of import tariffs paid on inputs would be eroded by inflation as the actual payment of import duties may become effective only one year or more after imports take place under a tariff suspension scheme.

49
Annex H
Dysfunctional EPZ Arrangements
1. Three of the sample countries – Zimbabwe (1998), Senegal (1995), and Cameroon (1996) – had dysfunctional EPZ arrangements. In Zimbabwe, the EPZ scheme granted duty-free status to imports of capital goods and inputs. According to the legislation, EPZ firms were obligated to pay statutory tariffs on capital and intermediate goods used to produce the output sold on the domestic market. In practice, however, only capital goods were imported duty-free as there were no fenced industrial sites in operation as the legislation required and there was a shortage of trained personnel in customs to monitor the proper utilization of inputs imported under this scheme. Firms thus applied for both tariff suspension and EPZ privileges in order to obtain waivers from import tariffs. The manner in which this EPZ scheme was implemented led to redundancy of benefits with the tariff suspension scheme and had no significant impact on exports. 2. In Senegal, the Dakar EPZ was considered an example of a failed zone (Madani 1998). Several reasons for this failure have been identified: (i) bureaucratic red tape delayed the application process for potential investors; (ii) government mandated labor market rigidities made the hiring and firing of workers difficult, which, along with the low educational level of workers, reduced labor productivity; (iii) investors were required to build or lease their own factories long term with the result that foreign direct investment was discouraged through imposition of increased business risks; and (iv) utility and transportation costs were high in the zone (Keesing (1992)).15 3. To receive EPZ privileges, firms in Cameroon had to be located in an industrial free zone or to be designated a factory-specific free zone if they needed to be close to their raw materials. To be eligible, firms needed to export at least 80 percent of their output, and their activities had to also qualify for the 1990 Basic Investment Code regime. Qualifying firms enjoyed full exemption from import duties and indirect taxation, and from the corporate income tax for the first ten years of their existence. After 10 years, firms operating within the EPZ pay a corporate income tax rate of 15 percent instead of the normal rate of 38.5 percent. Sales to the domestic market were treated like imports to Cameroon, and were subject to customs duties and indirect taxes. In addition, export processing firms16 operating in the country were granted free trade status for their imports. Cameroon (1996) represented the one possible example of imperfect but functioning EPZ arrangements in the sample. Unfortunately, no data were available about the actual working of Cameroon’s EPZ arrangements to verify their efficiency nor about actual exports by firms operating under these incentive schemes. Since the complete the absence of any data on Cameroon’s EPZs is probably a reasonably good indication that they are of marginal
15 Keesing, D. B., Trends in Export Processing Zones , The World Bank, 1992. 16 The difference between EPZ and export processing firms is that the latter are not required to be located in a
fenced industrial site.
50
practical significance, these have been classified here as dysfunctional like those in Zimbabwe and Senegal, although it is possible that Cameroon’s implementation performance was somewhat better than that of the other two countries.

51
References Bhagwati, J., 1978. “Anatomy and Consequences of Exchange Control Regimes”, Cambridge,
Ma. Ghei, N., and S. Kamin, 1999. “The Use of the Parallel Market Rate as a Guide in Setting the
Official Exchange Rate” in Hinkle and Montiel. Ghei, N., and L.Pritchett, 1999. “The Three Pessimisms: Real Exchange Rates and Trade Flows
in Developing Countries” in Hinkle and Montiel. Global Currency Report, Currency Data and Intelligence, Inc., New York City. Hinkle, L., and P. Montiel, 1999. “Exchange Rate Misalignment: Concepts and Measurement
for Developing Countries”, Oxford University Press, New York, and World Bank, Washington, D.C.
IMF, 1999. “Annual Report on Exchange Arrangements and Exchange Restrictions”, IMF,
Washington, D.C. Iqbal, Z., and M. Khan (eds.), 1998. “Trade Reform and Regional Integration in Africa”, IMF,
Washington, D.C. Keesing, D. B., 1992. “Trends in Export Processing Zones”, The World Bank, Washington,
D.C. Krueger, A., 1978. “Foreign Trade Regimes and Economic Growth: Liberalization Attempts
and Consequences”, Cambridge, Ma. Kubota, K., 2000. “Fiscal constraints, collection costs, and trade policies”, Policy Research
Working Paper No. 2366, The World Bank, Washington, D.C. Madani, D., 1998. “A Review of the Role and Impact of Export Processing Zones”, The World
Bank, Washington, D.C. Narisimhan, B. and L. Pritchett, 1997. “Measuring the Impact of Reforms”, in Nash, J., and F.
Foroutan (eds.), “Trade Policy and Exchange Rate Reform in Sub-Saharan Africa”, The Australian National University.
Nash, J., and F. Foroutan (eds.), 1997. “Trade Policy and Exchange Rate Reform in Sub-
Saharan Africa”, The Australian National University. Ng, Francis, and A. Yeats, 2000. “On the Recent Trade Performance of Sub-Saharan African
Countries: Cause for Hope or More of the Same?”, Africa Region Working Paper Series No. 7, The World Bank, Washington, D.C.

52
Pritchett, Lant, 1996. “Measuring Outward Orientation in LDCs: Can it be Done?”, Journal of
Development Economics 49: 307-35. Pursell, G., 1998. “Cotton Policies in Francophone Africa”, The World Bank, Washington,
D.C. Sachs, J. D. and Warner, A. M., 1995. “Economic Reform and the Process of Global
Integration”, Brookings Papers on Economic Activity, 1, 1-118. Sharer, R., 1998. “Trade Liberalization in Sub-Saharan Africa”, in Iqbal and Khan, eds. Trade
Reform and Regional Integration in Africa. Subramanian, A., E. Gelbard, R. Harmsen, K. Elborgh-Woytek, and P. Nagy, 2000. “Trade and
Trade Policies in Eastern and Southern Africa”, IMF Occasional Paper #196, IMF, Washington, D.C.
Subramanian, A., and D. Roy, 2001. “Who Can Explain the Mauritian Miracle – Meade, Romer,
Sachs, or Rodrik?”, IMF Working Paper WP/01/116, IMF, Washington, D.C. Subramanian, A., and N. Tamarisa, 2001. “Africa’s Trade Revisited”, IMF Working Paper
WP/01/33, IMF, Washington, D.C. Transparency International. “Corruption Perceptions Index”, Various years.
http://www.transparency.org. Watson, P., 2001. “Export Processing Zones: Has Africa Missed the Boat? Not Yet!”, Africa
Region Working Paper #17, The World Bank, Washington, D.C. World Bank, 2000a. “Can Africa Claim the 21st Century?”, Washington, D.C. World Bank, 2000b. “Global Economic Prospects and the Developing Countries 2001”.
Washington, D. C. World Economic Forum, 2000. “The Africa Competitiveness Report 2000/2001”, Oxford
University Press, New York. Yeats, A., A. Amjadi, U. Reincke and F. Ng, 1997. “Did Domestic Policies Marginalize Africa
in International Trade?”, The World Bank, Washington, D.C.

53
Africa Region Working Paper Series Series # Title Date Author
ARWPS 1 Progress in Public Expenditure Management in Africa: Evidence from World Bank Surveys
January 1999 C. Kostopoulos
ARWPS 2 Toward Inclusive and Sustainable Development in the Democratic Republic of the Congo
March 1999 Markus Kostner
ARWPS 3 Business Taxation in a Low-Revenue Economy: A Study on Uganda in Comparison with Neighboring Countries
June 1999 Ritva Reinikka Duanjie Chen
ARWPS 4 Pensions and Social Security in Sub-Saharan Africa: Issues and Options
October 1999 Luca Barbone Luis-A. Sanchez B.
ARWPS 5 Forest Taxes, Government Revenues and the Sustainable Exploitation of Tropical Forests
January 2000 Luca Barbone Juan Zalduendo
ARWPS 6 The Cost of Doing Business: Firms’ Experience with Corruption in Uganda
June 2000 Jacob Svensson
ARWPS 7 On the Recent Trade Performance of Sub-Saharan African Countries: Cause for Hope or More of the Same
August 2000 Francis Ng and Alexander J. Yeats
ARWPS 8 Foreign Direct Investment in Africa: Old Tales and New Evidence
November 2000 Miria Pigato
ARWPS 9 The Macro Implications of HIV/AIDS in South Africa: A Preliminary Assessment
November 2000 Channing Arndt Jeffrey D. Lewis
ARWPS 10 Revisiting Growth and Convergence: Is Africa Catching Up?
December 2000 C. G. Tsangarides
ARWPS 11 Spending on Safety Nets for the Poor: How Much, for How Many? The Case of Malawi
January 2001 William J. Smith
ARWPS 12 Tourism in Africa February 2001 Iain T. Christie D. E. Crompton
ARWPS 13 Conflict Diamonds
February 2001 Louis Goreux
ARWPS 14 Reform and Opportunity: The Changing Role and Patterns of Trade in South Africa and SADC
March 2001 Jeffrey D. Lewis
ARWPS 15 The Foreign Direct Investment Environment in Africa
March 2001 Miria Pigato
ARWPS 16 Choice of Exchange Rate Regimes for Developing Countries
April 2001 Fahrettin Yagci
ARWPS 17 Export Processing Zones: Has Africa Missed the Boat? Not yet!
May 2001 Peter L. Watson

54
Africa Region Working Paper Series Series # Title Date Author
ARWPS 18 Rural Infrastructure in Africa: Policy Directions
June 2001 Robert Fishbein
ARWPS 19 Changes in Poverty in Madagascar: 1993-1999 July 2001 S. Paternostro J. Razafindravonona David Stifel
ARWPS 20 Information and Communication Technology, Poverty, and Development in sub-Saharan Africa and South Asia
August 2001 Miria Pigato
ARWPS 21 Handling Hierarchy in Decentralized Settings: Governance Underpinnings of School Performance in Tikur Inchini, West Shewa Zone, Oromia Region
September 2001 Navin Girishankar A. Alemayehu Yusuf Ahmad
ARWPS 22 Child Malnutrition in Ethiopia: Can Maternal Knowledge Augment The Role of Income?
October 2001 Luc Christiaensen Harold Alderman
ARWPS 23 Child Soldiers: Preventing,Demobilizing and Reintegrating
November 2001 Beth Verhey
ARWPS 24 The Budget and Medium-Term Expenditure Framework in Uganda
December 2001 David L. Bevan
ARWPS 25 Design and Implementation of Financial Management Systems: An African Perspective
January 2002 Guenter Heidenhof H. Grandvoinnet Daryoush Kianpour B. Rezaian
ARWPS 26 What Can Africa Expect From Its Traditional Exports?
February 2002 Francis Ng Alexander Yeats
ARWPS 27 Free Trade Agreements and the SADC Economies February 2002 Jeffrey D. Lewis Sherman Robinson Karen Thierfelder
ARWPS 28 Medium Term Expenditure Frameworks: From Concept to Practice. Preliminary Lessons from Africa
February 2002 P. Le Houerou Robert Taliercio
ARWPS 29 The Changing Distribution of Public Education Expenditure in Malawi
February 2002 Samer Al-Samarrai Hassan Zaman
ARWPS 30 Post-Conflict Recovery in Africa: An Agenda for the Africa Region
April 2002 Serge Michailof Markus Kostner Xavier Devictor
ARWPS 31 Efficiency of Public Expenditure Distribution and Beyond: A report on Ghana’s 2000 Public Expenditure Tracking Survey in the Sectors of Primary Health and Education
May 2002 Xiao Ye S. Canagaraja

55
Africa Region Working Paper Series Series # Title Date Author
ARWPS 32 Promoting Growth and Employment in South Africa June 2002 Jeffrey D.Lewis
ARWPS 33 Addressing Gender Issues in Demobilization and
Reintegration Programs
August 2002 N. de Watteville
ARWPS 34 Putting Welfare on the Map in Madagascar August 2002 Johan A. Mistiaen Berk Soler T. Razafimanantena J. Razafindravonona
ARWPS 35 A Review of the Rural Firewood Market Strategy in West Africa
August 2002 Gerald Foley Paul Kerkhof Djibrilla Madougou
ARWPS 36 Patterns of Governance in Africa September 2002 Brian D. Levy
ARWPS 37 Obstacles and Opportunities for Senegal’s International Competitiveness: Case Studies of the Peanut Oil, Fishing and Textile Industries
September 2002 Stephen Golub Ahmadou Aly Mbaye
ARWPS 38 A Macroeconomic Framework for Poverty Reduction Strategy Papers : With an Application to Zambia
October 2002 S. Devarajan Delfin S. Go
ARWPS 39 The Impact of Cash Budgets on Poverty Reduction in Zambia: A Case Study of the Conflict between Well Intentioned Macroeconomic Policy and Service Delivery to the Poor
November 2002 Hinh T. Dinh Abebe Adugna Bernard Myers
ARWPS 40 Decentralization in Africa: A Stocktaking Survey November 2002 Stephen N. Ndegwa
ARWPS 41 An Industry Level Analysis of Manufacturing Productivity in Senegal
December 2002 Professor A. Mbaye
ARWPS 42 Tanzania’s Cotton Sector: Constraints and Challenges in a Global Environment
December 2002 John Baffes
ARWPS 43 Analyzing Financial and Private Sector Linkages in Africa
January 2003 Abayomi Alawode
ARWPS 44 Modernizing Africa’s Agro-Food System: Analytical
Framework and Implications for Operations February 2003 Steven Jaffee
Ron Kopicki Patrick Labaste Iain Christie
ARWPS 45 Public Expenditure Performance in Rwanda March 2003 Hippolyte Fofack
C. Obidegwu Robert Ngong

56
Africa Region Working Paper Series Series # Title Date Author
ARWPS 46 Senegal Tourism Sector Study March 2003 Elizabeth Crompton
Iain T. Christie
ARWPS 47 Reforming the Cotton Sector in SSA March 2003 Louis Goreux John Macrae
ARWPS 48 HIV/AIDS, Human Capital, and Economic Growth Prospects for Mozambique
April 2003 Channing Arndt
ARWPS 49 Rural and Micro Finance Regulation in Ghana: Implications for Development and Performance of the Industry
June 2003 William F. Steel David O. Andah
ARWPS 50 Microfinance Regulation in Benin: Implications of the PARMEC LAW for Development and Performance of the Industry
June 2003 K. Ouattara
ARWPS 51 Microfinance Regulation in Tanzania: Implications for Development and Performance of the Industry
June 2003 Bikki Randhawa Joselito Gallardo
ARWPS 52 Regional Integration in Central Africa: Key Issues June 2003 Ali Zafar Keiko Kubota
ARWPS 53 Evaluating Banking Supervision in Africa June 2003 Abayomi Alawode
ARWPS 54 Microfinance Institutions’ Response in Conflict Environments: Eritrea- Savings and Micro Credit Program; West Bank and Gaza – Palestine for Credit and Development; Haiti – Micro Credit National, S.A.
June 2003
Marilyn S. Manalo
AWPS 55 Malawi’s Tobacco Sector: Standing on One Strong leg is Better than on None
June 2003 Steven Jaffee
AWPS 56 Tanzania’s Coffee Sector: Constraints and Challenges in a Global Environment
June 2003 John Baffes
AWPS 57 The New Southern African Customs Union Agreement June 2003 Robert Kirk Matthew Stern
AWPS 58a How Far Did Africa’s First Generation Trade Reforms Go? An Intermediate Methodology for Comparative Analysis of Trade Policies (Volume I- Main Report)
June 2003 Lawrence Hinkle A. Herrou-Aragon Keiko Kubota
AWPS 58b How Far Did Africa’s First Generation Trade Reforms Go? An Intermediate Methodology for Comparative Analysis of Trade Policies (Volume II – Annexes)
June 2003 Lawrence Hinkle A. Herrou-Aragon Keiko Kubota

57
Africa Region Working Paper Series Series # Title Date Author