how good are the government’s deficit and debt … good are the government’s deficit and debt...
TRANSCRIPT

How Good Are the Government’s Deficit and Debt Projections and Should We Care?
Kevin L. Kliesen and Daniel L. Thornton
Each year, the Congressional Budget Office (CBO) publishes its Budget and Economic Outlook. The CBO’sdeficit projections for the current fiscal year (FY) and the next 10 FYs are widely followed because theyprovide an assessment of the medium-term budget outlook based on current law and a presumed pathfor the economy over the next decade. Admittedly, this task is more difficult because of the requiredassumption that the laws governing future outlays and revenues do not change. Nevertheless, given itsnonpartisan nature and the CBO’s well-respected staff of professional economists and budget analysts,its projections are closely followed. In this article, the authors update their 2001 assessment of the accu-racy of the CBO’s short- and medium-term budget projections by adding an additional 10 years of data.Such analysis is useful in light of the dramatic change in actual and expected fiscal policy, especiallyover the past few years. In addition, they investigate the extent to which the CBO’s projection errors areaffected by errors in forecasting key economic variables and the extent to which the errors relate moreto inaccurate projections of revenues or expenditures. (JEL H60, H62, H68)
Federal Reserve Bank of St. Louis Review, January/February 2012, 94(1), pp. 21-39.
I n 2000, after more than 40 years of nearly consecutive budget deficits, both the WhiteHouse Office of Management and Budget and the Congressional Budget Office (CBO)projected decade-long budget surpluses. Moreover, both agencies projected that publicly
held government debt (then about $3.5 trillion) would be eliminated by 2010. The advent ofpotentially large budget surpluses, naturally, caused economists and market participants toconsider potential changes to market-making activity associated with the all-important Treasurysecurities market.1 In addition, some Federal Reserve officials began to speculate about howthe Federal Open Market Committee would conduct open market operations without an ade-quate supply of Treasury securities.2
In response to the projections of large budget surpluses, we (Kliesen and Thornton, 2001)analyzed the accuracy of these government agencies in projecting government deficits. UsingCBO deficit projections over the period 1976-99, we found that the deficit projections beyond ayear were unreliable. Importantly, we found that the projections were biased in the direction of
Kevin L. Kliesen is an economist and Daniel L. Thornton is a vice president and economic adviser at the Federal Reserve Bank of St. Louis. Theauthors thank Linpeng Zheng for research assistance.
© 2012, The Federal Reserve Bank of St. Louis. The views expressed in this article are those of the author(s) and do not necessarily reflect theviews of the Federal Reserve System, the Board of Governors, or the regional Federal Reserve Banks. Articles may be reprinted, reproduced,published, distributed, displayed, and transmitted in their entirety if copyright notice, author name(s), and full citation are included. Abstracts,synopses, and other derivative works may be made only with prior written permission of the Federal Reserve Bank of St. Louis.
Federal Reserve Bank of St. Louis REVIEW January/February 2012 21

underprojecting the size of the deficit or overprojecting the size of the surplus. We concludedthat “If the current projections are biased to a similar degree and policymakers choose to altercurrent tax and spending programs based on these projections, it is possible that the projectedsurpluses will never materialize” (p. 22).
Our conclusion proved accurate. Rather than being eliminated as projected, publicly heldgovernment debt increased to over $9 trillion by 2010. Much of the recent increase was a conse-quence of the government’s attempt to ameliorate the effects of the financial crisis on outputand employment; however, the failure of the projected surpluses to materialize was not the con-sequence of an unforeseen financial crisis. Publicly held government debt had increased to over$5 trillion before the crisis. After 2000, revenues began to decline and expenditures began to riseand the projected surpluses morphed into actual deficits. Figure 1 shows this change in the federalsurplus/deficit as a percent of gross national product (GNP) or gross domestic product (GDP)since 1800. The blue dashed line shows the CBO’s budget projections from 2000. The figureshows there were relatively large deficits before 2009. The vertical line denotes 2011, and theblack dashed line shows the CBO’s January 2011 budget projections over the next 10 years. TheCBO projects that the deficit will stabilize at about 3 percent of GDP by 2021, according to itsbaseline projections.3
Current budget projections are the polar opposite of a decade ago: Over the past few years,U.S. budget deficits have been at levels previously attained only during the Civil War and thetwo world wars. Accordingly, in January 2011 the CBO projected that these large, unsustainabledeficits would fall to more modest, although still historically large, levels over the medium term.However, since publication of the CBO’s January 2011 baseline budget projections, the BudgetControl Act of 2011 was signed into law in August 2011.4 According to the CBO, the act willpotentially reduce the cumulative budget deficit by $2.1 trillion over fiscal years (FYs) 2012 to2021. Accordingly, in the CBO’s baseline budget projections published in August 2011, the budgetdeficit as a share of GDP is projected to decline from about 9 percent in FY 2010 to 1.8 percentin FY 2021. In the January 2011 baseline, the CBO projected that the budget deficit would declineto 3.2 percent by 2021.
How much confidence should the public and policymakers place in these new projections?As noted in our previous analysis, when the CBO constructs its baseline projections it cannot—unlike private-sector forecasters—anticipate future changes in fiscal or monetary policy thataffect future economic growth, outlays, and revenues. Instead, the CBO by law uses what is knownas a “current services baseline.” That is, it must assume that existing laws that govern outlaysand receipts will prevail over the projection horizon. However, unexpected actions by policy-makers to increase spending or change taxes are important sources of budget projection errors.Of course, this handicap is only one source of projection error. Model misspecification, whichmay bias the forecast of important economic variables, such as real GDP growth and inflation,and inaccurate demographic projections obtained from other government agencies are othersources of error.5 In short, the CBO has a difficult task. Nevertheless, policymakers and othersrely on its budget projections, which are generally viewed as an unbiased assessment of themedium-term budget outlook by market analysts.
This article provides an updated assessment of the accuracy of these budget projections inlight of the dramatic change in actual and expected fiscal policy over the past few years. Specifi -cally, we investigate whether a change has occurred in the accuracy and the bias of the CBO’s
Kliesen and Thornton
22 January/February 2012 Federal Reserve Bank of St. Louis REVIEW

short- and medium-term projections relative to our previous analysis. In addition, the currentanalysis investigates the extent to which the CBO’s projection errors are affected by errors inCBO forecasts of key economic variables, something we were unable to do in our previous workbecause the sample was too short. In addition, we decompose projection errors into revenueand expenditure errors, and further by the source of the revenue and expenditures errors, in anattempt to provide insight about the likely sign and magnitude of the errors associated with thecurrent deficit projections. Our analysis begins with a discussion of U.S. deficits historically,focusing on the experience during the post-WWII period.
THE HISTORY OF U.S. DEFICITSFigure 1 shows that large deficits relative to GDP have historically been associated with wars:
the War of 1812, the Civil War, and World Wars I and II. By comparison with these wars, thedeficits associated with the Korean, Vietnam, and Gulf wars were modest. The United Statesbegan running relatively large and persistent deficits in the 1970s. In the 24 years from 1947through 1970, the average deficit as a percent of GDP was zero. In contrast, in the 37 years from1971 through 2007, the average deficit as a percent of GDP was 2.5 percent. Moreover, there wereonly 4 years (10.1 percent of the years) during the latter period when there was a surplus com-pared with 10 years (41.7 percent of the years) in the earlier period.
An important question is why has the government run large and persistent deficits since1971? We cannot answer that question per se, but we can ascertain whether large and persistentdeficits are associated with increases in expenditures or decreases in revenue or some combina-tion of both. Figure 2 shows government expenditures and revenues as a percent of GDP since
Kliesen and Thornton
Federal Reserve Bank of St. Louis REVIEW January/February 2012 23
10
5
0
–5
–10
–15
–20
–25
–301800 1820 1840 1860 1880 1900 1920 1940 1960 1980 2000 2020
Actual
2011 Projection2000 Projection
Percent of GNP/GDP
Figure 1
The Federal Surplus/Deficit as a Percent of GNP/GDP

Kliesen and Thornton
24 January/February 2012 Federal Reserve Bank of St. Louis REVIEW
28
25
22
19
16
13
10
Percent of GDP
1946 1952 1958 1964 1970 1976 1982 1988 1994 2000 2006
ReceiptsOutlays
Fiscal Years
Figure 2
Government Receipts and Outlays as a Percent of GDP
SOURCE: Office of Management and Budget and Haver Analytics.
2
1
0
–1
–2
–3
–4
–5
–6
–7
–8
Percent of Potential GDP
1962 1968 1974 1980 1986 1992 1998 2004 2010Fiscal Years
Figure 3
The U.S. Cyclically Adjusted Budget Deficit
SOURCE: Congressional Budget Office.

Kliesen and Thornton
1946. From the early 1950s until the late 1960s, revenues and expenditures were a relatively con-stant percent of GDP. From 1950 through 1970, revenue averaged 17.6 percent of GDP, whileexpenditures were only slightly higher, 18.2 percent. In contrast, from 1971 through 2007, revenueaveraged 18.2 percent of GDP, while expenditures averaged 20.6 percent. Indeed, the differencebetween revenues and expenditures, 2.4 percent, is nearly equal to the 2.5 percent average deficitas a percent of GDP over the period. Hence, essentially the entire average deficit over the 1971-2007 period can be attributed to an increase in expenditures relative to revenues.6
In response to persistently larger budget deficits, Congress enacted several reforms to thediscretionary side of the budget process, such as the Gramm-Rudman-Hollings Balanced Budgetand Emergency Deficit Control Act of 1985 and the Budget Enforcement Act of 1990, whichinstituted “pay-as-you-go” (PAYGO) rules.7 None of these reforms has permanently reducedthe deficit to its pre-1971 levels, though they may have had a temporary effect. Indeed, as seenby the cyclically adjusted (structural) budget deficit (Figure 3), the structural budget deficitincreased from a little less than 1 percent of potential GDP in 1962 to a little less than 5 percentof potential GDP in 1986.8 The structural deficit then declined, reaching a positive 1 percent in2000, before falling sharply thereafter.
The previous analysis provides little insight into why government spending increased duringthe period. Considering the source of revenues and expenditures offers some insight into this
Federal Reserve Bank of St. Louis REVIEW January/February 2012 25
1948 1954 1960 1966 1972 1978 1984 1990 1996 2002 2008
12
10
8
6
4
2
0
Percent of GDP
Fiscal Years
Individual IncomeCorporate Income
Social Insurance and RetirementExcise Taxes
Other
Figure 4
Federal Government Receipts by Category (1948-2010)
SOURCE: Office of Management and Budget.

issue. Figure 4 presents five sources of government revenue as a percent of GDP since 1948.Although total revenue as a percent of GDP has remained relatively constant since 1950 (as notedabove), the figure shows the source of revenue has not. The federal government’s main sourcesof revenue are individual income tax receipts, payroll taxes (to fund mandatory programs suchas Social Security and Medicare), corporate income taxes, and excise taxes (such as those ongasoline or airfares). Individual income tax receipts and other tax receipts have been relativelyconstant—about 8 percent and 1 percent of GDP, respectively—but the other sources of revenuehave changed considerably. Corporate income and excise taxes declined until the mid-1980s andhave since remained relatively constant at about 2 percent and 1 percent of GDP, respectively.As these sources of revenue were declining, social insurance and retirement revenue increasedfrom about 1 percent of GDP in 1948 to nearly 7 percent of GDP in late 1988 and stabilized atabout that level.
The composition of government expenditures has also changed substantially. Figure 5 showsthe composition of government expenditures by category since 1948. Net interest expenses andother federal spending have fluctuated around 2 percent of GDP over the period. In contrast,after increasing dramatically during the Korean War, defense and international-related spend-ing has trended down and fluctuated in the range of 5 to 6 percent of GDP. Indeed, defensespending as a percent of GDP in 2010 (5.1 percent) is nearly identical to what it was in 1948 (5.3percent). The large spending increases occurred in mandatory outlays, more than half of whichis Social Security benefits and Medicare expenditures financed by payroll taxes paid by employ-
Kliesen and Thornton
26 January/February 2012 Federal Reserve Bank of St. Louis REVIEW
1948 1954 1960 1966 1972 1978 1984 1990 1996 2002 2008
18
16
14
12
10
8
0
Percent of GDP
Fiscal Years
Defense and International-RelatedNet Interest
MandatoryOther Federal
6
4
2
Figure 5
Federal Government Expenditures by Category (1948-2010)
SOURCE: Office of Management and Budget.

ees and employers.9 Mandatory spending increased from 3.5 percent of GDP in 1948 to nearly16 percent of GDP in 2010. Much of the recent increase appears to be associated with the surgein unemployment benefits in the wake of the financial crisis. From December 2007 to October2009, the unemployment rate rose from 5 percent to 10.1 percent. With a stubbornly high unem-ployment rate, Congress enacted several extensions of benefits for those unemployed beyondthe normal 26 weeks. However, even before the financial crisis, mandatory spending had risento 12 percent of GDP. Indeed, nearly all of the persistent deficits since 1971 can be attributed to(i) increased spending rather than a decline in revenue and (ii) the fact that the increased spend-ing is in the mandatory component.
THE ACCURACY OF THE CBO’S BUDGET PROJECTIONSThe government’s attempt to mitigate the effects of the financial crisis resulted in very large
deficits in 2009 and 2010: 9.9 percent and 8.9 percent of GDP, respectively. Despite a weaker-than-expected pace of economic growth in 2011, in its August update the CBO projected thatthe budget deficit would fall to 8.5 percent of GDP for 2011. As previously mentioned, the CBO’sJanuary 2011 baseline projection was that the budget deficit would rise to 9.8 percent of GDP in2011. This illustrates that reports issued less than a year apart can yield significantly differentprojections for the deficit.
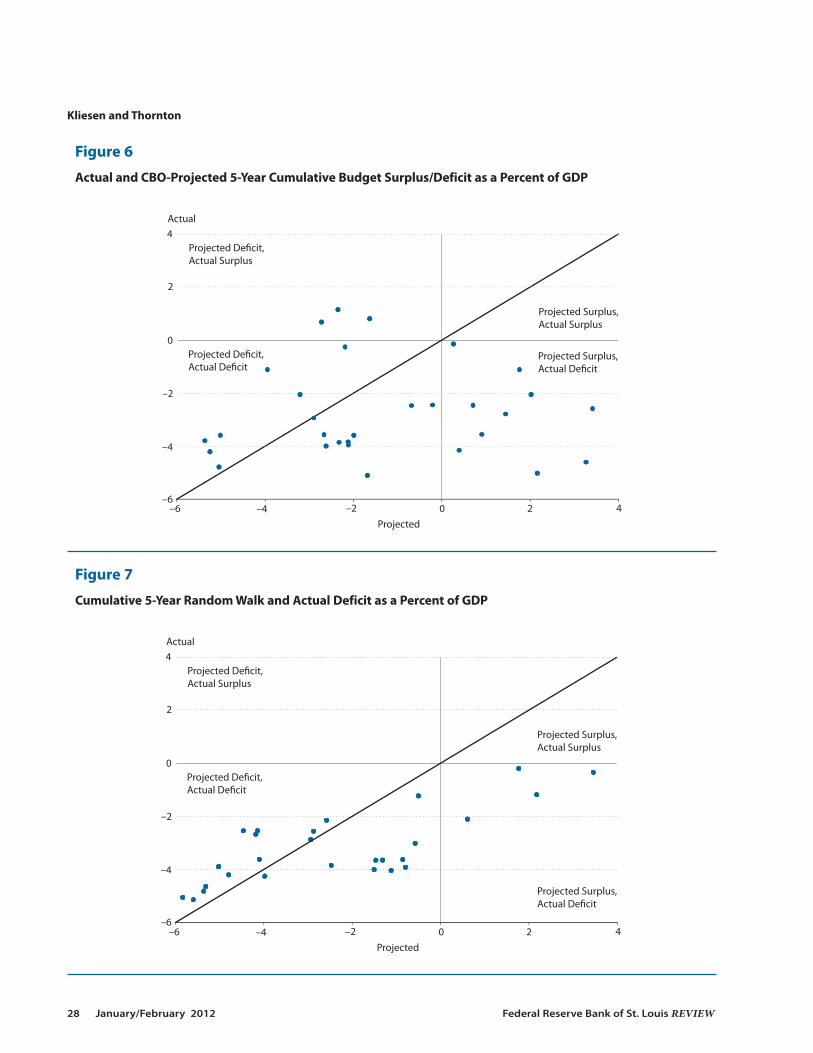
We provide some insight into the usefulness of these projections by examining the historicalaccuracy of the CBO’s baseline budget projections, which are typically published in January. Wedo not incorporate into our analysis the mid-term projections, which are typically published inthe summer about the same time as the Office of Management and Budget’sMid-Session Review.Our analysis focuses on 1-year-ahead projection errors and cumulative 5-year-ahead projectionerrors. Five years is a reasonable planning horizon for policymakers and a period over which pro-jections might be considered reliable. Figure 6 shows the actual and CBO-projected 5-year cumu-lative budget surplus/deficit as a percent of GDP. The 45-degree line denotes the points of equalitybetween the actual and projected outcomes. If the projections were accurate, all points would fallon the 45-degree line. Consistent with our 2001 analysis, Figure 6 shows that the 5-year cumula-tive projections are highly inaccurate: The average absolute projection error is 2.65 percent of GDP.Moreover, most observations lie below the 45-degree line (20 of the 30 observations are belowthe line), indicating a strong bias in underprojecting the deficit (overprojecting the surplus).
A common benchmark for evaluating forecast accuracy is to compare model-based forecastswith a simple random walk (RW) forecast. The latter assumes that next year’s value of the fore-casted series is equal to the current year’s value—that is, the series cannot be forecasted beyondits current value. We compare the accuracy of the CBO projections relative to the projectionerrors from a RW projection model. The RW model projects the cumulative 5-year budget bal-ance to be equal to the actual cumulative 5-year budget balance of the previous 5 years. In orderto be operational, the CBO would have had to have known the cumulative budget balance overthe past 5 years; however, for projections made in year t, the CBO would know only the cumula-tive 5-year budget in year t. Hence, the RW projections made in year t–1 are based on the actualcumulative 5-year budget through year t–1. For example, the RW cumulative 5-year deficit pro-jections made in 1976 (i.e., the cumulative 5-year deficit projections for the period 1977 through1981) are the actual cumulative 5-year deficit over the period 1971 through 1975.
Kliesen and Thornton
Federal Reserve Bank of St. Louis REVIEW January/February 2012 27
Kliesen and Thornton
28 January/February 2012 Federal Reserve Bank of St. Louis REVIEW
4
2
–2
–4
–6
0
Actual
Projected De�cit, Actual Surplus
Projected De�cit, Actual De�cit
Projected Surplus, Actual Surplus
Projected Surplus, Actual De�cit
–6 –4 –2 0 2 4Projected
Figure 7
Cumulative 5-Year Random Walk and Actual Deficit as a Percent of GDP
4
2
–2
–4
–6–6 –4 –2 0 2 4
0
Actual
Projected
Projected De�cit, Actual Surplus
Projected De�cit, Actual De�cit
Projected Surplus, Actual Surplus
Projected Surplus, Actual De�cit
Figure 6
Actual and CBO-Projected 5-Year Cumulative Budget Surplus/Deficit as a Percent of GDP
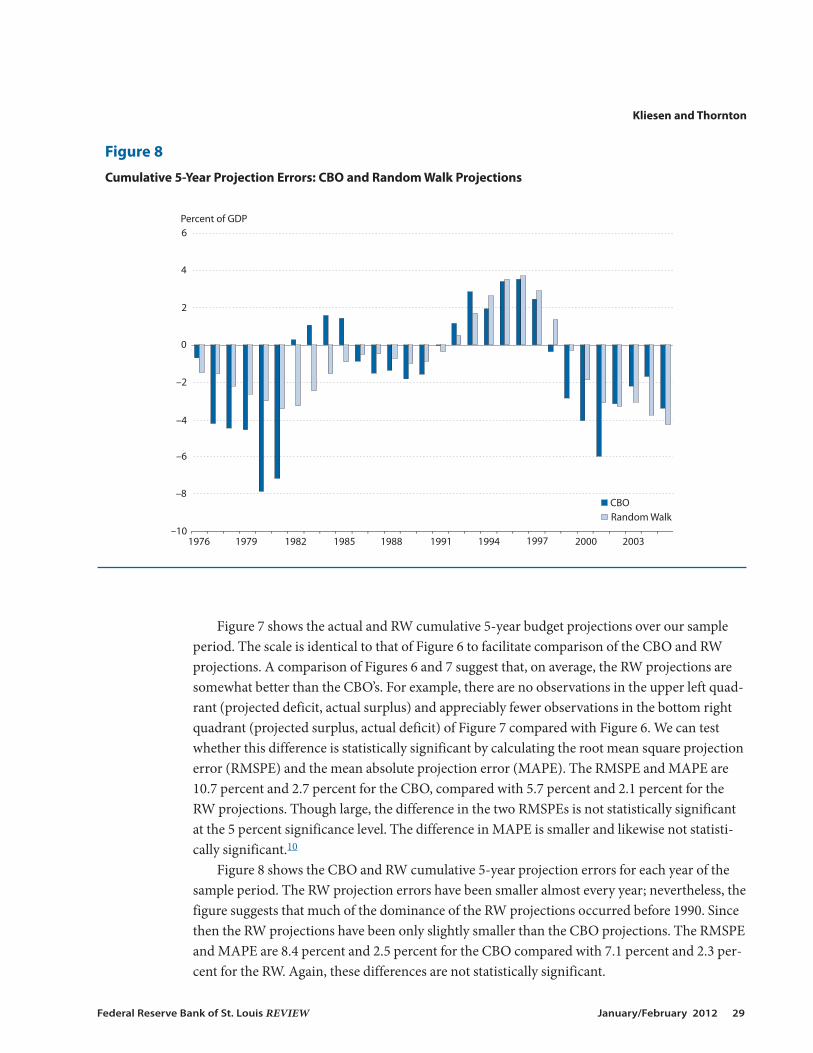
Figure 7 shows the actual and RW cumulative 5-year budget projections over our sampleperiod. The scale is identical to that of Figure 6 to facilitate comparison of the CBO and RWprojections. A comparison of Figures 6 and 7 suggest that, on average, the RW projections aresomewhat better than the CBO’s. For example, there are no observations in the upper left quad-rant (projected deficit, actual surplus) and appreciably fewer observations in the bottom rightquadrant (projected surplus, actual deficit) of Figure 7 compared with Figure 6. We can testwhether this difference is statistically significant by calculating the root mean square projectionerror (RMSPE) and the mean absolute projection error (MAPE). The RMSPE and MAPE are10.7 percent and 2.7 percent for the CBO, compared with 5.7 percent and 2.1 percent for theRW projections. Though large, the difference in the two RMSPEs is not statistically significantat the 5 percent significance level. The difference in MAPE is smaller and likewise not statisti-cally significant.10
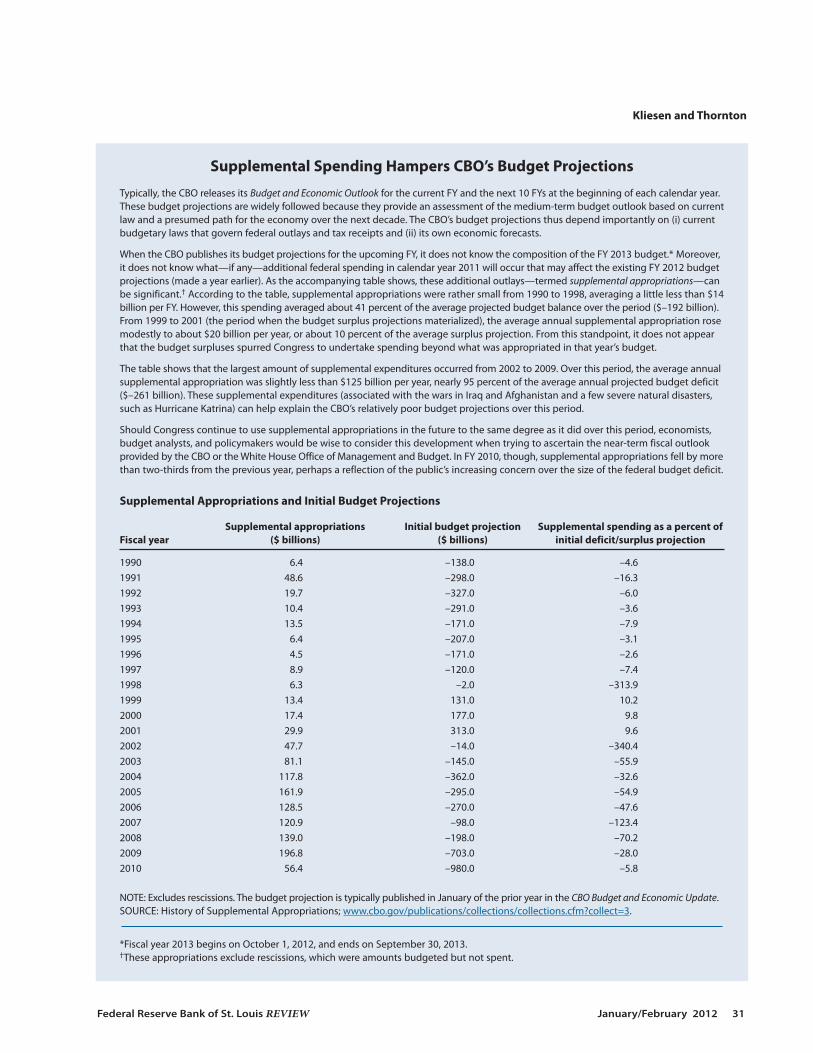
Figure 8 shows the CBO and RW cumulative 5-year projection errors for each year of thesample period. The RW projection errors have been smaller almost every year; nevertheless, thefigure suggests that much of the dominance of the RW projections occurred before 1990. Sincethen the RW projections have been only slightly smaller than the CBO projections. The RMSPEand MAPE are 8.4 percent and 2.5 percent for the CBO compared with 7.1 percent and 2.3 per-cent for the RW. Again, these differences are not statistically significant.
Kliesen and Thornton
Federal Reserve Bank of St. Louis REVIEW January/February 2012 29
6
4
2
0
–2
–4
–6
–8
–101976 1979 1982 1985 1988 1991 1994 1997 2000 2003
CBORandom Walk
Percent of GDP
Figure 8
Cumulative 5-Year Projection Errors: CBO and Random Walk Projections

Accuracy of CBO Projections One Year Ahead
Not surprisingly, the CBO’s 1-year-ahead projections are more accurate than the cumulative5-year projections. The relevant question, however, is this: Are they better than RW projections?Figure 9 shows the CBO and RW projection errors over the period 1976 though 2010. The figurestrongly suggests that even at the 1-year projection horizon the RW model’s projection errorsare smaller than the CBO’s. Indeed, the RMSPE and MAPE are 2.2 percent and 1.5 percent, and1.6 percent and 1.1 percent for the CBO and RW projections, respectively. These differences arerelatively small in absolute terms and are not statistically significant.
Of course, some of these differences are a consequence of the large errors made by the CBO(and other private forecasters) in the wake of the financial crisis. However, the RW projectionerrors are smaller than the CBO’s even over the period 1976 through 2007—the RMSPE andMAPE are 1.6 percent and 1.1 percent, and 1.1 percent and 0.9 percent, for the CBO and RWprojections, respectively. These results suggest that the CBO could have done as well by simplyassuming that next year’s budget surplus/deficit would be the same as last year’s.
It is reasonable to believe that the relatively poor performance of the CBO’s cumulative 5-yearprojections can be accounted for (i) by structural changes in the economy that are extremelydifficult—if not impossible—to predict or (ii) swings in the government’s tax and expenditurepolicy that are not accounted for in the baseline projections. However, the relatively poor per-formance of 1-year-ahead projections is more difficult to ascribe to such factors. More recently,
Kliesen and Thornton
30 January/February 2012 Federal Reserve Bank of St. Louis REVIEW
4
2
0
–2
–4
–6
–8
–101976 1980 1984 1988 1992 1996 2000 2004 2008
CBORandom Walk
Percent of GDP
Figure 9
One-Year Deficit Projection Errors as a Percent of GDP: CBO and Random Walk Projections
Kliesen and Thornton
Federal Reserve Bank of St. Louis REVIEW January/February 2012 31
Supplemental Spending Hampers CBO’s Budget Projections
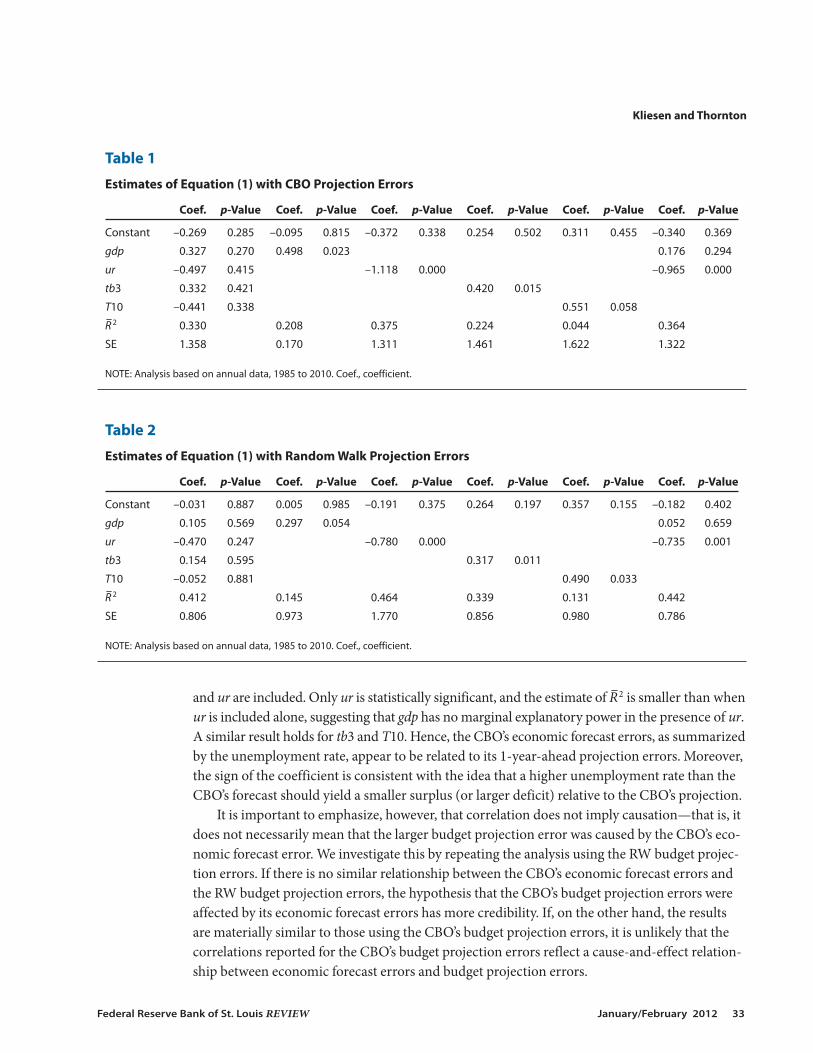
Typically, the CBO releases its Budget and Economic Outlook for the current FY and the next 10 FYs at the beginning of each calendar year.These budget projections are widely followed because they provide an assessment of the medium-term budget outlook based on currentlaw and a presumed path for the economy over the next decade. The CBO’s budget projections thus depend importantly on (i) currentbudgetary laws that govern federal outlays and tax receipts and (ii) its own economic forecasts.
When the CBO publishes its budget projections for the upcoming FY, it does not know the composition of the FY 2013 budget.* Moreover,it does not know what—if any—additional federal spending in calendar year 2011 will occur that may affect the existing FY 2012 budgetprojections (made a year earlier). As the accompanying table shows, these additional outlays—termed supplemental appropriations—canbe significant.† According to the table, supplemental appropriations were rather small from 1990 to 1998, averaging a little less than $14billion per FY. However, this spending averaged about 41 percent of the average projected budget balance over the period ($–192 billion).From 1999 to 2001 (the period when the budget surplus projections materialized), the average annual supplemental appropriation rosemodestly to about $20 billion per year, or about 10 percent of the average surplus projection. From this standpoint, it does not appearthat the budget surpluses spurred Congress to undertake spending beyond what was appropriated in that year’s budget.
The table shows that the largest amount of supplemental expenditures occurred from 2002 to 2009. Over this period, the average annualsupplemental appropriation was slightly less than $125 billion per year, nearly 95 percent of the average annual projected budget deficit($–261 billion). These supplemental expenditures (associated with the wars in Iraq and Afghanistan and a few severe natural disasters,such as Hurricane Katrina) can help explain the CBO’s relatively poor budget projections over this period.
Should Congress continue to use supplemental appropriations in the future to the same degree as it did over this period, economists,budget analysts, and policymakers would be wise to consider this development when trying to ascertain the near-term fiscal outlookprovided by the CBO or the White House Office of Management and Budget. In FY 2010, though, supplemental appropriations fell by morethan two-thirds from the previous year, perhaps a reflection of the public’s increasing concern over the size of the federal budget deficit.
Supplemental Appropriations and Initial Budget Projections
Supplemental appropriations Initial budget projection Supplemental spending as a percent of Fiscal year ($ billions) ($ billions) initial deficit/surplus projection
1990 6.4 –138.0 –4.61991 48.6 –298.0 –16.31992 19.7 –327.0 –6.01993 10.4 –291.0 –3.61994 13.5 –171.0 –7.91995 6.4 –207.0 –3.11996 4.5 –171.0 –2.61997 8.9 –120.0 –7.41998 6.3 –2.0 –313.91999 13.4 131.0 10.22000 17.4 177.0 9.82001 29.9 313.0 9.62002 47.7 –14.0 –340.42003 81.1 –145.0 –55.92004 117.8 –362.0 –32.62005 161.9 –295.0 –54.92006 128.5 –270.0 –47.62007 120.9 –98.0 –123.42008 139.0 –198.0 –70.22009 196.8 –703.0 –28.02010 56.4 –980.0 –5.8
NOTE: Excludes rescissions. The budget projection is typically published in January of the prior year in the CBO Budget and Economic Update.SOURCE: History of Supplemental Appropriations; www.cbo.gov/publications/collections/collections.cfm?collect=3.
*Fiscal year 2013 begins on October 1, 2012, and ends on September 30, 2013.†These appropriations exclude rescissions, which were amounts budgeted but not spent.

the CBO’s larger 1-year projections may also reflect, as noted in the shaded insert, the signifi-cant amount of supplemental expenditures after 2001.
The Sensitivity of CBO Projection Errors to Economic Shocks
This section investigates the sensitivity of CBO projection errors to economic shocks in twoways. First, we evaluate the CBO’s projection errors by excluding recession periods. It is reason-able to assume that the CBO’s near-term projection errors are heavily influenced by the behaviorof the economy. The difficulty in forecasting recessions is widely acknowledged and reflected inthe fact that nearly all U.S. recessions have been “called” several months after they actuallybegan.11 Hence, it is reasonable to assume that projection errors are considerably higher duringrecessions. To investigate the extent to which CBO projections are affected by recessions, wedeleted all years with a recession during any month of the projection year. Specifically, we deleted1980-82, 1990-91, 2001-02, and 2008-09. The RMSPE and MAPE for the non-recession yearsare 1.42 percent and 1.01 percent, respectively, smaller than the 1.58 percent and 1.48 percentfor the period 1976-2010. Indeed, the differences in the RMSPE and MAPE between recessionand non-recession years are highly statistically significant. The projections from the RW modelare also larger during recession years but the difference is not statistically significant.
In the process of making its budget projections, the CBO forecasts certain important eco-nomic variables. It is possible that the CBO’s budget errors are linked to its economic forecasterrors. For example, if real GDP growth is weaker than the CBO forecasted, the CBO budgetprojection could be lower than projected. We investigate this possibility by regressing the CBO’sbudget projection errors on its forecast errors for four economic variables over the same period:real GDP growth, the unemployment rate, the 3-month T-bill rate, and the 10-year Treasurybond yield. The CBO has published its forecasts for these variables since 1984. For example, inJanuary 1984 the CBO made economic forecasts for these variables for FY 1985. This forecast isthen compared with the FY 1985 actual estimate to determine the FY 1985 forecast error. Thesample period is too short to analyze the effects of forecast errors on the CBO’s 5-year cumulativeprojections. Consequently, our analysis focuses on the 1-year-ahead projections. The economicdata are based on FYs rather than calendar years. Specifically, we estimate
(1)
where CBOt denotes the CBO’s 1-year-ahead budget projection error for year t, and gdpt, urt,tb3t, and T10t denote the CBO’s 1-year ahead forecast errors for the growth rate of real GDP, theunemployment rate, the 3-month T-bill rate, and the 10-year Treasury bond yield, respectively.
The results are summarized in Table 1, which reports the estimated coefficients, their corre-sponding significance level (p-value), the estimate of the adjusted R2 (R–2), and the standard errorof the equation (SE). When all forecast errors are included, none of the coefficients is statisticallysignificant at any reasonable significance level; however, each coefficient is statistically signifi-cant at at least the 10 percent significance level when considered alone. The estimate of R–2 is verysmall for the T10 forecast errors and is largest for the unemployment rate. Indeed, none of theother coefficients is statistically significant when included with the unemployment rate. Thispoint is illustrated in the last two columns of the table, which show the results when both gdp
CBO gdp ur tb Tt t t t t t= + + + + +α δ δ δ δ ε1 2 3 43 10 ,
Kliesen and Thornton
32 January/February 2012 Federal Reserve Bank of St. Louis REVIEW
and ur are included. Only ur is statistically significant, and the estimate of R–2 is smaller than whenur is included alone, suggesting that gdp has no marginal explanatory power in the presence of ur.A similar result holds for tb3 and T10. Hence, the CBO’s economic forecast errors, as summarizedby the unemployment rate, appear to be related to its 1-year-ahead projection errors. Moreover,the sign of the coefficient is consistent with the idea that a higher unemployment rate than theCBO’s forecast should yield a smaller surplus (or larger deficit) relative to the CBO’s projection.
It is important to emphasize, however, that correlation does not imply causation—that is, itdoes not necessarily mean that the larger budget projection error was caused by the CBO’s eco-nomic forecast error. We investigate this by repeating the analysis using the RW budget projec-tion errors. If there is no similar relationship between the CBO’s economic forecast errors andthe RW budget projection errors, the hypothesis that the CBO’s budget projection errors wereaffected by its economic forecast errors has more credibility. If, on the other hand, the resultsare materially similar to those using the CBO’s budget projection errors, it is unlikely that thecorrelations reported for the CBO’s budget projection errors reflect a cause-and-effect relation-ship between economic forecast errors and budget projection errors.
Kliesen and Thornton
Federal Reserve Bank of St. Louis REVIEW January/February 2012 33
Table 1
Estimates of Equation (1) with CBO Projection Errors
Coef. p-Value Coef. p-Value Coef. p-Value Coef. p-Value Coef. p-Value Coef. p-Value
Constant –0.269 0.285 –0.095 0.815 –0.372 0.338 0.254 0.502 0.311 0.455 –0.340 0.369
gdp 0.327 0.270 0.498 0.023 0.176 0.294
ur –0.497 0.415 –1.118 0.000 –0.965 0.000
tb3 0.332 0.421 0.420 0.015
T10 –0.441 0.338 0.551 0.058
R–2 0.330 0.208 0.375 0.224 0.044 0.364
SE 1.358 0.170 1.311 1.461 1.622 1.322
NOTE: Analysis based on annual data, 1985 to 2010. Coef., coefficient.
Table 2
Estimates of Equation (1) with Random Walk Projection Errors
Coef. p-Value Coef. p-Value Coef. p-Value Coef. p-Value Coef. p-Value Coef. p-Value
Constant –0.031 0.887 0.005 0.985 –0.191 0.375 0.264 0.197 0.357 0.155 –0.182 0.402
gdp 0.105 0.569 0.297 0.054 0.052 0.659
ur –0.470 0.247 –0.780 0.000 –0.735 0.001
tb3 0.154 0.595 0.317 0.011
T10 –0.052 0.881 0.490 0.033
R–2 0.412 0.145 0.464 0.339 0.131 0.442
SE 0.806 0.973 1.770 0.856 0.980 0.786
NOTE: Analysis based on annual data, 1985 to 2010. Coef., coefficient.
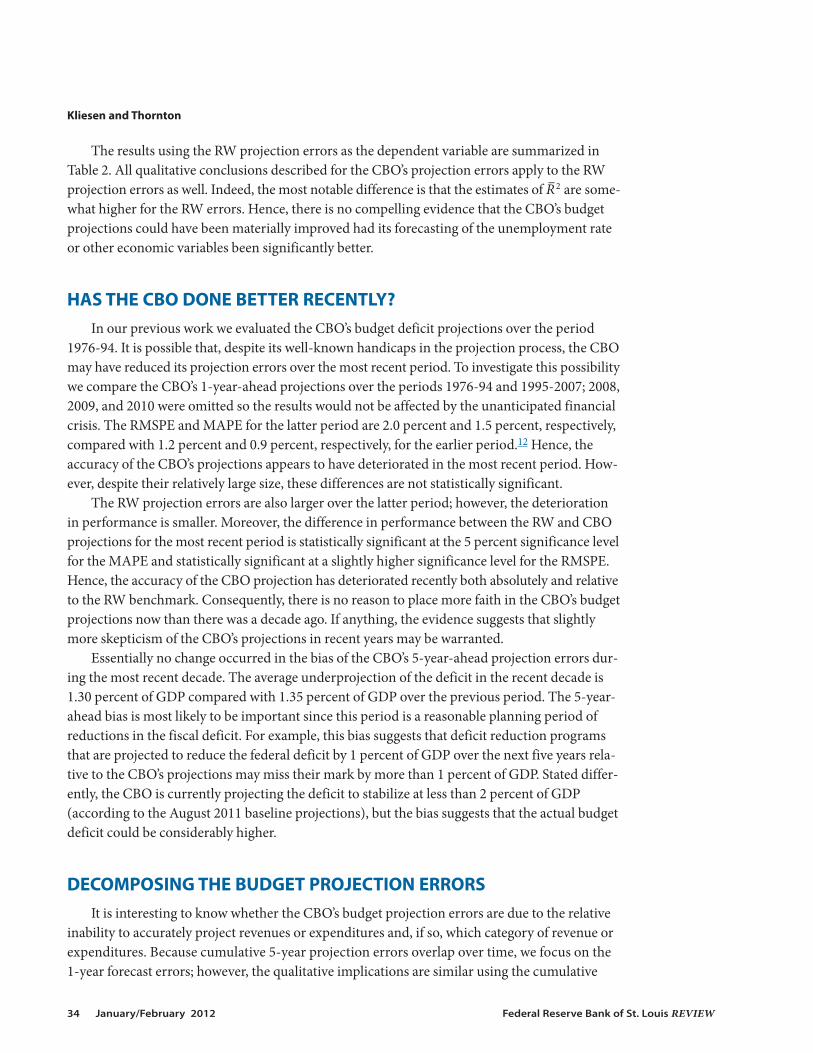
The results using the RW projection errors as the dependent variable are summarized inTable 2. All qualitative conclusions described for the CBO’s projection errors apply to the RWprojection errors as well. Indeed, the most notable difference is that the estimates of R–2 are some-what higher for the RW errors. Hence, there is no compelling evidence that the CBO’s budgetprojections could have been materially improved had its forecasting of the unemployment rateor other economic variables been significantly better.
HAS THE CBO DONE BETTER RECENTLY?In our previous work we evaluated the CBO’s budget deficit projections over the period
1976-94. It is possible that, despite its well-known handicaps in the projection process, the CBOmay have reduced its projection errors over the most recent period. To investigate this possibilitywe compare the CBO’s 1-year-ahead projections over the periods 1976-94 and 1995-2007; 2008,2009, and 2010 were omitted so the results would not be affected by the unanticipated financialcrisis. The RMSPE and MAPE for the latter period are 2.0 percent and 1.5 percent, respectively,compared with 1.2 percent and 0.9 percent, respectively, for the earlier period.12 Hence, theaccuracy of the CBO’s projections appears to have deteriorated in the most recent period. How -ever, despite their relatively large size, these differences are not statistically significant.
The RW projection errors are also larger over the latter period; however, the deteriorationin performance is smaller. Moreover, the difference in performance between the RW and CBOprojections for the most recent period is statistically significant at the 5 percent significance levelfor the MAPE and statistically significant at a slightly higher significance level for the RMSPE.Hence, the accuracy of the CBO projection has deteriorated recently both absolutely and relativeto the RW benchmark. Consequently, there is no reason to place more faith in the CBO’s budgetprojections now than there was a decade ago. If anything, the evidence suggests that slightlymore skepticism of the CBO’s projections in recent years may be warranted.
Essentially no change occurred in the bias of the CBO’s 5-year-ahead projection errors dur-ing the most recent decade. The average underprojection of the deficit in the recent decade is1.30 percent of GDP compared with 1.35 percent of GDP over the previous period. The 5-year-ahead bias is most likely to be important since this period is a reasonable planning period ofreductions in the fiscal deficit. For example, this bias suggests that deficit reduction programsthat are projected to reduce the federal deficit by 1 percent of GDP over the next five years rela-tive to the CBO’s projections may miss their mark by more than 1 percent of GDP. Stated differ-ently, the CBO is currently projecting the deficit to stabilize at less than 2 percent of GDP(according to the August 2011 baseline projections), but the bias suggests that the actual budgetdeficit could be considerably higher.
DECOMPOSING THE BUDGET PROJECTION ERRORSIt is interesting to know whether the CBO’s budget projection errors are due to the relative
inability to accurately project revenues or expenditures and, if so, which category of revenue orexpenditures. Because cumulative 5-year projection errors overlap over time, we focus on the1-year forecast errors; however, the qualitative implications are similar using the cumulative
Kliesen and Thornton
34 January/February 2012 Federal Reserve Bank of St. Louis REVIEW

5-year projection errors. Figure 10 shows the CBO’s revenue and expenditure projection errorsas a percent of GDP. The expenditure errors are plotted on the horizontal axis, while the revenueerrors are plotted on the vertical axis. Points on or near the 45-degree line denote years in whichthe CBO did a good job of projecting both revenues and expenditures. Points near the horizontalzero line denote years when the CBO did a relatively good job of projecting revenues, while pointsnear the vertical zero line denote years when the CBO did a relatively good job of projectingexpenditures. Points in the upper left quadrant of the figure indicate years when the CBO under-projected revenue and overprojected expenditures; points in the lower right quadrant indicatethe reverse.
While it is not obvious from the figure, on average the CBO did somewhat better in project-ing expenditures. The MAPE is 1.14 percent and 0.76 percent for revenue and expenditure,respectively. The RMSPE is 1.58 percent and 1.04 percent, respectively. Hence, even though therelatively large and persistent deficits since the early 1970s are due to an increase in expendituresover revenue, the CBO budget projection errors are somewhat larger for revenue. Indeed, theperformance difference is statistically significant at the 5 percent level for the RMSPE, but notfor the MAPE. It is important to note, however, that the difference in revenue versus expendi-ture projection performance over the sample period is the consequence of the unusually largerevenue errors associated with the recent recession. When 2008 and 2009 are deleted, the differ-
Kliesen and Thornton
Federal Reserve Bank of St. Louis REVIEW January/February 2012 35
4
2
–2
–4
–6
0
6
–6 –4 –2 0 2 4Expenditure Error
6
Revenue Error
Actual Revenue > Projected RevenueActual Expenditure < Projected Expenditure
Actual Revenue < Projected RevenueActual Expenditure < Projected Expenditure
Actual Revenue > Projected RevenueActual Expenditure > Projected Expenditure
Actual Revenue < Projected RevenueActual Expenditure > Projected Expenditure
Figure 10
CBO Revenue and Expenditure Projection Errors as a Percent of GDP

ences in these performance measures are small and not statistically significant at any reasonablesignificance level.
The Sources of Revenue and Expenditure Errors
In this section, we investigate the sources of the revenue and expenditure projection errorsby examining the CBO’s projection errors for the major categories of revenues and expenditures.Specifically, we regressed the CBO’s revenue and expenditure projection errors on three mainsources of revenue and expenditures. The revenue sources are individual income taxes (IND),corporate income taxes (CORP), and social insurance taxes (SI). The expenditure sources aremandatory spending (MAN), discretionary spending (DISC), and defense spending (DEF).Regression analysis is frequently used to make statistical inferences, so it is important to empha-size that the statistics presented here are merely descriptive.
The results are summarized in Table 3. The results for the revenue error regressions arereported in the upper half of the table. The three sources of revenue errors account for 98 per-cent of the CBO’s total revenue projection errors. However, only the coefficients on the INDand CORP are statistically significant. While each component accounts for a relatively largepercentage of the CBO’s revenue projection errors, errors in projecting individual tax returnsappear to be the most important source of error: This error alone accounts for nearly 97 percentof the total revenue projection errors. In contrast, corporate taxes alone account for only about33 percent of the variation in revenue errors, and social insurance projection errors account foreven less: about 24 percent.
Kliesen and Thornton
36 January/February 2012 Federal Reserve Bank of St. Louis REVIEW
Table 3
Regression Analysis of the CBO’s Cumulative 5-Year Revenue and Expenditure Projection Errors
Coef. p-Value Coef. p-Value Coef. p-Value Coef. p-Value
Revenue equation
Constant –0.015 0.521 –0.068 0.392 –0.077 0.756 –0.312 0.298
IND 1.222 0.000 1.471 0.000
CORP 0.855 0.000 2.673 0.000
SI 0.153 0.201 1.493 0.229
R–2 0.978 0.942 0.550 0.125
SE 0.231 0.373 1.042 1.452
Expenditure equation
Constant 0.788 0.000 0.798 0.000 –0.057 0.801 –0.008 0.969
MAN 0.900 0.000 0.922 0.000
DISC 0.678 0.003 1.646 0.002
DEF –1.023 0.000 2.005 0.054
R–2 0.942 0.916 0.395 0.202
SE 0.253 0.306 0.820 0.941
NOTE: Number of observations is 30.
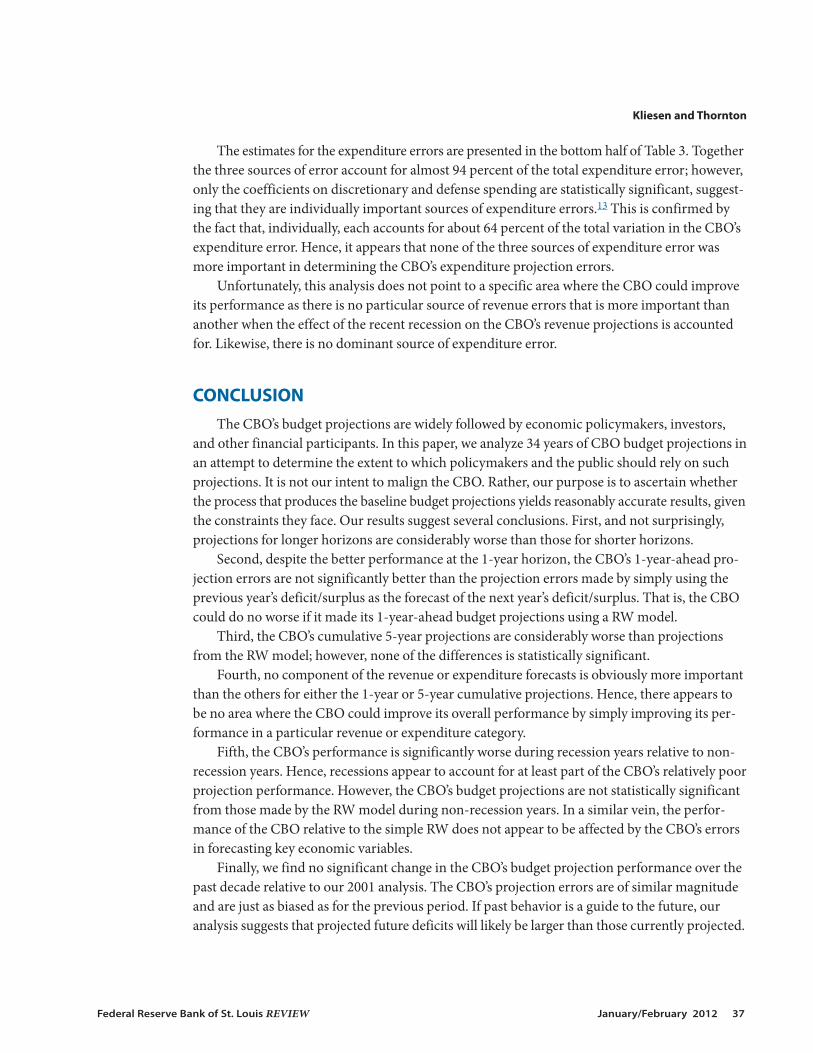
The estimates for the expenditure errors are presented in the bottom half of Table 3. Togetherthe three sources of error account for almost 94 percent of the total expenditure error; however,only the coefficients on discretionary and defense spending are statistically significant, suggest-ing that they are individually important sources of expenditure errors.13 This is confirmed bythe fact that, individually, each accounts for about 64 percent of the total variation in the CBO’sexpenditure error. Hence, it appears that none of the three sources of expenditure error wasmore important in determining the CBO’s expenditure projection errors.
Unfortunately, this analysis does not point to a specific area where the CBO could improveits performance as there is no particular source of revenue errors that is more important thananother when the effect of the recent recession on the CBO’s revenue projections is accountedfor. Likewise, there is no dominant source of expenditure error.
CONCLUSIONThe CBO’s budget projections are widely followed by economic policymakers, investors,
and other financial participants. In this paper, we analyze 34 years of CBO budget projections inan attempt to determine the extent to which policymakers and the public should rely on suchprojections. It is not our intent to malign the CBO. Rather, our purpose is to ascertain whetherthe process that produces the baseline budget projections yields reasonably accurate results, giventhe constraints they face. Our results suggest several conclusions. First, and not surprisingly,projections for longer horizons are considerably worse than those for shorter horizons.
Second, despite the better performance at the 1-year horizon, the CBO’s 1-year-ahead pro-jection errors are not significantly better than the projection errors made by simply using theprevious year’s deficit/surplus as the forecast of the next year’s deficit/surplus. That is, the CBOcould do no worse if it made its 1-year-ahead budget projections using a RW model.
Third, the CBO’s cumulative 5-year projections are considerably worse than projectionsfrom the RW model; however, none of the differences is statistically significant.
Fourth, no component of the revenue or expenditure forecasts is obviously more importantthan the others for either the 1-year or 5-year cumulative projections. Hence, there appears tobe no area where the CBO could improve its overall performance by simply improving its per-formance in a particular revenue or expenditure category.
Fifth, the CBO’s performance is significantly worse during recession years relative to non-recession years. Hence, recessions appear to account for at least part of the CBO’s relatively poorprojection performance. However, the CBO’s budget projections are not statistically significantfrom those made by the RW model during non-recession years. In a similar vein, the perfor -mance of the CBO relative to the simple RW does not appear to be affected by the CBO’s errorsin forecasting key economic variables.
Finally, we find no significant change in the CBO’s budget projection performance over thepast decade relative to our 2001 analysis. The CBO’s projection errors are of similar magnitudeand are just as biased as for the previous period. If past behavior is a guide to the future, ouranalysis suggests that projected future deficits will likely be larger than those currently projected.
Kliesen and Thornton
Federal Reserve Bank of St. Louis REVIEW January/February 2012 37
NOTES1 See Peach and Steindel (2000). It is important to note that at the time, long-run budget projections continued to show
increasingly large deficits owing to future unfunded liabilities of the federal government’s two main retirement programs(Social Security and Medicare).
2 See Meyer (2000).
3 The CBO also presents alternative projections, but these are also dependent on scenarios that may not occur. For example,the CBO regularly publishes projections based on the administration’s annual budget and long-term budget projectionsbased on alternative scenarios. Regarding the latter, see CBO (2011b).
4 The Budget Control Act of 2011 also included a $2.1 trillion extension of the Treasury debt ceiling. See CBO (2011a).
5 For the past several years, the CBO has regularly published an assessment of its economic forecasts. See, for example, theJuly 2010 report (www.cbo.gov/ftpdocs/115xx/doc11553/ForecastingAccuracy.pdf).
6 Indeed, the rolling correlation coefficients in a 10-year window between the two series averaged 0.4 from 1956 to 1975 andthen –0.4 from 1976 to 2010.
7 PAYGO was initially enacted into law in 1990 as an amendment to the Deficit Control Act. Its purpose was to ensure that newlaws changing mandatory expenditures or revenues were deficit neutral. See Heniff and Keith (2004) for a summary of vari-ous budget reform measures.
8 The cyclically adjusted budget measure is an attempt to determine how much of the deficit/surplus is due to business cycleeffects that raise or lower outlays and revenues. For a discussion of the methodology, see CBO (2008).
9 Most economists believe that the burden of the payroll tax (incidence) falls almost entirely on the employee.
10 The test of the statistical significance of the difference between the CBO and RW projection errors is obtained by regressingthe difference between the CBO and RW squared projection error (or absolute projection error) on a constant and testingthe hypothesis that the constant term is zero. The regression used heteroskedasticity autocorrelation-consistent estimatesof the standard error.
11 Since 1980, the National Bureau of Economic Research Business Cycle Dating Committee has, on average, announced thedate of the beginning (peak) or end (trough) of the recession nine months after the determined date of occurrence. This laglength has varied from 6 to 12 months for these 9 episodes.
12 The results not excluding 2007-10 are larger: 3.0 percent and 2.2 percent, respectively.
13 The negative coefficient on defense spending suggests that, conditional on the other two sources of expenditure errors, theerror in defense spending reduces the total expenditure error. This result is likely a consequence of the correlation betweenthe errors. The correlations between DEF and MAN and DISC are 57 percent and 77 percent, respectively. In any event, asTable 3 shows, omitting the others results in a positive correlation between errors and defense spending and total expendi-ture errors.
REFERENCESCongressional Budget Office. The Cyclically Adjusted and Standardized Budget Measures. A CBO Report, April 2008;
www.cbo.gov/ftpdocs/90xx/doc9074/04-18-StandBudget.pdf.
Congressional Budget Office. CBO’s Economic Forecasting Record. A CBO Report, July 2010;www.cbo.gov/ftpdocs/115xx/doc11553/ForecastingAccuracy.pdf.
Congressional Budget Office. The Budget and Economic Outlook: An Update. A CBO Report, August 2011a; www.cbo.gov/ftpdocs/123xx/doc12316/08-24-BudgetEconUpdate.pdf.
Congressional Budget Office. CBO’s 2011 Long-Term Budget Outlook. A CBO Report, June 2011b;www.cbo.gov/ftpdocs/122xx/doc12212/06-21-Long-Term_Budget_Outlook.pdf.
Congressional Budget Office. The Budget and Economic Outlook. A Report to the Senate and House Committees on theBudget, various issues; http://www.cbo.gov/publications/bysubject.cfm?cat=0.
Heniff, Bill Jr. and Keith, Robert. “Federal Budget Process Reform: A Brief Overview.” CRS Report for Congress. CongressionalResearch Service, Library of Congress, July 8, 2004; www.fas.org/sgp/crs/RS21752.pdf.
Kliesen and Thornton
38 January/February 2012 Federal Reserve Bank of St. Louis REVIEW

Kliesen, Kevin L. and Thornton, Daniel T. “The Expected Federal Budget Surplus: How Much Confidence Should the Public andPolicymakers Place in the Projections?” Federal Reserve Bank of St. Louis Review, March/April 2001, 83(2), pp. 11-24;www.research.stlouisfed.org/publications/review/01//03/0103kk.pdf.
Meyer, Laurence H. “How Does a Surplus Affect the Formulation and Conduct of Monetary Policy?” Remarks before the 16thAnnual Policy Conference of the National Association for Business Economics, Washington, DC, February 23, 2000;www.federalreserve.gov/boarddocs/speeches/2000/20000223.htm.
Peach, Richard and Steindel, Charles. “Summary of Observations and Recommendations.” Presented at the Federal ReserveBank of St. Louis conference, Fiscal Policy in an Era of Surpluses: Economic and Financial Implications, April 2000, pp. 1-3.
Kliesen and Thornton
Federal Reserve Bank of St. Louis REVIEW January/February 2012 39

40 January/February 2012 Federal Reserve Bank of St. Louis REVIEW

Recent Research“FOMC Learning and Productivity Growth (1985-2003): A Reading of the Record,” Federal Reserve Bank of St. Louis Review, March/April 2010, 92(2), pp. 129-54.
“Using Brent and WTI Oil Prices to Predict Gasoline Prices,” Federal Reserve Bank of St. Louis Economic Synopses,2011, No. 36.
“Do Oil Shocks Drive Business Cycles? Some U.S. and International Evidence,” Macroeconomic Dynamics(forthcoming).
Kevin L. KliesenBusiness economist for the Supervisory Policy and Risk Analysis Unit,Federal Reserve Bank of St. Louis
http://research.stlouisfed.org/econ/kliesen/kkwp.html
Research FocusKevin Kliesen’s research focuses on the analysis of macroeconomic conditions,the e�ects of energy prices on the economy, labor productivity, and �scal policy;he also provides reports on economic and business conditions to assist the Bankpresident and Board of Directors.
Recent Research“The E�ectiveness of Unconventional Monetary Policy: The Term Auction Facility,” Federal Reserve Bank of St. Louis Review, November/December 2011, 93(6), pp. 439-54.
“The FOMC’s Interest Rate Policy: How Long Is the Long Run?” Federal Reserve Bank of St. Louis EconomicSynopses, 2011, No. 29.
“A Perspective on Financial Market Reform,” International Center for Banking and Corporate Governance, 2010.
“The Unusual Behavior of the Federal Funds Rate and Treasury Yields: A Conundrum or an Instance ofGoodhart’s Law?” Federal Reserve Bank of St. Louis Working Paper 2007-039C, updated August 2010.
Daniel L. ThorntonVice president and economic adviser, Federal Reserve Bank of St. Louis
http://research.stlouisfed.org/econ/thornton/
Research FocusDan Thornton analyzes �nancial markets, interest rates, and monetary policy—most recently, the Fed’s policy innovations of quantitative easing and the TermAuction Facility in the wake of the �nancial crisis.
Back