how honeybees perceive communication dances, studied by means of a mechanical model
TRANSCRIPT

Behav Ecol Sociobiol (1992) 30:143-150 Behavioral Ecology and Sociobiology © Springer-Verlag 1992
How honeybees perceive communication dances, studied by means of a mechanical model Axel Michelsen 1, Bent Bach Andersen 1, Jesper Storm 1, Wolfgang H. Kirchner 2, and Martin Lindaner 2
1 Institute of Biology, Odense University, DK-5230 Odense M, Denmark 2 Lehrstuhl fiir Zoologic II, Wtirzburg University, Am Hubland, W-8700 Wtirzburg, Federal Republic of Germany
Received April 8, 1991 / Accepted November 1, 1991
Summary. A mechanical model of a dancing honeybee was used to investigate the role of various components of the wagging dance in the transfer of information to follower bees. The model simulates the dance, carries a scent, and has an acoustic near-field similar to that of live dancers. The movements of the model are con- trolled by a computer, and selected components of the dance can be manipulated independently of others. The number of bees approaching scented baits at various distances and directions from the hive was observed, both during simulated "normal" dances and dances in which different components provided potentially con- flicting information about the location of the food. The results indicate that the wagging run is the" master com-
p o n e n t " of the dance. The figure-of-eight dance path does not seem to convey information. Both sound and wagging must be present in the dance, but no specific roles were found for these components. Both sound and wagging convey information about distance and direc- tion, and they appear to be largely redundant.
Introduction
Honeybee (Apis mellifera) workers can inform their nest- mates of the distance and direction of food sources by means of wagging dances performed on the vertical combs in the hive (von Frisch 1965). The direction of the wagging run (in which the dancer wags her body from side to side and emits sounds) indicates the direc- tion to the food, such that upward on the comb signifies the azimuth of the sun in the field. After each wagging run, the dancer circles back to her starting point (the return run, see Fig. 2A). It is not known whether the bees perceive the orientation of the entire dance path or one of its components. The distance to the food source is correlated with several components of the dance (duration of wagging run, duration of return run,
Offprint requests to: A. Michelsen
duration of sound, number of waggles), and it is not known which of these components serves as the distance signal. The profitability of the food is also correlated with several dance components, but no signal function has been demonstrated.
It is also not known how dance followers detect the dancer's movements in the darkness of the hive, where visual cues cannot be used. Recent evidence suggests that sounds produced by the dancer's wings are impor- tant (Michelsen et al. 1987). The dancer vibrates her wings with a frequency of 200-300 Hz and a peak veloci- ty of approximately 1 m/s, thereby causing a sound pres- sure of approximately 1 Pa at the surfaces of the wings. The vibrating wings act as a dipole emitter: the sound pressures at the upper and lower surfaces of the wings are totally out of phase, and the large pressure gradients cause oscillating air currents close to the abdomen of the dancing bee (but not around the head and thorax). The air currents decrease rapidly with distance. Most of the follower bees hold their antennae near the dancer in the zone of maximum velocity of the oscillating air currents, which have components in all three directions (Michelsen et al. 1987).
In view of these observations, we hypothesized that the follower bees perceive the information in the dance by using their antennae to detect the oscillating flows of air around the dancer (Michelsen et al. 1987). Subse- quently, it was demonstrated that honeybees can be con- ditioned to respond to and discriminate between such air currents (Towne and Kirchner 1989), and that the amplitude of the signals emitted in the dance language is 5-10 times higher than the behavioural threshold (Kirchner et al. 1991).
The aim of this study was to investigate the percep- tion of the dance using a mechanical model of a dancing honeybee to communicate with the bees. Several earlier attempts to recruit bees by means of models have been unsuccessful (see Discussion). Our model differs from previous ones by having oscillatory air currents similar to those of a live dancer. Some preliminary results have been published (Michelsen et al. 1989, 1990).

144
c -g
B
D ~L F=
A
Fig. 1. Above: the mechanical model surrounded by follower bees during the performance of a wagging run. Below: the mechanical model (not to scale). The X-Y recorder (A) makes the figure-of- eight dance path. One stepper motor (B) turns the model (during the figure-of-eight and wagging). Another stepper motor (C) con- nected to a syringe (S) pumps scented sugar water through a soft tube to the front end of the model. An electromagnetic driver (D) moves the model's wing (E)
Methods
The mechanical model
The model (Fig. 1) was made of brass covered with a thin layer of beeswax. It was the same length (13 man) as a worker honeybee, but somewhat broader (5 ram). The wings were simulated by a single piece of razorblade glued at one end to a tiny spindle held by two jewel bearings. The "wing" was flush with the upper surface of the anterior part of the model. The posterior part of the wing was 2 mm above the abdomen. The wing was vibrated dorsoven- trally by a stiff wire connected to an electromagnetic driver (from a bone-conduction hearing aid). Measurements with probe micro- phones (see Michelsen et al. 1987) showed that the vibrations of the wing caused an acoustic near-field around the model similar to that around live dancers.
A thin rod was fixed to the "dorsa l" surface of the model. A stepper motor attached to the far end of the rod rotated the model during the figure-of-eight path and also caused the model to waggle during the wagging run. (The stepper motor was of the hybrid type and had an angular resolution of 1.8 °. A powerful
motor was required to drive the wagging movements, but it had to be damped by an adjustable frictional brake to avoid overshoot- ing.) An X-Y plotter (Watanabe WX4401) connected to a metal sleeve around the rod moved the model in a figure-of-eight path similar to that of a real dancer. Finally, a tiny plastic tube ending near the "head" of the model delivered food samples (scented sugar water) from a syringe under control of a second stepper motor.
The electromagnetic driver that moved the wing was driven by a power amplifier (Xelex DD50) which received signals from a multifunction synthesizer (HP8904A). The two stepper motors and the X-Y plotter were interfaced to and controlled by a com- puter (Toshiba T3200). All the dance components could be con- trolled through the software (a highly structured program written in Turbo Pascal and designed to be modified). This made it possible to vary the individual dance components independently and to create dances other than the normal waggle dance.
Some of the dance components were kept constant regardless of the target distance. The dance sound measured just above the wing had an amplitude of l Pa around 280 Hz and was presented at 40 pulses per second during the wagging run, each pulse having a duration of 11 ms (3 waves of a 280 Hz carrier). During wagging the model was rotated back and forth around the centre of the " thorax" at a frequency of 13 Hz and a peak amplitude of 30 degrees. The length of the wagging run was 10 mm. At 3-min inter- vals the computer calculated the sun's azimuth and adjusted the direction of the wagging run to compensate for the (apparent) movement of the sun. The model did not respond to the bees' begging signals (see Michelsen et al. 1986), but after each tenth complete figure-of-eight path it stopped and offered a drop of scented sugar water from the tube at its "head" .
Other dance components were varied with distance and with the intention of the experiment. In the experiments designed to imitate normal waggle dances, the dance path and the duration of the individual dance components were very close to those ob- served in live dancers of carniea bees. In other experiments, the dance path or the durations of some components were changed, thus providing the bees with potentially conflicting information about the location of the target.
The experiments. All experiments were performed near Wiirzburg, Germany, at two different locations during August 1989, 1990 and 1991. The model was deployed on the lower comb close to the entrance of a two-comb observation hive with a small family of bees (Apis mellifera carnica). Prior to the experiments the model was placed in the hive for 12 h so that its wax coating acquired the colony's odour (without this procedure the model was liable to be attacked by the bees). During each experimental session (of 3 h duration) the wax on the model was given an additional faint scent which was not familiar to the bees (e.g. peppermint, thyme, orange). A new scent was selected for each experiment. The scent was also added in minute quantities to the sugar water (20 gl of floral oil in 50 ml of 2 M sugar solution).
Baits were placed at various locations in the field. A glass jar covered with a metal mesh was placed on a 20 c m x 20 cm table on the ground. The jar contained an open micro test tube (Eppen- doff) with 20 gl of pure floral oil absorbed on a small piece of filter paper, and each hour a new air-tight test tube was opened. [See von Frisch (1965) for details of the art of using scented baits and its many pitfalls.]
At each location an observer noted the number of honeybees approaching the bait and showing the behaviour typical of a bee searching for a scented target (circling around the bait and occa- sionally landing on the bait). The bees did not receive food at the baits (to be certain of avoiding dances by returning bees), and they were not caught. It is possible, therefore, that some bees may have made two or more approaches at the same or at different locations. The bees in our colony were not marked, but only a few bees visited the baits during control experiments (see below). The strength and direction of the wind and other details of the weather were noted.

A B
C D
E F
G
Fig. 2A-G. Seven dance patterns tested in the experiments with the model dancing bee. Wagging and sound emission by the vibrat- ing wing are indicated by a zigzag line and by a series of dots, respectively. A A normal wagging dance. B, C Dances with two and one displaced wagging runs, respectively. The wagging run(s) and the dance path indicate opposite directions. D Wagging of long duration (corresponding to a distance of 1500 m from the hive) combined with sound emission of short duration (correspond- ing to 250 m). E The opposite of D. F A dance with wagging during the wagging run and sound emission during a part of the return run. G The opposite of F
145
60
5o A 4o
3O
20
~ 10 .~ ~ ~ ~ ~ ~ ~ , ~ ~ ~
~ 70 [- I~ Normal dance; 250 m ~ 60 _ D [~] N=95
~_ ~ ~,000 m: ~ N = 8~ ~ 50 - ~ 40 ~ " 4%&7%
~ 30 ~ ~
z ~o ~ o~ ~::~ ~ . . . . ~ ~ ~
~ C co~t~al ~ ~ = ~o
10 ~ N = 5
0 ~ ~ * ~ * * ~ ~ ~ ~ * * * * * *
100 250 500 750 1 ,000 1 ,250 1,500
Normal dance; 1,500 m [] N=45
~- 1 ,000m: [ ] N=@4
20% & 36%
Distance from the hive (m)
Fig. 3A, B. Experiments testing the transfer of information about distance. Bars indicate the number of bees observed at each of the baits at seven distances from the hive in the direction indicated by the model dancer. In two experiments the model bee indicated a distance of 1500 m (A), in two experiments a distance of 250 m (B). Note that although most bees searched close to the hive (see Discussion), different percentages of bees were observed at 1000- 1500 m. C Two control experiments in which the bees were fed scented sugar water from a motionless model bee
In some experiments the transfer of information concerning direction and distance by normal wagging dances (Fig. 2A) were measured. The distribution of bees at the different baits was used as a reference for the experiments with manipulated dances, in which the bees were given potentially conflicting instructions as to where to fly (Fig. 2, B-G). Some manipulated dances provided the bees with conflicting information about direction (B, C, F, G), whereas others provided conflicting information about distance (D, E). This was also the case with dances (not shown in Fig. 2) in which the durations of the wagging run and of the return run corresponded to two different distances.
Collection and statistical handling of data, In the experiments de- signed to test the transfer of directional information, eight baits were placed at a distance of 370 m from the hive and evenly spaced (45 ° apart). Most experiments lasted 3 h. The results were evaluated by appropriate tests for circular statistics (Batschelet 1981). The length and direction of the mean vector were calculated and used for testing the null hypothesis that the data were not directional (Rayleigh test).
In the experiments on the transfer of distance information, sev- en baits were placed in the direction indicated by the model and at distances of 100, 250, 500, 750, 1000, 1250, and 1500 m. Most experiments lasted 3 h, but some lasted 4 or 5 h. The detailed distri- bution of bees observed varied considerably. The experiments were therefore designed to make evaluation of the data simple. The normal dances instructed the bees to fly for either a short distance (250m) or a long distance (1500m), whereas the manipulated dances gave the bees conflicting information about whether to fly for a short or a long distance. The outcome of an experiment was expressed as the frequency of bees observed at the three most distant baits (at 1000-1500 m) relative to the total number of bees
observed in that experiment. Each experiment was replicated two to four times, and for each group (type of dance), we tested whether the results were uniform, i.e. whether observed frequencies had a common mean value (Z 2 test; Armitage and Berry 1987), In the following, "reasonably uniform" means that P was above 0.10 and "very uniform" that P was above 0.4. A 95% confidence interval was then calculated for the mean frequency. Finally, the mean frequencies of bees observed at 1000-1500 m for pairs of dance types were compared with a Z 2 test (of the null hypothesis that the frequencies were not different).
R e s u l t s
Distance
The transfer of i n fo rma t ion abou t distance was studied in experiments with baits a nd observers placed 100, 250, 500, 750, 1000, 1250 and 1500 m f rom the hive in the direct ion indicated by the model. In our init ial experi- ments with distances up to 1000 m we had observed a crude corre la t ion between the distance indicated by the model and the d i s t r ibu t ion of observed bees (Michelsen et al. 1989, Fig. 3). This was conf i rmed in the present experiments. Figure 3 A a nd B shows the d is t r ibut ions ob ta ined when the model indicated distances of 250 m and 1500 m, respectively. In bo th cases, mos t bees searched close to the hive, bu t a significantly higher per- centage of the bees were observed far f rom the hive when

146
~ I
~ - ~ - - - e 81 9 5 4 2
2 4 3 3 7 3 1 0 3
l I
• . . . . . [ 4 5
I I ~
~ , . . . . 9 4 3 8 3 6
,(.9 4 4 4 7
. 2 ~ ~ 7 8 3 5
W
~ [ ~ ~ I ~ I , I 10 20 30 40 50
% Bees Observed at -~ 1,000 m
1
Normal dance, 1,500 m
Normal dance, 250 m
wr = 2 5 0 m ; rr = 1 ,500m
wr = 1 , 5 0 0 m ; r r = 2 5 0 m
Sound = 250 m ; Wagging = 1,500 m
Wagging = 250 m ; Sound = 1,500 m
wr = wagging run
rr = return run
Fig. 4. T h e resul t s o f 19 e x p e r i m e n t s ( each in-
d i c a t e d by a filled circle) t e s t ing the t r a n s f e r
of information about distance. The percent- ages of bees observed at the distances 1000- 1500 m from the hive (cf. Fig. 3) are indicat- ed for six different dance patterns of the model bee. The number below each data point indicates the total number of bees ob- served in 3 h in that experiment. The mean in each group is indicated by a triangle. Full lines indicate the 95% confidence interval of this mean value. Further explanation in the text
the model indicated a distance of 1500 m. In the experi- ments shown, a total of 20% and 36% of the bees were observed at distances of 1000-1500 m when the model indicated a distance of 1500 m. In contrast, only 4% and 7% were observed at these distances when the model indicated a distance of 250 m. Also shown in Fig. 3 C are the results of two control experiments, in which the bees were fed scented sugar water from a motionless model bee. Apparently, the "background noise level" is low, except at a distance of 100 m from the hive.
The subsequent analysis focused on the number of bees observed at the three distant baits (1000-1500 m) relative to the total number of bees observed. These data from three normal dances indicating 250 m and four dances indicating 1500 m are shown in the two upper lines in Fig. 4. These groups were reasonably uniform (see Methods), and the difference between the means was highly significant ( P < 0.001).
In experiments investigating the perception of dis- tance cues, we programmed the model so that different parts of the dance provided the bees with conflicting information about the distance. We then compared the frequencies of bees observed at 1000 1500 m in the dif- ferent experiments.
In four experiments, the duration of the wagging run corresponded to 250 m, whereas the duration of the re- turn run corresponded to 1500 m (third line from the top in Fig. 4). Three experiments had the opposite de- sign; the duration of the wagging run signalled 1500 m and the return run 250 m (fourth line from the top). Within both groups, the results were very uniform. The difference between the group means is very significant (P<0.005), and neither differed significantly (P=0.11 and 0.20, respectively) from the control group of normal dances (two upper lines in Fig. 4). These results suggest that the duration of the wagging run is the ma in source of information about distance for the bees following the dance.
During a normal wagging run the dancer both wags its body and emits sounds by vibrating its wings. In
the preliminary experiments (Michelsen et al. 1989) it was shown that both wagging and sound are necessary for the transfer of directional information to the follower bees. One may speculate, however, that these compo- nents might have somewhat different roles in the transfer of information. For example, the distance might be sig- nalled by the duration of only one of them, and the other component might have other roles (e.g., motivat- ing the bees or signalling the profitability of the target).
Two manipulated dance patterns designed to test the roles of sound and wagging in the transfer of distance information are shown in Fig. 2, D and E. One of these components is present during the entire wagging run (the duration of which corresponded to a distance of 1500 m). The duration of the other component is re- duced to one-third (which in our bees happens to corre- spond to a distance of 250 m). For each dance pattern the results (the two lower lines in Fig. 4) were reasonably uniform. Furthermore, in both groups the mean fre- quency differs significantly from the mean frequency of normal 250-m dances (second line) with P<0.005, but not from the mean frequency of normal 1500-m dances (first line; P = 0 . 1 2 and 0.06, respectively). The experi- ments thus suggest that although only one component was present during the entire wagging run, the bees still used the duration of the entire wagging run for estimat- ing the distance to the target.
Direction
The transfer of directional information was tested in experiments in which eight observers with baits were 370 m from the hive and evenly spaced in an area with low vegetation. The bees were " t o l d " to fly 370 m in a certain direction. Two experiments with normal dances were performed on consecutive days with the same wind direction, but with the target directions differing by 90 ° • The results (Fig. 5) show that approxiinately 80% of the observed bees were found in the direction indicated

~ 24
~ [ ] N=22
18 i~i~i [ ] N = 33 i ! ~ ]
. . . .
. . . .
i ~ !
. . . .
. . . .
. . . .
. . . .
. . . .
: : : . . . . . . .
, . .
. . . .
. . . .
. . . .
~
- ,
. . . .
. . . .
. . . .
. . . .
, ,
Fig. 5. Two experiments (open and dotted bars, respectively) with normal wagging dances testing the transfer of directional informa- tion. The direction indicated by the model is shown by an arrow. The number of bees observed at each of eight baits located 370 m from the hive is indicated. The direction of the wind is indicated for each experiment. The mean vectors are 0.81 and 0.78, respec- tively
147
15
[~ N=31
~N=17
T
Fig. 6. The results of two experiments (open and dotted bars, respec- tively) in which the wagging run was displaced to the left return run (Fig. 2C), thus providing the bees with potentially conflicting information about direction. The mean vectors are 0.53 and 0.43, respectively
by the model. These results are very significant ( P < 0.001). The small number of bees observed at the seven other baits is in agreement with the control experiments shown in Fig. 3.
The wagging run is the "master component" for con- veying information about distance, but does it also indi- cate direction? This problem was investigated by means of the dance patterns B and C in Fig. 2. The waging runs of these manipulated dances are " n o r m a l " , but displaced to the return part of the dance. In this way the bees are provided with conflicting information about direction: the figure-of-eight dance path points in one direction and the wagging run in the opposite direction. The duration of the wagging run corresponded to a dis- tance of 370 m, and the experimental set-up was as in the experiments of Fig. 5.
Dance figure B did not lead to any recruitment of the bees. The reason became clear when the bees were observed during the dance of the model. The follower bees were obviously unable to predict where the next wagging run would be taking place. They were attracted by the wagging runs, but generally arrived too late to be able to follow the wagging run. They then remained on the spot, apparently waiting for the next wagging run - only to find out that it now occurred some distance
away. They then ran to the place of action, arrived too late, and so on.
Dance figure C, however, did elicit recruitment, and directional information was transferred (Fig. 6), but not as accurately as by the normal dance (Fig. 5). In the direction indicated by the wagging run we observed ap- proximately half the bees, and less than one-tenth of the bees were observed in the direction indicated by the central port ion of the figure-of-eight dance path. The results presented as open bars are very significantly di- rectional (P < 0.001). The other experinaent is significant at the 0.03 level. In a third experiment the same trend was observed, but the results were not significant. This dance contains only half the normal number of wagging runs, and the bees may have missed the frequent presen- tation of wagging runs. In contrast to the experiments with figure B, however, the bees remained in the area where the wagging runs occurred and thus had a better chance of following the wagging runs when they oc- curred.
We then completely separated the wagging and sound components. In the dance shown as Fig. 2F the sound has been moved to the return runs. The durations of the wagging run and the sound were the normal values for a distance of 370 m. The results of two experiments
148
10
[] N=36
[] N=46 14 --13
i~i iiii iiii !~!!
~ 11 i~!i
,
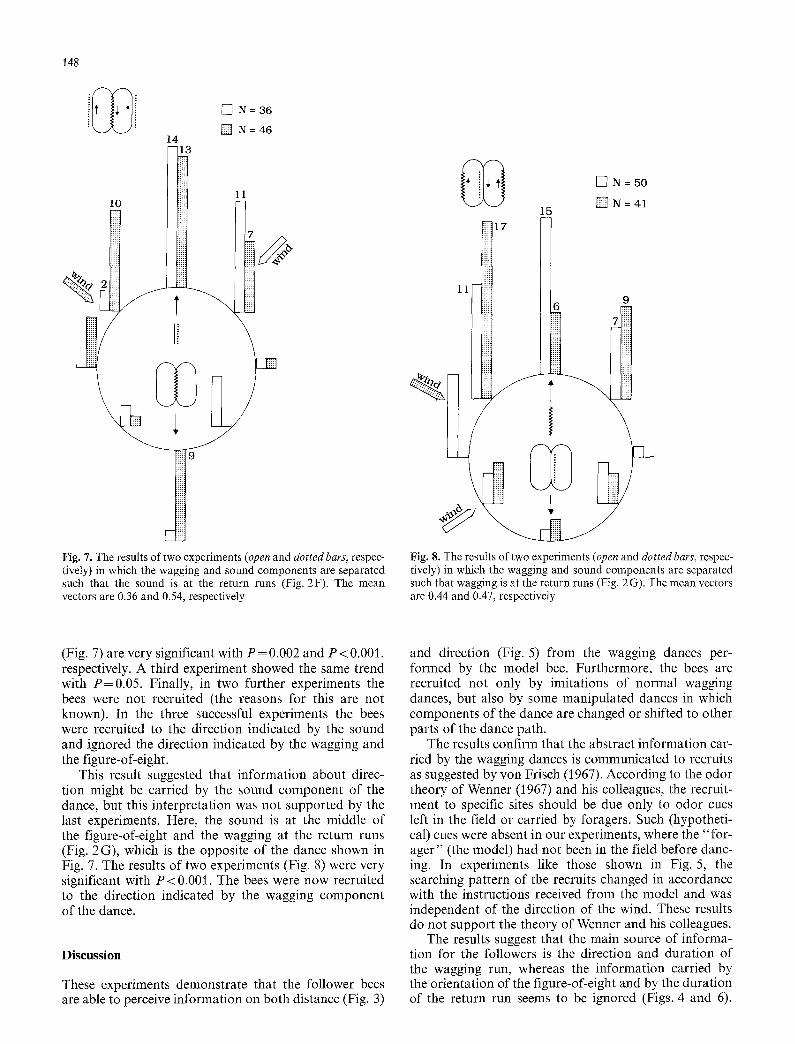
Fig. 7. The results of two experiments (open and dotted bars, respec- tively) in which the wagging and sound components are separated such that the sound is at the return runs (Fig. 2F). The mean vectors are 0.36 and 0.54, respectively
::t17
111
15
6
[ ] N = 5 0
~ N = 4 1
9
Fig. 8. The results of two experiments (open and dotted bars, respec- tively) in which the wagging and sound components are separated such that wagging is at the return runs (Fig. 2 G). The mean vectors are 0.44 and 0.47, respectively
(Fig. 7) are very significant with P = 0.002 and P < 0.001, respectively. A third experiment showed the same trend with P=0.05 . Finally, in two further experiments the bees were not recruited (the reasons for this are not known). In the three successful experiments the bees were recruited to the direction indicated by the sound and ignored the direction indicated by the wagging and the figure-of-eight.
This result suggested that information about direc- tion might be carried by the sound component of the dance, but this interpretation was not supported by the last experiments. Here, the sound is at the middle of the figure-of-eight and the wagging at the return runs (Fig. 2G), which is the opposite of the dance shown in Fig. 7. The results of two experiments (Fig. 8) were very significant with P < 0.001. The bees were now recruited to the direction indicated by the wagging component of the dance.
Discussion
These experiments demonstrate that the follower bees are able to perceive information on both distance (Fig. 3)
and direction (Fig. 5) from the wagging dances per- formed by the model bee. Furthermore, the bees are recruited not only by imitations of normal wagging dances, but also by some manipulated dances in which components of the dance are changed or shifted to other parts of the dance path.
The results confirm that the abstract information car- ried by the wagging dances is communicated to recruits as suggested by yon Frisch (1967). According to the odor theory of Wenner (1967) and his colleagues, the recruit- ment to specific sites should be due only to odor cues left in the field or carried by foragers. Such (hypotheti- cal) cues were absent in our experiments, where t h e " for- ager" (the model) had not been in the field before danc- ing. In experiments like those shown in Fig. 5, the searching pattern of the recruits changed in accordance with the instructions received from the model and was independent of the direction of the wind. These results do not support the theory of Wenner and his colleagues.
The results suggest that the main source of informa- tion for the followers is the direction and duration of the wagging run, whereas the information carried by the orientation of the figure-of-eight and by the duration of the return run seems to be ignored (Figs. 4 and 6).

The stereotyped figure-of-eight dance path may help the bees to orientate themselves relative to the dancer so that they are in a favourable position for observing the next wagging run. The confusion caused by dance B in Fig. 2 supports this interpretation.
The experiments further demonstrate that although both sound and wagging must be present in the wagging run (Michelsen et al. 1989), the duration of one of these components may be reduced without affecting the infor- mation about distance (dances D and E in Fig. 2). Fur- thermore, the bees were also recruited by dances in which sound and wagging were completely separated (Figs. 7 and 8) where the bees were recruited to the direc- tion indicated by the return run, irrespective of whether it carried sounds or waggle. The results of these experi- ments do not support the notion of different roles for the sound and wagging components. In contrast, these dance components appear to be fairly redundant. Signal redundancy is known to make communication systems more tolerant to transmission errors (see MacKay 1972). Of course, the signal redundancy demonstrated here does not rule out the possibility that the sound and wag- ging may have additional and separate signal functions.
Several earlier attempts to recruit bees by means of models have been unsuccessful. The first mechanical models of dancing bees were built by Steche (1957) and Esch (1962). These models did not emit sound, but in a later experiment by Esch a wax-coated microphone was made to waggle and emit sounds. Gould (1976) ex- perimented with moving and vibrating paralyzed bees, and Levchenko and Levchenko (1989) tested a model made from expanded polystyrene. In all cases, the bees showed great interest in the models, but the models did not elicit recruitment.
Recruitment of followers
In the transfer of directional information from normal dances (Fig. 5), the accuracy is similar to that obtained in experiments with live dancers (and considerably better than that reported in our initial experiments with a larger model with more erratic behaviour, see Fig. 2 in Michelsen et al. 1989). However, live dancing bees re- cruit 5-10 times more bees than does the model. The experiments therefore have to last for at least 3 h to provide a reasonable number of recruits. In our climate this means that we can only perform one experiment per day. Each experiment requires a staff of 8-9 persons. Furthermore, it is necessary to have long periods of sta- ble and fair weather, so that the bees maintain a fairly constant motivation. The results reported in this paper represent 14 weeks' work over 3 years. We are well aware that a larger number of experiments would have allowed us to present more definite evidence. The efficiency of the model in recruiting follower bees must be improved if the method is to be more generally used.
Given the crude nature of our model, it is perhaps not surprising that it induces only moderate recruitment. Nevertheless, many applications would become easier if the model could be improved. Live dancers are known
149
to have a thoracic surface temperature above 40 ° C, that is 5-6 ° C above that of most other bees in the hive (Sta- bentheiner et al. 1990). We have tested a model with built-in heating elements. Unfortunately, it elicited heavy attacks by the bees each time its temperature ex- ceeded 34 ° C.
In recent years, several investigators have reported that worker bees belonging to different patrilines may not have the same genetic predisposition to carry out a certain task. This seems to be true also for foraging preferences and tendencies to dance or to follow a dance (Oldroyd et al. 1991). In bee colonies composed of a few patrilines, the workers show a strong tendency to follow dances executed by a member of their own patri- line. If this phenomenon is also true in normal colonies with many patrilines, it may perhaps cause some prob- lems for a model which does not belong to any patriline. Oldroyd et al. (1991) found some evidence that different patrilines differ in their tendency to forage close to or far from the hive. If generally true, this may further complicate experiments with the model dancer, since dif- ferent instructions may be carried out by different groups of bees.
Distance
The model bee is less successful in providing information about distance. Although the distribution of bees ob- served at the baits clearly depends on the distance indi- cated by the model, a large fraction of the recruited bees always searched close to the hive (Fig. 3). In con- trast, the majority of the followers recruited by live dancers fly to approximately the distance indicated in the dance (von Frisch 1965). One may speculate that many of the bees recruited by the model dancer have failed to obtain precise information about distance. This is not very likely, however, in view of the surprising precision with which the bees perceive the directional information.
An alternative explanation is that the bees were con- fused because the model provided them with conflicting information about distance. Very recently, it has been found that the wing vibration frequency in live dancing bees is approximately 315 Hz when the dancer indicates a distance of 50 m, but only 207 Hz at 1600 m (Spangler 1991). Bees can discriminate between 265 Hz and 380 Hz when trained to respond to 265 Hz dance sounds in operant-conditioning experiments (Kirchner et al. 1991). It is possible, therefore, that the follower bees interpreted the frequency of the wing vibrations (280 Hz) to indicate a short distance, while the model bee indicated a distance of 1500 m by the duration of its wagging run.
Approximately half of the experiments in Fig. 4 were carried out in 1989 and the other in 1990 at two different locations and with different colonies of bees. Although the results were similar in most respects, some details were different. In 1989 most of the bees searching close to the hive during the experiments on distance were ob- served at the 100-m bait, and fewer were observed at 250 m. In 1990 the opposite distribution was found at

150
these dis tances. In 1989 the hive was s u r r o u n d e d by fair- ly low vege ta t ion (shrubs o f 1-2 m height) , and the bees d id no t fly very far f rom the g round . In con t ras t , ta l l trees s u r r o u n d i n g the hive in 1990 forced the bees to t ake of f a b o u t 10 m f rom the g r o u n d (it was easy to observe h o w bees sp i ra l led f rom the g r o u n d up to the he ight o f take-off) . The bees therefore seemed to miss the 100-m bai t . Such effects o f local t o p o g r a p h y on the d i s t r ibu t ion o f bees a t the bai ts stress the need for cau- t ion when set t ing up such exper iments .
Acknowledgements. These studies have been supported by grants from the Danish Science Research Council, the Akademie der Wissenschaften und der Literatur (Mainz), the Humboldt Stiftung, and the Stiftung Volkswagenwerk. We are grateful to Niels Keiding, Annemarie Surlykke, Lee A. Miller and Michael Depledge for ad- vice and comments on the manuscript.
References
Armitage P, Berry G (1987) Statistical methods in medical research. Blackwell Sci Publ, Oxford
Batschelet E (1981) Circular statistics in biology. Academic Press, London
Esch H (1962) ~lber die Auswirkung der Futterplatzqualit/it auf die Schallerzeugung im Werbetanz der Honigbiene. Verh Dtsch Zool Ges 26: 302-309
Frisch, K von (1965) Tanzsprache und Orientierung der Bienen. Springer, Berlin Heidelberg New York
Gould JL (1976) The dance-language controversy. Q Rev Biol 51 : 211-244
Kirchner WH, Dreller C, Towne WF (1991) Hearing in honeybees: operant conditioning and spontaneous reactions to airborne sound. J Comp Physiol A 168:85-89
Levchenko I, Levchenko I (1989) The mysteries of bee dance. Sci- ence in the USSR, 1989, No. 4, 64-67
MacKay DM (1972) Formal analysis of communicative processes. In: Hinde RA (ed) Non-verbal communication. Cambridge Univ Press, pp 3-25
Michelsen A, Kirchner WH, Lindauer M (1986) Sound and vibra- tional signals in the dance language of the honeybee, Apis melli- fera. Behav Ecol Sociobiol 18 : 207-212
Michelsen A, Towne WF, Kirchner WH, Kryger P (1987) The acoustic near field of a dancing honey bee. J Comp Physiol A 161:633 643
Michelsen A, Andersen BB, Kirchner WH, Lindauer M (1989) Honeybees can be recruited by means of a mechanical model of a dancing bee. Naturwissenschaften 76:277-280
Michelsen A, Andersen BB, Kirchner WH, Lindauer M (1990) Transfer of information during honeybee dances, studied by means of a mechanical model. In: Gribakin FG, Wiese K, Po- pov AV (eds) Sensory systems and communication in arthro- pods. Birkh/iuser, Basel Boston Berlin, pp 294-300
Oldroyd BP, Rinderer TE, Buco SM (1991) Honey bees dance with their super sisters. Anim Behav 42:121-129
Spangler HG (1991) Do honey bees encode distance information into the wing vibrations of the waggle dance? J Insect Behav 4:15-20
Stabentheiner A, Hagmiiller K, Kovac H (1990) Thermisches Ver- halten yon Honigbienen im Schw/inzeltanz. Verb Dtsch Zool Ges 83 : 624
Steche W (1957) Gelenkter Bienenflug durch ,,Attrappent/inze". Naturwissenschaften 44:598
Towne WF, Kirchner WH (1989) Hearing in honey bees: detection of air-particle oscillations. Science 244:686-688
Wenner AM (1967) Honey bees: do they use the distance informa- tion contained in their dance manoeuver? Science 155:847-849