how much does the international financial crisis affect ... · how much does the international...
TRANSCRIPT
How Much Does the International Financial Crisis Affect China’s GDP
and Employment?
Huijuan WANG, Xikang CHEN, Cuihong YANG
(Academy of Mathematics and Systems Science, Chinese Academy of Sciences, Beijing 100190)
Email: [email protected]
Abstract: The financial crisis triggered by the US sub-prime crisis swept across the globe in 2008.
China’s financial system cannot keep away form the financial crisis. The growth rate of China’s
GDP was slowed down. Unemployment rate in cities and towns, increased to 4.2% from 4%
compared with the previous quarter, while it has been decreasing since 2003. However China’s
GDP increased gradually in each quarter in 2009. Is it to see that the international crisis was
passed in 2009? Obviously, the answer is no. How Much Does the International Financial Crisis
Affect China’s GDP and Employment? How the influence was measured?
In order to calculate the influence, we should distinguish the influence caused by
international financial crisis economic circle and macro-control policy. This paper starts from
analyzing the influence of financial crisis on China’s export and investment, by using
Input-Output model of the non-competitive imports type capturing China’s processing exports to
calculate how much the international financial crisis affects China’s GDP and employment.
The result indicates that the impact of financial crisis on China‘s economy is more and more
serious during the fourth quarter of 2008 and the third quarter of 2009. The GDP loss,which
indicates the actual impact of financial crisis, of the fourth quarter of 2008 is 373.7 billion RMB
and that of the third quarter of 2009 is 649.1 billion RMB, accounted for 8.3% of the GDP of the
third quarter of 2009. The number of unemployed people was 12.51million in the fourth quarter of
2008 and 21.7 million in the third quarter of 2009.
Keywords: the international financial crisis; influence; China’s GDP; employment;
Input-Occupancy-Output Model

1. Introduction The financial crisis triggered by the US sub-prime crisis swept across the globe in 2008. This
crisis had affected many countries, that consumption contracted and the unemployment rate
increased sharply. China’s financial system has entered the process of economic globalization and
cannot keep away form this financial crisis.
China’s GDP only increased 6.8% year-on-year in the fourth quarter of 2008, 5.7 percentage
points lower than the same period of the previous year. The registered urban unemployment rate,
in the same quarter, increased to 4.2% from 4% compared with the previous quarter, while it had
been decreasing since 2003. A large number of migrant workers lost jobs and returned home.
Though the main reason of downturn and increased unemployment is international financial crisis,
there are many other factors to accelerate the economic deterioration, such as the declining circle
of China’s economy. China adopted a series of measures to prevent the economy from overheating
in the first three quarters of 2008, such as the implementation of tight monetary policy and prudent
fiscal policy, the deposit reserve increased for 5 times, the money supply tighten and so on. These
macro-control measures made China’s economic growth start to slow down in the first half;
The international financial crisis deteriorated gradually in the first three quarters of 2009,
which theoretically influenced China more seriously. China’s GDP in the first three quarters only
increased 7.7% compared with the same period of 2008. Although it decreased 2.2 percentage
points, China’s economy went well gradually in each quarter and the employment situation was
relatively stable. There was no large-scale unemployment. One main reason was that Chinese
government considered international and domestic situation, changed the economic development
of tone prudently and flexibility, and took timely and decisive manners to stimulate the economy,
such as 4 trillion RMB of investment, active fiscal policy and loose monetary policy. All these
positive macro-regulatory factors offset the negative impact of the financial crisis partially.
So in order to analyze how much international financial crisis affected China economic and
employment, we should distinguish the influence caused by international financial crisis,
economic circle and macro-control policy. At present, there are many literatures on the
international crisis, but many of them concentrated in the qualitative description of the influence.
Xuegong Sun(2008) compared the changes before and after the financial crisis from external
demand, capital flows, balance sheets, etc., highlighting the international financial crisis on
China’s economic impact; Yizhi Xiong, Shaowei Hu(2008) analyzed the qualitative influence that
financial crisis affected on China’s economy short-term, medium- and long-term development
patterns, providing the healthy development policies. Fang Cai(2009) studied China’s labor
market affected by financial crisis, and computed how much non-agricultural employment
declined caused by reduction of exports using urban unemployment rate and Input-Output
analysis.
The outbreak of the international financial crisis made a series of problems, such as China
external demand significantly reduced, export orders slumped, the foreign-funded enterprises
closed down due to lack of cash flow, lessen investment, tourism revenue decline and so on. By
the definition of GDP by expenditure approach, the decline on export, investment or final
consumption would directly result in China’s GDP decline. Further, we should consider
inter-industry association. Taking export as an example, decreased exports not only make the
export enterprises loss, but also make many other industries closely related to this enterprise take a
loss. In order to calculate the financial crisis influence as accurately as possible, this paper used
Input-Output technology whose characteristic is reflecting the complex inter-relationship. Based
on IO table and China's economic situation of the development, this paper calculated how much
the international financial crisis affected China’s GDP and employment.
2. Input-Output Model of the Non-competitive Imports Type Capturing China’s Processing
Exports Financial crisis which led to a decrease in demand abroad seriously affected on China’s
exports. China’s processing exports as a special trade form, only needs little domestic intermediate
inputs and labor, creates less value-added accounted for 50% of the total. In the same amount of
exports, processing export creates value added and non-agriculture jobs only 43% and 36%
compared with the non-processing exports. Consequently, it is essential and necessary to
distinguish between processing exports and non-processing exports to calculate the influence on
GDP and employment of reduced exports. In this paper, we used 2002 Input-Output table of the
non-competitive imports type capturing China’s processing exports, which is the newest table we
can get. Further, we adjusted the value-added and employment coefficients with 2007 data to
make the results more accurate.
Input-Output model of the non-competitive imports type capturing China’s processing
exports is extended by general IO model, which was first used by Xikang Chen in researching
foreign trade using Input-Occupancy-Output model. This model measures the direct and total
influence on China’s GDP and employment of China-US trade. Results were the reference
material for Jintao Hu visited America.
Compared with the general IO model, the distinguishing features of the Input- Occupancy
-Output model of the non-competitive imports type capturing China’s processing exports (denoted
new model for short) are as follows:
1. China’s processing exports account for 50% of total exports. Raw material and auxiliary
parts using in processing exports mainly depended on import. The new model aimes at the special
export structure and divides the production into general production for domestic use (D),
processing exports (P) and non-processing exports and others of FIEs (N);
2. New model distinguishes the difference of domestic and imported products. It divides
intermediate inputs into domestically and imported. It also divides final demand into these two
parts;
3. Considering foreign-funded enterprises with a dominant position in China's export and the
different distribution structure between foreign-funded enterprises and domestic ones, this model
separates foreign-funded enterprises from meeting general production for domestic use and other
production in order to give a detailed description of the foreign products in the domestic market
allocation;
4. New model adds every department’s employees as the occupancy. It not only considers the
product input and output relationship, but also researches the relationship on the employees
occupancy and input, occupancy and output.
Consequently, in the Input- Occupancy -Output model of the non-competitive imports type
capturing China’s processing exports, total output X was extended to
N
P
D
XXX
X , final demand
F was extended to
NENINC
PE
DIDC
N
P
D
FFFF
FF
FFF
F and MF , direct technology coefficient
matrix A was extended to direct technology domestic coefficient matrix
NNNPND
DNDPDD
AAA
AAAA 000 and direct technology imported coefficient matrix MA .
The basic balance relationship of the new model is
XFXA , FAIX 1)( .
1)( AIB is the extended Leontief inverse matrix, which is extended total requirement
coefficient matrix.
By the definition of value-added and employment coefficient, the direct value-added and
employment influence by final demand changes is:
FAV V 1 (1)
FAL L 1 (2)
NPD VVVV , NPD LLLL ,
NVPV
DV AAAA V , NLP
LD
L AAAA L .
The total value-added and employment influence by final demand changes is:
FBFAIAXAV VVV 12 )( (3)
FBFAIAXAL LLL 12 )( (4)
3. Analyzing the Development of China Economy Affected of International Financial Crisis
3.1 Analyzing China’s economy
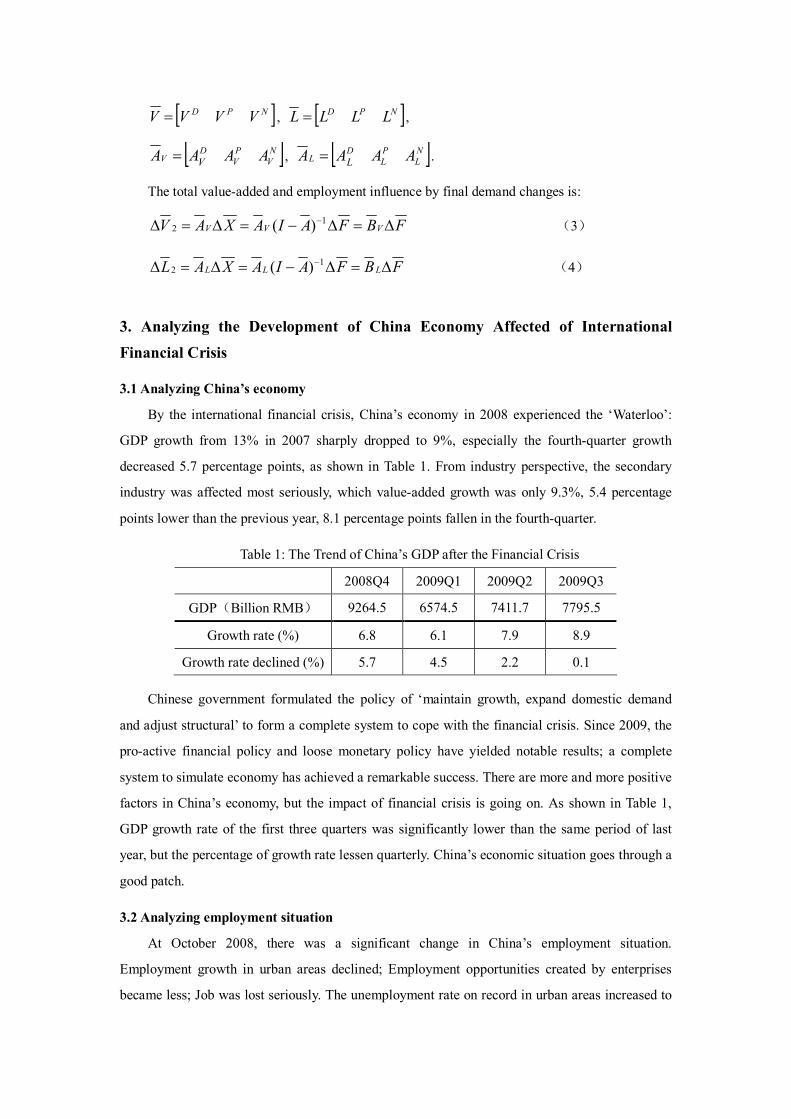
By the international financial crisis, China’s economy in 2008 experienced the ‘Waterloo’:
GDP growth from 13% in 2007 sharply dropped to 9%, especially the fourth-quarter growth
decreased 5.7 percentage points, as shown in Table 1. From industry perspective, the secondary
industry was affected most seriously, which value-added growth was only 9.3%, 5.4 percentage
points lower than the previous year, 8.1 percentage points fallen in the fourth-quarter.
Table 1: The Trend of China’s GDP after the Financial Crisis
2008Q4 2009Q1 2009Q2 2009Q3
GDP(Billion RMB) 9264.5 6574.5 7411.7 7795.5
Growth rate (%) 6.8 6.1 7.9 8.9
Growth rate declined (%) 5.7 4.5 2.2 0.1
Chinese government formulated the policy of ‘maintain growth, expand domestic demand
and adjust structural’ to form a complete system to cope with the financial crisis. Since 2009, the
pro-active financial policy and loose monetary policy have yielded notable results; a complete
system to simulate economy has achieved a remarkable success. There are more and more positive
factors in China’s economy, but the impact of financial crisis is going on. As shown in Table 1,
GDP growth rate of the first three quarters was significantly lower than the same period of last
year, but the percentage of growth rate lessen quarterly. China’s economic situation goes through a
good patch.
3.2 Analyzing employment situation
At October 2008, there was a significant change in China’s employment situation.
Employment growth in urban areas declined; Employment opportunities created by enterprises
became less; Job was lost seriously. The unemployment rate on record in urban areas increased to
4.2% from 4% compared with the previous quarter, ending the downward tendency since 2003. At
the end of 2008, the number of registered unemployed persons was 8.86 million, increasing 0.56
million as compared with the last year. Considering registered urban unemployed and
unemployment rural workers, the loss of job would reach 12.56 million in the fourth-quarter of
2008. If taking into account non-registered urban unemployed, the number of unemployment in
the fourth quarter of 2008 would be higher.
The Party's Central Committee, State Council and government departments at all levels
attached great importance to the unprecedented severe employment situation, such as ‘difficult
employment’, ‘return flows’. Sustaining economic growth, government tried their best to create
new job, and timely advanced all employment measures to add a protective barrier on ‘protect job’.
The 2009 monitoring data of Ministry of Human Resources and Social Security showed that the
tasks of employment were over fulfilled; 11.02 million people in cities and towns found their first
jobs while the objective of 2009 is 9 million. Registered urban unemployment rate remained at
4.3%. Employment rate of college graduates had reached 87%, and policies supported to migrant
workers were implemented timely. In the first three quarters of 2009, the number of total
trans-regional rural workers was 151.98 million, which increased 11.57 million compared with the
end of last year. The employment of migrant workers was generally relatively stable.
4. The Impact of International Financial Crisis on China’s GDP and Employment
In order to distinguish the influence caused by international financial crisis, economic circle
and macro-control policy, this paper started from analyzing the influence of financial crisis on
China’s export and investment to calculate how the financial crisis affected the entire national
economy.
4.1 Reduction in exports
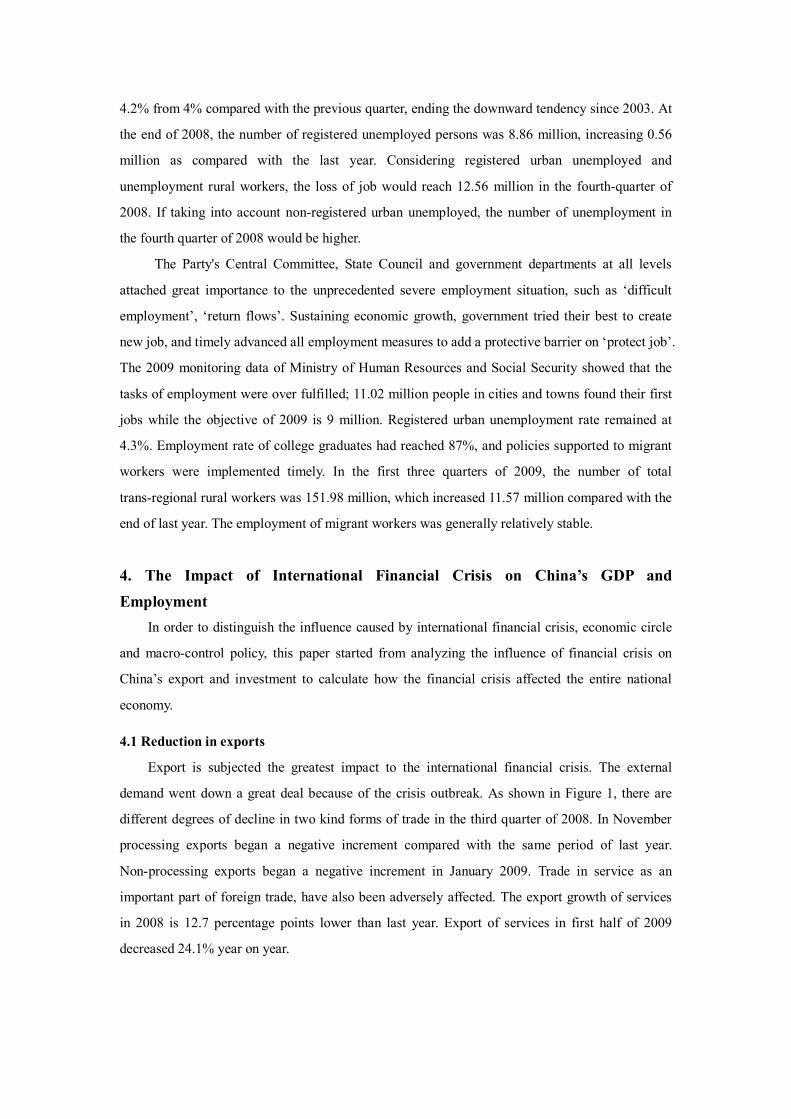
Export is subjected the greatest impact to the international financial crisis. The external
demand went down a great deal because of the crisis outbreak. As shown in Figure 1, there are
different degrees of decline in two kind forms of trade in the third quarter of 2008. In November
processing exports began a negative increment compared with the same period of last year.
Non-processing exports began a negative increment in January 2009. Trade in service as an
important part of foreign trade, have also been adversely affected. The export growth of services
in 2008 is 12.7 percentage points lower than last year. Export of services in first half of 2009
decreased 24.1% year on year.
-40%
-30%
-20%
-10%
0%
10%
20%
30%
40%
2008
-6
2008
-7
2008
-8
2008
-9
2008
-10
2008
-11
2008
-12
2009
-1
2009
-2
2009
-3
2009
-4
2009
-5
2009
-6
2009
-7
2009
-8
2009
-9
Exports
Processing Exports
Non-processing Exports
Figure 1: Growth Rate of Different Forms Exports since June 2008
Source: CEI trade data and our calculation.
Suppose there is no financial crisis, the growth rate of China’s exports would be the average
growth of the last decade development. In this model, we used quarterly data since 1998 to
compute the average quarterly growth rate of processing export and non-processing export. The
computed growth rate is denoted as normal growth, compared with the real growth rate, as shown
in Table 2.
Table 2: The Average Quarterly Growth Rate of Exports (%)
2008Q4 2009Q1 2009Q2 2009Q3
Normal growth rate 20.4 21.2 19.7 20.48 Processing
Exports Real growth rate -6.32 -23.45 -21.18 -15.31
Normal growth rate 22.2 24.0 23.7 23.56 Non-processing
Exports Real growth rate 15.93 -16.03 -25.38 -24.48
Source: CEI trade data and our calculation.
In the fact export was struck seriously and extensively by the financial crisis. For simplifies
calculation, the impact of financial crisis on export could be the value developed under the normal
growth subtracting the actual one. The vectors of decline exports in the forth quarter 2008 and the
first three quarters 2009 are 4,,1, iEQi . According the formulas (1)-(4), we can get the
direct and total influence on GDP, employment of the reduction in exports of goods and services,
as shown in Table 3.
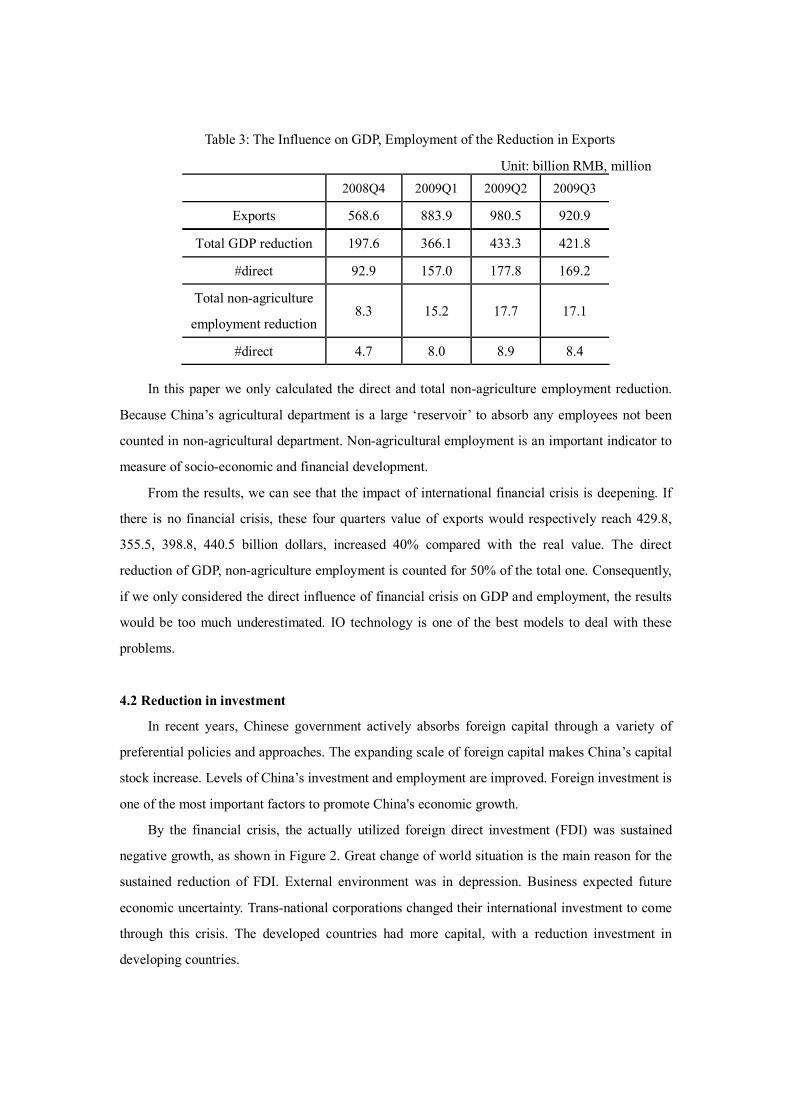
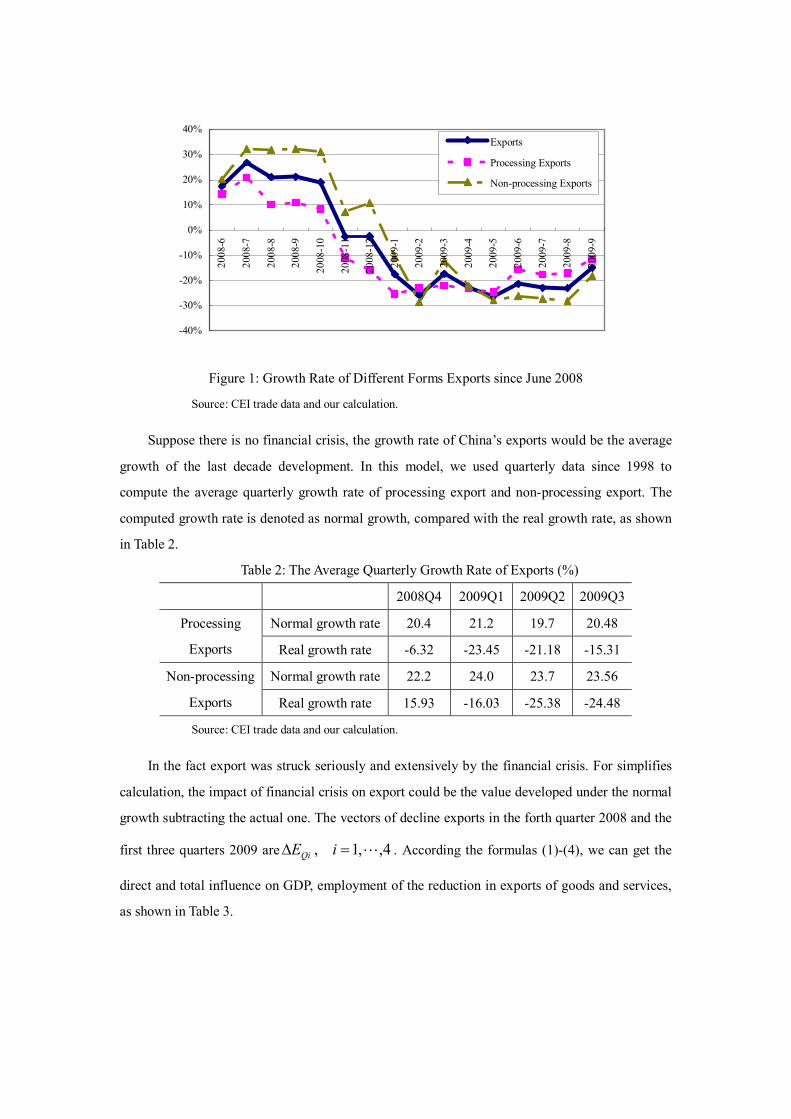
Table 3: The Influence on GDP, Employment of the Reduction in Exports
Unit: billion RMB, million 2008Q4 2009Q1 2009Q2 2009Q3
Exports 568.6 883.9 980.5 920.9
Total GDP reduction 197.6 366.1 433.3 421.8
#direct 92.9 157.0 177.8 169.2
Total non-agriculture
employment reduction 8.3 15.2 17.7 17.1
#direct 4.7 8.0 8.9 8.4
In this paper we only calculated the direct and total non-agriculture employment reduction.
Because China’s agricultural department is a large ‘reservoir’ to absorb any employees not been
counted in non-agricultural department. Non-agricultural employment is an important indicator to
measure of socio-economic and financial development.
From the results, we can see that the impact of international financial crisis is deepening. If
there is no financial crisis, these four quarters value of exports would respectively reach 429.8,
355.5, 398.8, 440.5 billion dollars, increased 40% compared with the real value. The direct
reduction of GDP, non-agriculture employment is counted for 50% of the total one. Consequently,
if we only considered the direct influence of financial crisis on GDP and employment, the results
would be too much underestimated. IO technology is one of the best models to deal with these
problems.
4.2 Reduction in investment
In recent years, Chinese government actively absorbs foreign capital through a variety of
preferential policies and approaches. The expanding scale of foreign capital makes China’s capital
stock increase. Levels of China’s investment and employment are improved. Foreign investment is
one of the most important factors to promote China's economic growth.
By the financial crisis, the actually utilized foreign direct investment (FDI) was sustained
negative growth, as shown in Figure 2. Great change of world situation is the main reason for the
sustained reduction of FDI. External environment was in depression. Business expected future
economic uncertainty. Trans-national corporations changed their international investment to come
through this crisis. The developed countries had more capital, with a reduction investment in
developing countries.
-60%
-40%
-20%
0%
20%
40%
60%
2008
-620
08-7
2008
-8
2008
-9
2008
-10
2008
-11
2008
-12
2009
-1
2009
-2
2009
-320
09-4
2009
-5
2009
-6
2009
-720
09-8
2009
-9
Figure 2: The Growth Rate of the Actually Utilized FDI since 2008
Source: China statistical yearbook data and our calculation.
After the outbreak of the financial crisis, FDI fell dramatically. According to the growth rate
of FDI nearly a decade, the actually utilized FDI would reach $30 billion but the real one is $18
billion. By the same way, we calculated the influence affected by crisis in the first three quarters of
2009 on FDI. According the formulas (1)-(4), we can get the direct and total influence on GDP,
employment of the reduction in FDI, as shown in Table 4.
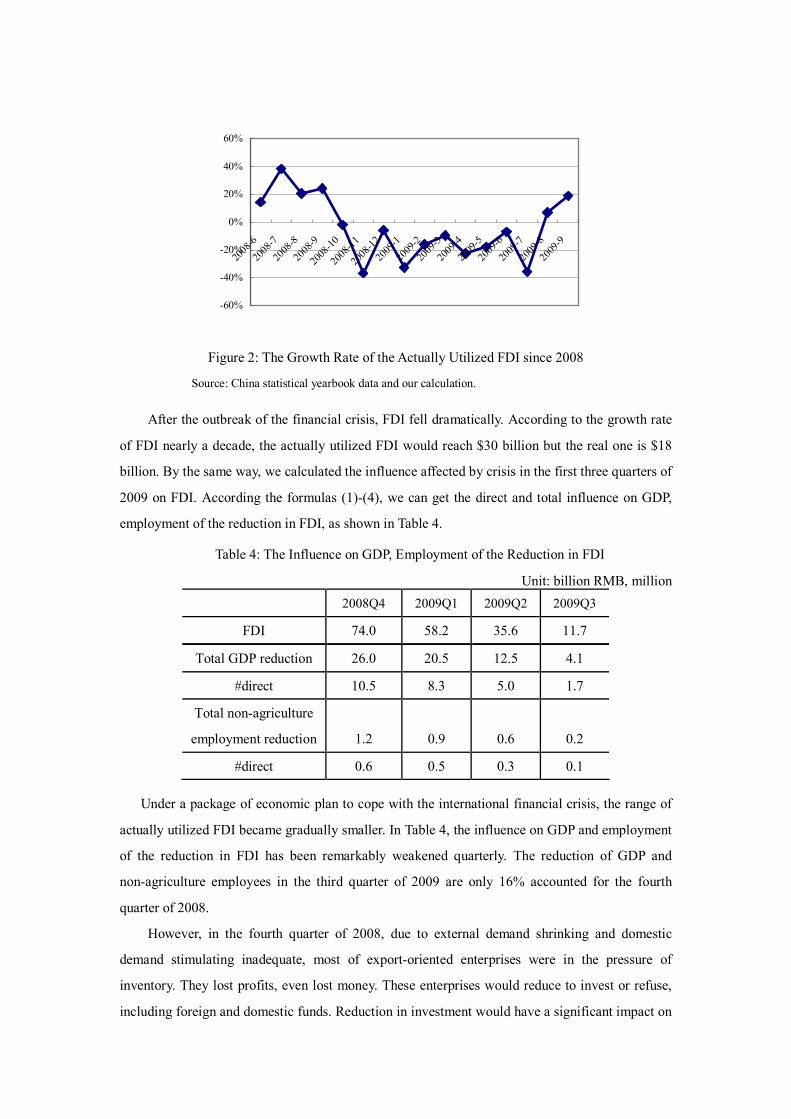
Table 4: The Influence on GDP, Employment of the Reduction in FDI
Unit: billion RMB, million 2008Q4 2009Q1 2009Q2 2009Q3
FDI 74.0 58.2 35.6 11.7
Total GDP reduction 26.0 20.5 12.5 4.1
#direct 10.5 8.3 5.0 1.7
Total non-agriculture
employment reduction 1.2 0.9 0.6 0.2
#direct 0.6 0.5 0.3 0.1
Under a package of economic plan to cope with the international financial crisis, the range of
actually utilized FDI became gradually smaller. In Table 4, the influence on GDP and employment
of the reduction in FDI has been remarkably weakened quarterly. The reduction of GDP and
non-agriculture employees in the third quarter of 2009 are only 16% accounted for the fourth
quarter of 2008.
However, in the fourth quarter of 2008, due to external demand shrinking and domestic
demand stimulating inadequate, most of export-oriented enterprises were in the pressure of
inventory. They lost profits, even lost money. These enterprises would reduce to invest or refuse,
including foreign and domestic funds. Reduction in investment would have a significant impact on
economy and employment. Consequently, we calculated the reduction of domestic investment of
crisis based on industry data about urban investment in fixed assets.
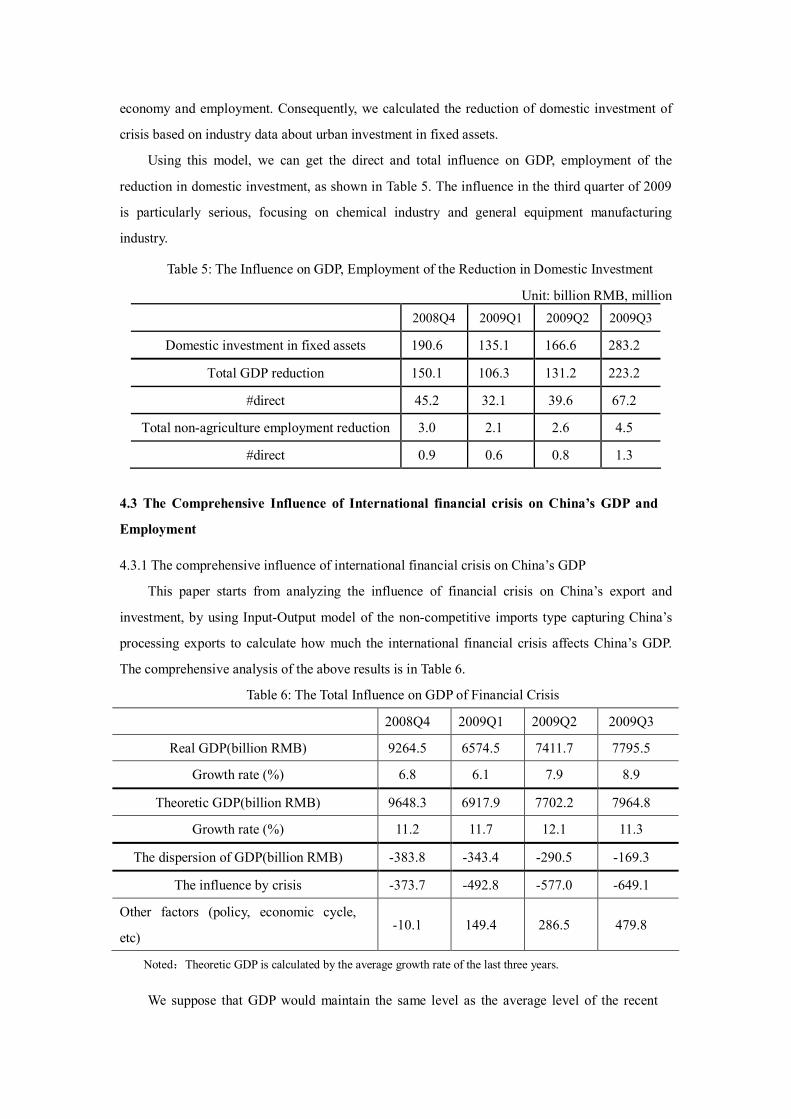
Using this model, we can get the direct and total influence on GDP, employment of the
reduction in domestic investment, as shown in Table 5. The influence in the third quarter of 2009
is particularly serious, focusing on chemical industry and general equipment manufacturing
industry.
Table 5: The Influence on GDP, Employment of the Reduction in Domestic Investment
Unit: billion RMB, million 2008Q4 2009Q1 2009Q2 2009Q3
Domestic investment in fixed assets 190.6 135.1 166.6 283.2
Total GDP reduction 150.1 106.3 131.2 223.2
#direct 45.2 32.1 39.6 67.2
Total non-agriculture employment reduction 3.0 2.1 2.6 4.5
#direct 0.9 0.6 0.8 1.3
4.3 The Comprehensive Influence of International financial crisis on China’s GDP and
Employment
4.3.1 The comprehensive influence of international financial crisis on China’s GDP
This paper starts from analyzing the influence of financial crisis on China’s export and
investment, by using Input-Output model of the non-competitive imports type capturing China’s
processing exports to calculate how much the international financial crisis affects China’s GDP.
The comprehensive analysis of the above results is in Table 6.
Table 6: The Total Influence on GDP of Financial Crisis
2008Q4 2009Q1 2009Q2 2009Q3
Real GDP(billion RMB) 9264.5 6574.5 7411.7 7795.5
Growth rate (%) 6.8 6.1 7.9 8.9
Theoretic GDP(billion RMB) 9648.3 6917.9 7702.2 7964.8
Growth rate (%) 11.2 11.7 12.1 11.3
The dispersion of GDP(billion RMB) -383.8 -343.4 -290.5 -169.3
The influence by crisis -373.7 -492.8 -577.0 -649.1
Other factors (policy, economic cycle,
etc) -10.1 149.4 286.5 479.8
Noted:Theoretic GDP is calculated by the average growth rate of the last three years.
We suppose that GDP would maintain the same level as the average level of the recent
three years normally. The growth rate of real GDP is less than four percentage point of theoretic
GDP. Through our measure and calculation, the GDP of China decreased 373.7, 492.8, 577 and
649.1 billion yuan respectively during the fourth quarter of 2008 and the first, second and third
quarter of 2009. They account for 4.0%, 7.5%, 7.8% and 8.3% of the real GDP respectively.
The affect of the other factors was also evident. The negative impact of economic cycle during
the fourth quarter of 2008 is evident. The positive impact of policies is more and more evident
in 2009. The plans of simulating economy make China resist the impact of international
financial crisis effectively. The positive factors of policies got the maximum exertion during the
third quarter of 2009 and offset 70% of the negative impact of financial crisis.
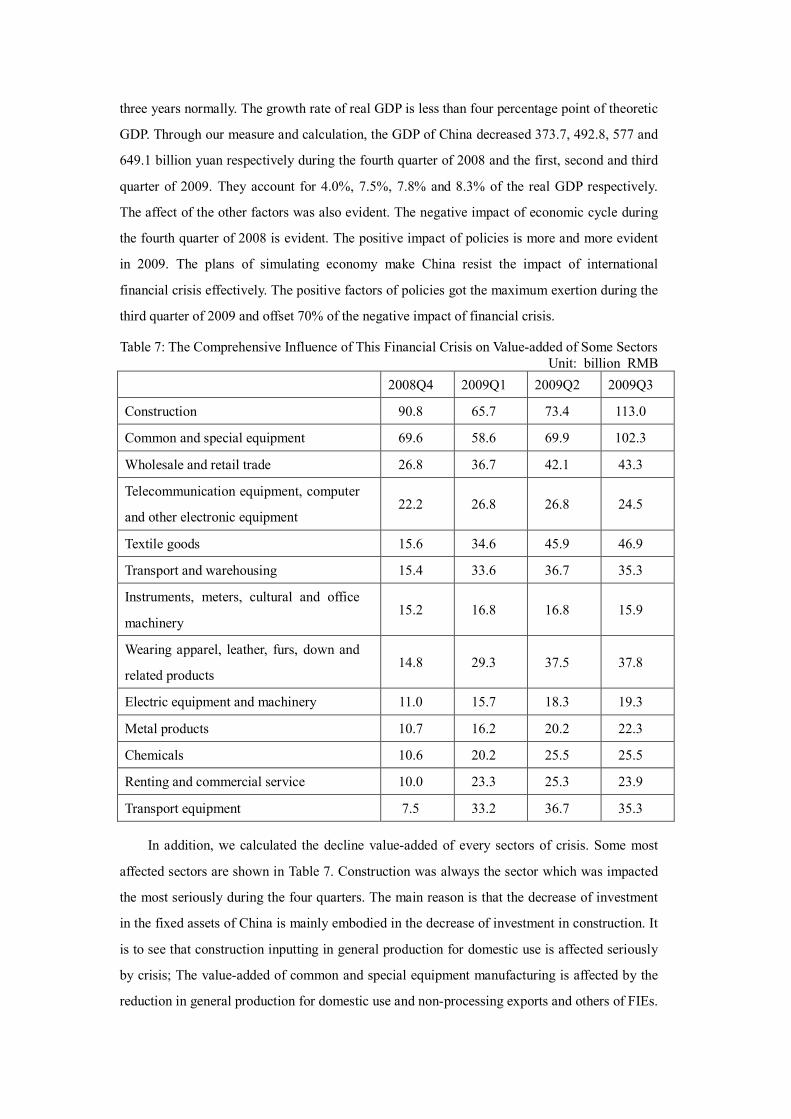
Table 7: The Comprehensive Influence of This Financial Crisis on Value-added of Some Sectors Unit: billion RMB
2008Q4 2009Q1 2009Q2 2009Q3
Construction 90.8 65.7 73.4 113.0
Common and special equipment 69.6 58.6 69.9 102.3
Wholesale and retail trade 26.8 36.7 42.1 43.3
Telecommunication equipment, computer
and other electronic equipment 22.2 26.8 26.8 24.5
Textile goods 15.6 34.6 45.9 46.9
Transport and warehousing 15.4 33.6 36.7 35.3
Instruments, meters, cultural and office
machinery 15.2 16.8 16.8 15.9
Wearing apparel, leather, furs, down and
related products 14.8 29.3 37.5 37.8
Electric equipment and machinery 11.0 15.7 18.3 19.3
Metal products 10.7 16.2 20.2 22.3
Chemicals 10.6 20.2 25.5 25.5
Renting and commercial service 10.0 23.3 25.3 23.9
Transport equipment 7.5 33.2 36.7 35.3
In addition, we calculated the decline value-added of every sectors of crisis. Some most
affected sectors are shown in Table 7. Construction was always the sector which was impacted
the most seriously during the four quarters. The main reason is that the decrease of investment
in the fixed assets of China is mainly embodied in the decrease of investment in construction. It
is to see that construction inputting in general production for domestic use is affected seriously
by crisis; The value-added of common and special equipment manufacturing is affected by the
reduction in general production for domestic use and non-processing exports and others of FIEs.
During 42 sectors of IO table, the decline value-added of chemicals became larger and larger
quarterly. The rank was from eleventh in the fourth quarter of 2008 to seventh in the third
quarter of 2009. The main reason is that non-processing exports which accounted for 63% of
this sector exports, plays an important role. In this crisis, non-processing exports was affected
more deeply than processing exports. Additionally, the value-added of non-processing exports is
more than processing exports. The value-added of instruments, meters, cultural and office
machinery is less and less quarterly due to this sector holding 87% processing exports.
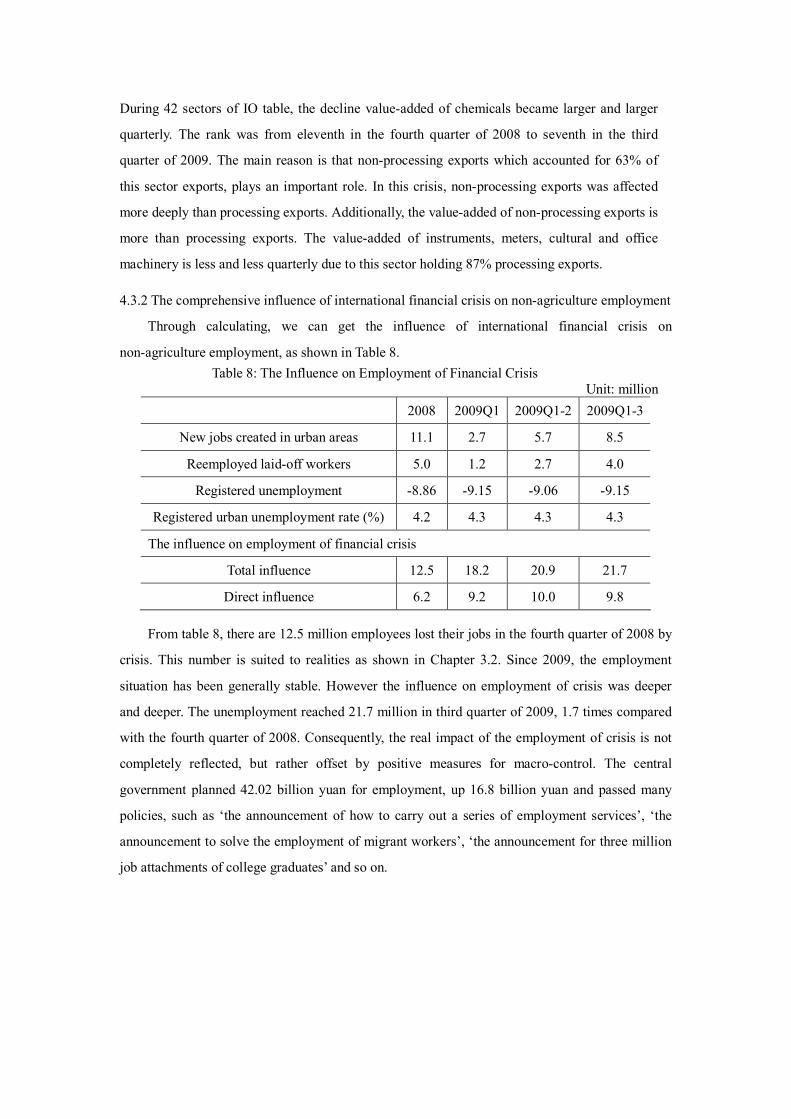
4.3.2 The comprehensive influence of international financial crisis on non-agriculture employment
Through calculating, we can get the influence of international financial crisis on
non-agriculture employment, as shown in Table 8. Table 8: The Influence on Employment of Financial Crisis
Unit: million 2008 2009Q1 2009Q1-2 2009Q1-3
New jobs created in urban areas 11.1 2.7 5.7 8.5
Reemployed laid-off workers 5.0 1.2 2.7 4.0
Registered unemployment -8.86 -9.15 -9.06 -9.15
Registered urban unemployment rate (%) 4.2 4.3 4.3 4.3
The influence on employment of financial crisis
Total influence 12.5 18.2 20.9 21.7
Direct influence 6.2 9.2 10.0 9.8
From table 8, there are 12.5 million employees lost their jobs in the fourth quarter of 2008 by
crisis. This number is suited to realities as shown in Chapter 3.2. Since 2009, the employment
situation has been generally stable. However the influence on employment of crisis was deeper
and deeper. The unemployment reached 21.7 million in third quarter of 2009, 1.7 times compared
with the fourth quarter of 2008. Consequently, the real impact of the employment of crisis is not
completely reflected, but rather offset by positive measures for macro-control. The central
government planned 42.02 billion yuan for employment, up 16.8 billion yuan and passed many
policies, such as ‘the announcement of how to carry out a series of employment services’, ‘the
announcement to solve the employment of migrant workers’, ‘the announcement for three million
job attachments of college graduates’ and so on.
0
2
4
6
8
10
12
14
16
18
20
2008Q4 2009Q1 2009Q2 2009Q3
Million
Exports
FDI
DomesticInvestmentD
P
N
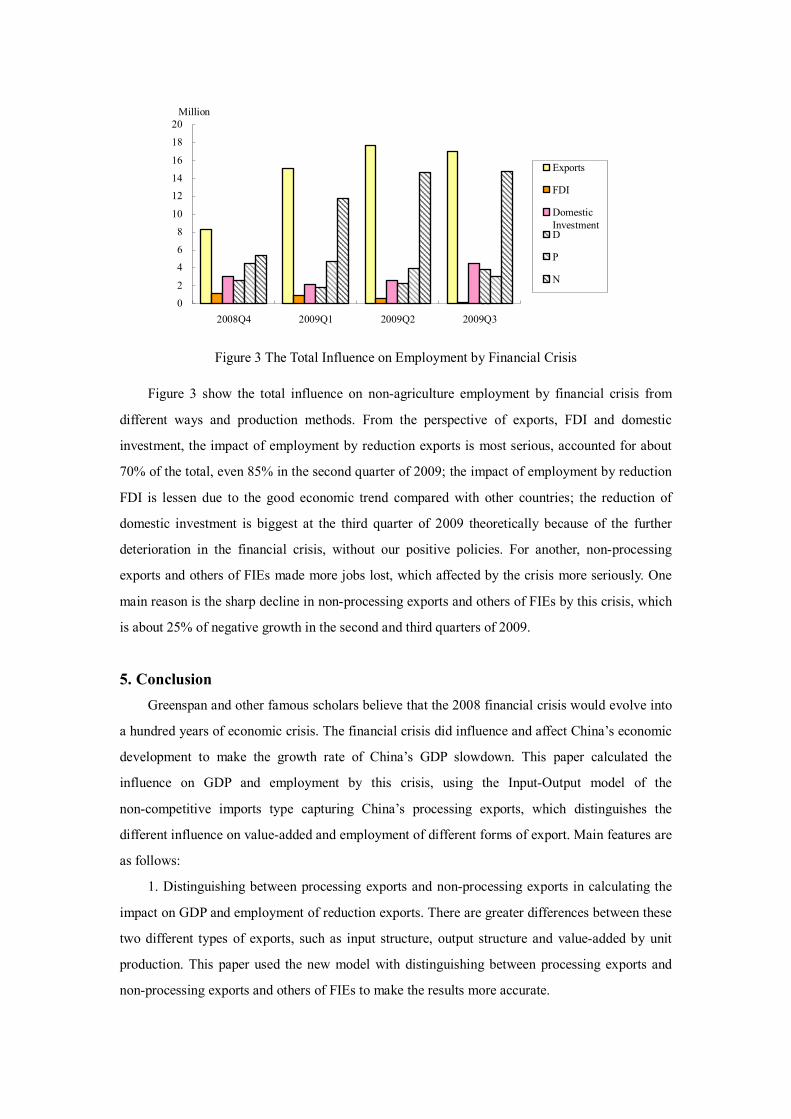
Figure 3 The Total Influence on Employment by Financial Crisis
Figure 3 show the total influence on non-agriculture employment by financial crisis from
different ways and production methods. From the perspective of exports, FDI and domestic
investment, the impact of employment by reduction exports is most serious, accounted for about
70% of the total, even 85% in the second quarter of 2009; the impact of employment by reduction
FDI is lessen due to the good economic trend compared with other countries; the reduction of
domestic investment is biggest at the third quarter of 2009 theoretically because of the further
deterioration in the financial crisis, without our positive policies. For another, non-processing
exports and others of FIEs made more jobs lost, which affected by the crisis more seriously. One
main reason is the sharp decline in non-processing exports and others of FIEs by this crisis, which
is about 25% of negative growth in the second and third quarters of 2009.
5. Conclusion Greenspan and other famous scholars believe that the 2008 financial crisis would evolve into
a hundred years of economic crisis. The financial crisis did influence and affect China’s economic
development to make the growth rate of China’s GDP slowdown. This paper calculated the
influence on GDP and employment by this crisis, using the Input-Output model of the
non-competitive imports type capturing China’s processing exports, which distinguishes the
different influence on value-added and employment of different forms of export. Main features are
as follows:
1. Distinguishing between processing exports and non-processing exports in calculating the
impact on GDP and employment of reduction exports. There are greater differences between these
two different types of exports, such as input structure, output structure and value-added by unit
production. This paper used the new model with distinguishing between processing exports and
non-processing exports and others of FIEs to make the results more accurate.
2. Distinguishing the influence caused by international financial crisis, economic circle and
macro-control policy. China’s economic had a sudden downturn in the fourth quarter of 2008 due
to international financial crisis and economic circle acted together. The good economic tend is
credited with the macro-control policy. How much does the international financial crisis affect
China’s GDP and employment? We cannot see it form the macro-control economic data. This
paper analyzed the influence of financial crisis on China’s export and investment to distinguish the
influence caused by international financial crisis, economic circle and macro-control policy
3. Constructing the occupancy part for employment. This paper calculated employment of
every sector in IO table with 2008 data in order to ensure the reliability of basic data.
From the results, we can see that the impact of financial crisis on China is indeed a gradual
deepening. The reduction of GDP is 649 billion yuan in third quarter of 2009 form 374 billion
yuan in fourth quarter of 2008. The number of unemployment is 21.7 million in third quarter of
2009 form 12.5 million in fourth quarter of 2008. The real impact on the employment of crisis is
not completely reflected. The results show that various economic plans are indeed effective. China
maybe become the first country which economic turn better after international financial crisis.
References Xuegong Sun, Feilun Du. The Influence and Countermeasures on China’s Economic of US Financial Crisis.
Economic Review. 2008,11:16-20.
Huiqing Gao, Yizhi Xiong, Shaowei Hu. The international financial crisis and the influence on China’s
economic. International Finance Research. 2008,11:49-52.
Chuang Yih-chyi.Human Capital,Exports, and Economic Growth:A Causality Analysis for Taiwan,
1925-1995. Review of International Economies. 2000,8(4):712-720.
Cai F. The impact of financial crisis on employment and policies responding impact. China Development
Observation.2009.3:5-9.In Chinese.
Chen Xk. China's 1995th Foreign Trade Input-Occupancy-Output Table and Its Application. Chinese
Input-Output Society Annual Conference Paper No.5.2001.In Chinese.
Lawrence J. Lau, Chen Xk, Yang Ch et al. Non-Competitive Input-Output and Its Application : An
Examination of the China-U.S. Trade Surplus. Social Sciences in China, 2007(5): 91-103.In Chinese.
Zhu Kf. The Theory and Application of Input-Occupancy-Output Model of the Non-Competitive Imports
Type Capturing China's Processing Exports. Chinese Academy of Sciences PhD thesis, 2008.In Chinese.
Lawrence J.Lau, Chen Xk, Cheng Lk, ect. Estimation of U.S.-China Trade Balances in Terms of Domestic
Value-Added. Working Paper, N0.295, Stanford Center for International Development, Stanford University;
Working Paper, No.2, Institute of Economics ,The Chinese University of Hong Kong.
Haizhen Yang, Yinhua Li, Yanping Zhao, Jing Li. The Trend of International Capital Flow in the Financial
Turmoil and Its Influence on Chinese Economy. Management Review. 2009,21(2):40-45.
Jiawei Zhang, Xiaonan Qi, Xun Zhang et al. An Analysis of the Effect of Financial Crisis to China s Foreign
Trade in 2009. Management Review. 2009,21(2):46-52.