how reliable is natural gas? an historical overview of ... gas... · 1 how reliable is natural gas?...
TRANSCRIPT
1
How Reliable Is Natural Gas? An Historical Overview of Natural Gas Transmission’s Outage
Track Record
Carly Page, Public Utilities Commission of Nevada, [email protected] 1
Introduction
This paper attempts to quantify the reliability of natural gas transmission in the United States. Natural gas
reliability has often been discussed at a high level. It is reliable. When did you last hear of an outage, after
all? However, more specific metrics for natural gas reliability could be helpful as natural gas use expands
in the United States.
Industry has promoted natural gas reliability in the past. While state and federal government agencies
have closely monitored industry safety and environmental impacts, however, natural gas reliability has
not been precisely quantified.
As natural gas use has grown in the United States, customers, regulators and emergency planners have
focused ever more scrutiny on whether this “just-in-time fuel” can be reliably delivered to homes,
businesses and power plants nationwide. The power industry in particular has raised concerns about fuel
dependency as natural gas-fired generation grows. The electric grid is increasingly dependent on natural
gas deliveries. As discussed in many studies and cases, natural gas-fired power generation is increasing.
This is occurring largely because natural gas is a relatively low carbon and cost effective energy.2
Increasing natural gas fired generation is also a popular power generation source because gas-fired plants
are relatively flexible capable of quick ramping and startup, which is helpful as intermittent renewable
generation increases variability.
The North American Energy Reliability Corporation (NERC) has begun monitoring power markets for
“single fuel dependency” issues related to an increasing share of power generation fueled by “just-in-
time” natural gas. In addition, the Federal Energy Regulatory Commission (FERC) has closely monitored
gas/electric coordination and proposed several reforms to promote reliable natural gas fuel delivery to
power generators. Some in the industry and in government have promoted the need to maintain backup
power generation for times when the sun does not shine and the wind does not blow and natural gas
pipelines have an outage.3 This fuel diversity argument for baseload coal and nuclear alternatives to
natural gas generation may be weakened if natural gas delivery is, in fact, proved very reliable.
As industry and regulators assess the need for back-up generation for emergencies when a pipeline is
down, the question of how frequently such an outage might occur arises. This paper seeks to take the first
step in assessing the natural gas outage risk that might be hedged with alternate infrastructure or proposals
to maintain fuel diversity. How reliable is natural gas? How often do outages occur and what are the
causes? Such an outage risk assessment is essential in determining whether and how much alternative
energy sources and backup power generation might be needed in an emergency. Indeed, if natural gas
1 This document, including any attachments, is solely for the use of the individual or entity intended to receive it. It
may contain confidential and proprietary information and any unauthorized review, use, disclosure or distribution is
prohibited. This paper is the sole opinion of the author and does not reflect the policies or opinions of Public
Utilities Commission of Nevada. 2 U.S. carbon dioxide (CO2) emissions from the power sector have substantially declined. Between 2006 and 2014,
61 percent of these reductions are attributed to switching from coal- to gas-fired power generation and 39 percent to
increases in zero-emissions generation. QER 1.2
https://energy.gov/sites/prod/files/2017/01/f34/Summary%20for%20Policymakers_1.PDF 3 See, e.g. Utility Dive. “Exelon to push for PJM market reforms to add to ZEC wins”
http://www.utilitydive.com/news/exelon-to-push-for-pjm-market-reforms-to-add-to-zec-wins/448692/
2
delivery has a spotty reliability track record, calls for incentives to maintain backup power in the form of
coal piles or nuclear power generators may be more justified. On the other hand, if natural gas delivery
outages occur infrequently, system operators may find that the cost of maintaining some plants as fuel
diversity just in case the wind doesn’t blow, the sun doesn’t shine and a pipeline outage occurs all at the
same time in the same region may not be justifiable. In order to determine how much backup is needed to
hedge outage risks, however, it is important to quantify outage risks. This paper proposes a mechanism to
assess natural gas transmission outage risk based on historical data in order to start assessing the need for
backup.
This natural gas reliability project assesses historical natural gas disruptions and damage (2005-2015) in
order to present the power industry, as well as other customers and regulators, with a natural gas
reliability track record of the frequency of incidents and outages on natural gas transmission and storage
systems. While the dataset does capture production outages, the focus of this natural gas reliability
assessment is on the transmission sector and its ability to reliably deliver this critical “just-in-time” fuel to
customers. Like all network industries, natural gas transmission is the bottle neck of the supply chain and
thus an outage on a pipeline is impactful. This assessment of publicly available natural gas incident
reports reveals that major outages are relatively rare and the overall natural gas delivery system is
resilient. Additional analysis of the natural gas industry is needed to fully quantify all disruption risks that
may impact power generators and other customers. However, this historical assessment indicates a
reliable, resilient natural gas transmission system.
Literature Review
The U.S. natural gas industry has historically been considered very reliable.4 The industry also retains a
reputation for resiliency in that there are significant redundancies built into the system in order to avoid
outages at the burner-tip. Indeed, the first Department of Energy-led Quadrennial Energy Review (QER)
highlighted natural gas reliability and elicited several stakeholder comments explaining how the industry
maintains reliable and resilient operations.5 Industry has touted its track record of infrequent incidents and
robust infrastructure as well.6 The natural gas industry trade associations recently published their own
overview of natural gas industry reliability, which explains how redundant systems, effective contract
incentives and security programs maintain a reliable industry.7
4 For ease, the definitions of “reliability” and “resilience” used in the second Quadrennial Energy Review (QER) on
the electric grid are used here to apply to a similarly large and complex natural gas industry. While also important, security is not the focus of this paper but its definition is included below:
[R]eliability is the ability of the system or its components to withstand instability, uncontrolled events,
cascading failures, or unanticipated loss of system components. Resilience is the ability of a system or its
components to adapt to changing conditions and withstand and rapidly recover from disruptions. Security
refers specifically to the ability of a system or its components to withstand attacks (including physical and
cyber incidents) on its integrity and operations. (Transforming the Nation’s Electricity System: The
Second Installment of the QER | January 2017, p. 4-4. https://energy.gov/epsa/quadrennial-energy-review-
qer) 5 Quadrennial Energy Review (QER) First Installment: TRANSFORMING U.S. ENERGY INFRASTRUCTURES
IN A TIME OF RAPID CHANGE p. NG- 44
https://www.energy.gov/sites/prod/files/2015/09/f26/QER_AppendixB_NaturalGas.pdf 6 See, e.g. utility QER comments on natural gas reliability: Resilience White Paper American Gas Association
October 10, 2014. https://energy.gov/sites/prod/files/2015/04/f21/AGA%20QER%20Comments%20-
%20System%20Resiliency.pdf or INGAA representative, Curt Moffat, Statement:
https://energy.gov/sites/prod/files/2014/07/f18/denver_qermeeting_moffatt_statement.pdf 7 Natural Gas Council. “Natural Gas: Reliable and Resilient” July 2017.
http://www.ngsa.org/download/analysis_studies/NGC-Reliable-Resilient-Nat-Gas-WHITE-PAPER-Final.pdf

3
Academic institutions such as the Massachusetts Institute of Technology (MIT) have also put forward
assessments of the potential reliability impacts of events such as a large power outage. MIT’s assessment
of natural gas reliability impacts on power generation relied on models and not historical data.8
The United States also maintains extensive safety reporting requirements through the Department of
Transportation’s Pipeline and Hazardous Materials Safety Agency (PHMSA).9 PHMSA collects data on
accidents, injuries and fatalities as well as monetary costs of any pipeline damage across the country.
While these safety statistics may be helpful in assessing industry performance, they do not consider
supply delivery reliability per se. Thus, U.S. government agencies devote extensive resources to one-time
after-event reports assessing significant infrastructure failures and natural disasters. For example, the
Polar Vortex of 2014 was featured in reports from both FERC and NERC on the energy equipment frozen
or damaged by extreme cold weather.10 The Southwest Outages of 2011 caused by a regional cold snap
also garnered an assessment of and report on reliability failures in both natural gas and power industries,
which led to service interruptions for customers.11 States also have collected information on natural gas
reliability risks specific to their geography. For example, California has explored the past impacts of
earthquakes on natural gas deliveries and pipeline safety.12 These reports offer useful insights into
emergency management and energy system resiliency but their ad hoc nature tends to lead to government
staff and researchers “reinventing the wheel” each time a disaster strikes and outage causes must be
identified.
The Department of Energy’s Infrastructure Security and Energy Restoration (ISER) group, which is part
of the Office of Electricity, produces valuable emergency situation reports after natural disasters that
describe the impact of hurricanes, wildfires, earthquakes and other events that damage critical energy
infrastructure and cause service disruptions. These ISER assessments of blackouts, production outages,
disruptions and transmission damage provide insights on electric grid and natural gas system reliability
and resiliency in emergencies.13 However, they remain snapshots into operations during relatively
infrequent catastrophes. Like FERC and NERC’s reports on past reliability failures described above,
ISER’s reports do not assess overall energy reliability. Nor do any of these reports collect generalized
reliability and resiliency trends across time for natural gas operations.
Finally, natural gas reliability is a concern internationally as well as within the United States. For
example, the International Gas Union cited the reliable performance of natural gas in the United Kingdom
when asserting that “[n]atural gas has the most reliable, accessible and resilient supply network, around
the clock and across the globe.”14 New Zealand regulators, in assessing their domestic industry write that
“…pipelines are inherently reliable and, as New Zealand history indicates, rarely fail to the extent that
8 N. Judson. Interdependence of the Electricity Generation System and the
Natural Gas System and Implications for Energy Security. Technical Report 1173.” Massachusetts Institute of
Technology, Lincoln Laboratory, Group 99, 15 May 2013. 9 Pipeline and Hazardous Materials Safety Administration. “Pipeline Incident Trends.”
https://www.phmsa.dot.gov/pipeline/library/data-stats/pipelineincidenttrends, as of 2017 10 FERC presentation on Polar Vortex. AD14-8-000 April 1, 2014. https://www.ferc.gov/legal/staff-reports/2014/04-
01-14.pdf NERC Polar Vortex of 2014 Report
http://www.nerc.com/pa/rrm/January%202014%20Polar%20Vortex%20Review/Polar_Vortex_Review_29_Sept_20
14_Final.pdf 11 Staffs of the Federal Energy Regulatory Commission and the North American Electric Reliability Corporation.
“Report on Outages and Curtailments During the Southwest Cold Weather Event of February 1-5, 2011.”
https://www.ferc.gov/legal/staff-reports/08-16-11-report.pdf. August 2011 12 “Improving Natural Gas Safety in Earthquakes.” Adopted July 11, 2002. 13 “Emergency Situation Reports.” https://www.oe.netl.doe.gov/emergency_sit_rpt.aspx 14 http://www.igu.org/natural-gas-reliable IGU as of June 8, 2017

4
they affect vulnerable customers.”15 International energy reliability regimes do offer some useful lessons
for the United States. In particular, New Zealand appears to be able to assert natural gas reliability with
such assurance because they have instituted extensive incident reporting for the industry. The detailed
incident reporting in New Zealand provides proof of the generally accepted assertion that natural gas
pipelines tend to be reliable. As reference the list of reportable incidents New Zealand requires that
operators collect follows:
• Network Reliability and Interruptions (Sch 10a), including:
o Interruptions and Reliability (Sch 10a(i))
o Compressor Availability (Sch 10a(ii))
• Network Integrity (Sch 10b), including
o Number of incidents relating to pressure
o Number of incidents relating to gas specification
o Number of incidents relating to odorisation
o Proportion of emergencies responded to within 3 hours
o Average call response time (hours)
o Number of emergencies
o Number of confirmed public reported gas escapes per 1000 km of pipeline
o Number of confirmed gas leaks caused by a third party per 1000 km of pipeline
o Number of gas leaks detected by the GTB
o Number of gas leaks that did not result in disruption to supply16
The U.S. pipeline grid is not necessarily inherently more risky than any other country’s system, including
New Zealand’s industry with its documented reliability track record. However, unlike New Zealand, the
U.S. does not have a comparable data collection outlining incident frequency, reliability impacts and
causes. In fact, as several studies have shown, there may be value in collecting similar data in the United
States. For example, Argonne National Lab has conducted extensive work outlining the impacts of natural
gas fuel disruptions on power generation.17 Argonne’s modelling of natural gas storage details the
consequences of a natural gas reliability failure that results in an outage of a large piece of delivery
infrastructure that does not have alternatives. This research may be improved by the consideration of
resiliency built into the natural gas industry, which could be revealed in an assessment of past events. In
particular, there is the possibility that considering past infrastructure outages will highlight alternate
sources of supply, parallel routes and redundant infrastructure that can be called upon when individual
components fail. Similarly, other natural gas reliability assessments by RTOs, ISOs, FERC and utilities
could be informed by historical failure rates for infrastructure and resiliency measures that mitigated
infrastructure damage and failure in the past. This study attempts to develop an historical track record to
fill one of the gaps in previous natural gas reliability and outage impact analyses and to provide a way to
measure the impacts of infrastructure incidents.
Methodology and Study Description
This paper describes the assessment of historical natural gas transmission disruptions and damage (2005-
2015) in order to present a natural gas reliability track record of the frequency of incidents and outages on
natural gas transmission and storage. While the data analysis does capture production outages, the focus
15 Gas Transmission Security and Reliability, A Gas Industry Co Issues Paper – April 2016, p. 32 16 Id at p. 13 17 See, e.g. Steve Folga, et.al. “U.S. Natural Gas Storage Risk-Based Ranking Methodology and Results.” December
2016. https://www.osti.gov/scitech/biblio/1337151
5
of this natural gas reliability assessment and paper is on the transmission sector and its ability to reliably
deliver a critical “just-in-time” fuel to customers.
The below historical review of natural gas transmission incidents and outages is based on public
information on natural gas disruptions and damage as collected by U.S. DOE’s ISER from 2005-2015.18
For purposes of this analysis, upstream "production" and downstream local distribution company or
"LDC" incidents are not considered natural gas delivery outages because they are outside of pipelines’
control. These outages were noted as separate events similar to how the electric industry might consider a
local electric utility outage versus a generator issue, and have been saved for future analysis.
The analysis uses reported incidents that could have impacted the function of natural gas transmission,
pipeline delivery and storage withdrawals. The analysis identifies the causes of damage to and outages on
natural gas infrastructure and then categorizes each incident by volume and type. This paper is not an
assessment of company-specific data and does not rely on proprietary information. Further, the full
downstream impacts of each incident are not quantified, i.e. this paper does not show how much natural
gas did or did not make it to retail customers’ burner tip after an outage, though this calculation of
downstream impacts is recommended as a follow-on study. Finally, information on accidents and injuries
that did not impact transmission operation related to natural gas industry activities is excluded here.
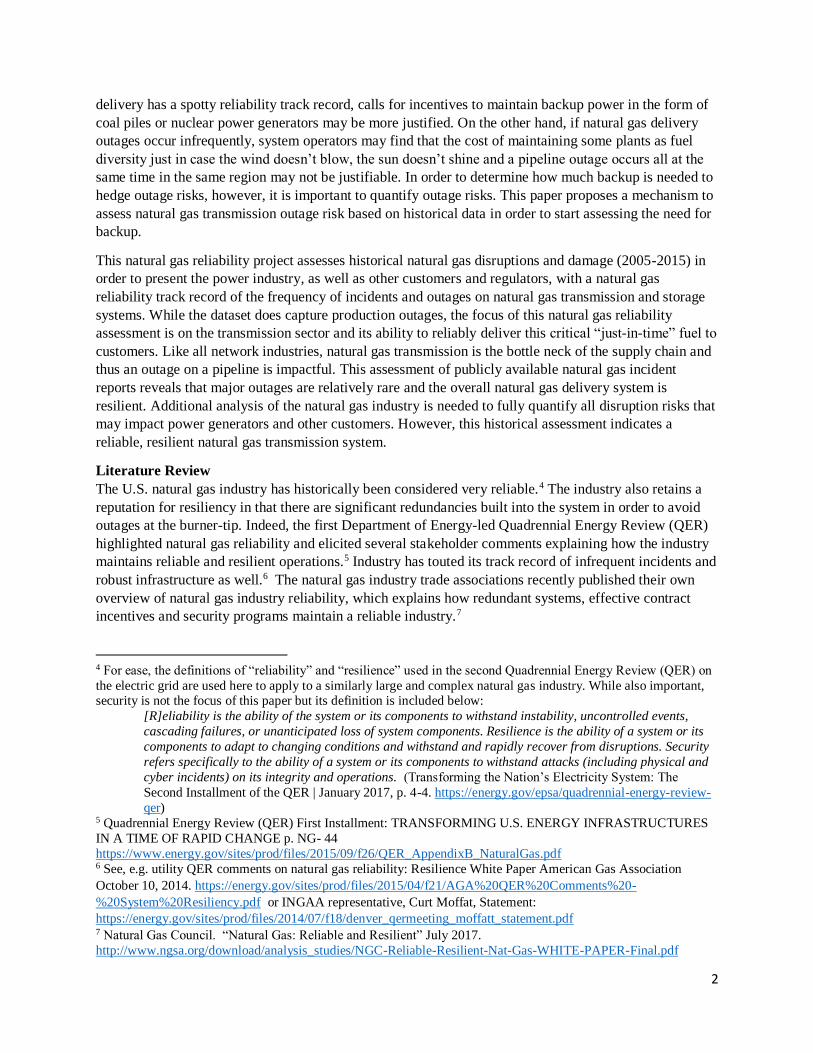
For analytical purposes, “incidents” on the natural gas transmission system considered in this analysis
were divided into three sizes or volumetric impact categories, measured in million cubic feet per day
(MMcf/d) of transmission throughput reductions.19 The author acknowledges at the outset that volume
reductions may not be a perfect reliability measure. However, to provide some type of scaling and
comparison of what should constitute a natural gas disruption, each event from 2005 to 2015 is assigned a
volumetric impact. These volumes represent delivery capacity that is not available for use and, thus, that
could leave customers without supplies or seeking alternative sources. Incidents here are divided into
those that did not disrupt throughput (“0”), those that did disrupt some throughput (“1” or higher) and
“major outages” of 500 MMcf/d or greater, which disrupted large amounts of throughput for at least one
day. The 500 MMcf/d cut-off for major outages was chosen as a reasonable approximation of daily fuel
use for a natural gas-fired power generator. A 500 MMcf/d of pipeline capacity outage could theoretically
impact electric operations by impacting a generator’s access to fuel supplies and would be a noticeably
large [though certainly not catastrophic] reduction in available delivery capacity.
Table 1
Outage Size Categories
(million cubic feet per
day=MMcf/d)
Definition
Note: All reported volumes are converted to MMcf/d if possible.
0 No Outage: No throughput reduction, no customer outages or a small
gas flow reductions of less than 8 hours which does not measurably
impact deliveries, not including planned, regular maintenance
18 The daily Energy Assurance reports were collated and summarized in Annual Energy Assurance reports here:
https://energy.gov/oe/services/energy-assurance. Note that EA’s have been discontinued as of June 2017. 19 Note that, because of the chosen volumetric measure (MMcf/d), an “outage” of any kind must perforce last at least
one day. Thus if there is evidence that throughput was fully restored within less than one Gas Day, the incident is
assigned as reducing “0” throughput.

6
1 Unknown/Minimal Outage: A reported "outage" or "disruption" of
infrastructure with no volumes reported that nevertheless results in some
reduction in operationally available capacity or equipment damage
severe enough to obviously result in an inability to receive or deliver gas
i.e., pipeline explosion noted to have resulted in a segment being taken
out of service, or a fire that cannot be extinguished/repaired for a day or
hurricane damage noted to have "destroyed" or "taken out of service" a
given segment of delivery infrastructure. All such unknown throughput
reduction volumes are assumed to be a "1" MMcf/d outage, not
including planned, regular maintenance.
1<500 Minor Outage: A reported "outage" of infrastructure with stated volume
reductions, including force majeure declarations greater than "0"
MMcf/d.
500+ Major Outage: Any reported or declared damage resulting in more than
500 MMcf/day of throughput being removed from service, not including
planned, regular maintenance.
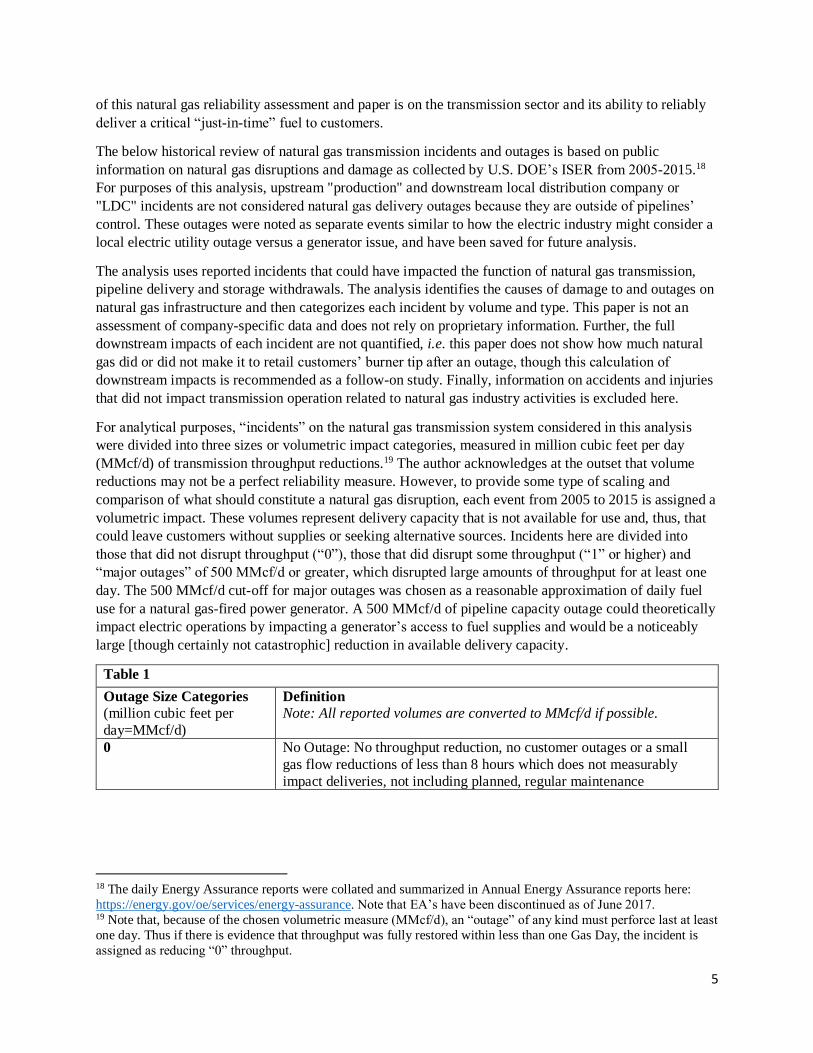
Next, each incident was categorized. As mentioned above, production and local distribution have been
removed from the immediate analysis and thus the “production” and Local Distribution Company
(“LDC”) categories are provided here only to illustrate where the assessment has ring fenced the
transmission sector off from upstream or downstream natural gas industry activities for purposes of this
analysis.20
Table 2
Categories of Events Definition
force majeure A declared act of God or announced failure to meet firm contracts with
reported reductions in throughput capacity available on a pipeline.
Typically posted on pipeline electronic bulletin boards (EBB).
repair outage An equipment outage for repairs that does reduce available throughput
capacity, including IT reductions and secondary firm. A repair outage
includes any damage that self-evidently would preclude shipping
through a segment for at least 1 day, e.g. a rupture caused by a pipeline
explosion.
Maintenance
(Not included as an outage)
Scheduled shutdowns for repairs or upgrades that does not result in
reported impacts on nominated volumes or operationally available
capacity. Regular maintenance is not counted as an "outage" and is excluded from analysis.
20 NB: Also deleted as irrelevant to this analysis are: 1) Economically-driven production outages/reductions; trend
stories; point-of-consumption problems: gas-fired generator technical issues or industrial consumer accidents, etc.,
lease sales; pipeline construction updates and issues; propane/NGLs pipelines; CNG station damages; ethanol
facilities; incidents in Hawaii, Alaska and Puerto Rico as they do not impact the interconnected natural gas markets
in the Lower 48 States.
7
Damage Any event that causes monetary harm or substantive (e.g. reportable to
PHMSA or state authorities) damage to natural gas transmission
infrastructure but that does not impact throughput at all or that can be
repaired without reducing deliveries, e.g. a pinhole leak.
storage force majeure A declared act of God or announced failure to meet firm contracts with
reported reductions in injection or withdrawal capacity available
storage damage Damage with no injection/withdrawal impacts to storage caverns or
associated equipment
storage repair outage An equipment outage for repairs or upgrades that does reduce available
injection/withdrawals, including IT. A repair outage includes any
damage that self-evidently would preclude shipping through a segment
for at least 1 day, e.g. an injection well failure. Reported here as
withdrawal capacity lost.
Production
(Not included)
Any non-economic outage, freeze-off or damage on natural gas
infrastructure upstream of the gas plant (wells, gathering lines,
processing and treatment plants etc.) Does not include exploratory
wells.
LDC
(Not included)
Damage or outage behind the city gates, which may result in customer
natural gas service disruptions but which is contained on an LDC
system
Finally, each incident was coded by its proximate cause. One of four broad cause codes, outlined below,
were selected for each incident based on reports, news articles and government investigations. Weather
and human-caused incidents were further coded by type in the data analysis file to break out accidents
versus sabotage and weather types, such as hurricanes, flooding or tornadoes. These cause codes are
relatively broad and thus can mask the complexity of some incidents. Also, these categories note the
major cause of the damage, outage or other event on the gas system and may not capture background
contributing factors such as infrastructure age, location, etc.
Table 3
Cause Codes Definition
Human Damage is caused by deliberate or accidental human interference with
infrastructure or equipment. This cause code includes vehicle-caused
damage to infrastructure.
Mechanical Accidental or "wear-and-tear" equipment damage that occurs without
direct human intervention, e.g. a leak from a seam between pipeline
segments or a compressor failure. If no other cause is reported,
"mechanical" is default cause code.
Weather Outages and equipment damage caused by hurricanes, storms and
freeze-offs
Gas/Electric Natural gas infrastructure damage and disruptions caused by a power
outage, quality change or other electric utility fault

8
Results
Natural gas transmission is reliable. Natural gas outages are relatively rare. Major outages that have the
potential to cause downstream disruptions are even rarer. Over 200 natural gas pipelines operate across
the United States comprised of over 300,000 miles of pipeline.21 As discussed in more detail below,
failures are infrequent despite the size of the system.
By contrast, the electric industry has relatively more frequent outages as well as “major” outage events.
ISER collects power outage incident reports as well as natural gas. As shown in the two figures below,
138 power outages were reported in 2015 in addition to the 12 major power outages.22 It is difficult to
equate power disruptions with natural gas transmission outages because of the operational differences.
However, considering the 2015 snapshot of twelve large power outages exceeds the number of “major”
natural gas outages in every year of this analysis, noticeable or major disruptions seem to be more
frequent on the power grid. Relatively more frequent power outages is unsurprising given the challenges
of instantaneously balancing supply and demand on the power grid. It is worth noting the difference in
outage frequency, however, since power system operators may instinctively assume that energy systems
face similar outage profiles. A coal pile just out the back door seems all the more comforting relative to
unseen pipeline systems when experience has conditioned electric system operators to regular failures.
Figure 3: Large-Scale U.S. Electric Customer Outage Events, 201523
The
natural gas transmission system has suffered few disruptions over the ten years of this study. The analysis
of publicly available reports collated in the Department of Energy’s Energy Assurance reports over ten
years (2005-2015) shows that incidents that could reduce throughput or withdrawal capacity on natural
gas pipelines and out of storage caverns are reported 40 times per year on average. Actual outages
resulting in throughput reductions on natural gas pipelines occurred on average 32 times per year. Major
21 Energy Information Administration. “About U.S. Natural Gas Pipelines – Transporting Natural Gas.”
https://www.eia.gov/pub/oil_gas/natural_gas/analysis_publications/ngpipeline/index.html 22 ISER defines a “large” power outage as one that cuts power to at least 250,000 customers with small-scale events
impacting several thousand customers. Note that these events are reported by utility company and thus may each
represent several discrete infrastructure failures or outages rolled up into a single utility footprint-wide “event.” 23 “2015 Year in Review.” Office of Electricity Delivery and Energy Reliability U.S. Department of Energy.
https://energy.gov/sites/prod/files/2016/06/f32/2015-YIR-05122016.pdf
9
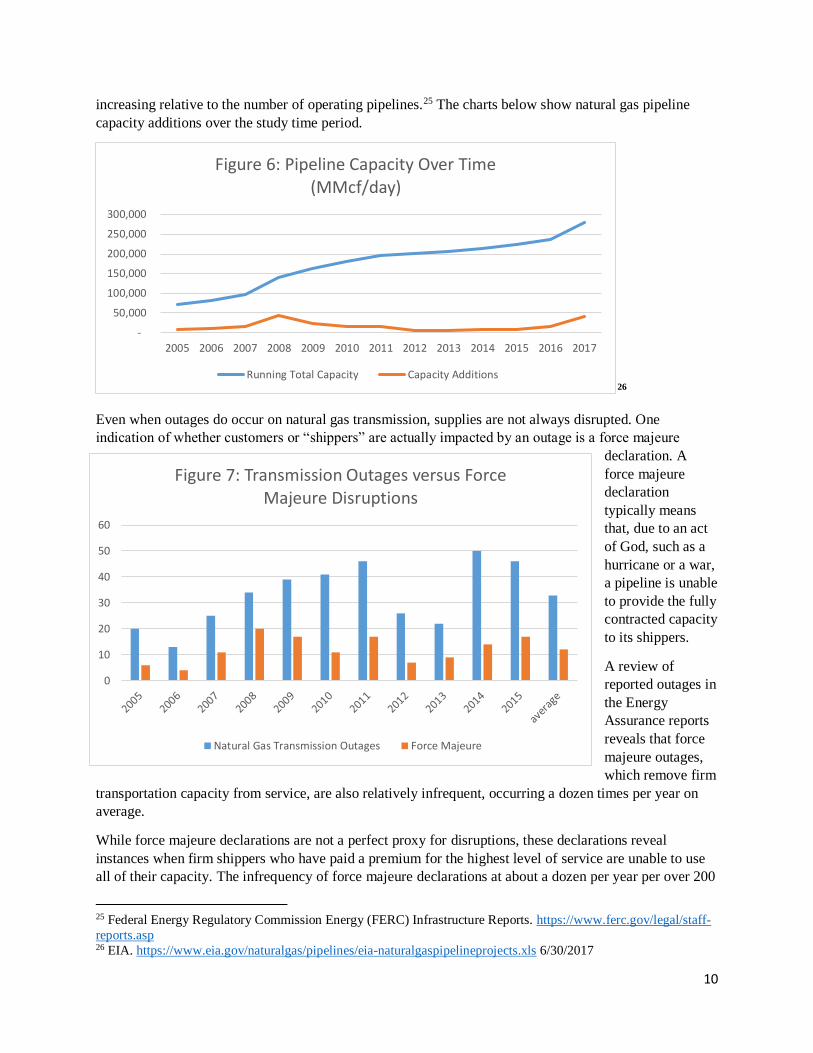
outages, as defined here, are very rare and occur on average about 3 times per year based on the reported
data. This outage frequency is particularly striking when considering that over 200 interstate natural gas
pipelines are operating every day across the U.S.
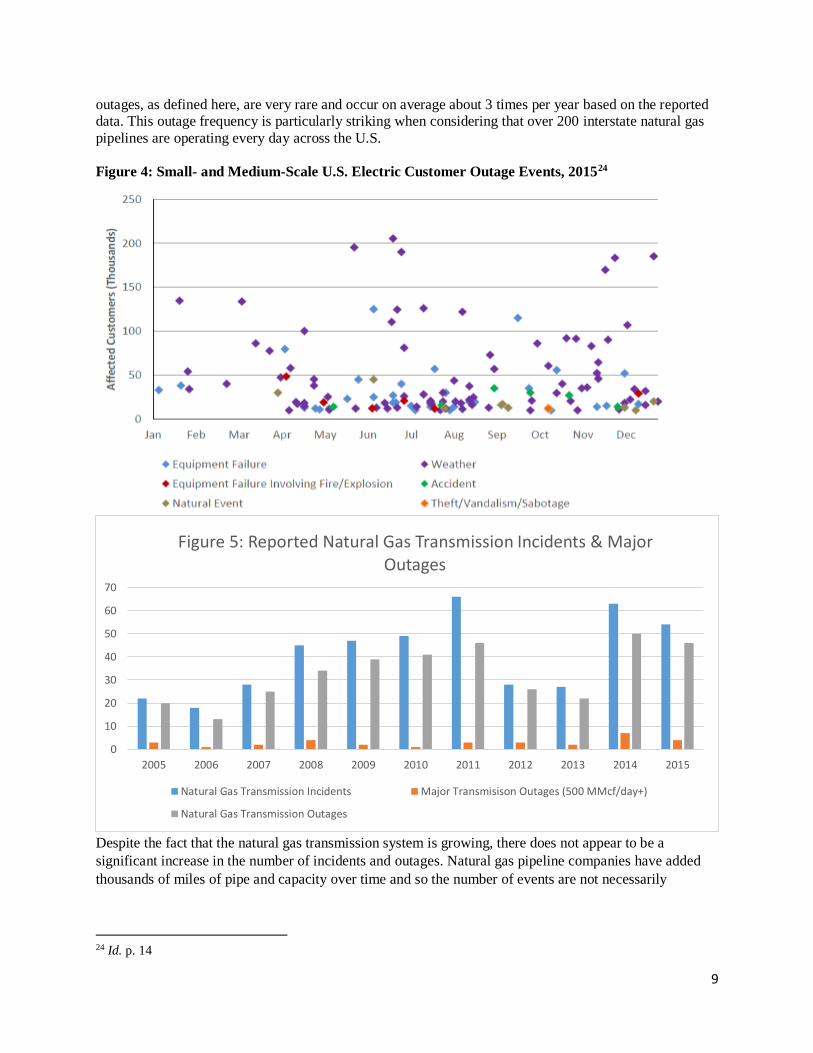
Figure 4: Small- and Medium-Scale U.S. Electric Customer Outage Events, 201524
Despite the fact that the natural gas transmission system is growing, there does not appear to be a
significant increase in the number of incidents and outages. Natural gas pipeline companies have added
thousands of miles of pipe and capacity over time and so the number of events are not necessarily
24 Id. p. 14
0
10
20
30
40
50
60
70
2005 2006 2007 2008 2009 2010 2011 2012 2013 2014 2015
Figure 5: Reported Natural Gas Transmission Incidents & Major Outages
Natural Gas Transmission Incidents Major Transmisison Outages (500 MMcf/day+)
Natural Gas Transmission Outages
10
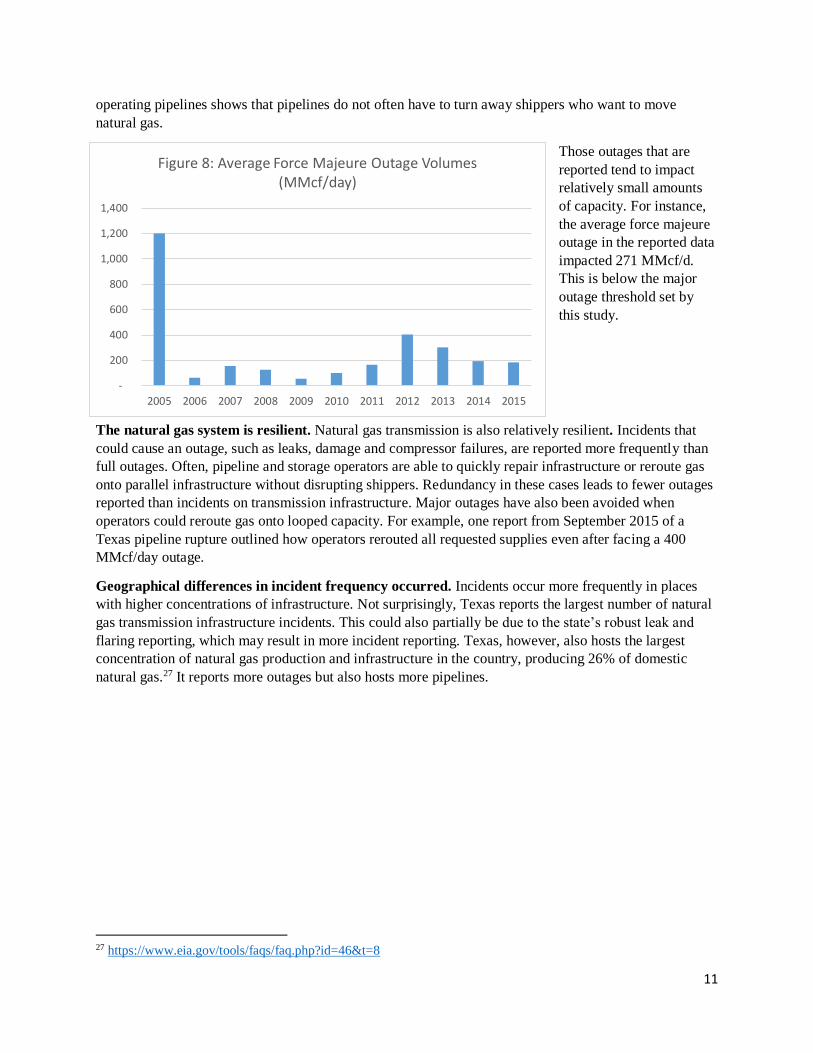
increasing relative to the number of operating pipelines.25 The charts below show natural gas pipeline
capacity additions over the study time period.
26
Even when outages do occur on natural gas transmission, supplies are not always disrupted. One
indication of whether customers or “shippers” are actually impacted by an outage is a force majeure
declaration. A
force majeure
declaration
typically means
that, due to an act
of God, such as a
hurricane or a war,
a pipeline is unable
to provide the fully
contracted capacity
to its shippers.
A review of
reported outages in
the Energy
Assurance reports
reveals that force
majeure outages,
which remove firm
transportation capacity from service, are also relatively infrequent, occurring a dozen times per year on
average.
While force majeure declarations are not a perfect proxy for disruptions, these declarations reveal
instances when firm shippers who have paid a premium for the highest level of service are unable to use
all of their capacity. The infrequency of force majeure declarations at about a dozen per year per over 200
25 Federal Energy Regulatory Commission Energy (FERC) Infrastructure Reports. https://www.ferc.gov/legal/staff-
reports.asp 26 EIA. https://www.eia.gov/naturalgas/pipelines/eia-naturalgaspipelineprojects.xls 6/30/2017
-
50,000
100,000
150,000
200,000
250,000
300,000
2005 2006 2007 2008 2009 2010 2011 2012 2013 2014 2015 2016 2017
Figure 6: Pipeline Capacity Over Time(MMcf/day)
Running Total Capacity Capacity Additions
0
10
20
30
40
50
60
Figure 7: Transmission Outages versus Force Majeure Disruptions
Natural Gas Transmission Outages Force Majeure
11
operating pipelines shows that pipelines do not often have to turn away shippers who want to move
natural gas.
Those outages that are
reported tend to impact
relatively small amounts
of capacity. For instance,
the average force majeure
outage in the reported data
impacted 271 MMcf/d.
This is below the major
outage threshold set by
this study.
The natural gas system is resilient. Natural gas transmission is also relatively resilient. Incidents that
could cause an outage, such as leaks, damage and compressor failures, are reported more frequently than
full outages. Often, pipeline and storage operators are able to quickly repair infrastructure or reroute gas
onto parallel infrastructure without disrupting shippers. Redundancy in these cases leads to fewer outages
reported than incidents on transmission infrastructure. Major outages have also been avoided when
operators could reroute gas onto looped capacity. For example, one report from September 2015 of a
Texas pipeline rupture outlined how operators rerouted all requested supplies even after facing a 400
MMcf/day outage.
Geographical differences in incident frequency occurred. Incidents occur more frequently in places
with higher concentrations of infrastructure. Not surprisingly, Texas reports the largest number of natural
gas transmission infrastructure incidents. This could also partially be due to the state’s robust leak and
flaring reporting, which may result in more incident reporting. Texas, however, also hosts the largest
concentration of natural gas production and infrastructure in the country, producing 26% of domestic
natural gas.27 It reports more outages but also hosts more pipelines.
27 https://www.eia.gov/tools/faqs/faq.php?id=46&t=8
-
200
400
600
800
1,000
1,200
1,400
2005 2006 2007 2008 2009 2010 2011 2012 2013 2014 2015
Figure 8: Average Force Majeure Outage Volumes (MMcf/day)
12
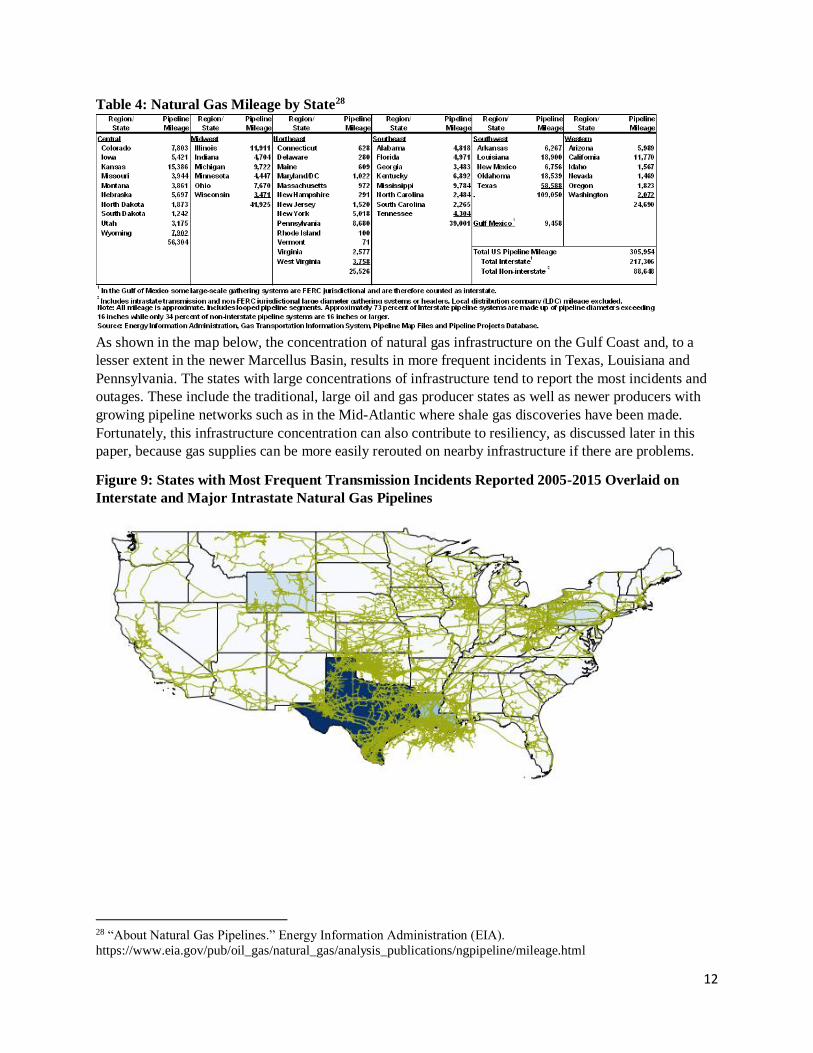
Table 4: Natural Gas Mileage by State28
As shown in the map below, the concentration of natural gas infrastructure on the Gulf Coast and, to a
lesser extent in the newer Marcellus Basin, results in more frequent incidents in Texas, Louisiana and
Pennsylvania. The states with large concentrations of infrastructure tend to report the most incidents and
outages. These include the traditional, large oil and gas producer states as well as newer producers with
growing pipeline networks such as in the Mid-Atlantic where shale gas discoveries have been made.
Fortunately, this infrastructure concentration can also contribute to resiliency, as discussed later in this
paper, because gas supplies can be more easily rerouted on nearby infrastructure if there are problems.
Figure 9: States with Most Frequent Transmission Incidents Reported 2005-2015 Overlaid on
Interstate and Major Intrastate Natural Gas Pipelines
28 “About Natural Gas Pipelines.” Energy Information Administration (EIA).
https://www.eia.gov/pub/oil_gas/natural_gas/analysis_publications/ngpipeline/mileage.html
13
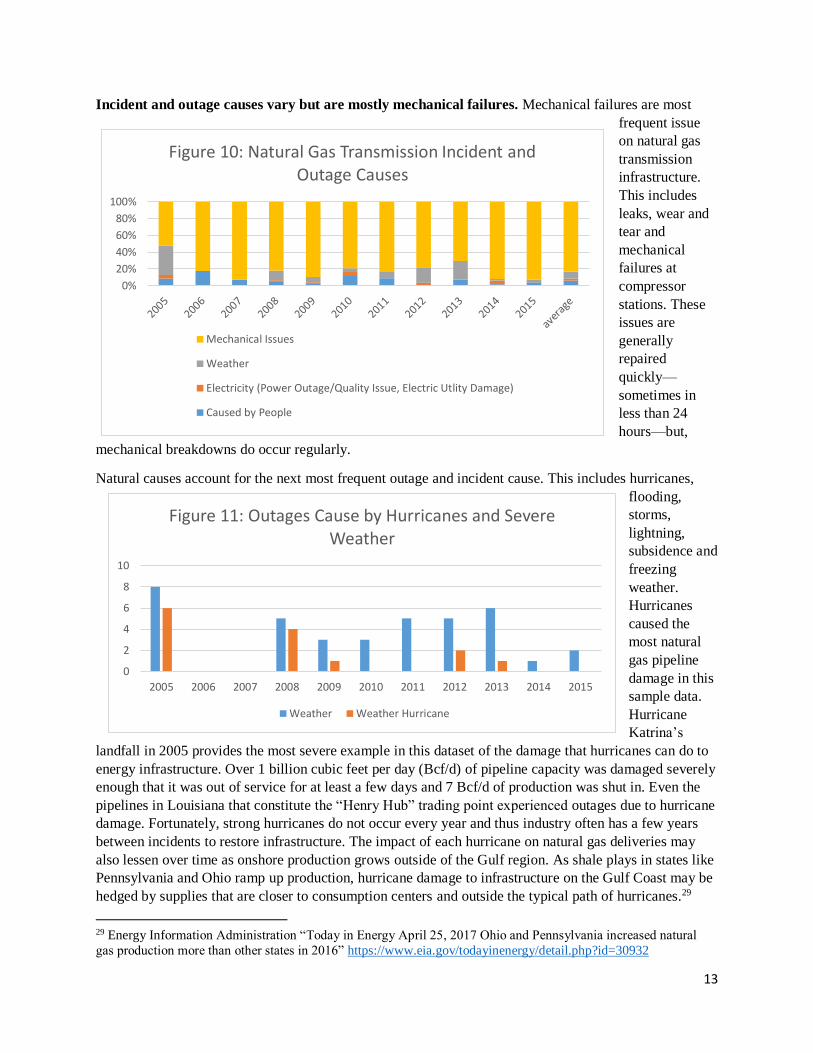
Incident and outage causes vary but are mostly mechanical failures. Mechanical failures are most
frequent issue
on natural gas
transmission
infrastructure.
This includes
leaks, wear and
tear and
mechanical
failures at
compressor
stations. These
issues are
generally
repaired
quickly—
sometimes in
less than 24
hours—but,
mechanical breakdowns do occur regularly.
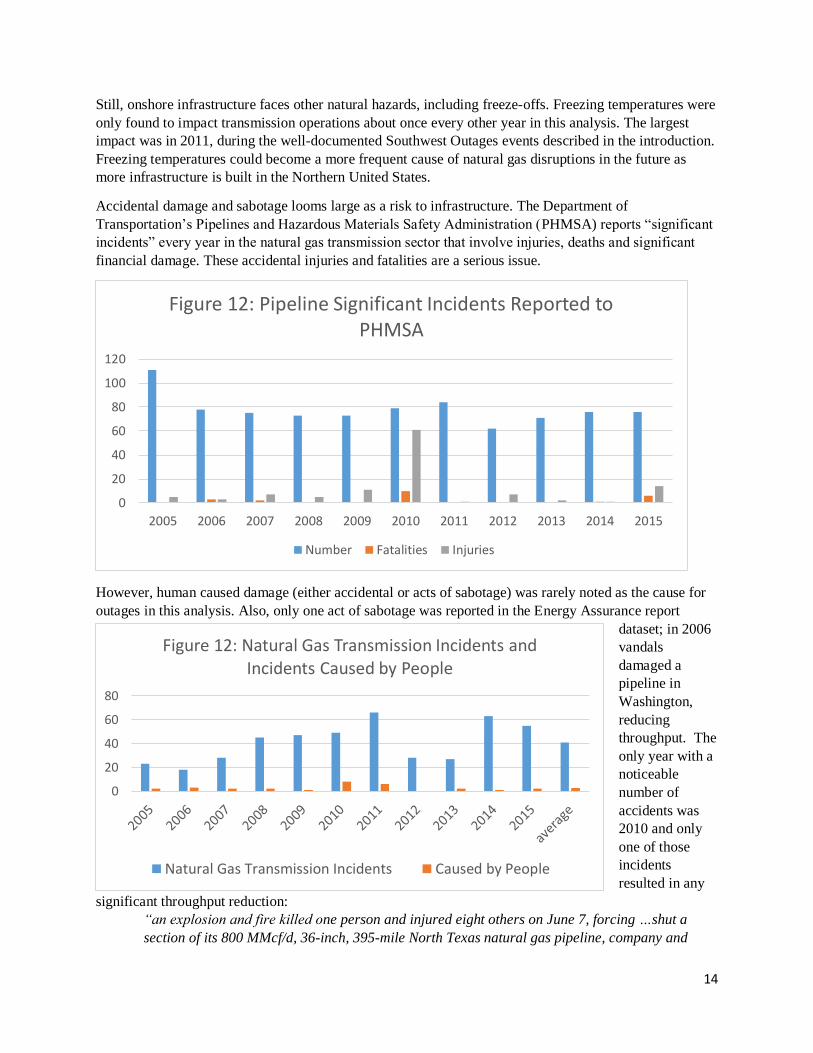
Natural causes account for the next most frequent outage and incident cause. This includes hurricanes,
flooding,
storms,
lightning,
subsidence and
freezing
weather.
Hurricanes
caused the
most natural
gas pipeline
damage in this
sample data.
Hurricane
Katrina’s
landfall in 2005 provides the most severe example in this dataset of the damage that hurricanes can do to
energy infrastructure. Over 1 billion cubic feet per day (Bcf/d) of pipeline capacity was damaged severely
enough that it was out of service for at least a few days and 7 Bcf/d of production was shut in. Even the
pipelines in Louisiana that constitute the “Henry Hub” trading point experienced outages due to hurricane
damage. Fortunately, strong hurricanes do not occur every year and thus industry often has a few years
between incidents to restore infrastructure. The impact of each hurricane on natural gas deliveries may
also lessen over time as onshore production grows outside of the Gulf region. As shale plays in states like
Pennsylvania and Ohio ramp up production, hurricane damage to infrastructure on the Gulf Coast may be
hedged by supplies that are closer to consumption centers and outside the typical path of hurricanes.29
29 Energy Information Administration “Today in Energy April 25, 2017 Ohio and Pennsylvania increased natural
gas production more than other states in 2016” https://www.eia.gov/todayinenergy/detail.php?id=30932
0
2
4
6
8
10
2005 2006 2007 2008 2009 2010 2011 2012 2013 2014 2015
Figure 11: Outages Cause by Hurricanes and Severe Weather
Weather Weather Hurricane
0%
20%
40%
60%
80%
100%
Figure 10: Natural Gas Transmission Incident and Outage Causes
Mechanical Issues
Weather
Electricity (Power Outage/Quality Issue, Electric Utlity Damage)
Caused by People
14
Still, onshore infrastructure faces other natural hazards, including freeze-offs. Freezing temperatures were
only found to impact transmission operations about once every other year in this analysis. The largest
impact was in 2011, during the well-documented Southwest Outages events described in the introduction.
Freezing temperatures could become a more frequent cause of natural gas disruptions in the future as
more infrastructure is built in the Northern United States.
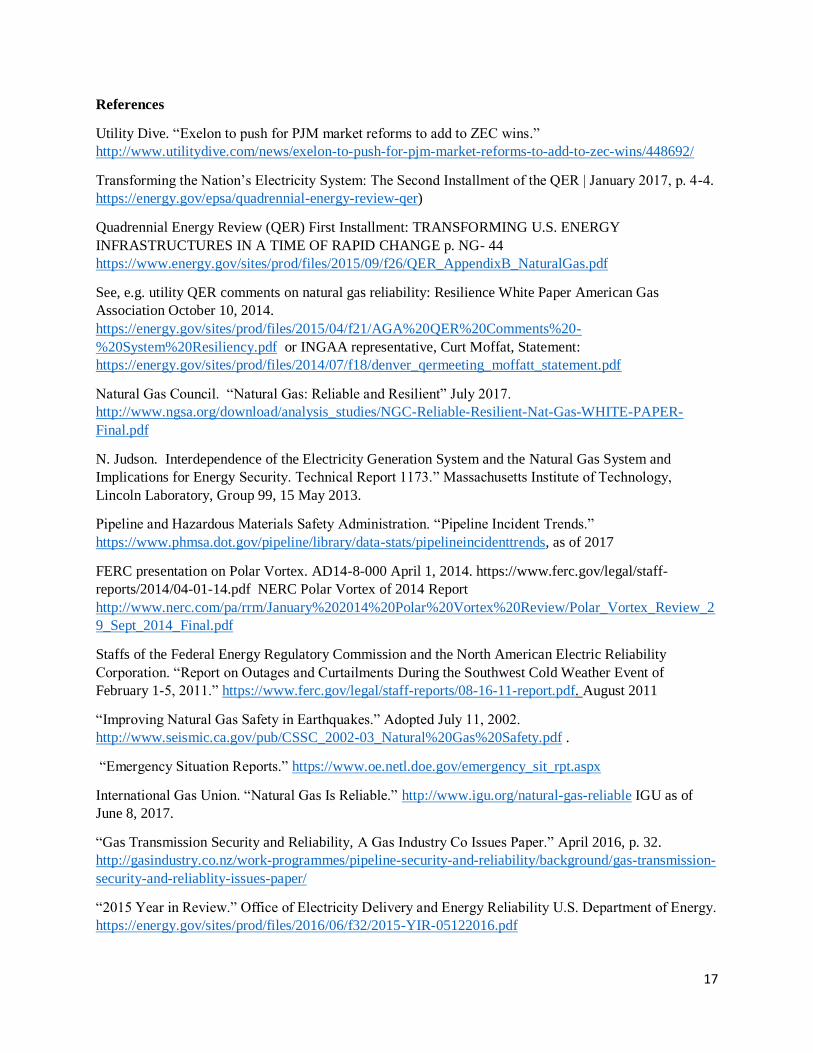
Accidental damage and sabotage looms large as a risk to infrastructure. The Department of
Transportation’s Pipelines and Hazardous Materials Safety Administration (PHMSA) reports “significant
incidents” every year in the natural gas transmission sector that involve injuries, deaths and significant
financial damage. These accidental injuries and fatalities are a serious issue.
However, human caused damage (either accidental or acts of sabotage) was rarely noted as the cause for
outages in this analysis. Also, only one act of sabotage was reported in the Energy Assurance report
dataset; in 2006
vandals
damaged a
pipeline in
Washington,
reducing
throughput. The
only year with a
noticeable
number of
accidents was
2010 and only
one of those
incidents
resulted in any
significant throughput reduction:
“an explosion and fire killed one person and injured eight others on June 7, forcing …shut a
section of its 800 MMcf/d, 36-inch, 395-mile North Texas natural gas pipeline, company and
0
20
40
60
80
100
120
2005 2006 2007 2008 2009 2010 2011 2012 2013 2014 2015
Figure 12: Pipeline Significant Incidents Reported to PHMSA
Number Fatalities Injuries
0
20
40
60
80
Figure 12: Natural Gas Transmission Incidents and Incidents Caused by People
Natural Gas Transmission Incidents Caused by People

15
news sources reported. Workers from a power company struck the pipeline as they drilled holes
to install poles, according to a local sheriff….[and the] shutdown had forced offline about 250
MMcf/d of capacity.
Proposed Future research
Additional research on downstream impacts of transmission outages, upstream and downstream outage
trends and changing risk profiles for energy infrastructure would contribute to better assessing natural gas
reliability in the future. This paper provides only a first step in quantifying natural gas reliability and
proposing some metrics for measuring it.
First, additional analysis of the Department of Energy’s Energy Assurance dataset used for this
transmission analysis focused on the upstream and downstream sectors would improve our understanding
of natural gas reliability overall. The production sector is comprised of a variety of actors from producers
to processing plants, all of which face different risks and operate systems with varying levels of
redundancy. Particularly on the Gulf coast, hurricanes can cause significant production outages that are
geographically concentrated. The resiliency of production and supply to disasters needs further study in
addition to transmission damage and a first step would be conducting a similar analysis for the production
sector as the transmission sector analysis in this paper using the same data set. Examining the resiliency
of offshore Gulf of Mexico production to hurricanes and its changing role as onshore shale resources
grow may also be useful research in the natural gas reliability space.
Similarly, the downstream sector merits additional analysis. LDCs operate distribution systems that
occasionally rival major pipelines and storage caverns. As seen with SoCal Gas’ Aliso Canyon storage,
the LDC systems in this country can also be single points of failure for the electric sector. A separate
analysis of the large LDC systems across the country would supplement this transmission sector
assessment and reveal whether outage and incidents play out similarly on LDC operated systems as they
do on large interstate pipeline systems. Outages on these LDC systems in larger states that are not
federally regulated to the same extent still have the potential to impact large numbers of people. Consider
that large states with LDCs operating intrastate infrastructure networks on interstate scales include
California and Texas, which together comprise 30% of the U.S. population.
Tracking natural gas system disruptions may also inform efforts to determine the impacts of climate
change on infrastructure. Collecting and analyzing more outage data may also improve cybersecurity
impact assessments and gas/electric interdependency planning by allowing regulators and industry to
consider how the system responds to the loss of individual pieces of infrastructure.
Conclusion
Based on ISER’s Energy Assurance reports dataset presented in this paper, the natural gas industry is both
reliable and resilient. Natural gas outages happen infrequently relative to the amount of infrastructure
being operated at any given time. Outages also occur less frequently than instances of damage, equipment
failure and accidents, indicating that the infrastructure is resilient. Finally, major outages and force
majeure declarations indicating outages that impact firm shippers are quite rare. Natural gas transmission
infrastructure operators are usually able to repair damage or reroute throughput to mitigate any impacts of
damage, indicating resilient as well as reliable natural gas transmission.
There are important implications to these preliminary indications of a reliable and resilient natural gas
transmission system. As the electricity industry considers generation resource planning, fuel reliability
has arisen as a key issue and “fuel diversity” is deployed to hedge physical risks such as fuel delivery.
Coal plants with on-site storage seem particularly attractive to system planners who are wary of natural
gas pipeline reliability. However, a reliable and resilient natural gas transmission system with infrequent

16
disruptions may not require the same level of backup if it can be proven to consistently deliver fuel to
power generators. Certainly, the natural gas LDCs limited backup options to natural gas deliveries. Future
research into the level of reliability on the gas system and the level that is needed for customers such as
power generators could empower some utilities to more confidently build out grids with variable
renewables and just-in-time natural gas.
Additional data and analysis are needed to specify just how reliable and resilient the natural gas industry
is. In particular, identifying downstream impacts of transmission outages would improve the usefulness of
the current data. However, this first step indicates a reliable resilient infrastructure industry that is capable
of consistently delivering vital energy supplies to meet growing demand. This reliability assessment
indicates that the major outages of natural gas infrastructure are not occurring on a regular basis. The
relative infrequency of disruptions runs counter to the narrative of fuel diversity proponents who call for
coal and nuclear generation as necessary, day-to-day hedges to back up gas when pipelines outages occur.
Proposals to pay subsidies to coal and nuclear power plants have been at least partially based on their
status as “baseload” plants with onsite fuel. This onsite fuel is mainly attractive in that it is not subject to
disruptions in the same way that natural gas deliveries are. However, the relative value of onsite fuel as a
hedge to natural gas disruptions is reduced if natural gas disruptions are low probability events. It is
critical to determine just how useful these backup strategies will be as many are large financial
investments with significant environmental implications.
This paper reveals that natural gas transmission outages may not be as frequent as some heave feared. The
gas industry is incentivized to deliver its product reliably and in general this occurs. When damage
occurs, the industry shows resiliency in quickly repairing infrastructure to restore deliveries and rerouting
supplies around outages. While additional analysis is needed to improve the understanding of natural gas
delivery reliability, the initial analysis reveals a highly reliable and resilient industry. This reliable track
record runs counter to the accepted wisdom coal and nuclear must be subsidized to be kept online for
when natural gas pipelines fail. Perhaps, one day, system planners can be confident that when the wind
doesn’t blow and the sun doesn’t shine, natural gas will be there just in time.
17
References
Utility Dive. “Exelon to push for PJM market reforms to add to ZEC wins.”
http://www.utilitydive.com/news/exelon-to-push-for-pjm-market-reforms-to-add-to-zec-wins/448692/
Transforming the Nation’s Electricity System: The Second Installment of the QER | January 2017, p. 4-4.
https://energy.gov/epsa/quadrennial-energy-review-qer)
Quadrennial Energy Review (QER) First Installment: TRANSFORMING U.S. ENERGY
INFRASTRUCTURES IN A TIME OF RAPID CHANGE p. NG- 44
https://www.energy.gov/sites/prod/files/2015/09/f26/QER_AppendixB_NaturalGas.pdf
See, e.g. utility QER comments on natural gas reliability: Resilience White Paper American Gas
Association October 10, 2014.
https://energy.gov/sites/prod/files/2015/04/f21/AGA%20QER%20Comments%20-
%20System%20Resiliency.pdf or INGAA representative, Curt Moffat, Statement:
https://energy.gov/sites/prod/files/2014/07/f18/denver_qermeeting_moffatt_statement.pdf
Natural Gas Council. “Natural Gas: Reliable and Resilient” July 2017.
http://www.ngsa.org/download/analysis_studies/NGC-Reliable-Resilient-Nat-Gas-WHITE-PAPER-
Final.pdf
N. Judson. Interdependence of the Electricity Generation System and the Natural Gas System and
Implications for Energy Security. Technical Report 1173.” Massachusetts Institute of Technology,
Lincoln Laboratory, Group 99, 15 May 2013.
Pipeline and Hazardous Materials Safety Administration. “Pipeline Incident Trends.”
https://www.phmsa.dot.gov/pipeline/library/data-stats/pipelineincidenttrends, as of 2017
FERC presentation on Polar Vortex. AD14-8-000 April 1, 2014. https://www.ferc.gov/legal/staff-
reports/2014/04-01-14.pdf NERC Polar Vortex of 2014 Report
http://www.nerc.com/pa/rrm/January%202014%20Polar%20Vortex%20Review/Polar_Vortex_Review_2
9_Sept_2014_Final.pdf
Staffs of the Federal Energy Regulatory Commission and the North American Electric Reliability
Corporation. “Report on Outages and Curtailments During the Southwest Cold Weather Event of
February 1-5, 2011.” https://www.ferc.gov/legal/staff-reports/08-16-11-report.pdf. August 2011
“Improving Natural Gas Safety in Earthquakes.” Adopted July 11, 2002.
http://www.seismic.ca.gov/pub/CSSC_2002-03_Natural%20Gas%20Safety.pdf .
“Emergency Situation Reports.” https://www.oe.netl.doe.gov/emergency_sit_rpt.aspx
International Gas Union. “Natural Gas Is Reliable.” http://www.igu.org/natural-gas-reliable IGU as of
June 8, 2017.
“Gas Transmission Security and Reliability, A Gas Industry Co Issues Paper.” April 2016, p. 32.
http://gasindustry.co.nz/work-programmes/pipeline-security-and-reliability/background/gas-transmission-
security-and-reliablity-issues-paper/
“2015 Year in Review.” Office of Electricity Delivery and Energy Reliability U.S. Department of Energy.
https://energy.gov/sites/prod/files/2016/06/f32/2015-YIR-05122016.pdf

18
“About Natural Gas Pipelines.” Energy Information Administration (EIA).
https://www.eia.gov/pub/oil_gas/natural_gas/analysis_publications/ngpipeline/mileage.html
Energy Information Administration “Today in Energy April 25, 2017 Ohio and Pennsylvania increased
natural gas production more than other states in 2016.”
https://www.eia.gov/todayinenergy/detail.php?id=30932