how sensitive is melissa officinalis to realistic ozone concentrations?
TRANSCRIPT
lable at ScienceDirect
Plant Physiology and Biochemistry 74 (2014) 156e164
Contents lists avai
Plant Physiology and Biochemistry
journal homepage: www.elsevier .com/locate/plaphy
Research article
How sensitive is Melissa officinalis to realistic ozone concentrations?
Anne Sarah Döring b,1, Elisa Pellegrini a,1, Alessandra Campanella a, Alice Trivellini a,Clizia Gennai a, Maike Petersen b, Cristina Nali a,*, Giacomo Lorenzini a
aDepartment of Agriculture, Food and Environment, University of Pisa, Via del Borghetto 80, 56124 Pisa, Italyb Institut für Pharmazeutische Biologie und Biotechnologie, Philipps-Universität Marburg, Deutschhausstr. 17A, D-35037 Marburg, Germany
a r t i c l e i n f o
Article history:Received 29 March 2013Accepted 4 November 2013Available online 15 November 2013
Keywords:Oxidative stressPhotosynthesisRubiscoLeaf symptomsMembrane integrityLemon balmPSII photochemistry
Abbreviations: 1-qP, reduction state of QA; ABA, alevel of photosynthetic activity; ANOVA, one-wayphotosynthetic activity at saturating light level; BSA,Clean Air for Europe; Chl a/b, chlorophyll a/chloropha þ chlorophyll b; Ci, intercellular CO2 concentration;DBPA, decoring-binding protein A; DEPS, de-epoxidrate; EC, electron conductivity of leaf disc leachates;nosorbent assay; FBE, from the beginning of exposurF 0m , maximal fluorescence in the light-adapted state;minimal fluorescence in the light-adapted state; Fs, stin the light-adapted state; Fv/Fm, variable and maxstomatal conductance to water vapor; ITE, instantanJmax, light-saturated rate of electron transport; LHCproteins; MDA, malondialdehyde; PAR, photosynthephoton flux density; PPFD, photosynthetic photon fluPSII, photosystem II; Fa, apparent quantum yield; FCactual quantum yield of PSII; qNP, non-photochemchemical quenching; Rd, daytime respiration; RH, rela1,5-bisphosphate; Rubisco, ribulose-1,5-bisphosphRWC, relative water content; TBA, thiobarbituric acireactive substances; TPU, triose phosphate utilizatiocarboxylation; VPD, air vapor pressure deficit.* Corresponding author. Tel.: þ39 050 2210552; fax
E-mail address: [email protected] (C. Nali).1 Both authors contributed equally to this work.
0981-9428/$ e see front matter � 2013 Elsevier Mashttp://dx.doi.org/10.1016/j.plaphy.2013.11.006
a b s t r a c t
Lemon balm (Melissa officinalis, L.; Lamiaceae) was exposed to realistic ozone (O3) dosages (80 ppb for5 h), because high background levels of O3 are considered to be as harmful as episodic O3 regimes.Temporal alterations of different ecophysiological, biochemical and structural parameters were investi-gated in order to test if this species can be considered as an O3-bioindicator regarding changes inbackground concentrations. At the end of ozone exposure, the plants did not exhibit any visible foliarsymptoms, as only at microscopic level a small number of dead cells were found. Photosynthetic pro-cesses, however, were significantly affected. During and after the treatment, ozone induced a reductionin CO2 fixation capacity (up to 52% after 12 h from the beginning of the treatment) due to mesophylliclimitations. Intercellular CO2 concentration significantly increased in comparison to controls (þ90% atthe end of the post-fumigation period). Furthermore impairment of carboxylation efficiency (�71% at theend of the post-fumigation period compared to controls in filtered air) and membrane damage in termsof integrity (as demonstrated by a significant rise in solute leakage) were observed. A regulatoryadjustment of photosynthetic processes was highlighted during the post-fumigation period by the highervalues of qNP and (1-qP) and therefore suggests a tendency to reduce the light energy used in photo-chemistry at the expense of the capacity to dissipate the excess as excitation energy. In addition, thechlorophyll a/b ratio and the de-epoxidation index increased, showing a rearrangement of the pigmentcomposition of the photosynthetic apparatus and a marked activation of photoprotective mechanisms.
� 2013 Elsevier Masson SAS. All rights reserved.
bscisic acid; Amax, maximumanalysis of variance; Asat,
bovine serum albumin; CAFE,yll b; Chl a þ b, chlorophyllDAB, 3,30-diaminobenzidine;ation index; E, transpirationELISA, enzyme linked immu-e; Fm, maximal fluorescence;F0, minimal fluorescence; F 00,eady-state fluorescence yieldimal fluorescence ratio; Gw,eous transpiration efficiency;Ps, light-harvesting complextically active radiation; PFD,x density; PSI, photosystem I;
O2, quantum efficiency; FPSII,
ical quenching; qP, photo-tive humidity; RuBP, ribuloseate carboxylase/oxygenase;d; TBARS, thiobarbituric acidn; Vcmax, maximum rate of
: þ39 050 2210559.
son SAS. All rights reserved.
1. Introduction
Although the magnitude of ozone (O3) peaks decreasedsignificantly in the mid-latitudes of the Northern Hemisphereduring the last decades (Wagg et al., 2013), the background O3 willincrease more than 55% above the current ambient levels ofapproximately 40 ppb in the 21st century, despite various at-tempts [for example the current “EU Ambient Air Quality Direc-tive” and the “Clean Air for Europe” (CAFE) program (Directive2008/50/EC)] to regulate the anthropogenic emission of precursorsof this secondary contaminant (in particular nitrogen oxides andvolatile hydrocarbons). O3 causes adverse effects on crops andnative vegetation in terms of (i) growth and quality reduction, (ii)alterations in resource allocation and reproductive output, (iii)visible injury and (iv) even shifts in crop phenology (Ainsworthet al., 2012). The way plants respond to oxidative stress dependson the O3 dose (regarding concentration and duration of theexposure) and its sustained effects are related to the O3 uptakeand effectiveness of the defense mechanisms (Heath, 2008). Inrural areas, plants are subjected to a multitude of environmentalfluctuations (in relation to temperature, solar radiation etc.)

A.S. Döring et al. / Plant Physiology and Biochemistry 74 (2014) 156e164 157
between different days. By deviating from the optimum the inci-dence of climatic aberrations, for example heat waves and globalwarming, conductive by O3 formation, increase. Only few studiesinvestigated the effects of O3 at mean levels of 40e80 ppb withoutincluding some peak exposures (Coyle et al., 2003) due to the factthat, in these experimental conditions, the impact of oxidativestress may not become apparent in the short-term, but mayinstead develop over time. In fact, it has been demonstrated thatincreased background concentrations can be as harmful to plantsas an episodic O3 regime with similar total exposure (Dawnay andMills, 2009). Some parameters like stomatal conductance (Gw),photosynthetically active radiation (PAR) and air vapor pressuredeficit (VPD), are strongly influenced by this pollutant (also atlower concentrations) that can induce dynamic effects on theplant, in particular, on the rate of relevant physiological processes.There is evidence that O3 alters photosynthetic activity throughvarious mechanisms like impairment of carboxylation efficiency,alteration of light reactions and reduction of the electron transportrate between photosystems. For this reason, some of these invis-ible responses (such as respiration, transpiration, etc.) have beensuccessfully used as bioindicators (Nali et al., 2009) and also as amarker of metabolic response to oxidative stress. Whereasextensive literature on the effects of O3 on crops and deciduousplants already exists, the information for spices and herbs is stillscarce: only a small number of species have been studied, but alsoour knowledge on the mechanisms underlying their capacity totolerate oxidative stress is still limited. Additionally these in-vestigations studied the effects of peak episodes rather than theeffects of maintained background concentrations during O3fumigation.
Lemon balm (M. officinalis L.) is a widely used plant belonging tothe family Lamiaceae. For more than 2000 years it has been used forthe treatment of sleeping and digestive disorders, mainly due to thecontent of essential oil (citral, citronellal) and phenolic compounds,with rosmarinic acid as main constituent (Petersen and Simmonds,2003). In a previous investigation, conducted in controlled envi-ronment facilities, the effects of peak episodes (200 ppb, 5 h) on thephotosynthetic functions have been investigated in M. officinalisplants (Pellegrini et al., 2011), in order to gain useful and reliablemarkers to assess damage by O3. The goal of the present study wasto obtain integrated measurements related to the physiology andbiochemistry of photosynthetic performance, in order to determinethe impact of changes in O3 background concentrations, in theabsence of episodic peaks, on lemon balm. For this reason,ecophysiological, biochemical and structural parameters weremeasured during exposure and in the following post-fumigationperiod.
According to the European Environment Agency (2013), morethan 150 exceedance days of the long-term objective (LTO) werereported by Spain, Italy and Greece in the summer of 2012. Themaximumhourlymean of O3 was 170 ppb (Greece). So, as the LTO isan 8-h average of 60 ppb, i.e. AOT40 of 160 ppb h, an exposure ofplants to 80 ppb for 5 h, i.e. 200 ppb h, should be relativelyconvenient to be regarded as realistic of ambient air O3 at leastduring the summers in Mediterranean countries. The AOT40 index(accumulated concentrations over a threshold over 40 ppb) iscurrently used for risk assessment in Europe. In both Europe and inNorth America, it should be noted that peak O3 concentrationsdeclined by about 30% over the past decade, but there is also evi-dence of an increase in the annual mean concentration of about0.1 ppb yr�1 (Coyle et al., 2003). The reduction in peak concentra-tions is due to the implementation of air pollution policies acrossEurope reducing precursor emissions, while increasing backgroundconcentrations result from an increase in anthropogenic emissionson a global scale (Dawnay and Mills, 2009). As the majority of
investigations have been on effects of peak O3 episodes, theresponse of plants to elevated background concentrations requiresfurther study.
2. Results
At the end of treatment, lemon balm plants appeared symp-tomless. Small chlorotic spots were recognizable only 24 h FBE andespecially on the adaxial leaf surface. These spots coalesced to formnecrotic stipples that were visible on both leaf surfaces at 48 h FBE(Fig. 1). However, injuries were already detectable during thefumigation at the microscopic level. At 3 h and 12 h FBE, a smallnumber of dead cells were found (Fig. 2), confirming the lack ofsymptoms during the experimental period. H2O2 deposits weremuch more extensive following the treatment and were morefrequent around stomata. Prior to the presence of visible injury,there was an increase in membrane damage in terms of integrity, asdemonstrated by the significant rise in solute leakage as measuredby the TBARS method observed during the treatment (þ93%and þ62% in comparison to plant material treated with filtered air,at 3 and 5 h FBE respectively, Fig. 3) These O3-induced effectsremained during the post-fumigation period with TBARS levelsincreased by 58% and 44% in treated plants (at 12 and 24 h FBE,respectively) compared to controls. No significant changes wereobserved throughout the entire period of the experiment regardingabscisic acid (ABA) levels, osmotic and leaf water potential (data notshown).
Parameters regarding photosynthetic performance at lightsaturation level are shown in Fig. 4. At the end of the O3 fumigation,Asat significantly decreased (�28% compared to the control leaves)and this reduction was maintained during the entire post-fumigation period with values in the range between �49%and �55% (Fig. 4A). At the end of fumigation, a strong decrease inGw was observed (�30% in comparison to the control) that reacheda minimum at 12 and 24 h FBE (�46% and �58% respectively,Fig. 4B). The pollutant uptake rates amounted to 1.4 � 0.06 at 3 hFBE and 1.1 � 0.05 mmol m�2 s�1 at the end of fumigation (sta-tistically significant for P < 0.01, Student’s t-test). A strong increasein intercellular CO2 concentration (Ci) at light saturation level wasalso measured during the entire period of the experiment with amaximum at 24 h FBE (þ90% compared to plant material subjectedto filtered air, Fig. 4C). Only at 3 h FBE, there were no statisticallysignificant differences in instantaneous transpiration efficiency(ITE) between treated and control material, while this parameterdecreased showing lower values at 12 and 24 h FBE (�58%and �62% in comparison to controls, Fig. 4D).
The gas exchange parameters estimated from irradiance andfrom CO2 response curves of CO2 assimilation rate (A/Ci curve) areshown in Table 1. Referring to parameters derived from irradianceresponse curves of CO2 assimilation rates, Amax significantlydecreased (�27% compared to controls) starting 3 h FBE and thisreduction was maintained during the entire observation period,with a minimum at the end of the treatment (�74% in comparisonto plants treated with filtered air). In O3-treated plants, Fa wassignificantly lower than in controls at every measuring time point(about half the value of control material). Parameters derived fromA/Ci curves showed that both Vcmax and Jmax decreased during theentire period of the experiment, reaching a minimum at 24 h FBE(�71% compared to control). Starting 3 h FBE, FCO2
and TPUdecreased significantly (�40% and �24% compared with control,respectively) and this reduction even increased after the treatment.Rd was consistently affected by O3 during the entire period of theexperiment.
Parameters related to chlorophyll a fluorescence are depicted inFig. 5. In fumigated leaves, the ratio Fv/Fm was depressed by

Fig. 1. Symptoms on both surfaces of Melissa officinalis leaves exposed to ozone (80 ppb, 5 h), after 24 h from the beginning of exposure.
Fig. 2. Localization of hydrogen peroxide (H2O2) visualized with the 3,30-diaminobenzidine (DAB) uptake method (A) and of dead cells with Evans blue staining (B) in Melissaofficinalis leaves exposed to ozone (80 ppb, 5 h). Bars ¼ 50 mm.
A.S. Döring et al. / Plant Physiology and Biochemistry 74 (2014) 156e164158
oxidative stress, but only at 12 h FBE this parameter went below0.800. This indicates that O3 slightly impaired the efficiency of PSIIand, in particular, this damage was reversible, since at the end ofpost-fumigation period the values of Fv/Fm are similar to
Fig. 3. Time course of thiobarbituric acid reactive substances (TBARS) in Melissa offi-cinalis leaves exposed to ozone (80 ppb, 5 h). Data are shown as mean � standarddeviation. The measurements were carried out on plants maintained in charcoal-filtered air (0 h) and 3, 5, 12 and 24 h from the beginning of exposure to ozone.Different letters indicate significant differences (P � 0.05).
constitutive levels (Fig. 5A). Referring to quenching analysis, at theend of the treatment (1-qP) increased (þ6% in comparison tocontrols) and a similar trend was observed during the post-fumigation period (þ13% and þ12% at 12 and 24 h FBE, respec-tively, Fig. 5B). A concomitant increase was reported for the qNPcoefficient after the treatment (þ18%) and at 12 and 24 h FBE (þ24%and þ13%, compared to plant material subjected to filtered air,Fig. 5C). FPSII values were significantly reduced in treated plantsalready 5 h FBE (�3%, in comparison to controls) and decreasedabout 7% at 12 h FBE (Fig. 5D).
Table 2 shows the results of leaf pigment analysis. Following thetreatment, a generalized effect of O3 on chlorophyll was observed.A marked increase of the total content (þ51%, þ44% and þ58%,respectively at 5, 12 and 24 h FBE) and the chl a/b ratio (þ20% at 12and 24 h FBE) is observed in comparison to controls. b-Caroteneand DEPS followed the same trend: the levels showed a significantincrease during the post-fumigation period with a maximum at12 h FBE (twice as much as controls).
3. Discussion
Many investigations studied the effects of peak episodes ratherthan the effects of maintained background concentrations duringO3 fumigation, although it has been demonstrated that increasedbackground levels of this pollutant can be as harmful to plants as anepisodic O3 regime with similar total exposure (Dawnay and Mills,2009). In this study, lemon balm proved to be an O3-bioindicatormodel candidate for changes in background concentrations of

Fig. 4. Time course of gas exchange parameters in Melissa officinalis leaves exposed to ozone (80 ppb, 5 h). Data are shown as mean � standard deviation. The measurements werecarried out on plants maintained in charcoal-filtered air (0 h) and 3, 5, 12 and 24 h from the beginning of exposure to ozone. Different letters indicate significant differences(P � 0.05). Abbreviations: Asat, photosynthetic activity at saturating light level; Gw, stomatal conductance to water vapor; Ci, intercellular CO2 concentration; ITE, instantaneoustranspiration efficiency.
A.S. Döring et al. / Plant Physiology and Biochemistry 74 (2014) 156e164 159
ozone, responding to realistic O3 levels, i.e. 80 ppb for 5 h and moreintensely after a longer incubation time of 24 h FBE. At the end ofthe treatment (5 h),M. officinalis plants appeared asymptomatic. Atthe end of the post-fumigation period, small chlorotic spots wererecognizable on the adaxial leaf surface, enlarged and oftencoalesced to form necrotic stipples that were visible on both leafsurfaces. In a previous investigation using 200 ppb of O3 for 5 h(Pellegrini et al., 2011), similar behavior was observed in lemonbalm showing similar anatomical responses to oxidative stress butdiffering in intensity. Microscopic damages were detectable at alltime-points and, in relation to their extension, it was possible to
Table 1Time course of gas exchange parameters estimated from irradiance (Amax, maximumphoto[FCO2
, quantum efficiency, Vcmax, maximum rate of carboxylation (mmol CO2 m�2 s�1); Jmrespiration (mmol CO2 m�2 s�1); TPU, triose phosphate utilization (mmol CO2 m�2 s�1)] re(80 ppb, 5 h). Data are shown as mean � standard deviation. The measurements were carthe beginning of exposure to ozone. In each row different letters indicate significant diff
Hours of treatment
0 3
Amax 12.5 � 1.04 d 9.2 � 0.93 cVcmax 46.1 � 8.53 d 39.6 � 2.06 cJmax 20.2 � 3.74 d 17.3 � 0.90 cRd �4.6 � 0.60 a �6.0 � 0.29 bFa 0.07 � 0.002 c 0.05 � 0.001 bFCO2
0.03�0.005 c 0.02 � 0.001 bTPU 4.7 � 0.33 c 3.6 � 0.01 b
predict the symptoms that would have developed in the followinghours and the degree of sensitivity of lemon balm to oxidativestress: the small number of dead cells detected by Evans bluestaining in the leaf tissues during the O3 treatment can beconsidered the precursor of larger necrotic areas. Also, the groupsof cells with localized H2O2 deposits observed at all time-pointswere destined to death, with the consequent appearance ofvisible injuries later on. The relevance and the efficiency of thesetechniques to detect early O3 damage in the tissues have beenreported earlier (Faoro and Iriti, 2005). Oxidative stress is known tomodify the membrane structure and to induce lipid peroxidation.
synthetic activity at saturating light level;Fa, apparent quantumyield) and from CO2
ax, light-saturated rate of electron transport (mmol electrons m�2 s�1); Rd, daytimesponse curves of CO2 assimilation rate in Melissa officinalis leaves exposed to ozoneried out on plants maintained in charcoal-filtered air (0 h) and 3, 5, 12 and 24 h fromerences (P � 0.05).
5 12 24
3.3 � 0.10 a 4.6 � 0.44 b 4.9 � 0.06 b23.5 � 0.99 b 22.3 � 0.29 b 13.3 � 2.87 a10.3 � 0.43 b 9.8 � 0.13 b 5.8 � 1.26 a�6.4 � 0.14 b �6.2 � 0.01 b �7.4 � 0.04 c0.03 � 0.001 a 0.03 � 0.004 a 0.03 � 0.004 a0.01 � 0.001 a 0.01 � 0.001 a 0.01 � 0.001 a1.3 � 0.16 a 1.6 � 0.14 a 1.8 � 0.03 a

Fig. 5. Time course of chlorophyll a fluorescence parameters in Melissa officinalis leaves exposed to ozone (80 ppb, 5 h). Data are shown as mean � standard deviation. Themeasurements were carried out on plants maintained in charcoal-filtered air (0 h) and 3, 5, 12 and 24 h from the beginning of exposure to ozone. Different letters indicate significantdifferences (P � 0.05). Abbreviations: Fv/Fm, variable and maximal fluorescence ratio; 1-qP, reduction state of QA; qNP, non-photochemical quenching; FPSII, actual quantum yield ofPSII.
A.S. Döring et al. / Plant Physiology and Biochemistry 74 (2014) 156e164160
At biological pH many oxidative species of O3 breakdown areformed (including superoxide and its protonated species) whichcan react with the plasmalemma attacking the fatty acid residues ofthe membrane phospholipids and/or enhancing lipoxygenaseactivity. The formation of malondialdehyde (MDA) in biologicalsamples is related to the peroxidation of polyunsaturated fattyacids (Del Rio et al., 2005). The data obtained by the determinationof thiobarbituric acid-reactive substances (TBARS) confirm theoccurrence of lipid peroxidation during and following the O3treatment, as also shown in other studies of M. officinalis leaves(Pellegrini et al., 2011).
The CO2 assimilation rate of lemon balmwas strongly depressedduring the entire period of the experiment and this was associatedwith a strong reduction in stomatal conductance and an increase inintercellular CO2 concentration. O3 uptake detected in the presentexperiment has been compared with that obtained in the previousexperiment with M. officinalis treated with 200 ppb O3 for 5 h(Pellegrini et al., 2011): differences between these rates were sta-tistically significant (1.1 � 0.05 mmol m�2 s�1 (80 ppb, 5 h) vs.0.8 � 0.06 mmol m�2 s�1 (200 ppb, 5 h), Student’s t-test, P < 0.01).These results may indicate that O3 not only induced an alteration inthe mesophyll activity as stated by the increase in internal CO2concentration (Ci), but also stomatal closure thus avoiding pene-tration of a potential toxic compound coming from the gas phaseaccording to Levitt (1980). This conclusion is supported by cyto-logical observations: the O3-dependent impairment of stomatal
function can be related to the increase of O3 partial pressure in thesubstomatal cavity that can damage the thin-walled and sensitivemesophyll cells around the stomatal cavities. Also, O3 treatmentwas not able to affect (i) the permeability of the guard cells and (ii)the osmotically active material, as shown by no significant changesof internal osmotic and leaf water potential of the leaf materialduring and following the exposure. In relation to the sequence ofevents taking place, our results suggest that O3-dependent changesin light reactions might be among the factors eliciting the primaryphotosynthetic process inM. officinalis plants. Similar findings havebeen described in spinach (Calatayud et al., 2003), Pistacia species,Viburnum species (Calatayud et al., 2010) and tulip tree (Pellegriniet al., 2011), that showed that the variation in photoassimilationdid not correlate to stomatal closure, but was attributable to analteration in the activity of the mesophyll. ABAmight be involved incontrolling stomatal responses (Li et al., 2000). In our study thelevels of this hormone did not change significantly during andfollowing the O3 treatment although stomatal conductance towater vapor decreased. The analysis of the entire leaves, however,cannot rule out the possibility of local increase of ABA concentra-tion, for example elevated levels of ABA in the stomatal apparatusmight be the controlling factor for stomatal responses (Jin et al.,2013). On the other hand, the clear decline of the maximumcarboxylation rate of Rubisco (Vcmax), the light-saturated rate ofelectron transport (Jmax), the quantum efficiency of the leaf ðFCO2
Þand the triose phosphate utilization (TPU) observed during and
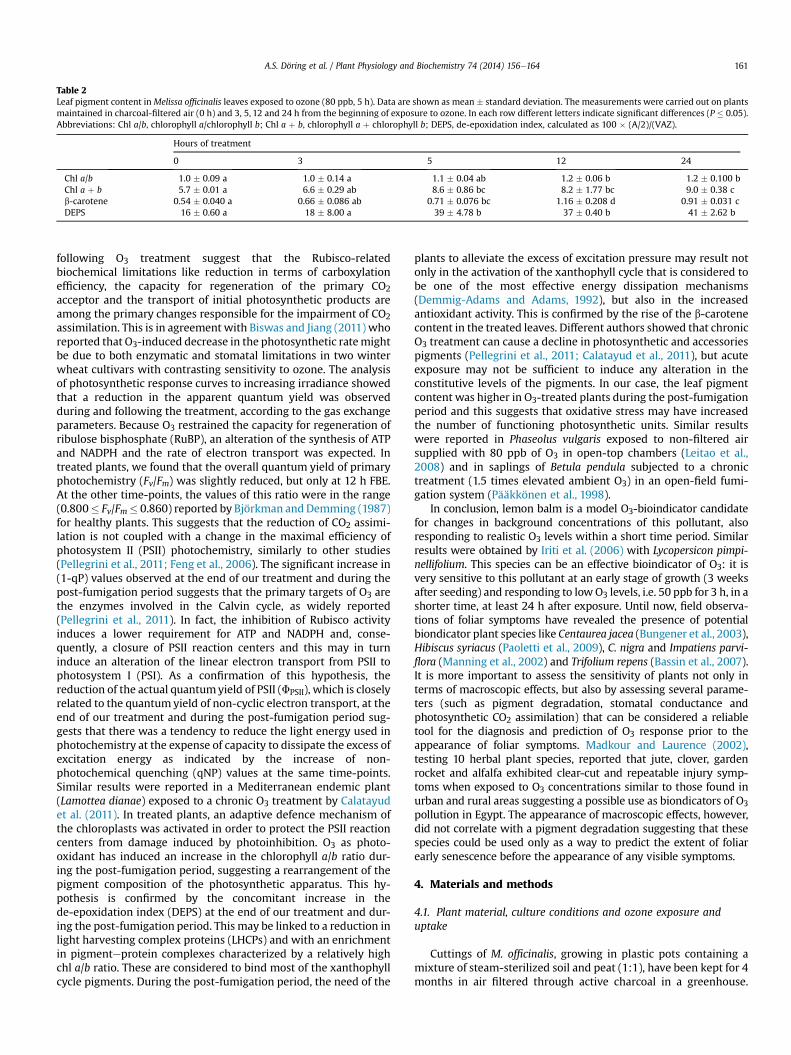
Table 2Leaf pigment content inMelissa officinalis leaves exposed to ozone (80 ppb, 5 h). Data are shown as mean � standard deviation. The measurements were carried out on plantsmaintained in charcoal-filtered air (0 h) and 3, 5, 12 and 24 h from the beginning of exposure to ozone. In each row different letters indicate significant differences (P � 0.05).Abbreviations: Chl a/b, chlorophyll a/chlorophyll b; Chl a þ b, chlorophyll a þ chlorophyll b; DEPS, de-epoxidation index, calculated as 100 � (A/2)/(VAZ).
Hours of treatment
0 3 5 12 24
Chl a/b 1.0 � 0.09 a 1.0 � 0.14 a 1.1 � 0.04 ab 1.2 � 0.06 b 1.2 � 0.100 bChl a þ b 5.7 � 0.01 a 6.6 � 0.29 ab 8.6 � 0.86 bc 8.2 � 1.77 bc 9.0 � 0.38 cb-carotene 0.54 � 0.040 a 0.66 � 0.086 ab 0.71 � 0.076 bc 1.16 � 0.208 d 0.91 � 0.031 cDEPS 16 � 0.60 a 18 � 8.00 a 39 � 4.78 b 37 � 0.40 b 41 � 2.62 b
A.S. Döring et al. / Plant Physiology and Biochemistry 74 (2014) 156e164 161
following O3 treatment suggest that the Rubisco-relatedbiochemical limitations like reduction in terms of carboxylationefficiency, the capacity for regeneration of the primary CO2acceptor and the transport of initial photosynthetic products areamong the primary changes responsible for the impairment of CO2assimilation. This is in agreement with Biswas and Jiang (2011) whoreported that O3-induced decrease in the photosynthetic ratemightbe due to both enzymatic and stomatal limitations in two winterwheat cultivars with contrasting sensitivity to ozone. The analysisof photosynthetic response curves to increasing irradiance showedthat a reduction in the apparent quantum yield was observedduring and following the treatment, according to the gas exchangeparameters. Because O3 restrained the capacity for regeneration ofribulose bisphosphate (RuBP), an alteration of the synthesis of ATPand NADPH and the rate of electron transport was expected. Intreated plants, we found that the overall quantum yield of primaryphotochemistry (Fv/Fm) was slightly reduced, but only at 12 h FBE.At the other time-points, the values of this ratio were in the range(0.800� Fv/Fm� 0.860) reported by Björkman and Demming (1987)for healthy plants. This suggests that the reduction of CO2 assimi-lation is not coupled with a change in the maximal efficiency ofphotosystem II (PSII) photochemistry, similarly to other studies(Pellegrini et al., 2011; Feng et al., 2006). The significant increase in(1-qP) values observed at the end of our treatment and during thepost-fumigation period suggests that the primary targets of O3 arethe enzymes involved in the Calvin cycle, as widely reported(Pellegrini et al., 2011). In fact, the inhibition of Rubisco activityinduces a lower requirement for ATP and NADPH and, conse-quently, a closure of PSII reaction centers and this may in turninduce an alteration of the linear electron transport from PSII tophotosystem I (PSI). As a confirmation of this hypothesis, thereduction of the actual quantumyield of PSII (FPSII), which is closelyrelated to the quantum yield of non-cyclic electron transport, at theend of our treatment and during the post-fumigation period sug-gests that there was a tendency to reduce the light energy used inphotochemistry at the expense of capacity to dissipate the excess ofexcitation energy as indicated by the increase of non-photochemical quenching (qNP) values at the same time-points.Similar results were reported in a Mediterranean endemic plant(Lamottea dianae) exposed to a chronic O3 treatment by Calatayudet al. (2011). In treated plants, an adaptive defence mechanism ofthe chloroplasts was activated in order to protect the PSII reactioncenters from damage induced by photoinhibition. O3 as photo-oxidant has induced an increase in the chlorophyll a/b ratio dur-ing the post-fumigation period, suggesting a rearrangement of thepigment composition of the photosynthetic apparatus. This hy-pothesis is confirmed by the concomitant increase in thede-epoxidation index (DEPS) at the end of our treatment and dur-ing the post-fumigation period. This may be linked to a reduction inlight harvesting complex proteins (LHCPs) and with an enrichmentin pigmenteprotein complexes characterized by a relatively highchl a/b ratio. These are considered to bind most of the xanthophyllcycle pigments. During the post-fumigation period, the need of the
plants to alleviate the excess of excitation pressure may result notonly in the activation of the xanthophyll cycle that is considered tobe one of the most effective energy dissipation mechanisms(Demmig-Adams and Adams, 1992), but also in the increasedantioxidant activity. This is confirmed by the rise of the b-carotenecontent in the treated leaves. Different authors showed that chronicO3 treatment can cause a decline in photosynthetic and accessoriespigments (Pellegrini et al., 2011; Calatayud et al., 2011), but acuteexposure may not be sufficient to induce any alteration in theconstitutive levels of the pigments. In our case, the leaf pigmentcontent was higher in O3-treated plants during the post-fumigationperiod and this suggests that oxidative stress may have increasedthe number of functioning photosynthetic units. Similar resultswere reported in Phaseolus vulgaris exposed to non-filtered airsupplied with 80 ppb of O3 in open-top chambers (Leitao et al.,2008) and in saplings of Betula pendula subjected to a chronictreatment (1.5 times elevated ambient O3) in an open-field fumi-gation system (Pääkkönen et al., 1998).
In conclusion, lemon balm is a model O3-bioindicator candidatefor changes in background concentrations of this pollutant, alsoresponding to realistic O3 levels within a short time period. Similarresults were obtained by Iriti et al. (2006) with Lycopersicon pimpi-nellifolium. This species can be an effective bioindicator of O3: it isvery sensitive to this pollutant at an early stage of growth (3 weeksafter seeding) and responding to lowO3 levels, i.e. 50 ppb for 3 h, in ashorter time, at least 24 h after exposure. Until now, field observa-tions of foliar symptoms have revealed the presence of potentialbiondicator plant species like Centaurea jacea (Bungener et al., 2003),Hibiscus syriacus (Paoletti et al., 2009), C. nigra and Impatiens parvi-flora (Manning et al., 2002) and Trifolium repens (Bassin et al., 2007).It is more important to assess the sensitivity of plants not only interms of macroscopic effects, but also by assessing several parame-ters (such as pigment degradation, stomatal conductance andphotosynthetic CO2 assimilation) that can be considered a reliabletool for the diagnosis and prediction of O3 response prior to theappearance of foliar symptoms. Madkour and Laurence (2002),testing 10 herbal plant species, reported that jute, clover, gardenrocket and alfalfa exhibited clear-cut and repeatable injury symp-toms when exposed to O3 concentrations similar to those found inurban and rural areas suggesting a possible use as biondicators of O3pollution in Egypt. The appearance of macroscopic effects, however,did not correlate with a pigment degradation suggesting that thesespecies could be used only as a way to predict the extent of foliarearly senescence before the appearance of any visible symptoms.
4. Materials and methods
4.1. Plant material, culture conditions and ozone exposure anduptake
Cuttings of M. officinalis, growing in plastic pots containing amixture of steam-sterilized soil and peat (1:1), have been kept for 4months in air filtered through active charcoal in a greenhouse.

A.S. Döring et al. / Plant Physiology and Biochemistry 74 (2014) 156e164162
Afterward, plants were placed for two weeks in a controlled envi-ronment facility at a temperature of 20 � 1 �C, a relative humidity(RH) of 85 � 5% and a photon flux density at plant height of500 mmol photons m�2 s�1 provided by incandescent lamps, duringa 12 h photoperiod. Uniformly sized plants were placed in acontrolled environment fumigation facility under the same climaticconditions as the growth chamber (Francini et al., 2008). In bothcases, plants before the start of the experiment and controls duringthe O3 exposure have been maintained in air filtered through activecharcoal. In these environments, O3 concentration was negligible,below 5 ppb, as measured by an O3 analyzer.
Plants were exposed for 5 h to a target O3 concentration of80 ppb from to the 2nd to the 7th hour of the light period. Analyseswere performed at 0, 3, 5, 12 and 24 h FBE. To prevent powderymildew attack the plants were sprayed with Karathane� STAR, DowAgroSciences (40 ml hl�1 water), a widely used fungicide. Theexperiments took place at the Department of Agriculture, Food andEnvironment, University of Pisa in April 2012. This period of yearwas chosen because the leaves for use as drugs are harvested beforeflowering, which takes place in June.
The potential O3 uptake rate into the leaf was calculated from Gw
(stomatal conductance to water vapor) and the O3 concentration,according to the Fick’s first law (Unsworth, 1982). O3 concentrationinside the leaf was assumed to be zero (Laisk et al., 1989). Leafconductance for O3 was completely ascribed to the stomatalcomponent, which was calculated by multiplying Gw by 0.612, theratio of the relative diffusivity of water vapor and O3 (Polle et al.,1995). Uptake through the cuticle was ignored, because thecuticle is considered highly impermeable to O3 when compared toopen stomata (Kerstiens and Lendzian, 1989). Boundary layerresistance was neglected, as the leaves were kept slightly flutteringby air circulation during the fumigation time.
4.2. Biochemical measurements
Lipid peroxidation was determined by the TBARS assay ac-cording to Hodges et al. (1999). MDA is formed through auto-oxidation and enzymatic degradation of polyunsaturated fattyacids in membranes and reacts with two molecules of thio-barbituric acid via an acid-catalyzed nucleophilic addition formingan orange compound with a maximal absorbance at 532 nm. Leafdiscs (0.5 g) were ground in liquid nitrogen, suspended in 2.25 ml0.1% trichloroacetic acid and centrifuged at 8000� g for 20 min atroom temperature. The supernatant was filtered through a 0.2 mmMinisart� SRT 15 aseptic filter. One ml was mixed with 4 ml 20%trichloroacetic acid and 0.025ml 0.5% thiobarbituric acid (TBA). Themixture was heated for 30 min at 95 �C, immediately cooled andcentrifuged as above. The supernatant was used to determine theMDA concentration at 532 nm corrected for nonspecific turbidityby subtracting the absorbance at 600 nm. To correct the data forpossible interference with MDA-sugar complexes, also absorbing at532 nm, an aliquot of the extract was incubated without TBA andthe absorbance at 532 nm was subtracted from the value of theTBA-treated sample. The amount of MDA was calculated by usingan extinction coefficient of 155 mM�1 cm�1.
Photosynthetic pigments were determined by HPLC accordingto Ciompi et al. (1997). Thirty mg of leaves previously utilized forgas exchange and chlorophyll a fluorescence measurements werehomogenized in 3 ml 100% HPLC-grade methanol and incubatedovernight at 4 �C in the dark. The supernatant was filtered through0.2 mm Minisart� SRT 15 aseptic filters and immediately analyzedafterward. The HPLC analysis was performed at room temperaturewith a reverse-phase Dionex column (Acclaim 120, C18, 5 mmparticle size, 4.6 mm internal diameter � 150 mm length). Thepigments were eluted at a flow rate of 1 ml min�1 using 100%
solvent A (acetonitrile/methanol, 75/25, v/v) for the first 14 min todetermine all xanthophylls, also the separation of lutein fromzeaxanthin, followed by a 3 min linear gradient to 100% solvent B(methanol/ethylacetate, 68/32, v/v), 15 minwith 100% solvent B forthe elution of chlorophyll b, a and b-carotene. The pigments weredetected at 445 nm. The column was re-equilibrated in 100% so-lution A for 10 min before the next injection started. Pure authenticstandards were used to quantify the pigment content of eachsample.
The content of ABAwasmeasured by ELISA essentially accordingto Ferrante et al. (2012).
4.3. Ecophysiological measurements
CO2 and water vapor exchanges of the leaves were measuredwith an open infra-red gas exchange system (CIRAS-2, PP-Systems,Stotfold, UK) equippedwith a Parkinson leaf chamber, able to clampsingle leaves. Measurements were performed at ambient CO2 con-centrations (340e360 ppm) at 80% RH. The chamber was illumi-nated by a quartz halogen lamp and the leaf temperature wasmaintained at 26� 0.4 �C. Photosynthetic activity at saturating lightlevel (Asat) was measured at 1200 mmol photons m�2 s�1. Thecalculation of Ci was based on the equations described by vonCaemmerer and Farquhar (1981). The ITE was determined as theratio between Asat and the transpiration rate (E). Measurementswere made on three plants. Leaf photosynthetic CO2 assimilationresponses to irradiancewere calculated by using the Smith equation(Tenhunen et al., 1976), determined at a specific CO2 concentrationof 350 ppm. The initial slope of the light response curve of net CO2exchange is an indicator of the light use efficiency (Fa). It wascalculated from the initial slope dA/dPPFD (PPFD ¼ photosyntheticphoton flux density) of the curve by linear regression using valuesdetermined at a PPFD below 300 mmol m�2 s�1. The relationship ofthe leaf net CO2 assimilation rate (A) to the internal CO2 concen-tration (Ci < 200 mmol mol�1) was analyzed according to themechanistic model of CO2 assimilation proposed by Sharkey (1985).The quantum efficiency ðFCO2
Þ of the leaf was calculated by theslope dA/dCi of the regression equation. Vcmax, Jmax, Rd and TPU werecalculated according to Dubois et al. (2007). The assimilationchamber was maintained at a relative humidity of 63 � 7% and atemperature of 25 � 1.1 �C. Modulated chlorophyll a fluorescenceand the status of the electron transport of PSII were measured atroom temperature with a portable fluorometer (PAM-2000, Walz,Germany) on the same leaves used for gas-exchange experimentsdark-adapted 20 min ago, using a dark leaf clip. To determine theminimal fluorescence level (F0), where all primary quinone accep-tors of PSII are oxidized and capable of photoreduction, the leaf wasexposed to a very weak, modulated measuring beam, which wassufficiently low (<1 mmolm�2 s�1) without inducing any significantvariablefluorescence. Themaximalfluorescence level (Fm), when allPSII centers were closed, was determined by applying a saturatinglight pulse (0.8 s) at 8000 mmol m�2 s�1. The fluorescence inductionwas started by continuously illuminating with white actinic light(about 400 mmol m�2 s�1) and superimposed with 800 ms satu-rating pulses (10,000 mmol m�2 s�1 photon flux density ¼ PFD) in20 s intervals to determine maximal fluorescence in the light-adapted state ðF 0mÞ. After removing the actinic light source theminimal fluorescence level in the light-adapted state F 00 wasdetermined immediately in the presence of a far-red (>710 nm)background for 10 s to ensure maximal oxidation of PSII electronacceptors. While the intensity of actinic light was maintained atabout 400 mmol m�2 s�1, saturating flashes of white light at15,000 mmol m�2 s�1 and with a duration of 800 ms were givenevery 20 s. The saturating pulsemethodwas also used for analysis ofqP and qNP as described by Schreiber et al. (1986). FPSII was

A.S. Döring et al. / Plant Physiology and Biochemistry 74 (2014) 156e164 163
calculated as (F 0m � Fs)/F 0m, Fs is defined as the steady-state fluores-cence yield in the light-adapted state as described in Rohacek(2002).
The plant water status was determined on whole leaves using asealed pressure chamber (model 600 Pressure Chamber Instru-ment, PMS Instrument Company, USA) and N2 for the application ofpressure. The individual leaf water potential is defined immediatelywhen the first drop appears at the petiole (manufacturer’sinstructions).
To determine the osmotic potential, 50 mg of frozen plantmaterial were thawed for 30 s, major veins were excised and 10 mlof sap was squeezed out for the determination of solute concen-tration with a Vapor Pressure Osmometer (Wescor 5500). Each leafwas measured in duplicate and four replications were taken forevery time point (Gucci et al., 1997).
4.4. Staining and microscopy
Simultaneous detection of H2O2-accumulation and cell death inone leaf was accomplished by a combination of DAB and Evans bluestaining methods. To analyze H2O2 accumulation a method pub-lished by Iriti et al. (2003) was used. Leaf parts were immediatelyimmersed in 1 mg ml�1 DAB in HCl adjusted to pH 5.6 with 5 Msodium hydroxide (NaOH) and incubated for at least 8 h in the darkfollowed by clearing in 96% boiling ethanol for 10 min and exam-ined under a light microscope. The cellular H2O2 accumulation wasvisualized as a reddish-brown precipitation. For the detection ofcell death leaf parts were boiled for 1 min in a mixture of phenol,lactic acid, glycerol and distilled water (1/1/1/1, v/v/v/v) containing20 mg ml�1 Evans blue, prepared immediately before use. After-ward the leaves were cleared first with aqueous chloral hydrate(2.5 mg ml�1) and then with a concentrated chloral hydrate solu-tion (2.5 gml�1). Dead cells were stained blue, whereas undamagedcells appeared unstained.
4.5. Statistical analysis
Three individual plants per treatment were used. Followingperformance of the ShapiroeWilkW test, datawere analyzed usingone-way analysis of variance (ANOVA) and comparison amongmeans was determined by least significant (LSD) Fisher’s multiplecomparison test (P � 0.05). All analyses were performed by NCSS2000 Statistical Analysis System Software.
Acknowledgments
This research was supported by a grant from the Vigoni Project(MIUR-DAAD). We thank Dr. Romina Papini for help with experi-mental analyses.
References
Ainsworth, E.A., Yendrek, C.R., Sitch, S., Collins, W.J., Emberson, L.D., 2012. The ef-fects of tropospheric ozone on net primary productivity and implications forclimate change. Annu. Rev. Plant Biol. 63, 637e661.
Bassin, S., Volk, M., Fuhrer, J., 2007. Factors affecting the ozone sensitivity oftemperate European grasslands: an overview. Environ. Pollut. 146, 678e691.
Biswas, D.K., Jiang, G.M., 2011. Differential drought-induced modulation of ozonetolerance in winter wheat species. J. Exp. Bot. 62, 4153e4162.
Björkman, O., Demming, B., 1987. Photon yield of O2 evolution and chlorophyllfluorescence characteristics at 77 K among vascular plants of diverse origin.Planta 170, 489e504.
Bungener, P., Bassin, S., Fuhrer, J., 2003. Brown knapweed (Centaurea jacea L.) as apotential bioindicator native plant species for ambient ozone in Europe. IVLReport B 1523. In: Karlsson, P.E., Selldén, G., Pleijel, H. (Eds.), Establishing OzoneCritical Levels II. UNECE Workshop Report. Swedish Environmental ResearchInstitute, Gothenborg, pp. 204e210.
Calatayud, A., Iglesias, D.J., Talón, M., Barreno, E., 2003. Effects of 2-month ozoneexposure in spinach leaves on photosynthesis, antioxidant systems and lipidperoxidation. Plant Physiol. Biochem. 41, 839e845.
Calatayud, V., Marco, F., Cerveró, J., Sánchez-Peña, G., Sanz, M.J., 2010. Contrastingozone sensitivity in related evergreen and deciduous shrubs. Environ. Pollut.158, 3580e3587.
Calatayud, V., García-Breijo, F.J., Cervero, J., Reig-Armiñana, J., Sanz, M.J., 2011.Physiological, anatomical and biomass partitioning responses to ozone in theMediterranean endemic plant Lamottea dianae. Ecotox. Environ. Saf. 74,1131e1138.
Ciompi, A., Castagna, A., Ranieri, A., Nali, C., Lorenzini, G., Soldatini, G.F., 1997. CO2assimilation, xanthophyll cycle pigment and PSII efficiency in pumpkin plantsas affected by ozone fumigation. Physiol. Plant. 101, 881e889.
Coyle, M., Fowler, D., Ashmore, M., 2003. New directions: implications of increasingtropospheric background ozone concentrations for vegetation. Atmos. Environ.37, 153e154.
Dawnay, L., Mills, G., 2009. Relative effects of elevated background ozone concen-trations and peak episodes on senescence and above-ground growth in fourpopulations of Anthoxanthum odoratum L. Environ. Pollut. 157, 503e510.
Del Rio, D., Stewart, J.A., Pellegrini, N., 2005. A review of recent studies onmalondialdehyde as toxic molecule and biological marker of oxidative stress.Nutr. Metab. Cardiovas. 15, 216e328.
Demmig-Adams, B., Adams, W.W., 1992. Photoprotection and other responses ofplants to high light stress. Ann. Rev. Plant Physiol. Plant Mol. Biol. 43, 599e626.
Dubois, J.J.B., Fiscus, E.L., Booker, F.L., Flowers, M.D., Reid, C.D., 2007. Optimizing thestatistical estimation of the parameters of the Farquhar-von Caemmerer-Berrymodel of photosynthesis. New Phytol. 176, 402e414.
EEA (European Environment Agency). Technical report 3/2013, http://www.eea.europa.eu/publications/air-pollution-by-ozone-across-EU-2012, (accessedJuly 2013).
Faoro, F., Iriti, M., 2005. Cell death behind invisible symptoms: early diagnosis ofozone injury. Biol. Plant. 49, 585e592.
Feng, Z., Wang, X., Zheng, Q., Feng, Z., Xie, J., Zhan, C., 2006. Responses of gas ex-change of rape to ozone concentration and exposure regime. Acta Ecol. Sinica26, 823e829.
Ferrante, A., Trivellini, A., Borghesi, E., Vernieri, P., 2012. Chlorophyll a fluorescenceas a tool in evaluating the effects of ABA content and ethylene inhibitors onquality of flowering potted Bougainvillea. Scientif. World J., 684e747.
Francini, A., Nali, C., Pellegrini, E., Lorenzini, G., 2008. Characterization and isolationof some genes of the shikimate pathway in sensitive and resistant Centaureajacea plants after ozone exposure. Environ. Pollut. 151, 272e279.
Gucci, R., Lombardini, L., Tattini, M., 1997. Analysis of leaf water relations in leaves oftwo olive (Olea europaea) cultivars differing in tolerance to salinity. Tree Physiol.17, 13e21.
Heath, R.L., 2008. Modification of the biochemical pathways of plants inducedby ozone: what are the varied routes to change? Environ. Pollut. 155, 453e463.
Hodges, D.M., DeLong, J.M., Forney, C.F., Prange, R.K., 1999. Improving the thio-barbituric acid-reactive-substances assay for estimating lipid peroxidation inplant tissues containing anthocyanin and other interfering compounds. Planta207, 604e611.
Iriti, M., Rabotti, G., De Ascensao, A., Faoro, F., 2003. BTH-induced resistancemodulates ozone tolerance. J. Agric. Food Chem. 51, 4308e4314.
Iriti, M., Belli, L., Nali, C., Lorenzini, G., Gerosa, G., Faoro, F., 2006. Ozone sensitivity ofcurrant tomato (Lycopersicon pimpinellifolium), a potential bioindicator species.Environ. Pollut. 141, 275e282.
Jin, Z., Xue, S., Luo, Y., Tian, B., Fang, H., Li, H., Pei, Y., 2013. Hydrogen sulfideinteracting with abscisic acid in stomatal regulation responses to drought stressin Arabidopsis. Plant Physiol. Biochem. 62, 41e46.
Kerstiens, G., Lendzian, K.J., 1989. Interactions between ozone and plant cuticles. I.ozone deposition and permability. New Phytol. 112, 13e19.
Laisk, A., Kull, O., Moldau, H., 1989. Ozone concentration in intercellular air spaces isclose to zero. Plant Physiol. 90, 1163e1167.
Leitao, L., Dizengremel, P., Biolley, J.P., 2008. Foliar CO2 fixation in bean (Phaseolusvulgaris L.) submitted to elevated ozone. Distinct changes in Rubisco and PEPcactivities in relation to pigment content. Ecotox. Environ. Saf. 69, 531e540.
Levitt, J., 1980. Responses of Plants to Environmental Stresses, second ed. AcademicPress, New York.
Li, J., Wang, X.Q., Watson, M.B., Assmann, S.M., 2000. Regulation of abscisic acid-induced stomatal closure and anion channels by guard cell AAPK kinase. Sci-ence 287, 300e303.
Madkour, S.A., Laurence, J.A., 2002. Egyptian plant species as new ozone indicators.Environ. Pollut. 120, 339e353.
Manning, W.J., Godzik, B., Musselman, R., 2002. Potential bioindicator plant speciesfor ambient ozone in forested mountain areas of central Europe. Environ. Pollut.119, 283e290.
Nali, C., Francini, A., Lorenzini, G., 2009. White clover clones as a cost-effectiveindicator of phytotoxic ozone: 10 years of experience from central Italy. Envi-ron. Pollut. 157, 1421e1426.
Paoletti, E., Ferrara, A.M., Calatayud, V., Cerveró, J., Giannetti, F., Sanz, M.J.,Manning, W.J., 2009. Deciduous shrubs for ozone bioindication: Hibiscussyriacus as an example. Environ. Pollut. 157, 865e870.
Pellegrini, E., Francini, A., Lorenzini, G., Nali, C., 2011. PSII photochemistry andcarboxylation efficiency in Liriodendron tulipifera under ozone exposure. Envi-ron. Exp. Bot. 70, 217e226.

A.S. Döring et al. / Plant Physiology and Biochemistry 74 (2014) 156e164164
Pellegrini, E., Carucci, M.G., Campanella, A., Lorenzini, G., Nali, C., 2011. Ozone stressin Melissa officinalis plants assessed by photosynthetic function. Environ. Exp.Bot. 73, 94e101.
Petersen, M., Simmonds, M.S.J., 2003. Molecules of interest: rosmarinic acid.Phytochemistry 62, 121e125.
Pääkkönen, E., Günthardt-Goerg, M.S., Holopainen, T., 1998. Responses of leaf pro-cesses in a sensitive birch (Betula pendula Roth) clone to ozone combined withdrought. Ann. Bot. 82, 49e59.
Polle, A., Wieser, G., Havranek, W.M., 1995. Quantification of ozone flux and apo-plastic ascorbate content in needles of Norway spruce trees (Picea abies L.,Karst) at high altitude. Plant Cell Environ. 18, 681e688.
Rohacek, K., 2002. Chlorophyll fluorescence parameters: the definitions, photo-synthetic meaning and mutual relationships. Photosynthetica 40, 13e29.
Schreiber, U., Schliwa, U., Bilger, W., 1986. Continuous recording of photochemicaland non-photochemical quenching with a new type of modulation fluorimeter.Photosynth. Res. 10, 51e62.
Sharkey, T.D., 1985. Photosynthesis in intact leaves of C3 plants: physics, physiologyand rate limitations. Bot. Rev. 51, 53e105.
Tenhunen, J., Yocum, C., Gates, D., 1976. Development of a photosynthesismodel with an emphasis on ecological applications. I. Theory. Oecologia 26,69e100.
Unsworth, M.H., 1982. Exposure to gaseous pollutants and uptake by plants. In:Unsworth, M.H., Ormrod, D.P. (Eds.), Effects of Gaseous Air Pollutants in Agri-culture and Horticulture. Butterworths, London, pp. 43e63.
von Caemmerer, S., Farquhar, G.D., 1981. Some relationships between thebiochemistry of photosynthesis and the gas exchange of leaves. Planta 153,376e387.
Wagg, S., Mills, G., Hayes, F., Wilkinson, S., Davies, W.J., 2013. Stomata are lessresponsive to environmental stimuli in high background ozone in Dactylisglomerata and Ranunculus acris. Environ. Pollut. 175, 82e91.