how strategically is public debt being managed around the globe? · 2017-07-20 · 1 how...
TRANSCRIPT

How Strategically is Public Debt Being
Managed Around the Globe?
A Survey on Public Debt Management Strategies
Rodrigo Cabral
The World Bank Group
The World Bank Treasury
Financial Advisory and Banking Department
March 2015
Abstract
This note describes the results of a 2013 World
Bank survey of member countries about their
debt management strategies. Out of a sample
of 117 participating countries, 60% of countries
have a formal debt management strategy in
place. For the countries that have a strategy,
results indicate that: (i) 77% make the details of
the debt strategy public; (ii) 76% use some type
of strategic target to define the debt strategy;
(iii) 71% ground the debt strategy on
quantitative analysis; (iv) in the vast majority,
the strategy is approved by a high-level
authority; and (v) in 44% of the cases the
strategy is supported by a legal framework.
However, only a limited number of countries
(18 or 15%) satisfy all these requirements
simultaneously. Results are also broken-down
by income level, World Bank region, and level of
indebtedness.
Results suggest: (i) a need to further strengthen
the capacity of countries to develop a debt
management strategy; (ii) a need to focus
particularly on strengthening the capacity of
lower-income countries to undertake
quantitative analysis in developing a strategy;
(iii) a need for further discussion on the use of
stochastic versus deterministic models; and (iv)
a need to strengthen the debt management
legal framework to support strategy
development.
Compared with a similar survey carried out in
2007, these latest results indicate a significant
increase in the use of strategic targets to define
the debt strategy. However, no relevant
changes are noted in having a strategy in place
or making it public.
JEL classification
H63, F34
Keywords
Public Debt Management, debt management strategy.
The findings, interpretations, and conclusions expressed in this paper are entirely those of the author. They do not
necessarily represent the views of the International Bank for Reconstruction and Development/World Bank and its
affiliated organizations, or those of the Executive Directors of the World Bank or the governments they represent.

1
How Strategically is Public Debt Being
Managed Around the Globe?
A Survey on Public Debt Management Strategies
Rodrigo Cabral1
1 Rodrigo Cabral is from the Financial Advisory and Banking Department of the World Bank Treasury ([email protected]). The author is grateful to Tana Vong for the research he conducted particularly for the survey. The author would also like to thank Mr. Lars Jessen and Mr. Fernando Leonardo Hernandez for their valuable comments and suggestions. All errors are the author’s sole responsibility.

2
Contents 1. Introduction ...................................................................................................................................... 3
2. The Sample ........................................................................................................................................ 6
3. Existence of a Debt Management Strategy ...................................................................................... 7
4. Transparency ..................................................................................................................................... 9
5. Use of Strategic Targets .................................................................................................................. 11
6. Reliance on Quantitative Models .................................................................................................... 14
7. Governance ..................................................................................................................................... 16
8. Comparison to the 2007 Survey ...................................................................................................... 19
9. Final Considerations and Policy Implications .................................................................................. 22
10. References .................................................................................................................................. 27
Annex 1: Survey on debt management practices - Questionnaire ......................................................... 28
Annex 2: List of participating countries .................................................................................................. 29
Figures Figure 1. Sample of the 2013 survey: breakdown by level of income and WB regions. .............................. 6
Figure 2. Sample of the 2013 survey: rate of participation by country and income level. ........................... 7
Figure 3. Has the government established a formal debt management strategy? ...................................... 8
Figure 4. Is the strategy document published? .......................................................................................... 10
Figure 5. Use of Strategic Targets ............................................................................................................... 12
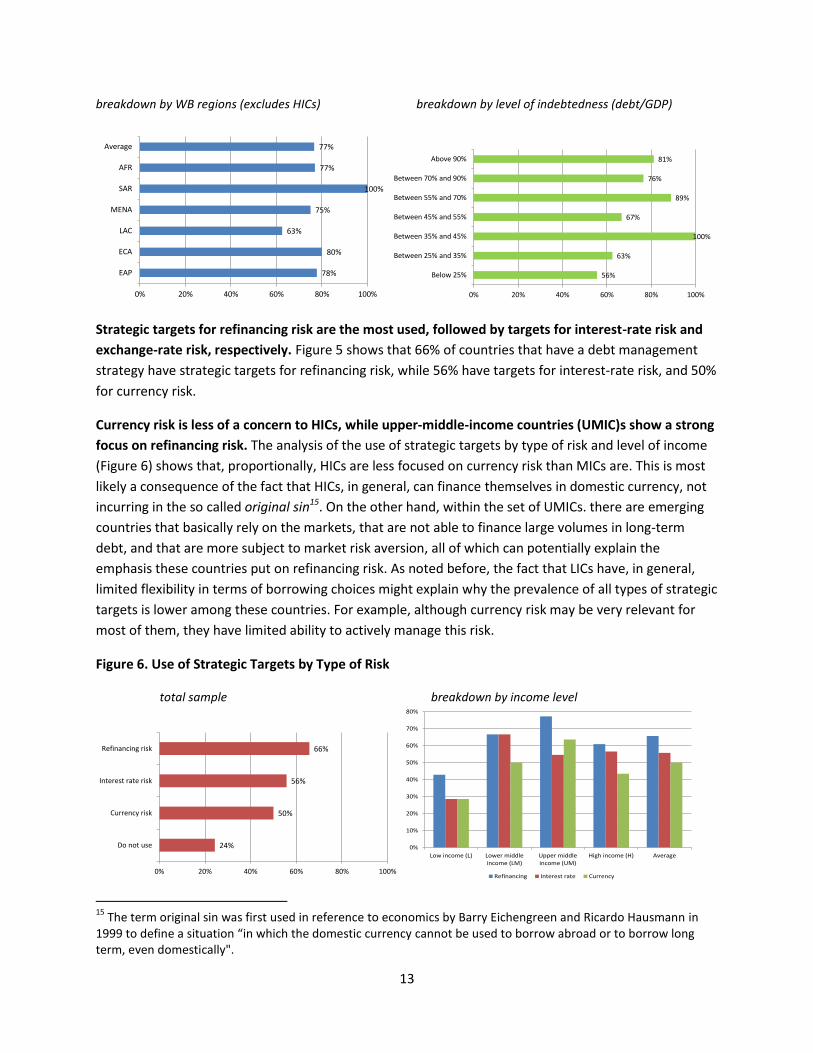
Figure 6. Use of Strategic Targets by Type of Risk ...................................................................................... 13
Figure 7. Use of Quantitative Analysis ........................................................................................................ 15
Figure 8. Use of Quantitative Analysis by level of income and by region ................................................... 16
Figure 9. Who approves the debt management strategy? ......................................................................... 17
Figure 10. Adoption of the Strategy by Primary Legislation ....................................................................... 18
Figure 11. Common sample of the two surveys (81 countries) .................................................................. 20
Figure 12. Existence of a debt management strategy across the common sample ................................... 21
Figure 13. Transparency of the debt management strategy across the common sample ......................... 21
Figure 14. Use of strategic targets across the common sample ................................................................. 22
3
1. Introduction
The main objective of public debt management is to ensure that the government’s financing needs are
met at the lowest possible cost in the medium term, while maintaining risks at a tolerable level2.
Another objective often involves the development of the domestic debt market.
Public debt management, particularly the composition and risk exposure of the debt portfolio, may
significantly impact the government’s finances and society’s welfare. Usually, the public debt portfolio
is the largest liability of the government. Decisions on today’s borrowing strategy have implications not
only for the present, but also for future generations. Countries’ experiences also show that the public
debt portfolio can help dampen or amplify external or domestic shocks. All of these illustrate the
importance of sound public debt management and of making well-informed strategic decisions when
analyzing costs and risks of the public debt portfolio.
Developing and implementing a strategy is at the heart of public debt management. According to the
Revised Guidelines for Public Debt Management (Guidelines), “Sovereign debt management is the
process of establishing and executing a strategy for managing the government’s debt in order to raise
the required amount of funding, achieve its risk and cost objectives, and to meet any other sovereign
debt management goals the government may have set, such as developing and maintaining an efficient
market for government securities.”
A strategy is a plan to achieve the debt management objectives. While objectives are fairly general, as
stated above, a debt management strategy is a rolling medium-term plan the government intends to
implement to achieve the desired debt composition. It involves analyzing cost-risk trade-offs of
alternative options, and it is often expressed in terms of target indicators that reflect the government’s
cost and risk tolerance/acceptance levels.
Decisions are taken under uncertainty. While no one knows what the future values of interest and
exchange-rates will be, the debt manager has to make borrowing decisions in the present. Instead of
just making ad-hoc choices, a strategic approach involves combining information available today with
prospective analysis of the costs and risks in the future of alternative borrowing schemes.
There are many benefits of using a debt management strategy to guide borrowing decisions. First of
all, it helps in making prudent choices based on analysis of cost and risk. In other words, it can help a
country avoid expensive mistakes. Secondly, it enhances intra-governmental communication, facilitating
policy coordination. Additionally, it also boosts communication with creditors and markets, which can
potentially reduce costs in the medium-term by reducing uncertainty. It is also a key element in the
governance/accountability framework for public debt management, because it gives the debt office a
clear mandate to manage its risk exposure, and provides standards by which to hold the debt office
accountable for its decisions. Finally, it also facilitates domestic debt market development by clearly
announcing to market participants the plans of the government for the medium term.
2 Revised Guidelines for Public Debt Management (2014).

4
Over the last few years, the World Bank has assisted a number of countries in developing debt
management strategies. The Bank, along with other technical assistance providers, is aware of the
importance of having a strategy in place for sound debt management, and has dedicated resources to
support member countries in developing and implementing debt strategies.
To this end, the Bank has developed tools to support countries developing debt management
frameworks. The Medium-Term Debt Management Strategy (MTDS) framework was jointly developed
by the World Bank (WB) and the International Monetary Fund (IMF) to support low-income countries
(LIC) designing a debt management strategy. The MTDS framework consists of a conceptual guidance
note and an Excel-based analytical tool to help quantify costs and risks of alternative debt management
strategies using both a baseline and alternative scenarios. The MTDS toolkit reflects best practices in this
area, and can be applied regardless of the level of income in the country. Additionally, in a number of
cases, the Bank has supported countries in developing their own analytical tools using the same
conceptual framework.
In 2007, the World Bank surveyed public debt managers about debt management strategies.
Questionnaire responses from public debt authorities and World Bank country offices, along with
analysis of WB needs assessments and website searches, resulted in a sample of 105 countries which
provided information on (i) whether a country had a debt management strategy in place, (ii) if so,
whether this was published and (iii) whether strategic benchmarks for the public debt portfolio had
been adopted with respect to currency, interest rates and refinancing risks.
The data collected was used to produce a World Bank Policy Research Working Paper3. Key findings of
this paper included:
There was a positive correlation between country income level and the level of indebtedness,
and whether a debt management strategy was in place;
Europe and Central Asia (ECA) was the most strategy-rich World Bank region;
There was no consistent pattern evident with respect to the transparency of debt management
strategies (that is whether the strategy was disclosed in a public document or not).
In 2012, the Bank decided to redo and extend the survey. It was proposed to update the 2007 research
and to extend the sample to include as many LICs as possible (LICs were not included in the original
sample). World Bank engagement with LICs on debt management has expanded considerably in recent
years, so it was appropriate to extend the survey to encompass countries in this category. This would
also create a new baseline for potential future surveys that could cover the widest possible range of
countries. The survey was initiated in the end of 2012 and finalized in 2013.
The 2013 survey focused on getting direct responses from debt managers, and at the same time
increasing the number of survey participants. As mentioned before, while the 2007 survey relied on a
number of different sources (responses from authorities and WB country offices, WB reports, and
countries’ websites), the recent survey relied only on direct responses from authorities formally in
3 A Cross-Country Analysis of Public Debt Management Strategies, Martin Melecky (July 2007).

5
charge of public debt management. At the same time, efforts were made to obtain the largest possible
set of responses. Because of these characteristics, a decision was taken to extend the data collection
period, which took almost a year, and a number of interactions with country authorities took place. The
final sample consisted of 117 responses from debt managers around the world, while in the 2007 survey
only about 25% of the responses came directly from the authorities.
Furthermore, this recent 2013 survey expanded the scope of the previous one. In addition to the
questions included in the 2007 survey, the 2013 survey added questions on governance and on the
analysis undertaken to develop the strategy4. On the governance side, we asked whether the strategy is
approved by high level authorities and if so, at what level of authority, and whether the strategy is
annexed to the annual budget or adopted by primary legislation (that is whether having a strategy in
place is a legal requirement). On the process to derive the strategy, we asked whether the strategy is
supported by quantitative analysis, and if so, whether deterministic or stochastic analysis is used.
A simple descriptive analysis of the results is explored in this note. The current output is a brief note
focused on describing current debt management practices compared to international standards as
stated by the Revised Guidelines for Public Debt Management and the Debt Management Performance
Assessment (DeMPA) tool. This exercise should help shed light on debt management practices, and may
reveal patterns and trends that are useful to inform the World Bank’s ongoing public debt management
technical advisory programs. Quantitative analysis will be limited to descriptive statistics.
An attempt will also be made to compare the 2013 results with the results found in 2007. A secondary
objective is to compare key debt management strategy metrics in 2013 with those used five years
before in order to see how these indicators have evolved in recent years. The implications of this
comparative evaluation will then be discussed and interpreted.
Because of methodological differences, comparison of the results of the two surveys must be made
with caution. First of all, the samples of the two surveys are different. In spite of the fact that the
sample of the 2013 survey is larger than the one of 2007 (117 versus 105), it does not include all
countries that were included in the previous survey. Indeed, the intersection of the two sets consists of
81 countries. In fact, 36 countries that had not been part of the 2007 survey were part of the 2013
survey, while 24 countries that had been part of the 2007 survey were not represented in the recent
2013 one. Furthermore, as already mentioned, while the 2007 survey used a number of different
sources, in 2013 we only worked with direct responses from debt managers. While we believe that
getting direct responses from debt managers can increase the accuracy of the responses5, caution is
needed in comparing results from the two samples because of the difference in sources used in the two
respective surveys.
While the proposed research has the advantage of simplicity, this approach does have significant
limitations, which will be acknowledged in the paper. In particular, this research will examine to what
4 See all the questions of the survey in Annex 1.
5 Responses from sources other than the debt managers themselves are more subject to inaccuracies, either
because those other sources may have a less precise understanding of what is a formal debt strategy, or because these other sources, such as websites, reports, and so forth, may only incompletely cover the subject.
6
extent countries have debt management strategies in place and how many publically disclose their
strategies. This captures a key aspect of sound practice in government debt management but does not
on its own provide a truly holistic or nuanced view of the progress made in improving debt management
in developing countries, something which would require far more detailed input data or information. In
this sense, the inferences that the research intends to support should be seen as modest.
Only aggregate results are made public. As agreed with participating countries, all individual responses
are kept confidential, and only aggregate results are shown. Results are aggregated by income level,
World Bank region, and, in some cases, level of indebtedness.
The results can help improve our understanding of many aspects of debt management practices and
provide valuable input for the Bank’s work program. We believe they can also be very informative to
country authorities wanting to learn about other international experiences on this particular subject and
wanting to be able to identify gaps that need to be addressed in their own respective countries. Even
given the limitations of making comparisons between these two surveys, valuable information can be
extracted about the evolution of practices used over the past few years regarding the development of
debt management strategies.
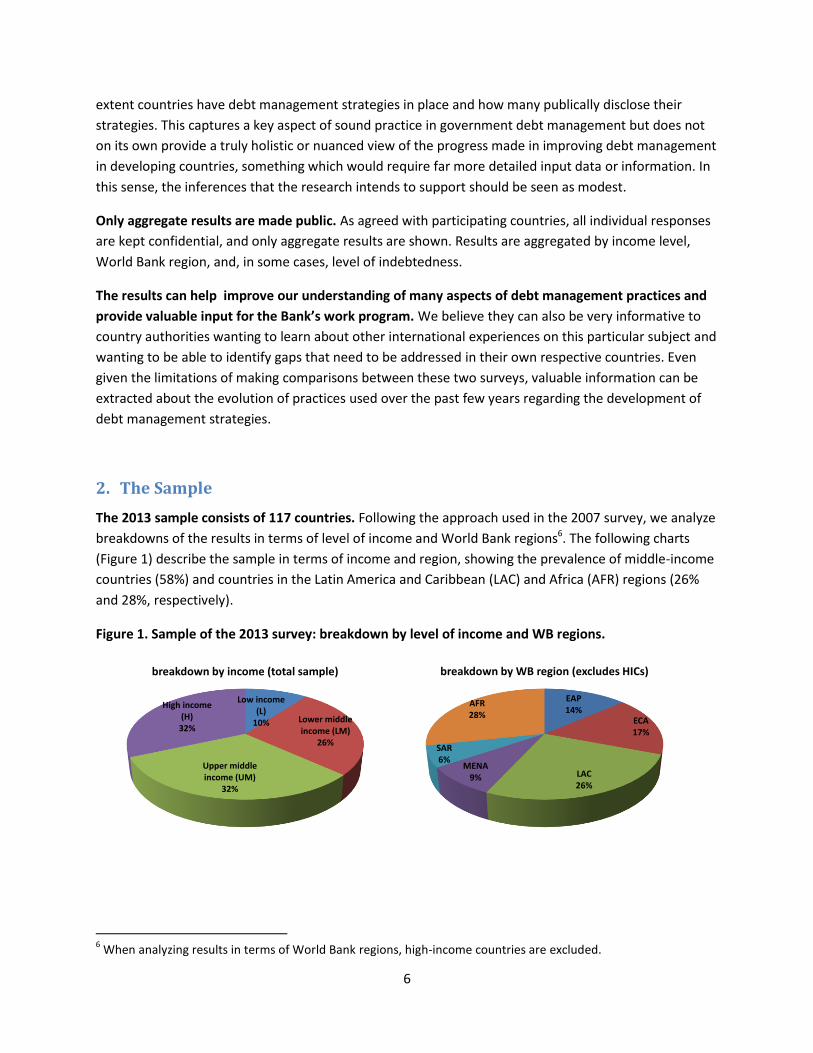
2. The Sample
The 2013 sample consists of 117 countries. Following the approach used in the 2007 survey, we analyze
breakdowns of the results in terms of level of income and World Bank regions6. The following charts
(Figure 1) describe the sample in terms of income and region, showing the prevalence of middle-income
countries (58%) and countries in the Latin America and Caribbean (LAC) and Africa (AFR) regions (26%
and 28%, respectively).
Figure 1. Sample of the 2013 survey: breakdown by level of income and WB regions.
6 When analyzing results in terms of World Bank regions, high-income countries are excluded.
Low income (L)
10% Lower middle income (LM)
26%
Upper middle income (UM)
32%
High income (H)
32%
breakdown by income (total sample)
EAP14%
ECA17%
LAC26%
MENA9%
SAR6%
AFR28%
breakdown by WB region (excludes HICs)
7
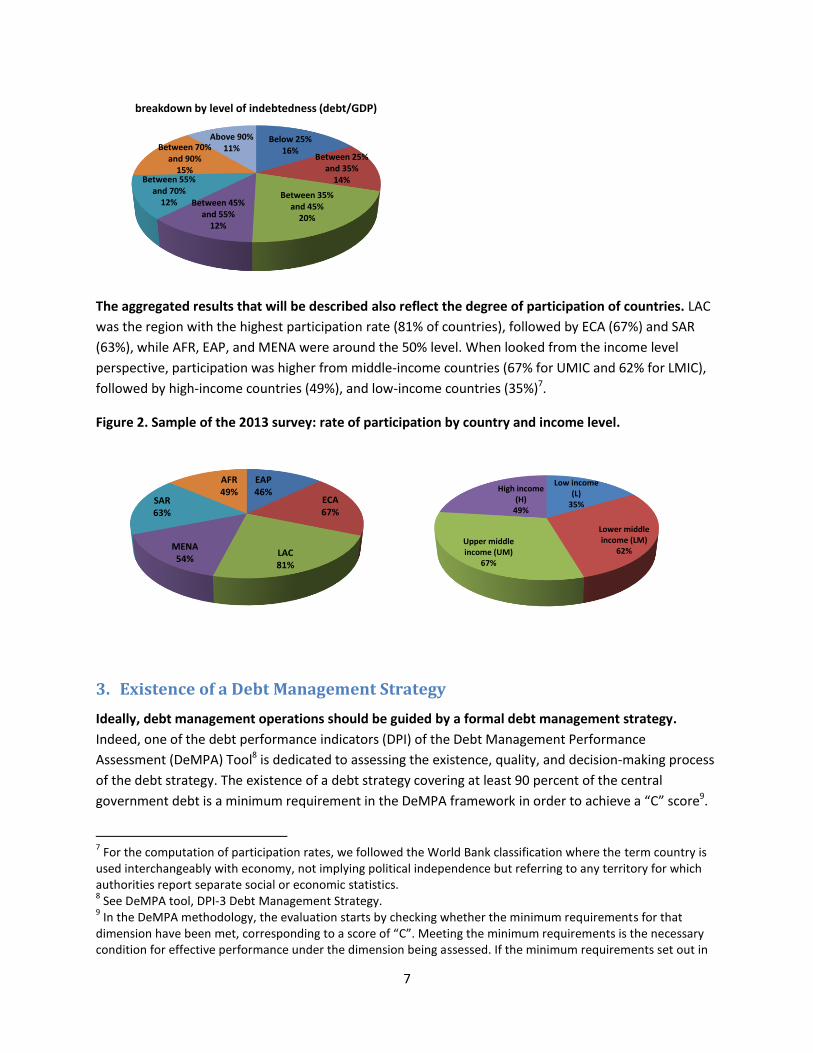
The aggregated results that will be described also reflect the degree of participation of countries. LAC
was the region with the highest participation rate (81% of countries), followed by ECA (67%) and SAR
(63%), while AFR, EAP, and MENA were around the 50% level. When looked from the income level
perspective, participation was higher from middle-income countries (67% for UMIC and 62% for LMIC),
followed by high-income countries (49%), and low-income countries (35%)7.
Figure 2. Sample of the 2013 survey: rate of participation by country and income level.
3. Existence of a Debt Management Strategy
Ideally, debt management operations should be guided by a formal debt management strategy.
Indeed, one of the debt performance indicators (DPI) of the Debt Management Performance
Assessment (DeMPA) Tool8 is dedicated to assessing the existence, quality, and decision-making process
of the debt strategy. The existence of a debt strategy covering at least 90 percent of the central
government debt is a minimum requirement in the DeMPA framework in order to achieve a “C” score9.
7 For the computation of participation rates, we followed the World Bank classification where the term country is
used interchangeably with economy, not implying political independence but referring to any territory for which authorities report separate social or economic statistics. 8 See DeMPA tool, DPI-3 Debt Management Strategy.
9 In the DeMPA methodology, the evaluation starts by checking whether the minimum requirements for that
dimension have been met, corresponding to a score of “C”. Meeting the minimum requirements is the necessary condition for effective performance under the dimension being assessed. If the minimum requirements set out in
Below 25%16%
Between 25% and 35%
14%
Between 35% and 45%
20%
Between 45% and 55%
12%
Between 55% and 70%
12%
Between 70% and 90%
15%
Above 90%11%
breakdown by level of indebtedness (debt/GDP)
EAP46%
ECA67%
LAC81%
MENA54%
SAR63%
AFR49%
Low income (L)
35%
Lower middle income (LM)
62%Upper middle income (UM)
67%
High income (H)
49%

8
The strategy should also be expressed at least as a guideline for the preferred direction or evolution of
specific indicators relating to interest rates, refinancing, and foreign currency risk.
The first question of the survey asked about the existence of a formal debt management strategy. The
actual question was, “Has the government established a formal debt management strategy for the total
central government debt portfolio?”. This question was further clarified by describing a “formal debt
management strategy” as a document that defines how the composition of public debt will develop over
the medium term, and which officials are obliged to implement unless the strategy document is
amended under the same level of approval as the original. Although qualifying what we mean by a
“formal strategy” improves the accuracy of the survey, it also makes it more challenging to compare
these 2013 results with the 2007 results, where no qualifier was inserted.
Most countries have formal debt management strategies in place. Of the 117 participant countries,
60% responded that they have formal debt management strategies. However, looking at it from the
opposite angle, it means that there are still a large number of countries (47 out of this sample of 117)
where debt management is not steered by a formal strategy.
Although the picture does not change much with the income level, it does change significantly for
some of the WB regions. Looking at the breakdown by income level, results are similar for the different
income groups. On the other hand, when analyzed by WB regions, results are quite different. While AFR,
Southeast Asia (SAR) and Middle East and North Africa (MENA) regions show results around the average
(58%)10, LAC is much below the average (38%), and Europe and Central Asia (ECA) and East Asia and
Pacific (EAP) regions are well above (71% and 82% respectively). See Figure 3.
Figure 3. Has the government established a formal debt management strategy?
total sample breakdown by income level
“C” are not met, then a score of “D” is assigned. The “A” score reflects sound practice for that particular dimension of the indicator. The “B” score is an intermediate score, falling between the minimum requirements and sound practices. 10
Note that when results are analyzed by WB region, high-income countries (HIC)s are excluded. As a consequence of having a subset of the total sample, the average is not necessarily the same (in this case 58% compared to 60% in the total sample).
Yes60%
No40%
58%
58%
59%
62%
60%
0% 10% 20% 30% 40% 50% 60% 70%
Low income (L)
Lower middle income (LM)
Upper middle income (UM)
High income (H)
Average

9
breakdown by WB regions (excludes HICs) breakdown by level of indebtedness (debt/GDP)
There is a positive correlation between level of indebtedness and having a debt management
strategy. Figure 3 illustrates this positive correlation for the 2013 results, which could indicate that
higher-indebted countries have a stronger need to have a medium-term strategy in place.
In summary, regarding the existence of a formal medium-term debt management strategy, results
show that:
60% of countries surveyed had debt management strategies in place in 2013;
The existence of a strategy is similar across income levels;
EAP and ECA are the most strategy-rich regions, while LAC is the least and the others are around
the average;
There is a positive correlation between level of indebtedness and the existence of a debt
management strategy.
4. Transparency
Debt management operations should be transparent. According to both the Guidelines and the Fiscal
Transparency Code11, transparency and accountability are key factors in debt management operations.
Transparency should help in: (i) increasing the effectiveness of debt management operations, (ii)
improving accountability of all entities involved in debt management, (iii) fostering coordination within
the government, and (iv) lowering borrowing costs by reducing uncertainty to investors.
Sound transparency practices require making the debt management strategy public. According to the
Guidelines, “A description of the medium-term debt management strategy, with cost and risk indicators
or targets, is particularly valuable to investors and other stakeholders.” Public availability of the debt
management strategy is also a minimum requirement in the DeMPA methodology12.
11
Fiscal Transparency Code (2014), IMF. 12
DeMPA tool, DPI-3, sub-dimension 2.
82%
71%
38%
57%
60%
57%
58%
0% 20% 40% 60% 80% 100%
EAP
ECA
LAC
MENA
SAR
AFR
Average
47%
50%
54%
86%
64%
65%
62%
0% 10% 20% 30% 40% 50% 60% 70% 80% 90%
Below 25%
Between 25% and 35%
Between 35% and 45%
Between 45% and 55%
Between 55% and 70%
Between 70% and 90%
Above 90%

10
About 80% of countries that have a debt management strategy publish it. One of the questions asked
in both the 2013 and the 2007 surveys was whether the strategy document is published or not13. In
2013, 77% (or 54) of the 70 countries that had a debt strategy published it. Again, although this is a
positive result, it also means that more than 20% of countries that have debt strategies do not publish
them. Or, aggregating both results, only 54 out of the 117 countries surveyed had publicly available debt
management strategies.
It is interesting that transparency has a negative correlation with income levels. Figure 4 shows that
the publishing of the strategy document is negatively correlated with income levels, where 100% of LICs
publish their strategies, compared to 80% in the case of middle-income countries (MIC)s, and 65% for
high-income countries (HIC)s. The higher transparency found in LICs and MICs might be the result of a
greater need for these countries to be more transparent in order to access market sources of financing.
Investors might be more demanding for these countries compared to the HICs, where information is
usually more accessible and general knowledge about the country is higher. It may also be due in part to
the demands for information from international organizations like the IMF and the World Bank.
Transparency varies significantly across regions. In LAC, ECA, EAP and AFR, greater transparency is
shown than the average, while transparency in SAR and MENA falls behind the average. LAC is an
interesting case because, although it ranks last in terms of countries having a debt management strategy
(38%), it ranks first in terms of transparency (having the strategy document publicly available), Thus,
compared to other regions, fewer LAC countries have strategies in place, but all those that have it
publish it.
Figure 4. Is the strategy document published?
total sample breakdown by income level
13
Of course, the total sample for this and the following questions is restricted to those countries that have a strategy in place (60% of the total sample or 70 countries).
Yes77%
No23%
100%
78%
82%
65%
77%
0% 20% 40% 60% 80% 100%
Low income (L)
Lower middle income (LM)
Upper middle income (UM)
High income (H)
Average
11
breakdown by WB regions (excludes HICs) breakdown by level of indebtedness (debt/GDP)
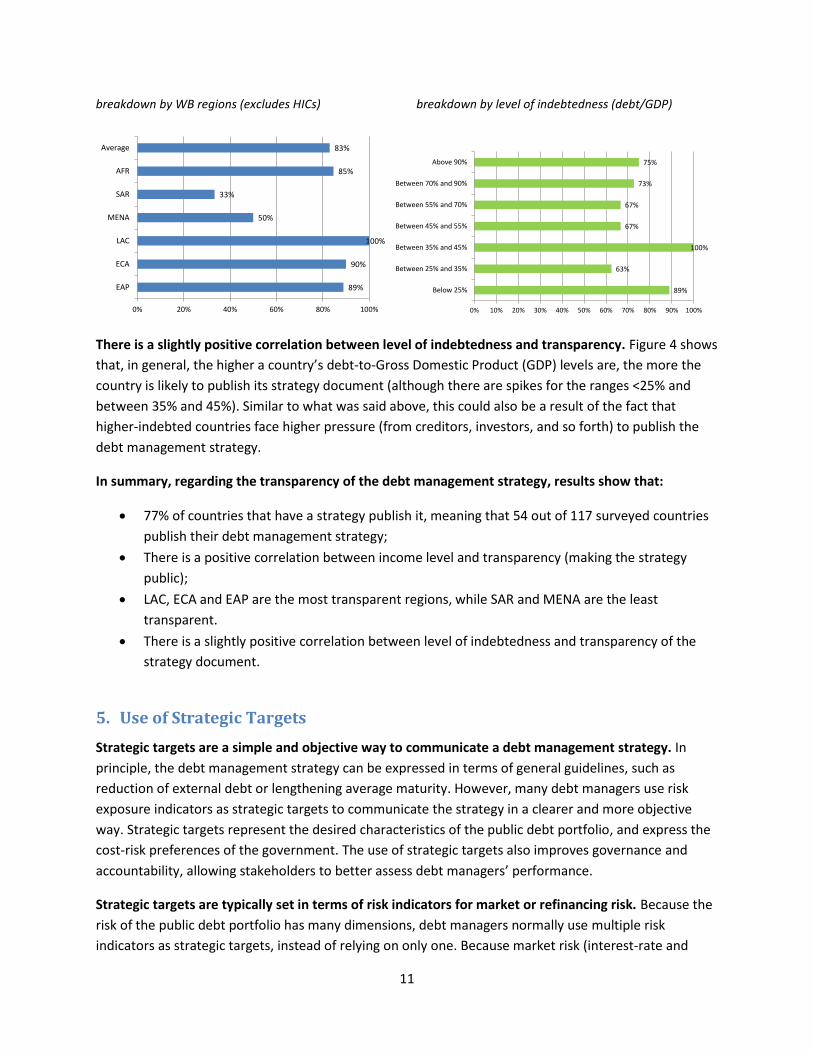
There is a slightly positive correlation between level of indebtedness and transparency. Figure 4 shows
that, in general, the higher a country’s debt-to-Gross Domestic Product (GDP) levels are, the more the
country is likely to publish its strategy document (although there are spikes for the ranges <25% and
between 35% and 45%). Similar to what was said above, this could also be a result of the fact that
higher-indebted countries face higher pressure (from creditors, investors, and so forth) to publish the
debt management strategy.
In summary, regarding the transparency of the debt management strategy, results show that:
77% of countries that have a strategy publish it, meaning that 54 out of 117 surveyed countries
publish their debt management strategy;
There is a positive correlation between income level and transparency (making the strategy
public);
LAC, ECA and EAP are the most transparent regions, while SAR and MENA are the least
transparent.
There is a slightly positive correlation between level of indebtedness and transparency of the
strategy document.
5. Use of Strategic Targets
Strategic targets are a simple and objective way to communicate a debt management strategy. In
principle, the debt management strategy can be expressed in terms of general guidelines, such as
reduction of external debt or lengthening average maturity. However, many debt managers use risk
exposure indicators as strategic targets to communicate the strategy in a clearer and more objective
way. Strategic targets represent the desired characteristics of the public debt portfolio, and express the
cost-risk preferences of the government. The use of strategic targets also improves governance and
accountability, allowing stakeholders to better assess debt managers’ performance.
Strategic targets are typically set in terms of risk indicators for market or refinancing risk. Because the
risk of the public debt portfolio has many dimensions, debt managers normally use multiple risk
indicators as strategic targets, instead of relying on only one. Because market risk (interest-rate and
89%
90%
100%
50%
33%
85%
83%
0% 20% 40% 60% 80% 100%
EAP
ECA
LAC
MENA
SAR
AFR
Average
89%
63%
100%
67%
67%
73%
75%
0% 10% 20% 30% 40% 50% 60% 70% 80% 90% 100%
Below 25%
Between 25% and 35%
Between 35% and 45%
Between 45% and 55%
Between 55% and 70%
Between 70% and 90%
Above 90%

12
exchange-rate risk) and refinancing risk are usually the main risks to the public debt portfolio, indicators
that cover those risks are the natural candidates for strategic targets.
The specific risk exposure indicators used as strategic targets should reflect the most important risks
to the debt portfolio. Because of that, strategic targets are intrinsic to each country, not only regarding
the type of risk indicator, but also its target value or range14. Strategic targets represent the portfolio
structure that the government would like to achieve, based on its cost-risk preferences.
International best practices suggest the use of strategic targets. This is reflected in the DeMPA tool that
requires the strategy to have “realistic target levels for indicators of the interest rate, refinancing, and
foreign currency risk, reflecting the specific country environment” in order to get a “B” score on the
quality of the strategy document. The Guidelines also highlight that many governments support sound
debt structures by establishing targets and ranges for key risk indicators, and that public targets help
increase the predictability and transparency of debt management operations, and in turn reduce
uncertainty for investors.
In 2013, 76% of countries that had a debt management strategy in place expressed in terms of one or
more strategic targets. This means that in most of the cases the identified strategies clearly indicate the
cost-risk preferences of the country.
The use of strategic targets is more prevalent in HICs and MICs than in LICs, and is high across all
regions. The fact that LICs make less use of strategic targets might be a consequence of the fact that
they are more constrained when it comes to financial choices. But it is interesting to observe that the
fact that LICs have, in general, limited financial choices doesn’t prevent them from having a formal and
published debt management strategy, as discussed above. The use of strategic targets is similar among
most regions, except in LAC that falls behind and SAR that performs better.
Figure 5. Use of Strategic Targets
total sample breakdown by income level
14
In most of the cases a range or limit, as it is difficult to maintain a point target over time.
Yes76%
No24%
57%
83%
77%
74%
76%
0% 20% 40% 60% 80% 100%
Low income (L)
Lower middle income (LM)
Upper middle income (UM)
High income (H)
Average
13
breakdown by WB regions (excludes HICs) breakdown by level of indebtedness (debt/GDP)
Strategic targets for refinancing risk are the most used, followed by targets for interest-rate risk and
exchange-rate risk, respectively. Figure 5 shows that 66% of countries that have a debt management
strategy have strategic targets for refinancing risk, while 56% have targets for interest-rate risk, and 50%
for currency risk.
Currency risk is less of a concern to HICs, while upper-middle-income countries (UMIC)s show a strong
focus on refinancing risk. The analysis of the use of strategic targets by type of risk and level of income
(Figure 6) shows that, proportionally, HICs are less focused on currency risk than MICs are. This is most
likely a consequence of the fact that HICs, in general, can finance themselves in domestic currency, not
incurring in the so called original sin15. On the other hand, within the set of UMICs. there are emerging
countries that basically rely on the markets, that are not able to finance large volumes in long-term
debt, and that are more subject to market risk aversion, all of which can potentially explain the
emphasis these countries put on refinancing risk. As noted before, the fact that LICs have, in general,
limited flexibility in terms of borrowing choices might explain why the prevalence of all types of strategic
targets is lower among these countries. For example, although currency risk may be very relevant for
most of them, they have limited ability to actively manage this risk.
Figure 6. Use of Strategic Targets by Type of Risk
total sample breakdown by income level
15
The term original sin was first used in reference to economics by Barry Eichengreen and Ricardo Hausmann in 1999 to define a situation “in which the domestic currency cannot be used to borrow abroad or to borrow long term, even domestically".
78%
80%
63%
75%
100%
77%
77%
0% 20% 40% 60% 80% 100%
EAP
ECA
LAC
MENA
SAR
AFR
Average
56%
63%
100%
67%
89%
76%
81%
0% 20% 40% 60% 80% 100%
Below 25%
Between 25% and 35%
Between 35% and 45%
Between 45% and 55%
Between 55% and 70%
Between 70% and 90%
Above 90%
66%
56%
50%
24%
0% 20% 40% 60% 80% 100%
Refinancing risk
Interest rate risk
Currency risk
Do not use 0%
10%
20%
30%
40%
50%
60%
70%
80%
Low income (L) Lower middleincome (LM)
Upper middleincome (UM)
High income (H) Average
Refinancing Interest rate Currency

14
breakdown by region breakdown by level of indebtedness (debt/GDP
In summary, regarding the use of strategic targets, results show that:
76% of countries that have a debt management strategy express it by using strategic targets
(numeric risk indicators);
The use of strategic targets is lower in LICs and similar in MICs and HICs;
The use of targets is similar across the WB regions, except for SAR (higher use) and LAC (lower
use);
Refinancing risk indicators are the most used type of strategic targets;
Targets for currency risk are more prevalent among MICs.
6. Reliance on Quantitative Models
The survey also asked countries whether the design of the debt management strategy is supported or
not by quantitative analysis. While there are countries that develop the strategy based on qualitative
considerations, many others have some kind of quantitative tool, either being an in-house developed
model or an off-the-shelf solution such as the MTDS toolkit.
Indeed, a quantitative model is not a pre-condition for having a debt management strategy. A debt
management strategy could be expressed in terms of general guidelines and be based on the debt
manager’s experience and intuition. In fact, we can see in the survey results that there are some
countries (29%) that have a debt management strategy without quantitative models in place (Figure 7).
Definition of specific numeric target levels for risk exposure indicators requires quantitative analysis.
Quantification of cost-risk tradeoffs allows debt managers to make better-informed decisions and to
identify specific target values or ranges for a set of risk-exposure indicators. The DeMPA tool reinforces
this sound practice by requiring that “the target levels for the risk indicators are based on a thorough
analysis of costs and risk …” in order to assign an “A” score to the quality of the strategy.
Most countries use quantitative analysis supporting the strategy development. Results show that 71%
of countries that have a formal strategy base their strategy on quantitative analysis, either from
0%
10%
20%
30%
40%
50%
60%
70%
80%
90%
100%
Below 25% Between25% and
35%
Between35% and
45%
Between45% and
55%
Between55% and
70%
Between70% and
90%
Above 90% unknown
Refinancing Interest rate Currency
15
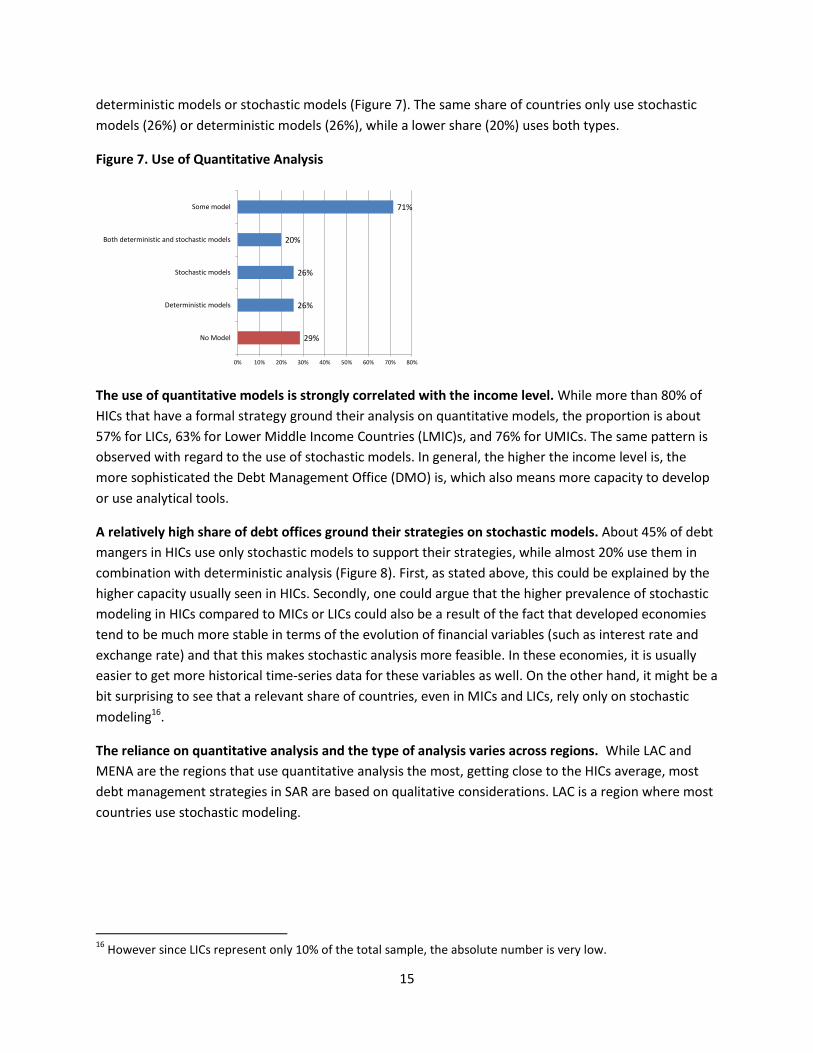
deterministic models or stochastic models (Figure 7). The same share of countries only use stochastic
models (26%) or deterministic models (26%), while a lower share (20%) uses both types.
Figure 7. Use of Quantitative Analysis
The use of quantitative models is strongly correlated with the income level. While more than 80% of
HICs that have a formal strategy ground their analysis on quantitative models, the proportion is about
57% for LICs, 63% for Lower Middle Income Countries (LMIC)s, and 76% for UMICs. The same pattern is
observed with regard to the use of stochastic models. In general, the higher the income level is, the
more sophisticated the Debt Management Office (DMO) is, which also means more capacity to develop
or use analytical tools.
A relatively high share of debt offices ground their strategies on stochastic models. About 45% of debt
mangers in HICs use only stochastic models to support their strategies, while almost 20% use them in
combination with deterministic analysis (Figure 8). First, as stated above, this could be explained by the
higher capacity usually seen in HICs. Secondly, one could argue that the higher prevalence of stochastic
modeling in HICs compared to MICs or LICs could also be a result of the fact that developed economies
tend to be much more stable in terms of the evolution of financial variables (such as interest rate and
exchange rate) and that this makes stochastic analysis more feasible. In these economies, it is usually
easier to get more historical time-series data for these variables as well. On the other hand, it might be a
bit surprising to see that a relevant share of countries, even in MICs and LICs, rely only on stochastic
modeling16.
The reliance on quantitative analysis and the type of analysis varies across regions. While LAC and
MENA are the regions that use quantitative analysis the most, getting close to the HICs average, most
debt management strategies in SAR are based on qualitative considerations. LAC is a region where most
countries use stochastic modeling.
16
However since LICs represent only 10% of the total sample, the absolute number is very low.
29%
26%
26%
20%
71%
0% 10% 20% 30% 40% 50% 60% 70% 80%
No Model
Deterministic models
Stochastic models
Both deterministic and stochastic models
Some model

16
Figure 8. Use of Quantitative Analysis by level of income and by region
In summary, regarding the reliance on quantitative analysis, results show that:
71% of countries that have a debt management strategy ground it on quantitative analysis;
Stochastic and deterministic models are evenly used;
The use of stochastic models is positively correlated to income level.
7. Governance
A sound governance process is a necessary complement to having a good debt management strategy.
Approval of debt management strategies by high-level authorities provides legitimacy to the strategy
and enforces its implementation, with the result that this process steers borrowing decisions and other
debt management activities. Best practices, as evidenced by the DeMPA tool, suggest that approval by
high level authorities is a minimum requirement to achieve sound debt management. It is essential to
give the DMO the mandate to implement the strategy and pursue the desired debt portfolio
composition.
Ideally, the legal framework should also support the development of a debt management strategy.
Minimum requirements for a sound legal framework include a clear authorization to borrow or
undertake debt-related transactions, including the issuance of guarantees, and specification of the
purposes for which debt can be issued. In an optimum situation, primary legislation should also include
the requirement to develop a debt management strategy.
0%
5%
10%
15%
20%
25%
30%
35%
40%
45%
Low income (L) Lower middleincome (LM)
Upper middleincome (UM)
High income (H) Average
No Yes, by deterministic models
Yes, by stochastic models Yes, by both deterministic and stochastic models
0%
10%
20%
30%
40%
50%
60%
70%
EAP ECA LAC MENA SAR AFR Average
No Yes, by deterministic models
Yes, by stochastic models Yes, by both deterministic and stochastic models

17
The 2013 survey further investigated the governance process of the debt management strategy.
Specifically, it surveyed countries on whether high level authorities approved the strategy, and if so,
who approved it. The survey also asked whether such approval was a legal requirement, and as such
whether it was either annexed to the annual budget act or law, or was adopted by primary legislation,
such as legislation governing the public debt, the budget system or fiscal responsibility (going forward
we refer to all these possibilities as ‘adoption by primary legislation’) .
Almost all countries that have a debt management strategy in place have it approved by high-level
authorities, primarily by the Minister of Finance or the Cabinet. As can be seen in Figure 9, only 3% of
the countries that have a debt management strategy declared that the strategy is not approved by high-
level authorities. In most of the cases (77%), the strategy document was either approved by the Minister
of Finance (56%) or by the Cabinet (14%), and in a few cases (6%) the strategy was approved by the
President. In 14% of the cases, countries answered that the strategy was approved by another entity. In
almost half of these other cases, countries answered more generically that the Government approved it.
A few cases reported approval by the parliament, or by a high-level debt management committee, and,
in one case, by the general accountant.
Figure 9. Who approves the debt management strategy?
The pattern differs when broken down by income level and WB region. Still, in most of the cases,
approval is done by the Minister or the Cabinet. Apart from the fact that UMICs have fewer strategies
approved by the Minister and more under the “other” category, the income level also doesn’t seem to
determine significant changes in the approving authority of the strategy.
President, 6%
Minister, 56%
Cabinet, 21%
Other, 14%
No approval, 3%
0%
10%
20%
30%
40%
50%
60%
70%
80%
Low income (L) Lower middleincome (LM)
Upper middleincome (UM)
High income (H) Average
President Minister Cabinet Other No approval
0%
20%
40%
60%
80%
100%
EAP ECA LAC MENA SAR AFR Average
President Minister Cabinet Other No approval
18
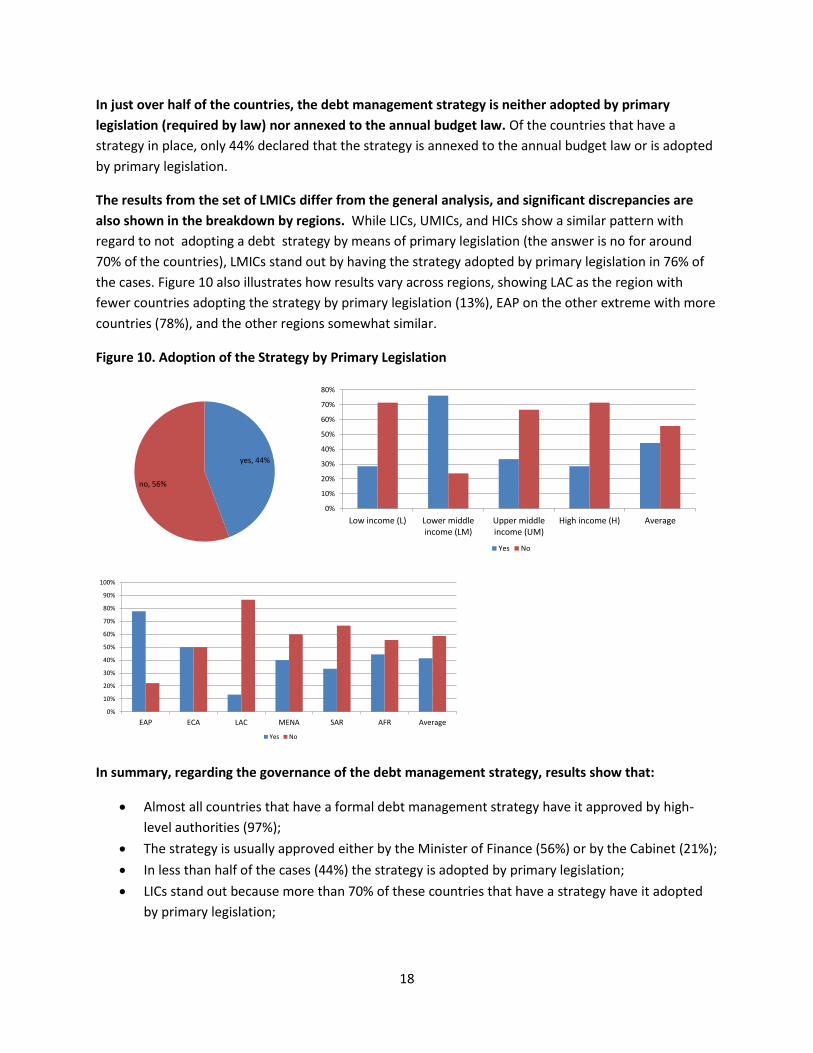
In just over half of the countries, the debt management strategy is neither adopted by primary
legislation (required by law) nor annexed to the annual budget law. Of the countries that have a
strategy in place, only 44% declared that the strategy is annexed to the annual budget law or is adopted
by primary legislation.
The results from the set of LMICs differ from the general analysis, and significant discrepancies are
also shown in the breakdown by regions. While LICs, UMICs, and HICs show a similar pattern with
regard to not adopting a debt strategy by means of primary legislation (the answer is no for around
70% of the countries), LMICs stand out by having the strategy adopted by primary legislation in 76% of
the cases. Figure 10 also illustrates how results vary across regions, showing LAC as the region with
fewer countries adopting the strategy by primary legislation (13%), EAP on the other extreme with more
countries (78%), and the other regions somewhat similar.
Figure 10. Adoption of the Strategy by Primary Legislation
In summary, regarding the governance of the debt management strategy, results show that:
Almost all countries that have a formal debt management strategy have it approved by high-
level authorities (97%);
The strategy is usually approved either by the Minister of Finance (56%) or by the Cabinet (21%);
In less than half of the cases (44%) the strategy is adopted by primary legislation;
LICs stand out because more than 70% of these countries that have a strategy have it adopted
by primary legislation;
yes, 44%
no, 56%
0%
10%
20%
30%
40%
50%
60%
70%
80%
Low income (L) Lower middleincome (LM)
Upper middleincome (UM)
High income (H) Average
Yes No
0%
10%
20%
30%
40%
50%
60%
70%
80%
90%
100%
EAP ECA LAC MENA SAR AFR Average
Yes No

19
Regarding the WB regions, LAC stands out as having lower incidences (a bit more than 10%)
where the strategy is adopted by primary legislation.
8. Comparison to the 2007 Survey
Three questions posed in the recent 2013 survey were also included in the 2007 survey. Questions
about the existence of a debt management strategy, the transparency of the strategy (whether it’s
public or not), and the use of strategic targets were investigated in both surveys.
However, the two surveys (2013 and 2007) had different samples. First, while the 2013 survey included
117 countries and the 2007 survey included 105 countries, the intersection of the two sets - that is the
common sample - consisted of 81 countries. Secondly, the breakdown by level of income is also quite
different. The 2007 survey didn’t include any LICs, whereas in 2013, LICs represented 10% of the total
sample. Additionally, there is a higher share of HICs in the new survey, which is also influenced by the
fact that some countries moved from UMIC to HIC status between 2007 and 2013. Thirdly, the
comparison by regions also shows some important differences, including the movement of some
countries to HIC status during the years between the two surveys (as HICs are not classified according to
the World Bank regions). Finally, review of levels of indebtedness also reveals a different pattern
between the two surveys. On average, the countries in the recent survey have more debt than the
countries in the previous sample. Although this increased indebtedness is an effect of there being
different participating countries in both surveys, it is certainly also affected by the rise in overall
sovereign indebtedness following the global financial crisis of 2008.
Conclusions cannot be directly drawn from the immediate comparison of the two surveys. The 2007
survey had found a positive correlation between either country income level or the level of
indebtedness, and having a debt management strategy in place. The 2013 survey did not find the first
correlation of country income level, but did find the second correlation of the level of indebtedness. In
terms of transparency, while in 2007 no consistent pattern was evident with respect to the transparency
of debt management strategies, recent results showed a negative correlation between transparency and
level of income and a slightly positive correlation between transparency and the level of indebtedness.
In terms of regions, ECA appeared in 2007 as the most strategy-rich WB region, a position achieved by
EAP in 2013, but with ECA still ranking second. However, one cannot look into the general results of the
two surveys and extract conclusions because results can be driven by the differences in the sample.
To make a finding on the evolution of public debt management practices relatively to the 2007 survey,
the same set of countries has to be analyzed. The common sample of the 2007 and 2013 surveys
includes 81 countries, of which 46 are MICs and 35 are HICs (Figure 11); no LICs appear in the common
sample given that they were not included in the 2007 survey. The analysis of the common sample can be
used to compare how that set of countries evolved in terms of debt management practices.

20
Figure 11. Common sample of the two surveys (81 countries)
The composition of the common sample is a reflection of country participation in both surveys. The
common sample has a higher share of HICs compared to the individual samples of 2007 and 2013. This is
a consequence of HICs presenting a higher rate of response in both surveys. The same applies to the
breakdown by WB region, where LAC and ECA had more countries answering both surveys. So, in a way,
the results here are biased through the more participative countries17.
Restricting the analysis to the common sample makes the analysis by region less informative. The
common sample has 81 countries, but 35 of those are HICs. Therefore, the analysis by region becomes
restricted to 46 countries and after dividing the countries according to the regions they belong to, some
regions end up with only a few countries. This makes general conclusions less informative and, because
of that, we won’t explore these results.
Even using the common sample, direct comparison of the existence of a debt management strategy is
not straightforward. The share of countries that had a strategy in place in 2013 was 59%, therefore
lower than the 69% observed in 2007 (Figure 12). However, in the 2013 survey we made it clear what
we mean by a formal debt management strategy – a document that defines how the composition of
public debt will develop over the medium term, and which officials are obliged to implement unless the
strategy document is amended at the same level of approval as the original. As stated before, although
this clarification should have improved the accuracy of the new survey, it also made it more challenging
to compare the 2013 results with the 2007 results. Furthermore, the 2007 survey adopted an
assumption that if a country used one strategic benchmark, it had a debt management strategy in place,
an assumption that was not used in the 2013 survey. The use of these additional clarifications and
assumptions in the 2013 survey resulted in stricter eligibility criteria for classifying a country as having a
debt management strategy in place than was used in 2007. Thus, the lower share might not mean a
worsening of the situation, but a consequence of the stricter definition.
The strongest reduction is observed in HICs. In line with the previous explanation, this might not mean
that these countries had strategies before and now they don’t, but only that the strategies they have
17
One could argue that the willingness to participate in the survey is positively correlated to the degree of development of the DMO (more developed DMOs are more active both in implementing sound practices and in willing to participate in such initiatives as this survey).
High income (H), 43.2%
Upper middle income (UM),
44.4%
Lower middle income (LM),
12.3%
EAP, 11%
ECA, 26%
LAC, 38%
MENA, 13%
AFR, 13%

21
might not comply with the criteria established for 2013. This could especially be a result of both the
2007 survey relying on other sources than direct answers (such as websites, country economists and so
forth), and the assumption made in 2007 that if the country had any kind of a strategic benchmark it
was considered to have a strategy in place.
Figure 12. Existence of a debt management strategy across the common sample
Transparency of the debt management strategy remained stable across the common sample, although
with different movements across income levels. For the total common sample, transparency was at
similar levels on both surveys (Figure 13). However, the stability of the average hides the fact that the
MICs (LMICs especially) increased the transparency of the strategy, while HICs decreased it.
Figure 13. Transparency of the debt management strategy across the common sample
There was a substantial increase in the use of strategic targets. Overall, looking at the common sample,
77% of countries expressed their strategies in terms of some kind of strategic targets in 2013 compared
to 46% in 2007 (Figure 14). This trend was observed across all income levels, although even more
strongly for MICs. Furthermore, the increase was observed for every type of strategic target (indicators
for refinancing risk, interest-rate risk, and currency risk). It is interesting to observe that although the
use of strategic targets increased for all types of risk from 2007 to 2013, the most notable increase was
on the use of refinancing risk targets. This might be a consequence of the global financial crises that put
financial pressure on many governments and made more explicit the need to manage refinancing risk.
0%
10%
20%
30%
40%
50%
60%
70%
80%
90%
All Lower middleincome (LM)
Upper middleincome (UM)
High income (H)
2007
2013
0%
10%
20%
30%
40%
50%
60%
70%
80%
90%
100%
All Lower middleincome (LM)
Upper middleincome (UM)
High income (H)
2007
2013

22
Figure 14. Use of strategic targets across the common sample
9. Final Considerations and Policy Implications
The findings presented in this paper can be the subject of further investigation of a number of issues.
The survey resulted in a variety of interesting results, whose richness can be further explored in specific
studies. The findings represent the answers directly collected from 117 countries.
Findings can be summarized in a number of different ways. Results were presented before being
organized according to their respective topics (transparency, governance, and so forth). Although this
approach is useful to get a view on what is the current practice in each subject, it may be difficult to get
a comprehensive view on what the practices are in different WB regions or according to income level.
Therefore, although it may be a bit repetitive, we decided to reorganize the findings and present them
here in relation to four questions: (i) What are the main general findings of the recent survey; (ii) What
can we say looking at the breakdown by income levels; (iii) What can we say for each WB region; and (iv)
What can we say by comparing the results with the 2007 survey.
What are the main general findings?
1. There is still a relevant share of countries without a formal debt management strategy in
place. If the good news is that 60% of countries have a formal debt strategy, the bad news is
that 40% - 50 countries - don’t have one in the considered sample of 117 countries.
2. Overall, for the countries that have a strategy in place, transparency is good. Where a country
has a debt management strategy, most likely it is public (77% of the cases). The good
transparency holds across income levels and for most of the WB regions.
3. Transparency of the strategy shows a negative correlation with the level of income and a
positive correlation with the level of indebtedness. This might be a consequence of greater
demand of information from lower income countries or more indebted countries.
4. Quantitative analysis is not strictly necessary to develop a debt management strategy. Not
having an analytical tool is not an impediment for developing a strategy. 29% of countries don’t
carry out quantitative analysis even they though develop and publish a debt strategy.
5. Most countries express their strategies using strategic targets. 76% of countries having
strategies in place use strategic targets for currency, refinancing or interest rate risk.
0%
10%
20%
30%
40%
50%
60%
70%
80%
90%
All Lower middleincome (LM)
Upper middleincome (UM)
High income (H)
2007
2013
0%
10%
20%
30%
40%
50%
60%
70%
80%
90%
100%
Refinancing Interest rate Currency
2007
2013

23
6. Use of stochastic models is high. Considering only the countries in which the debt strategy is
supported by quantitative analysis, most of them (around 65%) use stochastic modelling.
Actually, around 28% use both deterministic and stochastic analysis, and 37% use only
stochastic analysis. It is interesting that the same share of countries – 37% - use only
deterministic analysis.
7. In almost all the cases, the strategy is approved by high-level authorities. Only in 3% of the
cases was the strategy not formally approved by high-level authorities. In general, the Minister
of Finance or the Cabinet are the authorities in charge of such approval.
8. However, in more than half of the countries (64%), debt management legal framework does
not support the strategy development.
What can we say by looking at the breakdown by income levels?
1. With regard to the existence and transparency of the debt management strategy, LICs perform
well when compared to MICs and HICs. Although the set of LICs participating in the strategy is
relatively small compared to the total sample (12 out of a total of 117), they perform well when
compared to the other income groups. 58% of LICs have a debt management strategy in place
(compared to the total average of 60%), and 100% of those who have a strategy publish it
(compared to the total average of 77%).
2. However, LICs deploy less quantitative analysis to develop the strategy and use less strategic
targets. In the case of LICs, 43% of the strategies are not supported by quantitative analysis,
compared to 29% in the total sample. Besides that, LICs also rely less frequently (57%) on
strategic targets than the average of the total set of countries (75%). This lack of use of strategic
targets by LICs might be a direct consequence of having less flexibility to choose the financial
characteristics of new debt such as more rigid financial sources.
3. Overall, there is a clear positive correlation between income level and the use of quantitative
analysis. While 57% of LICs deploy quantitative analysis to support the strategy development,
this number is 63% for LMICs, 76% for UMICs, and 80% for HICs. If on the one hand it might
signal that in many cases LICs lack institutional capacity to engage in quantitative analysis, on
the other hand the good news is that it hasn’t prevented them from having and publishing a
debt management strategy.
4. Regarding the use of strategic targets, currency risk seems more important for UMICs. UMICs
are the ones who most use currency risk targets to express their strategy. Having in mind that
the big emerging markets are among this group, this seems compatible with the fact that they
are not able to totally finance their needs in domestic currency, as is the case in most developed
countries, but they are not as limited as LICs or LMICs, that generally have fewer choices to
make.
5. On the other hand, HICs are more focused on targets for refinancing and interest rate risk.
6. With regard to the adoption of the strategy by primary legislation, LMICs stand out. 76% of
LMICs declared that their strategy document is adopted by primary legislation, compared to
only 29% for LICs and HICs and 33% for UMICs. The factors that could explain this discrepancy

24
are not clear and this is worthy of further investigation. LMICs also exhibit a higher prevalence
of approvals by the Cabinet, compared to other countries, which is consistent with a better
governance structure.
What can we say for each WB region?
1. LAC is an interesting case. Participation in the survey was high (21 countries participated). The
region falls behind the average regarding the existence of a debt management strategy (only
38% compared to 60% overall), but transparency of the strategy is excellent (100% versus 77%
overall). The countries that do have a strategy seem sophisticated (in the sense of using
quantitative models, including stochastic analysis);
2. ECA highlights a good share of countries with strategies in place, good transparency, and good
governance. 82% of ECA participants have debt management strategies in place, (compared to
the overall average of 60%), and 89% of the strategies are published (compared to an overall
average of 77%). The region is also a bit ahead in terms of having primary legislation adopting
the strategy development (50% compared to the average of 40%).
3. EAP has similar strengths to ECA. A high share of countries in the region has formal debt
strategies (82%), and most of them are published (89%). EAP is also the region with the most
targets for refinancing risk (80% compared to an average of 64%). The region also stands out on
having primary legislation supporting the strategy design (almost 80% against an average of
40%).
4. SAR exhibits some contradictory results. It is the region with least transparency (only 33% of
the countries publish the strategy), although in 100% of the cases the strategies are approved by
the Minister of Finance. Additionally, 100% of the strategies are expressed in terms of strategic
targets, although it’s the region that makes the least use of quantitative analysis. These
somewhat contradictory results should be seen in light of the very small sample of participating
countries in the region (5 in total, 3 with debt management strategies).
5. MENA is also represented by a small number of countries. Similar to SAR, MENA has only 7
participating countries, 4 of which have debt strategies in place; so aggregate results for the
region might not be very informative. The analyzed countries present poor transparency and
governance (countries where the strategy is not approved by high-level authorities). On the
other hand, the countries rely on quantitative analysis, being the region with the highest use of
currency risk targets.
6. AFR is consistently around the overall average. In all surveyed aspects, AFR is always close to
the overall average, not standing out on either the positive or negative sides. It is the region
most represented in the total sample, with 23 participating countries (so the overall average is
also highly influenced by the results of the region).
What can we say by comparing the results with the 2007 survey?
1. Numbers show that fewer countries have a debt management strategy in place, but the
methodological difference between the two surveys could be the reason for it. Because the

25
recent 2013 survey had stronger criteria relating to this question, this result might be
misleading18.
2. Transparency of the debt management strategy remained stable, although with different
movements across income levels. Transparency was similar on average, but MICs increased the
transparency while HICS decreased it.
3. There was a remarkable increase in the use of strategic targets. 77% of countries expressed
their strategies with some kind of strategic targets in 2013 compared to 46% in 2007.
4. The most notable increase was in the use of refinancing risk targets. This might be a
consequence of the global financial crises of 2008 that made more explicit the need to manage
refinancing risk.
Analysis of the results of these surveys could help all stakeholders have a better understanding of
international practice regarding debt management strategy development. For the debt managers, it is
an opportunity to learn more about international practice on debt strategy development, and to
benchmark themselves against their peers, identifying strengths and challenges ahead. For the World
Bank and other providers of technical assistance, it might provide valuable information about results
achieved, and facilitate planning for future work.
Results indicate that, in general, countries still need to considerably strengthen their debt
management practices regarding a debt strategy. Policy makers as well as technical assistance
providers should be aware that only a few countries show best practices in all topics regarding the debt
strategy. Only 18 out of the 117 countries surveyed answered positively to all questions, that is they
have a formal strategy that is public, grounded on quantitative analysis, expressed through strategic
targets, approved by high-level authorities, and adopted by primary legislation. If we start from the total
sample and begin eliminating countries that don’t comply with each requirement, we get the following
picture19:
Figure 15. Number of countries complying simultaneously with each requirement
Even considering only the existence of a formal strategy, there is room for improvement. Because the
public debt portfolio is usually the most important liability for the country, and because its management
can directly impact the resilience of countries to financial shocks and the risks for the budget, one would
18
A fact that supports this thesis is that a few countries declared that they have strategic targets but at the same time they declared that they don’t have a formal debt management strategy. According to the 2007 methodology, these countries would be considered as having strategies just because they use strategic targets. 19
Of course, it does not mean, for example, that only 18 countries have the strategy supported by primary legislation (which includes 31 countries), but here we are counting only those countries that satisfy all criteria at the same time.
Total sample: 117
Have a formal
strategy: 70
The strategy is public: 54
Use strategic targets: 41
based on quantitative analysis: 30
approved by high-level
author.: 29
Adopted by primary
legislation: 18

26
expect more countries to act strategically to deal with their public debt management. Nevertheless, 40%
of the surveyed countries do not have a formal strategy steering their debt management.
The use of quantitative analysis also deserves special attention. It is true that the absence of
quantitative analysis does not impede the development of a debt management strategy, and that it’s
better to have a strategy in place even if it’s not grounded on quantitative analysis. However, it is also
true that the dynamics of public debt is not trivial and that the debt portfolio composition achieved at
the end of a certain period will depend on a number of redemptions and issuances of potentially very
different debt instruments (loans and securities of different tenors, in different currencies, linked to
different interest-rates, and so forth). In this context, risk management can be significantly enhanced by
being supported by quantitative analysis. Furthermore, results indicate that the use of quantitative
analysis is positively correlated with income level, signaling a need to further support capacity-building
in the lower-income countries.
The type of quantitative analysis might also be a topic for further investigation and discussion. A
surprisingly high number of countries (65% of those which use quantitative analysis) deploy stochastic
analysis, and actually in 37% of them, it is the only type of analysis carried out. This should not be read
as an indication that stochastic analysis is better than deterministic analysis. On the contrary, especially
for countries starting to work on quantitative tools, deterministic analysis should be the first step. Even
the more sophisticated debt offices should not abandon the more simple deterministic analysis
(scenario analysis) because stochastic models might introduce challenges for implementation that could
offset their benefits.
The survey also suggests greater focus on strengthening the legal framework for debt management.
Although a formal strategy might be in place and might have been approved by high-level authorities, in
56% of the cases the legal framework (primary legislation) doesn’t support its development. This is true
across income levels and WB regions, with the exception of the subsets of LMICs and EAP, which are
outliers. This suggests greater focus on improving the legal framework of future work.
Of course, one must keep in mind the limitations of the survey results. In some cases, the very small
size of the sample group might make the aggregate results appear meaningless. In other cases,
participation might be high, but huge differences might coexist within a region or income group. Finally,
the results are not based on direct observation, but on responses from country authorities.

27
10. References
Melecky, M. (2007). A Cross-Country Analysis of Public Debt Management Strategies. Policy Research
Working Paper 4287, The World Bank.
International Monetary Fund (2014). Fiscal Transparency Code,
http://www.imf.org/external/np/fad/trans/ .
World Bank, The (2009). Debt Management Performance Assessment (DeMPA) Tool,
http://siteresources.worldbank.org/INTDEBTDEPT/Resources/468980-1184253591417/GDM-PMF.pdf .
World Bank, The (2009). Developing a Medium-Term Debt Management Strategy (MTDS) – Guidance
Note for Country Authorities, http://go.worldbank.org/T7SB6VFEL0 .
World Bank and International Monetary Fund, The (2014). Revised Guidelines for Public Debt
Management,
http://treasury.worldbank.org/documents/RevisedGuidelinesforPublicDebtManagement_2014_English.
pdf .
28
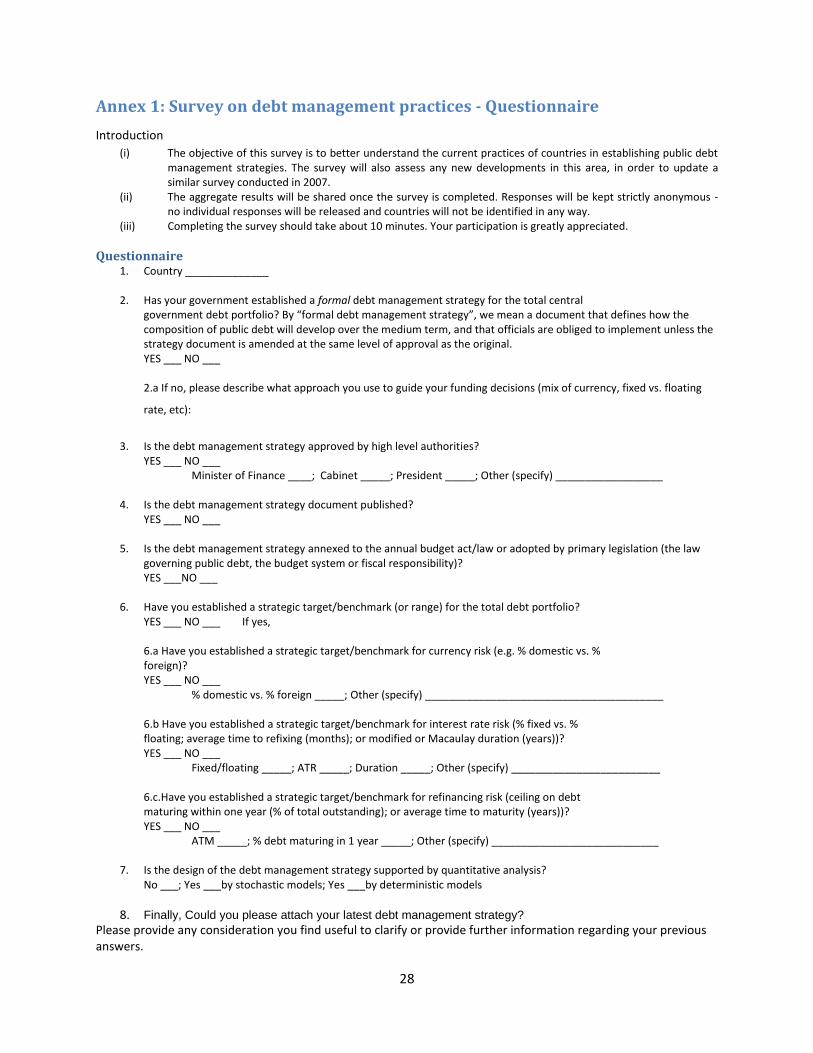
Annex 1: Survey on debt management practices - Questionnaire
Introduction
(i) The objective of this survey is to better understand the current practices of countries in establishing public debt management strategies. The survey will also assess any new developments in this area, in order to update a similar survey conducted in 2007.
(ii) The aggregate results will be shared once the survey is completed. Responses will be kept strictly anonymous - no individual responses will be released and countries will not be identified in any way.
(iii) Completing the survey should take about 10 minutes. Your participation is greatly appreciated.
Questionnaire 1. Country ______________
2. Has your government established a formal debt management strategy for the total central
government debt portfolio? By “formal debt management strategy”, we mean a document that defines how the composition of public debt will develop over the medium term, and that officials are obliged to implement unless the strategy document is amended at the same level of approval as the original. YES ___ NO ___ 2.a If no, please describe what approach you use to guide your funding decisions (mix of currency, fixed vs. floating
rate, etc):
3. Is the debt management strategy approved by high level authorities?
YES ___ NO ___ Minister of Finance ____; Cabinet _____; President _____; Other (specify) __________________
4. Is the debt management strategy document published? YES ___ NO ___
5. Is the debt management strategy annexed to the annual budget act/law or adopted by primary legislation (the law governing public debt, the budget system or fiscal responsibility)? YES ___NO ___
6. Have you established a strategic target/benchmark (or range) for the total debt portfolio?
YES ___ NO ___ If yes, 6.a Have you established a strategic target/benchmark for currency risk (e.g. % domestic vs. % foreign)? YES ___ NO ___ % domestic vs. % foreign _____; Other (specify) ________________________________________ 6.b Have you established a strategic target/benchmark for interest rate risk (% fixed vs. % floating; average time to refixing (months); or modified or Macaulay duration (years))? YES ___ NO ___
Fixed/floating _____; ATR _____; Duration _____; Other (specify) _________________________
6.c.Have you established a strategic target/benchmark for refinancing risk (ceiling on debt maturing within one year (% of total outstanding); or average time to maturity (years))? YES ___ NO ___
ATM _____; % debt maturing in 1 year _____; Other (specify) ____________________________
7. Is the design of the debt management strategy supported by quantitative analysis? No ___; Yes ___by stochastic models; Yes ___by deterministic models
8. Finally, Could you please attach your latest debt management strategy? Please provide any consideration you find useful to clarify or provide further information regarding your previous answers.

29
Annex 2: List of participating countries
Albania
Angola
Antigua and Barbuda
Argentina
Armenia
Australia
Austria
Azerbaijan
Bangladesh
Belarus
Belgium
Bhutan
Bolivia
Botswana
Brazil
Bulgaria
Burkina Faso
Cambodia
Cameroon
Canada
Cabo Verde
Chile
China
Colombia
Comoros
Congo, Dem. Rep.
Congo, Rep.
Costa Rica
Cyprus
Czech Republic
Denmark
Djibouti
Dominica
Egypt, Arab Rep.
El Salvador
Estonia
Ethiopia
Fiji
Finland
France
Gabon
Gambia, The
Georgia
Germany
Greece
Grenada
Guatemala
Guyana
Honduras
Hungary
Iceland
India
Indonesia
Iraq
Ireland
Israel
Italy
Jamaica
Japan
Jordan
Kazakhstan
Kenya
Latvia
Lebanon
Lesotho
Lithuania
Luxembourg
Macedonia, FYR
Malawi
Malaysia
Mali
Mauritius
Mexico
Moldova
Mongolia
Montenegro
Morocco
Mozambique
Namibia
Netherlands
New Zealand
Nicaragua
Norway
Pakistan
Panama
Papua New Guinea
Paraguay
Peru
Philippines
Poland
Portugal
Romania
Russian Federation
Samoa
Senegal
Serbia
Singapore
Slovak Republic
Slovenia
South Africa
Sri Lanka
St. Kitts and Nevis
St. Lucia
St. Vincent and the Grenadines
Sudan
Suriname
Swaziland
Sweden
Switzerland
Tanzania
Timor-Leste
Trinidad and Tobago
Tunisia
Turkey
United Kingdom
Uruguay
Vietnam