how successful has payment for … · i how successful has payment for environmental services...
TRANSCRIPT

i
HOW SUCCESSFUL HAS PAYMENT FOR ENVIRONMENTAL SERVICES IMPROVED WELFARE?
The Case of Uluguru Mountain –Morogoro
Innocensia John
M.A (Economics) Dissertation
University of Dar es Salaam
October, 2012

i
CERTIFICATION
The undersigned certifies that they have read and hereby recommends for acceptance by the
university of Dar es Salaam a dissertation entitled “How Successefully Has Payment for
Environmental Services Improved Welfare? (Case Of Uluguru Mountain –Morogoro)”
in partial fulfillment of the requirements for the degree of Master of Arts (Economics) of
the University of Dar es Salaam.
………………………………………………………………
Dr. Razack Lokina
(Supervisor)
Date………………………………………
…………………………………………………………………..
Dr. Godius Khayrara
(Supervisor)
Date………………………………………

ii
DECLARATION
AND
COPYRIGHT
I, John Innocensia, declare that this dissertation is my original work and that it has not
been presented and will not be presented to any other University for a similar or any
other degree award.
Signature…………………………………………………..
©This dissertation is copyright material protected under the Berne Convention, the
Copyright Act of 1999 and other international and national enactments, in that behalf, on
intellectual property. It may not be reproduced by any means, in full or part, except for
short extracts in fair dealing, for research or private study, critical scholarly review or
discourse with an acknowledgement, without the written permission of the School of
Graduate Studies on behalf of both the author and the University of Dar es Salaam.

iii
ACKNOWLEDGEMENT
I am grateful to God for His guidance and protection in the course of this dissertation
writing as well as throughout the whole period of my study. I am also thankful to the
University of Dar es Salaam administration for hosting my studies for two years. I would
like to acknowledge the financial support of UDSM-Sida program, the Environment for
Development Tanzania (EFDT) and the AERC for financial support throughout my study.
My deepest thanks and appreciation goes to my supervisors Dr. R.B Lokina and Dr. G.
Kahyrara for their assistance and encouragement which made it possible for me to improve
and complete this dissertation. I thank Mr. Lopa from CARE who gave me valuable inputs
and support during my field work. I am also, thankful to the entire staff of the Economics
Department, University of Dar es Salaam for their hard work in teaching as well as guiding
me academically during the course of my study.
More so, I would like to thank in a special way my family members: my Father John, my
Mother Theresia, my sister Glory, my brothers Martin and Francis for always being there
for me all the way through the course of my studies. I also wish to thank my classmates –
M.A Economics Class of 2012 – and my friends Nelly, Pauline and Mengele for their
academic and spiritual support during the whole time of my study.

iv
DEDICATION
I dedicate this dissertation to my parents, Mr. John Festo and Mrs. Theresia Anthony for
their love, prayers, support and guidance throughout my life endeavors. They have always
been my inspiration.

v
ABSTRACT
This study was carried out to find out the impact of PES on the welfare of the communities
in the Uluguru Mountains. The objective is to assess PES project which aims at conserving
the environment (forest) and reducing poverty level. The assessment of the project is done
by looking at the difference between the treatment group (those who participate in PES)
and control group (households who do not participate).
The study employed a combination of questionnaire and field observation to collect
primary data in combination with a detailed review of literature. In analyzing the
information collected the study utilized Propensity Score Matching (PSM), Descriptive
statistics, Perception and Logistic analysis. In all methods of analysis it has been found that
the project has impact on poverty reduction as revealed by the difference in poverty
status/socioeconomic status between the treatment and control group.

vi
TABLE CONTENTS Certification .................................................................................................................................. i
Declaration And Copyright ........................................................................................................... iii
Acknowledgement ....................................................................................................................... iii
Dedication ................................................................................................................................... iv
Abstract ....................................................................................................................................... v
Table Contents ............................................................................................................................. vi
List of Tables ................................................................................................................................ x
List of Firuges ............................................................................................................................. xi
CHAPTER ONE: INTRODUCTION………………...………………………………………1
1.1 Background Information ....................................................................................................... 1
1.2 Problem Statement ................................................................................................................ 3
1.3 Research questions ................................................................................................................ 3
1.4 Objectives of the Study ......................................................................................................... 4
1.5 Significance of the Study ...................................................................................................... 4
1.6 Scope of the Study ................................................................................................................ 5
CHAPTER TWO: AN OVERVIEW OF FORESTRY IN TANZANIA…………………….6
2.1 Introduction .......................................................................................................................... 6
2.2 Forestry in Tanzania .............................................................................................................. 6

vii
2.2.1 The Forest Policy 1998 and Forest Act 2002 in Tanzania ................................................. 11
2.3 Overview of Forestry in Morogoro ........................................ Error! Bookmark not defined.
2.3.1 Economic Profile of Morogoro ......................................................................................... 14
2.3.1.1 Health ........................................................................................................................... 14
2.3.1.2 Education ...................................................................................................................... 15
2.3.1.3 Housing and Assets Ownership ..................................................................................... 16
2.4 Forest Sector in Uluguru Mountains .................................................................................... 18
2.4.1 Interactions of Uluguru Communities with Forest Conservation ....................................... 23
CHAPTER THREE: LITERATURE REVIEW……………………………………………..27
3.1 Introduction ........................................................................................................................ 27
3.2 Theoretical literature ........................................................................................................... 27
3.2.1 Poverty ............................................................................................................................. 27
3.3 Empirical literature ............................................................................................................. 31
CHAPTER FOUR : METHODOLOGY……………………………………………………...36
4.1 Sampling strategy ................................................................................................................ 36
4.1.1 Sample Size and Composition .......................................................................................... 36
4.1.2 Primary Data .................................................................................................................... 37
4.1.3 Secondary data ................................................................................................................. 38

viii
4.1.4 Field Observations ......................................................................................................... 388
4.2 Propensity Score Matching .................................................................................................. 39
CHAPTER FIVE : MAJOR FINDINGS AND INTERPRETATION…………..…………..45
5.1 Introduction ........................................................................................................................ 45
5.2 Descriptive Analysis ........................................................................................................... 45
5.3 Quantitative Results ............................................................................................................ 48
5.3.1 Social Economics and Livelihood Data ............................................................................ 48
5.3.2 Housing and asset ............................................................................................................. 48
5.3. 3 Food Security .................................................................................................................. 51
5.3.3.1 Meals per Day ............................................................................................................... 51
5.3.4 Consumption Patterns....................................................................................................... 53
5.3.5 Crop information .............................................................................................................. 54
5.3.6.1 Standard of Living Before and After Year 2008............................................................. 55
5.3.6.2 Comparison of the Household’s Standard of Living with Others in the Community ....... 56
5.4 Construction of Wealth Index (WI) and Comparison of Poverty .......................................... 59
5.5 Econometrics Model ........................................................................................................... 61
5.5.1 Propensity score matching results ..................................................................................... 61
5.5.2 Diagnostic Tests and Model Validation Results ................................................................ 61
5.6 Perception on Welfare as result of PES ............................................................................... 66
5.7 Household Perception on Forest Size and Biodiversity…………….…………….……….....69

ix
5.8 Chapter summary……………………………………….……………………………………73
CHAPTER SIX : CONCLUSIONS AND RECOMMENDATION…………..……………..75
6.1 Introduction ........................................................................................................................ 75
6.2 Main Conclusions ............................................................................................................... 75
6.3 Recommendations and Agenda for Future/Further Research ............................................... 77
REFERENCES ....................................................................................................................... 79
APENDIX……………………………………………………….....……………………………87

x
LIST OF TABLES
Table 2.1: Type of Floor Material of the Main Building by Households in the Regi…...…18
Table 2.2: Demography of the villages involved in the implementation of PES in
conserving the Uluguru forest……...………………………………………………………26
Table 3.1: Poverty Incidence since 1991………………………...……..……………….…28
Table 4.1: Sample Composition…...……………………………………………………….36
Table 5.1: Overview of surveyed villages………………………………………………….45
Table 5.1: Summary of descriptive Statistics of the variables used in the analysis……….46
Table 5.3: Consumption Patterns Table 5.4: Household Wealth Categories………………52
Table 5.4 Household Wealth Categories…………………………………………………..58
Table 5.5: ANOVA Results for Project Impact....................................................................59
Table 5.6.1: Logistic Regressions Estimates for Participation in PES……………………60
Table 5.6.2: Inferior bound, the number of treated and controls for each block…………..62
Table 5.6.3: Bootstrap statistics……………………………………………………………62
Table 5.6.4: ATT estimation with the Kernel Matching method……………………..…..63
Table 5.6.5: Matching estimator: Average Treatment for the Treated (ATT)……………..63
Table 5.7: Results of Marginal effects after MNP for welfare ……………………………64
Table 5.8: Marginal Effects of Probit Regression Results on perception of the forest size..66
Table 5.9: Marginal Effects of Probit Regression Results on perception of biodiversity…68

xi
LIST OF FIRUGES
Figure 2.1: Growth in National Income from forest economic activities…………………..8
Figure 1.2: Detailed villages adjacent to UNR …………………………………….….….21
Figure 5.1.1: Building Materials for the Walls of Household’s Main Dwelling..................48
Figure 5.1.2: Property Owned By Household......................................................................48
Figure 5.1.3: Asset Ownership Before and After Introduction of PES…………………...49
Figure 5.2: Meals per Day among participating and non participating group ....……….…50
Figure 5.3: Meals per Day before and after PES (in percentages)…………………….…...51
Figure 5.4: Share of crops harvested before and after PES…………..………….....………53
Figure 5.5: Standard of Living before and After Year 2008……………………………….55
Figure 5.6: Comparison of the Household’s Standard of Living with Others in the
Community ……………………………………………………………….………………..55
Figure 5.7.1: Size of the forest after the introduction of PES program……………………56
Figure 5.7.2: Biodiversity in the forest after the introduction of PES program……...…....57
Figure 5.7.3: Perception on the size of the forest before the introduction of PES
program……………………………………………………………………………………57
Figure 5.8: Poverty level between the participating and non-participating group………...58

xii
LIST OF ABBREVIATION AND ACRONYMS
ATT Average impact of treatment on the treated
CARE The humanitarian organization fighting global poverty
CBFM Community-based Forest Management
CIA Conditional Independence Assumption
CMEAMF Conservation and Management of Eastern Arc Mountain Forests
EPWS Equitable Payment for Watershed Services
GDP Gross Domestic Product
JFM Joint Forest Management
LLM Local Linear Matching
MACEMP Marine and Coastal Environment Management Project
MNRT Ministry of Natural Resources and Tourism
NFP National Forestry Policy
NN Nearest-Neighbor
NTFP Non-Timber Forest Products
PCA Principal Component Analysis
PES Payment for Environmental Services
PFM Participatory Forest Management
PSM Propensity Score Matching
REDD Reducing Emissions from Deforestation and Forest Degradation
TFP Timber Forest Products
UMADEP Uluguru Mountains Agricultural Development Project

xiii
UNR Uluguru Nature Reserve
VLFR Village Land Forest Reserves
WWF World Wide Fund

1
CHAPTER ONE
INTRODUCTION
1.1 Background Information
Payments for ecosystem services are an innovative approach which allows integrated
solution to natural resource management. It is a new framework which is growing in
popularity in many developing countries as a means of financing environmental and
resources conservation, thus trying to jointly address poverty alleviation and sustainable
management of natural resources (Landell-Mills and Porras, 2002). In practice the approach
relies on contractual systems which include transfers (financial) between beneficiaries (for
example users of a water supply system) and providers (managers of ecosystems for
example forestry upstream of a watershed, farmers). Those payments systems tend to
reduce negative externalities (contaminations, resources overexploitation) and to help
positive externalities (hydro-systems regulation, habitat function of wet zones). (Lokina and
Kahyarara 2009).
Many Payments for ecosystem services (PES) schemes were initially designed as means of
financing natural resource management, with potential livelihood considerations added
later. A major concern is that the poor will actually become worse off due to a PES scheme,
for example as buyers of a service that was previously free. There is also the danger that the
poorest and most marginalized will become further marginalized if they cannot participate
effectively in the scheme, for example as buyers of a service that was previously free. Thus,

2
this study is intended to expand our understanding on how the poor will be affected as the
PES approach grows. It has assumed that PES will contribute to poverty reduction by
making payments to poor land users
In Tanzania, this sort of approach exists in the Ruvu River upper catchments in the Uluguru
Mountains. It was initiated by WWF and CARE in 2006 but its actual implementation
started in 2008 and proceeded till 2012. For example, the global carbon markets may
provide a mechanism to pay the Tanzanian government to protect or expand the forest area.
WWF developed a new, holistic PES approach that explicitly aimed to balance poverty
reduction with conservation. PES is seen as one financing mechanism for conservation that,
in the appropriate circumstances, will deliver both sustainable natural resource management
and improved livelihood security for the rural poor.
The WWF seeks to promote the integration of environmental sustainability and social
equity into economic development, the initiative within the program is focusing on how to
scale-up current PES scheme so that they deliver substantial and long lasting conservation
while alleviating rural poverty by giving special attention to increasing the participation of
the rural poor in PES schemes. The participation of communities in a payment for
ecosystem services scheme is essential for success and sustainability. This participation
should go far beyond solely receiving the benefits from the transaction. For a payment for
ecosystem services transaction to be successful, it is necessary that rural community
members actively participate from the beginning of project identification and design
(Vonada.et al., 2011).

3
However, poverty reduction and environmental sustainability through community
participation are not always complementary. Without careful design, the poor are likely not
to benefit from a PES scheme (see Wunder, 2005) and there is a danger that part of the
poverty reduction will be met by unsustainable exploitation of natural capital. Equitable
Payment for Watershed Services (EPWS) under WWF and CARE addresses this for the
communities of Uluguru Mountains (especially KibungoJuu ward) by improving the
welfare of the people, that is, poverty reduction and environmental management
1.2 Problem Statement
The PES programme’s effectiveness depends heavily on the voluntary participation of
landowners in order for its objective of conservation as well as poverty reduction level of
the communities to be achieved. Since PES main aim is to conserve the environment in the
Uluguru Mountains but little has been done to capture the role of PES in addressing the
poverty level among the community involved in the conservation. This shows that there has
not been clear cut evidence if participation of the communities in the Uluguru forest under
PES has helped to reduce poverty and if the forest cover has increased. Therefore this study
aimed at establishing the impact on welfare as well as improved forest cover as a result of
PES.

4
1.3 Objectives of the Study
The main objective of the study is to evaluate the impact of PES on poverty reduction for
the participating communities and increase of forest cover in the Uluguru forest areas
where ecosystem services are often richest.
To accomplish this, the research will attempt to address the following specific objectives:
(i) Examine the impact of PES on the welfare of the communities in Uluguru.
(ii) Identify significant differences in poverty level between people who participate in
PES and those who do not participate in the program
(iii) Examine the improvement in forest cover since the implementation of PES
program
1.4 Research questions
In light of the discussion, the study poses the following analytical questions;
Does PES have any impact on the welfare of the communities in Uluguru?
Are there any significant differences in poverty level between people who
participate in PES and those who do not participate in the program?
Is there any improvement in forest cover since the implementation of PES program?
1.5 Significance of the Study
This study will add to the existing few literatures of PES on the effectiveness of the
program in alleviating poverty for the participating community and knowing the situation

5
of the forest in the Uluguru catchment forest. It will also be the opening door for more
literature in trying to assess the effectiveness of the program not only in the poverty
alleviation but also will give grounds for other researchers in trying to assess the
environmental conservation level reached through community involvement. Finally, even
though it’s academic it has policy relevance and it adds to the existing stock of knowledge
on the environmental and natural resource economics field.
1.6 Scope of the Study
The study area is the Uluguru Nature Reserve which is part of the Eastern Arc Mountains
(EAM), which run from Taita Hills in Southern Kenya to the Udzungwa Mountain in south
central Tanzania. The Ulugugru Nature Reserve (UNR) is located in the Eastern part of
Tanzania about 180 km from Dar es Salaam along the Dar es Salaam- Mbeya highway. The
UNR is accessible through Bunduki to Nyachiro, Bunduki to Vinile, Morogoro to Morning
site, Kola to Bigwa, Kinole to Tegetero, Matombo - Tawa to Nyingwa, Mvuha –
Bwakilajuu to Lusange, Kibaoni – Nyandira to Tchenzema roads.The UNR is surrounded
by 57 villages. The study will cover four villages namely Lanzi,Nyingwa,Kibungo and
Dimilo where PES activities have been implemented.

6
CHAPTER TWO
AN OVERVIEW OF FORESTRY IN TANZANIA
2.1 Introduction
This chapter provides an overview of forestry in Tanzania, draws down to forestry sector in
Morogoro and gives the state of the Uluguru nature reserve found in Morogoro. It goes
further by explaining the Interactions of Uluguru communities with forest conservation as
well as community involvement in conserving the forests in Tanzania and lastly gives a
discussion on the Forest Policy 1998 and Forest Act 2002 in Tanzania.
2.2 FORESTRY IN TANZANIA
Tanzania has a large land area (94.5 million hectares), with a tropical climate, 10
ecological zones with different physiographic zones and complex topography. About 38
percent of Tanzania’s total land area is covered by forests and woodlands that provide for
wildlife habitat, unique natural ecosystems and biological diversity, and water catchments
(Burgess, 2004). The forest total landmass, which is about 33.5 million hectares,
furthermore, the country’s forests contain such a high level of biologically diverse
resources that Tanzania is one of the richest countries in terms of biodiversity in the world
and among the 12 most diverse countries (FBDT 2006).Tanzania has Africa's largest
number of mammals all harbored by the country’s forests (MNRT 1998). The importance
of these ecosystem to the economy of Tanzania and to the community in general is that the
forests provide over 92 percent of the energy resources, support the development of other
important sectors (such as agriculture and tourism) through provision of water resources

7
and catchments, maintain hydrological balance and soil protection, recycle atmospheric
gases, provides construction materials, employment sources and other (URT 2005).
These forests are, however, faced with deforestation at a rate of between 130,000 and
500,000 hectares per year, which is a result of population pressure on agricultural
expansion, livestock grazing, wild fires, overexploitation, and unsustainable utilization of
wood resources and other human activities, mainly in the general lands (Tanzania 2001).
Conservation in Tanzania then started in 1963 with the aim of conserving the forests in
perpetuity for the present and future generations were powers are placed to foresters and
ignored the people/community leaving adjust to the forest cover areas.
Forests in Tanzania can be divided into two broad categories: reserved forests and non-
reserved forests. About 37 percent (12.5 million hectares) and 57 percent (19 million
hectares) of forests are reserved and Non-reserved, respectively (Tanzania 2002b).
Reserved forests include central and local government forest reserves, government-owned
industrial plantations, and village land forest reserves (VLFRs) at the community level that
have been gazetted by the central government. Unreserved forests are on “general” or
“village” lands where forests and woodlands are not formally classified as reserves
(Tanzania 2001).
The forestry sector has a very important role to play in Tanzania’s economy. Although in
absolute terms, its contribution to total gross domestic product (GDP) is low, it has
increased considerably during the past 10 years by about 35 per cent, from 2.6 to 3.4 per
cent of GDP. Furthermore the contribution of Forestry and hunting sub sector grew by 4.1

8
percent in 2010 compared to 3.4 percent in 2009 (Economic survey 2010). The sharp
change in the years 2004-2007 has not been investigated hence it is still unknown what
could have attributed the change but the mere growth was mainly attributed by improved
patrol with regard to harvesting, transportation and marketing of the forest products, and
increase in demand for forest products in the domestic market. Figure 1 shows the trend of
revenue from forestry and hunting activities from year 2000-2010.
Figure 2.1 : Growth in National Income (real GDP growth) from forest economic activities (2001) market prices
Source; National bureau of statistics

9
Government revenue from forestry grew by 46.6 billion in 2010 compared to 25.2 billion in
2009 which is equal to an increase of 85.1 percent, the increase was emanated from
strengthening patrols in harvesting, transport and markets; decline in timber imports from
neighboring countries; and increase in exports of forestry products i.e. increase in selling of
timber in Sao Hill (economic survey 2010). The contribution of the forestry and hunting
sub activity to GDP was 24.1 percent in 2010 compared to 24.6 in 2009. (National Bureau
of Statistics 2010).From the data it can be said that an increase in national income is one of
the indicators of improved livelihoods due to forest activities from timber and non timber
products.
However this growth of the sector and its contribution to the national income, grossly
underestimates the value of the forest sector to the national level (macro) and to the
community adjacent to the forest (micro level). The contribution and growth presented
above, it only covers the forest products with market prices, such as timber, logs etc. The
estimates largely exclude the NTFP and other ecosystem services provided by the forest.
For example in (Zahab,et.al,2004) showed that contribution of NTFP was about 287 million
which is 57 percent of the total contribution to the economy which is not taken into account
in GDP of which the rest is TFP.
The contribution of forests to local livelihoods and the Tanzanian national economy as a
whole is significant, but is largely unrecorded and consequently unrecognized. The
difficulty of examining forestry in the context of economic growth arises because no
markets exist for ecosystem services. Many transactions related to forest products and
services fall within the informal sector or are undertaken illegally and hence, not recorded.

10
Official gross domestic product (GDP) figures, on which the analysis of economic growth
is made, do not reflect the “true” economic importance of the forest sector to the national
economy (World Bank 2005). This “undervaluation” matters because the contribution to
GDP and its growth determines decisions made by the government of Tanzania, and also to
some degree its development partners, regarding the allocation of financial resources. For
example from the share of GDP from the forest sector in non-monetary terms is low
compared to the monetary, this shows that there is low account taken in the non-timber
products hence a need to value ecosystem services
Between 1990 and 2010, Tanzania lost an average of 403,350 ha or 0.97% per year. In
total, between 1990 and 2010, Tanzania lost 19.4% of its forest cover or around
8,067,000ha (TFI 2010). The loss was due to the increasing demand of forest goods for
agricultural expansion, livestock, other land users, that required to make reforms in the
conservation and management of forests in the 1990s. One of the introduced aspects on
forest management was Participatory Forest Management (PFM) concept which advocates
Community-based Forest Management (CBFM) and Joint Forest Management (JFM)
approaches. PFM reflects its varying degrees of involvement of local communities in the
management of forest resources. The recent approach of PFM however, also appears to
have some problems including lack of incentives for the participating communities
(Malimbwi, 2002, Kiss, 2004; Robinson and Lokina 2011). It is proposed by neo-market
natural resources economists that, new ways and institutional set-ups to supply for such
required incentives have to be developed (Winrock International, 2004). This implies that
for environmental services to be provided for by local actors, financial incentives have to

11
be made available by international, national/regional and local actors. Thus, it is expected
in the absence of any other incentive scheme, PES should be regarded as necessary for the
sustainability of the conservation measures. The PES initiatives are expected to
complement past forest reforms thereby contributing to generation of incentives for forest
management by PFM projects. Under PFM, local communities that are managing natural
forests by avoiding deforestation have to be compensated for their management efforts in
order to reinforce their commitment to conserving natural forests and, in turn, safeguard
their livelihoods.
2.2.1 The Forest Policy 1998 and Forest Act 2002 in Tanzania
Tanzania has experienced a number of policy reforms in recent years, and most of these
policies have stressed the need for community participation and involvement in
management of the environment and natural resources. The national forestry policy (NFP)
and the Forest Act 2002 will be reviewed.
In 1998, the government of Tanzania reviewed its 1953 forest policy and adapted the NFP
by focusing on sustainable conservation of forest resources, the new policy seek to achieve
its policy goal of “enhancing the contribution of the forest sector to the sustainable
development of Tanzania and the conservation and management of natural resources for the
benefit of present and future generations. The NFP contains a number of statements in
support of ecosystem conservation and management which promote community
involvement in conservation and management.

12
Involvement of communities and other stake holders in conservation and management is
encouraged through joint management agreements where biodiversity conservation and
management will be included in the management plans for all protection forest. Also
institution human resources is influenced by enhancing national capacity to manage and
develop the forest sector in collaboration with other stakeholders like in a way that local
communities will be encouraged to participate in forestry activities. This will ensure
ecosystem stability through conservation of biodiversity, water catchment, soil fertility,
sustainable supply of forest products and services by maintaining sufficient forest area
under effective management and enhanced national capacity to manage and develop the
forest sector in collaboration with other stakeholders this.
The Act supports Participatory Forest Management (PFM), is a strategy to achieve
sustainable forest management by encouraging the management or co-management of
forest and woodland resources by the communities living closest to the resources,
supported by a range of other stakeholders drawn from local government, civil society and
the private sector. To encourage and facilitate the active participation of the citizen in the
sustainable planning, management, use and conservation of forest resources through the
development of individual and community rights, whether derived from customary law or
under this Act, to use and manage forest resources. While recommending positively the
efforts by the government in conserving the forest sector through PFM, the sustainability of
these efforts can only be guaranteed if sufficient incentives are given to the villagers
adjacent to the forest. The schemes like PES and REDD+ are among the potential schemes

13
if appropriately implemented likely to ensure the sustainability of the conservation efforts
by the Government (Robinson and Lokina 2011).
The NFP aims to create an enabling environment for the development of the forestry sector
by decentralizing responsibilities for forest management to local communities and district
councils, separating the normative and service delivery functions of the GoT through the
establishment of an Executive Agency in the forest sector (Tanzania Forest Service),
commercializing or privatizing the management of the forest and promoting greater
involvement of the private sector and civil society in sustainable forest management.
2.3 OVERVIEW OF FORESTRY IN MOROGORO
Morogoro region has 47 Catchment Forest Reserves which are in four districts, Kilombero,
Kilosa, Ulanga and Morogoro. Many of the reserves cover mountainous areas under a high
rainfall and so are important catchments. The main mountain ranges are the: Uluguru and
Nguru in Morogoro District; Udzungwa in Kilombero District; Mahenge in Mahenge
District; and Ukaguru and Rubeho in Kilosa District (Lovett et.al, 2004).
In Kilosa district there are 10 Catchment Forest Reserves which are; Ikwamba, Mamboto,
Mamiwa-Kisara (North), South Mamiwa-Kisara, Uponera, Mamboya, Talagwe, Pala
Mountain, Ukwiva and Kihiliri. Ulanga District Catchment Office Administers Eight
Reserves, which are Mahenge Scarp, Nawenge, Mselezi, Myoe, Muhulu, Sali, Ligamba and
Nambiga. Morogoro District Catchment Office administers 22 reserves. Fifteen of these are

14
on or near the Uluguru Mountains, with the other seven on or near the Nguru Mountains
(Lovett et.al, 2004). Kilombero District has seven catchment forest reserves, six of these
reserves are on the eastern escarpment and foothills of the Udzungwa Mountains, which
are: Lyondo, Matundu, Iwonde, Nyanganje, Mwanihana and West Kilombero scarp reserve
which is administered by Iringa region. On the southern part of the escarpment is
Udzungwa scarp catchment forest. Boundaries between the reserves are usually rivers.
2.3.1 Economic Profile of Morogoro
Morogoro region is one of the regions in Tanzania with great potential of economic
development and prosperity. The Region has a very good climate and land favorable for
agriculture and other economic investments. The Region contains Morogoro Urban centre
which is its headquarters. Its Gross Domestic Product has been growing overtime.
According to the National Accounts of Tanzania Mainland, the Region in 1996 recorded
GDP at current prices of Tshs. 159,195 million which increased to Tshs. 439,142 million in
the year 2003 and it was projected to Tshs, 619,792 million in the year 2004.
2.3.1.1 Health
The growing population in all districts of the region has resulted to increased demand for
health facilities. Deaths have considerably increased with the common killing diseases
being malaria, pneumonia, HIV/AIDS and diarhorrea for both children under five years and
over five years. Statistics show that malaria led with 69.59 % of all over fives years deaths
in the region, pneumonia, anaemia and HIV/AIDS accounted for 15.09 %, 8.74 % and 2.75
% of all over fives years deaths during 2005 respectively.

15
Moreover there has been a decrease of 1.25 % of dispensaries in 2006 as compared to 1996.
While government dispensaries have decreased from 240 to 237 (1.25 %). While there has
been no overall change in the number of dispensaries in Kilombero and Ulanga, there has
been an increment of 16.67 % for dispensaries in Morogoro Municipal. The decrease of
dispensaries in Morogoro rural can be due to the creation of the new Mvomero district
which was once part of Morogoro rural. Growing number of drug stores, improvement of
government owned facilities as well as other private dispensaries are suggested to be
among the reasons for shrinkage of the number of private owned dispensaries. Unlike the
case of dispensaries, there has been a total increase of 19.23 % for health centers in
Morogoro region from the year 1996 to 2006. Kilosa district, the most populated district in
Morogoro region have an average of about 7,254 people served by one health facility, while
Ulanga, the least populated district in the region has an average of about 5,919 people
served by one health facility. The situation is relatively better in Morogoro Municipal
district where there is a ratio of 2 health facilities to a population of 10,000. On the other
hand, there is one health facility serving the population of 10,000 in Kilombero and Kilosa.
Regional wise the ratio of health facilities to 10,000 populations is 1.61. Investment needed
in this sector include the establishment of dispensaries and health centers; training of health
personnel; and supplying of drugs, vaccines and equipment especially by opening up
medical stores and shops in both urban and rural areas.
2.3.1.2 Education
The education sector in Morogoro has improved, in the urban areas most of the children
enrolled in primary education have gone through pre primary education as compared to the

16
rural areas. Most of these schools are under public ownership. Although they are still few in
number, their contribution in complementing primary education is significant. The
enrolment into pre-primary school is almost equal across sex of students. The number of
pupils enrolled into Pre-Primary education has been fluctuating from year to year, with an
increase in each year.
Currently, Morogoro Region like other Regions in Tanzania is facing a challenge of
growing young population that demands education at all levels, namely, pre-primary
education, primary education and secondary education. At the present the Region is
campaigning to make sure that all standard seven leavers who pass their examinations
continue with secondary education. The Government has left the doors open to private
investors to chip in this sector. Private investors are greatly encouraged to invest in this
sector so as to cope with the growing demand. The investments needed are building
schools, hostels, teachers’ training colleges and teacher’s houses.
2.3.1.3 Housing and Assets Ownership
Housing and assets ownership by households are among the major development indicators
in any society. The 2002 Housing and Population Census indicated that most of the houses
in Morogoro Region are of temporary nature. This is shown by the fact that most of the
households live in houses constructed by using temporary materials. Most of households in
the Region lived in houses roofed by temporary materials such as grass, and grass and mud
and walls constructed by using temporary materials such as poles and mud, timber, and
grass, only 24.3 percent of the households lived in buildings with floor constructed by
permanent materials. Looking district wise, Morogoro rural 1.7 of the households lived in

17
buildings constructed with permanent material unlike in districts like Morogoro urban were
more than half of the households lived in such type of building i.e. 68.1 percent, this could
be due to the fact that most facilities are available in that area. This can also be seen in
Kilombero were 21 percent lived in buildings constructed with permanent material but it
was different in districts like Ulanga with 7.9 percent, Kilosa with 15.8 percent and
Mvomero with 17.4 percent. However 89 percent of the households from Morogoro rural
lived in buildings of temporary material which was the same for districts like Kilombero
with 78.7 percent, Ulanga with 91.1 percent Kilosa with 83.8 percent and Mvomero with
80.2 percent which is due to poor facilities available and remoteness making it costly to
build a permanent house but Morogoro urban only 31.4 percent lived in such type of
buildings.
Table 2.1 Type of Floor Material of the Main Building by Households in the Region Floor material
Morogoro (Urban)
Morogoro (Rural)
Kilombero Ulanga Kilosa Mvomero
Cement 37,202 6,153 15,536 2,943 16,728 10,228 Mud 17,163 51,165 58,253 33,786 88,869 47,212 Timber 115 137 104 103 448 215 Tiles 49 - 11 10 23 6 Other 4 1 95 255 34 1,175 Total 54,582 57,457 73,999 37,097 106,101 58,836 Source: 2002 Population and Housing Census, Tanzania

18
2.4 FOREST SECTOR IN ULUGURU MOUNTAINS
The Uluguru Mountains are found within Morogoro Rural District (majority), Mvomero
District and Morogoro Municipality – all within Morogoro Region. The main Uluguru
Mountains is a ridge running approximately north-south and rising to 2,630 m altitude at
their highest point. The greater Ulugurus area also includes a number of isolated massifs
surrounding the main block – Kitulangh’alo, Dindili, Mkumgwe, Mindu and
NguruyaNdege. (Malimbwi et al 2005). The Uluguru range contains 7 Forest Reserves
supporting Eastern Arc forest habitats within Morogoro Rural District (Uluguru North,
Uluguru South, Kasanga, Mkangala, Mlaliwila, Ngambaula, Tongeniriver). Within
Mvomero District an additional 5 Forest Reserves are found on the main Uluguru ridge
(Bunduki IV, Bunduki VI, Bunduki VI, Bunduki I-III, Shikurufumi), which cover around
280 ha.
Formerly the Uluguru Nature Reserve (UNR) was managed by the Morogoro Regional
Catchments Forest Project. It is classified as protected area whereby timber harvesting and
other human activities are not allowed. The process to establish UNR started in 2004 with
the support from the Conservation and Management of Eastern Arc Mountain Forests
(CMEAMF) Project. The UNR is declared as the Nature Reserve in the Government Notice
No. 296 of 7/11/2008. It covers 24,115.09 hectare and is comprised of the former Uluguru
North Forest Reserve, Uluguru South Forest Reserve, Bunduki I and II Forest Reserves and
Bunduki gap/corridor. Its owned by the Central Government through Forestry and
Beekeeping Division of the Ministry of Natural Resources and Tourism (MNRT).

19
Uluguru Nature Reserve is surrounded by 57 villages with a total population of 91,426
(MPUNR 2008).The main ethnic group is waluguru, who constitute approximately 80 % of
the entire population. Other ethnic groups include Wapogoro, Wandamba, Wahehe,
Wanyakyusa, Wabena, Wazigua, Wasukuma, and Wakaguru. Population differs from one
village to another due to moving from one village to other in searching for agricultural land,
searching for employment, due to marriage and transfers. Statistics on population shows
that some villages such as Mgeta and Bunduki are highly populated. For example,
population density on the slopes of the Uluguru is over 159 persons per square kilometer
with population increase range of 2.8% to 6.5% to the district population density which is
22.5% in the year 2002.
Almost 57 villages touch the Nature reserve boundary. The UNR is an Eastern Arc type of
forest with species of restricted distributions and endemism. With the exception of rock
outcrops, the UNR consists sub montane (below 1500m a.s.l), montane (above1600-2400m
a.s.l) and upper montane (above 2400m a.s.l) forests. Also there are interesting features
such as the upland grassland with swampy areas called Lukwangule plateau, and Kimhandu
and Lupanga peaks. These features attract local and foreign tourists. However, some areas
of the UNR are inaccessible due to steep rocky outcrops. UNR is endowed with many
rivers namely, Ruvu, Mgeta, Morogoro, Tangeni, Mfizigo, Mmanga, Mzinga, Ngerengere,
Mvuha, Mbezi, Mngazi, Bigwa, Kilakala, Bamba and Kikundi Rivers. All rivers provide
water to the local communities where as Ruvu River also supplies water to Dar es Salaam,
Coast and Morogoro Regions used for both domestic and industrial purposes.

20
The main threats to the Uluguru Mountains are fires that spread from farmlands and into
the forest, intensive fire wood collection in higher, colder and more densely populated
areas, deforestation of unprotected forests (in the north), encroachment into the reserves in
the south, and the presence of invasive species (Rubus in the south and Maesopsis in the
north).

21
Figure 2.2 : Detailed villages adjacent to UNR (Source: Chamshama et al. 2008)

22
The mode of farming is different in regards to the aspect of the Uluguru Mountains. On the
western side, which includes villages such as Bunduki, Vinile, Tchenzema and others,
cultivation is mainly by use of terraces and intensive vegetable production. Most people in
this part of the Uluguru Mountains are also involved in animal husbandry. On the eastern
side, which includes villages such as KibungoJuu, Lanzi and others, cultivation is mainly
without use of terraces with intensive production of banana and fruits. This area receives
heavy rainfall and has fertile land which promise higher returns than other areas, though
road network have continued to be a problem. But these villages now have been motivated
to use terraces due to steep slopes that cause low yields of crops.
Livestock keeping is not a major economic activity to communities around UNR. The
Waluguru are said to have no culture of keeping cattle together with use of related
technologies such as oxen ploughs. Domesticated animals include goats, sheep, pigs,
chickens and rabbits. The keeping of dairy goats in the Uluguru (especially Nyandira area)
had been promoted mainly by Uluguru Mountains Agricultural Development Project
(UMADEP)
Through various project interventions, residents of Uluguru have planted different tree
species for purposes of meeting different needs related to forests. The main forest products
used by the local communities include timber, poles, withies, and ropes, fuel wood, charcoal
and medicinal plants. Others include honey, wild fruits, thatch grass, wild birds, bush meat,
wild vegetables, insects, mushrooms and roots/tubers. These products are utilized at different
level of intensity

23
The UNR is surrounded by farmers who cultivate maize, potatoes, yams, bananas, beans,
cassava, tomatoes, vegetable and fruits which are used as both food and cash crops. Land in
the surrounding communities is customarily owned. However, substantial portion of these
customarily owned lands is covered by Eucalyptus and Cedrella which reduce wood demand
from the reserve although they are invasive species to the UNR. Agricultural practices are
not environmental friendly though major parts of the land are found in steep slopes.
Local people surrounding the UNR do benefit from the forest through eco- tourism,
collection of medicinal plants, firewood and wild vegetables. However, this is done under
the supervision of staff from the reserve. Worshiping in sacred sites, visiting cemmentary
places; visiting tour attraction sites as well as collection of water for domestic use are some of
the prominent benefits that UNR offers to the local communities. This shows that the UNR
adjacent communities to some extent depend on the UNR for their livelihood. For that matter
therefore, there is a need of establishing modalities that would assist the UNR adjacent
communities to live in harmony with the forests.
2.4.1 Interactions of Uluguru communities with forest conservation
The main activities of the local communities in the Uluguru Mountains are dryland and
contour terrace agriculture, livestock, wage labour and a range of commercial activities.
However the local communities adjacent to Uluguru forest depend indirectly on the forest
products like wild animal, wild medicine, fire wood, building materials for their livelihoods
which results into human-conservatives conflict since they are not allowed to enter the

24
forest as it’s a reserved forest. However declining state of Tanzania’s forests and their
consequent increasing inability to provide either sufficient ecosystem services or livelihood
opportunities brought the need of Participatory Forest Management (PFM) which was
introduced in Tanzania in 2002. PFM is the community involvement in conserving the
forest which will result in villagers being responsible for taking on the costs of protecting
the forests, but losing their current de facto rights to collecting Non Timber Forest
Products’ (NTFP’s) such as fuel wood and forest vegetables and fruits. Villagers are more
likely to support community involvement in conservation if household benefits are linked
to forest protection, households have continued access to forest resources, especially as
forests regenerate, benefits to the village and individual households from the introduction
of Community involvement are at least as great as the costs and if the benefits are shared
appropriately and transparently among the nearby Communities and households (Lokina et
al 2008).
Local Communities like Lanzi, Kibungo, Dimilo and Nyingwa which live near to the
Uluguru forest may understand that they get greater benefits from well managed forests:
directly through collection of timber and non-timber forest products, and indirectly from
improved moisture levels. They may also recognize that well managed forests benefit
people living further away, through the provision of water to distant cities; and in
contributing to global biodiversity. But many villagers feel worse off as a result of the
introduction of PFM because of their reduced access to forest (Lokina and Banga 2010). In
order to improve livelihoods and reduce conflict and making the protection of the forest
more sustainable and more equitable, Payment for environmental services (PES) as part of

25
a conservation paradigm that explicitly recognizes the need to bridge the interests of
landowners and outside beneficiaries through compensation payments.
The principle behind the method is that the beneficiaries of the environmental services pay
for the services that they receive to the land users who generate those services. In turn land
users manage forest, reforest or implement other conservation-friendly resource
management schemes that will ensure the sustainability of the environmental services that
the beneficiaries receive.
PES schemes include carbon sink functions, watershed protection, and biodiversity. There
are few examples in Africa at the moment, but PES has been discussed in relation to the
Uluguru Mountains and their role in ensuring water supplies in the cities of Dar es Salaam
and Morogoro in Tanzania, (Lokina and Robinson, 2009). PES compensates communities
to change current land use practices, increase tree planting and conservation farming so that
to improve conservation of the forest in the Mfizigo sub catchments which makes the Ruvu
River. A total of 420 acreage in the Kibungo sub catchments is involved in the conservation
activities which is 33% of the targeted land. As shown in Table 3, Nyingwa village is the
largest of all in terms of the number of households as well as population wise. In this
village about 50% (approximately 700 acreage) of total land area is targeted for
conservation under the PES scheme. Communities are expected to benefits from this
scheme through increased productivity as a results of improved farming techniques for
example terracing (CARE, 2007).Therefore it is important to identify ways of securing
benefit streams to household/individual so as to facilitate conservation of the forest and
improve their livelihoods.

26
Table 2.2: Demography of the villages involved in the implementation of PES in conserving the Uluguru forest
Village name Household Males females Total Kibungo 316 593 697 1290 Dimilo 234 511 542 1053 Lanzi 303 613 617 1284 Nyingwa 319 695 797 1492 Total 1586 2904 3393 6297 Source; ward office; All of the villages are in the Kibungojuu ward of Morogoro Rural District

27
CHAPTER THREE
LITERATURE REVIEW
3.1 Introduction
This section reviews ways in which poverty can be measured by looking at the monetary
and non-monetary dimensions of poverty. First the review on theoretical literature on
different measure of poverty and the Propensity Score Matching (PSM) as well as its
limitations and potential data sources then the empirical literature but its worthy noting that
there few studies conducted in this area.
3.2 Theoretical literature
3.2.1 Poverty
Poverty is a complex concept. It entails a complex interconnection of descriptors
surrounding the livelihood status of people in communities. According to the World
Summit for Social Development held in Copenhagen in 1995 “Poverty has various
manifestations including lack of income and productive resources sufficient to ensure
sustainable livelihoods; hunger and malnutrition; ill health; limited or lack of access to
education and other basic services; increased morbidity and mortality from illness;
homelessness and inadequate housing; unsafe environments; and social discrimination and
exclusion. It is also characterized by lack of participation in decision making and in civil,
social and cultural life”
Poverty is multidimensional but specific to a location and a social group. However the
striking common features in the experience of poverty is that poor people’s lives are

28
characterized by powerlessness and noiselessness which constrain the people’s choice and
define the relationship and influence they are able to make with institutions in their
environment. The prevalence of diseases related to hunger and malnutrition is high in
coastal villages, and the problem becomes more serious during the ‘hunger’ months which
are the period of cultivation. Food insecurity becomes particularly intense in times of
natural disasters. Intra-household differences in access to food exist; they take the form of
differences in variety, quality, quantity and frequency of food intake. Combating poverty is
high on the agenda of governments and the international community. In September 2000,
189 nations committed themselves to work towards the Millennium Development Goals
(MDGs), a set of 8 goals aimed at halving the number of people living in poverty by 2015.
Tanzania signed up to the Millennium Development Goals (MDGs). The First MDG
commits Tanzania to reduce poverty between 1990 and 2015 by 50%. In 1991/92 poverty
was 38% in Tanzania, so the objective was to reduce poverty to 19% by 2015
(Development Partner Group, 2008). However, surveys carried out by the NBS showed the
absence of any noticeable poverty reduction. Between 2001 and 2007 the fraction of poor
people in Tanzania declined very little (NBS 2001; 2007). The decline was so small that it
is not possible to say with a high degree of certainty whether poverty actually went down,
or whether it remained unchanged.

29
Table 3.1 Poverty Incidence Since 1991 1991 2001 2007 Dar es Salaam 28.1 17.6 16 Other Urban 28.7 25.8 24.2 Rural 40.8 38.6 37.4 Tanzania Mainland
38.6 35.6 33.4
Source: National Bureau of Statistics 2001 and 2007
To capture the effect of PES in poverty alleviation the study compares two groups those
participating in the program and those not participating using the propensity score (PS)
technique, introduced in the 1980’s (Rosenbaum and Rubin,1983) and has its roots in a
conceptual framework which dates back even further (Rubin, 1987).
Its simplistic approach to estimating the programme effect would be to compare the
outcome of programme participants with those of non-participants. This would be a valid
approach were those participating in the programme a random sample of all those eligible.
PSM use quasi experimental methods which selects project beneficiaries and non-
beneficiaries who are as similar as possible in terms of observable characteristics expected
to affect project participation as well as outcomes. The difference in outcomes between the
two matched groups can be interpreted as the impact of the project on the beneficiaries
(Smith and Todd, 2001).
The key assumption made in PSM is that selection into a programme can be captured with
observable data that are available to the evaluator. This is known at the Conditional
Independence Assumption (CIA) (Heckman and Hotz 1989). For this identifying

30
assumption to be plausible, one must be able to control for all characteristics affecting both
participation and the outcome of interest. In our case we are looking at the effect of
participation in PES in conserving the forest if it has helped to reduce poverty.
Trojano (2007) Propensity score methods are increasingly being used in observational
studies in which, baseline characteristics differ between the exposed and unexposed groups;
exposure is relatively common; the number of measured characteristics or potential
confounders is relatively large; and the number of events is relatively small. The choice of
propensity score matching over regression analysis methods is that, PSM does not make
linear functional form assumption that regression does and PSM addresses common support
problem in a way regression does not. (Dehejia and Wahba, 1998).
Rosenbaum and Rubin (1983) demonstrate that the propensity score captures all of the
variance in the covariates relevant for adjusting between-group comparisons. As a result,
one can simply match the two (or more) groups based on this single variable. Propensity
Score Matching can be implemented in the form of probability weights for use in analyses
of treatment and outcomes.
IFPRI (2008) used PSM to estimate the Average impact of treatment on the treated (ATT)
for impacts of the Fadama II project on household productive assets, incomes, and
indicators of access to rural infrastructure and impacts of this. The PSM method matches
project beneficiaries with comparable non-beneficiaries using a Propensity Score, which is
the estimated probability of being included in the project. Only beneficiaries and non-

31
beneficiaries with comparable propensity scores are used to estimate the ATT. Those who
do not have comparable propensity scores are dropped from the comparison groups.
In doing matching different approaches are used to match participants and nonparticipant
on the basis of PS, which include nearest-neighbor (NN) matching, caliper and radius
matching, stratification and interval matching and kernel matching and local linear
matching (LLM). PSM is useful only when observed characteristics are believed to affect
program participation.
The main advantage of PSM relies on the degree to which observed characteristics drive
program participation. It also doesn’t necessarily require a baseline or panel survey
although in the resulting cross section, the observed covariates entering the logit model for
the PS would have to satisfy the conditional independence assumption by reflecting
observed characteristics X that are not affected by participation. It imposes few constrains
on the treatment model and few assumptions about the distribution of the error term.
3.3 Empirical literature
Studies undertaken in America(Costa Rica, Mexico, Brazil, El Salvador and New York) by
Rosa et al, (2003) on the compensation for environmental services and rural communities
found that Compensation for environmental services is not a cure-all for rural poverty and
environmental degradation and that PES schemes can be valuable for diversifying
livelihood strategies and improving natural resource management. In order to reduce
poverty PES schemes need to be part of wider strategies that expand and defend the whole
basket of assets in the hands of the poor; otherwise, they could fail to benefit the poor, or

32
even have adverse effects on them. Under the right conditions, PES schemes focusing on
poor, rural communities can help to address both.
Tacconi, et al (2009), undertook a study in assessing the livelihood impacts of payments for
environmental services scheme that involved communities in the implementation of REDD
which have several benefits. It is established that PES is likely to reduce transaction costs
(which have been found to be a major barrier to the participation of the poorest in PES
activities, building on local community institutions and supporting new ones would
strengthen social capital, thus increasing the resilience of the community and by supporting
community infrastructure and services, it would establish longer lasting foundations for the
improvements of local livelihoods than simply providing monetary income that in some
cases is rapidly dissipated.
Hope et al.,(2005) conducted a survey on if payment for environmental services contributed
to poverty reduction in small-scale land owners in the upper water catchment area of a
tropical Montane cloud forest in the northern Tilaràn range of Costa Rica. The study
findings suggested that programme design and impacts may be improved by clarification of
resource claims and environmental service provision rights, and simplifying programme
goals to defensible biophysical and/or socio-economic criteria.
A study by Theresia. (2006) to determine the extent to which ecotourism has improved the
livelihood of rural people and conservation of forest resources on Uluguru mountains,
found out \that majority of the people about 81.4% benefited directly and indirectly. Some
benefits were income, improvement of infrastructure and provision of social services. The

33
major conclusion of the study is that ecotourism development in the study area has
managed to improve local communities’ livelihood by increasing their income and has
contributed to the conservation of the forest thus reducing degradation of the forest.
Lokina and Robinson, (2009) and Robinson and Lokina (2010), while assessing the
effectiveness of the participatory forest management, in two regions of Tanzania found that
though there was evidence to support improved forest cover where PFM was implemented,
there was no sufficient evidence to support improving the livelihood of the forest adjacent
communities.
Mkenda (2007) assessed the extent to which marine parks improve household welfare and
reduce poverty in the Tanzanian coastal areas. Household survey data was collected from
24 villages along the coast of Tanzania mainland and Zanzibar. To achieve its objective, the
study employed the axiomatically preferred poverty indices to assess relative poverty
between villages currently in the marine parks and those outside the marine parks. In
estimating the poverty indices the study used data from household consumption collected
through the administration of questionnaires to randomly selected households in each 24
villages involved in the study. The study found out that, poverty was quite high and
widespread in all the villages and there was no notable difference in poverty between the
villages in the marine park and the one outside the marine park in Mafia (Mkenda, 2007).
A study by Gervas (2010) on the impact of MACEMP project in Mafia district towards
reducing poverty. Four types of analysis were employed, Principal Component Analysis
(PCA), Descriptive analysis, ANOVA analysis and Logistic regression analysis. The study

34
revealed that there is a difference in welfare between households who are under the
MACEMP project and those ones who are not under the project. From the PCA, the
assessment showed that a big percentage of the households with lower index value fall
under the non–supported group which is 70% of all households falling in poor category of
the study area while from the supported group only 30% was found to fall under the poor
category. For Logistic regression variables it was found that socio-economic and
demographic variables to significantly contribute to the less likely to fall under poor
category. Logistic results confirm that MACEMP project has impact in Mafia community.
It was also proved using the ANOVA analysis that the existing difference in poverty status
was the result of the existence of the project in the study area. Therefore, from the
perceptions of the households, it was found the households are satisfied by the efforts of the
MACEMP project on the coastal and marine management.
A study by Ellis (1999) examined the livelihood diversification as a survival strategy of
rural household in developing countries. This study was undertaken in light of the
increasing awareness of livelihood diversification in approaches to rural development, in
order to consider the interactions among diversification and poverty, farm productivity,
natural resource management and gender relations in rural areas; and to advance the policy
understanding of diverse rural livelihoods. The study found out that the diversity of
livelihoods is an important feature of rural survival but often overlooked by the architects
of policy. Diversity is closely allied to flexibility, resilience and stability. In this sense,
diverse livelihood systems are less vulnerable than undiversified ones; they are also likely
to prove more sustainable over time precisely because they allow for positive adaptation to
35
changing circumstances. The researcher suggested that practical applications of the
sustainable livelihood framework need to place diversity high on the policy, agenda; it is
well to recognize that the benefits of diversity are context specific. These distinctions reveal
that policies aimed to achieve more resilient or more sustainable rural livelihoods need to
recognize not just the positive attributes of diversity for achieving those ends, but also
distinctions about the differing nature of that diversity between individual’s households and
larger social or economic arenas.

36
CHAPTER FOUR
METHODOLOGY
4.1 Sampling strategy
A purposive sampling of the villages of Morogoro Rural district was done to households
adjacent to the Uluguru Mountains and those which are involved in the PES project. A total
of 57 villages are found in the Uluguru Mountains some being involved in the program.
Household were randomly sampled from KibungoJuu Ward in four selected villages of
Lanzi, Nyingwa, Dimilo and Kibungo to ensure adequate representation of the villages.
Selection of household for the study was done to ensure representativeness i.e. having
mixed kind of respondents in terms of age composition, gender, economic status,
harvesting and use of resources, economic activities etc. In each selected household, a head
of household or elder member of the household was interviewed using a structured
questionnaire
4.1.1 Sample Size and Composition
The study covers 200 respondents, of which 100 (or 50%) comprise of the treatment group
and 100 (or 50%) of the comparison group. Poverty status of these two groups was
examined to find out if there is any difference on welfare status between the supported and
not supported groups. Table 6 below shows the composition of the sampled villages and
group members (participants and Non participants) from Kibungo, Lanzi, Dimilo and
Nyingwa (study areas) in Morogoro rural district

37
Table 4.1 Sample Composition Village Treatment
Group % Control
Group % Total %
Kibungo 25 25 25 25 50 25 Nyingwa 25 25 25 25 50 25 Dimilo 25 25 25 25 50 25 Lanzi 25 25 25 25 50 25
Total 100 100 100 100 200 100 Source: Author’s Computation (2012)
4.1.2 Primary Data
In this study the primary data collection was done using questionnaires to the sampled
population in the study area. The questionnaire aimed at collecting, among others, data on
household size and composition; length of residence in Uluguru and place of origin,
Education level of household head, Equipment owned by the household (tools, transport,
etc.), level of cash income, Livestock ownership, Land area (total, and farmed); main
livelihood activities (e.g. farming, livestock, business, employment, remittances), and their
perceived relative importance to the household, income from involvement in PES project.
For each of main livelihood activities, annual production, proportion sold and home
consumption; relative importance of different livelihood sources (including forest product)
over the year, cost of wild animal damage to crops (if any), livestock, etc.
The focus group discussions was held to collect information of a generally applicable
nature, e.g. on seasonality, markets and prices. Other information collected includes
agricultural practices and the corresponding prices. The study also collected
community/village level data. The aim of collecting village level data was to get general
data at high level which form the basis for validation of information from individual

38
respondents. The village data collected include main economic activities, population data,
available facilities such health, schools, extension services, environmental management
practices, general welfare of communities etc.
4.1.3 Secondary data
Secondary data were collected from different sources, including ; Resource Economic
Analysis of Catchment Forest Reserves in Tanzania; Economic Surveys; Tanzania National
Forestry Policy Document; Tanzania Forest Conservation and Management Project;
Morogoro Economic Profile, The Uluguru Catchment Baseline study, WWF annual reports,
Ministry of Natural resources and Tourism, National Bureau of statistics and among others.
4.1.4 Field Observations
In order to verify the information collected with other sources of data, the field/physical
observation was applied. From the field observation it was found that, in 4 years of the
EPWS project in Kibungo Juu, the project has managed to train Farmers on improved land
use and agronomic practices in the communities. About 14 farmers (10 males, 4 females)
were trained on proper utilization of stabilizer planting materials and crop production
(spacing and use of manure). Also, the farmers were trained on proper harvesting by
leaving all trashes in the field for decomposition and record keeping for harvested products
and sales. It was also observed that in all four villages in spite of being assisted with EPWS
or not, some households are still living in poor houses and others not being able to afford 3
meals per day.

39
4.2 Propensity Score Matching
In an attempt to obtain an estimate of the impact of PES, in comparing the outcome of the
treated individuals with that a similar control group we make use of Propensity Score
Matching (PSM) which will be used since observed characteristics are believed to affect
program participation.
Since it’s a single treatment then Logit model will be more appropriate to calculate
Propensity Score (PS). Let represent the probability of a person participating in the
program and is the probability of the person not participating. And we have the
outcome if the person participates and if he does not, then we have the following.
………………………………………………………………4.1
Pr( 0) 1i iY P …………………………………………………………………...4.2
The probability of a person to participate is given as
0
0
( ' )
( ' )( 1 | )1
X
i XeP E Y X
e
…………………………………………………4.3
Where, X is a vector of independent variables and β is a vector of their respective
coefficients.
For ease of expression and understanding, equation 4.3 is thus simplified
as0
0
( ' )
( ' )( 1 | )1
X
i XeP E Y X
e
=٨(x, β) ……………………………………4.4
Notation ٨(x, β) indicate the logistic cumulative distribution function.
P r( 1)i iY P

40
The probability therefore of a person not to participate can thus be given as
0( ' )1(1 ) ( 0 | )
1i XP E Y Xe
=٨(x, β) ………………………….4.5
The logistic distribution (Logit) always gives larger probabilities to Y=0 when x β is
extremely small and smaller probabilities to Y=0when β x is very large. This is fairly
different to the normal distribution (Probit).
It is noted from equations above that ranges from to and is non-linearly related not
only to the regressors but also to the parameters thereby causing some estimation problems
in as far as ordinary least squares (OLS) estimation technique is concerned. Due to non
linearity which will lead to estimation problem then we can reformulate these equations in
terms of the odds ratio of the probability of the person to participate to the probability of
the person not participate. And this equation will be as follows:
0
0
( ' )
( ' )
11 1
Xi
Xi
P eP e
…………………………………………………………4.6
Where
i
i
PP
1 is simply the odds ratio in favor of a person who participate and can thus be
simplified as follows:
0( ' )
1Xi
i
P eP
………………………………………………………………4.7

41
Then we take the natural logarithms of the equation to get the Logit model and it can be
observed that the log of the odds ratio is not only linear in ,but also in the parameters ;
0ln '1
ii
i
p L XP
……………………………………………………4.8
The interpretation of Logit as odds-ratio is an attractive feature of Logit model. Since Logit
gives log of the odds and that is the reason for the Logit estimates sometimes to be referred
as log-odds estimates. Therefore odds ratio can be calculated simply by exponentiation the
Logit estimates. Interpretation of odds ratio depends on whether the coefficients are greater,
less or equal to . Expressed in this way, it is a little easier to see what is going on with the
odds ratio. When the probability of a one (“success”) is less than the probability of a
(“ ), then the odds ratio will be less than . When the probability of a one is
greater than the probability of a 0, the odds ratio will be greater than 1. When the odds
ratio is exactly 1, this says the odds of success and failure is even. Therefore when
interpreting an odds ratio, if the value is greater than 1 then any change in variable will
favor success and when the coefficient is less than 1 then any change in variable will favor
failure. Also in interpreting odds ratio it is often helpful to look at how much it deviate
from 1.
Any standard probability model can be used to estimate the propensity score. On the other
hand, a variable should only be excluded from analysis if there is consensus that the
variable is either unrelated to the outcome or not a proper covariate. If there are doubts

42
about these two points, Rubin and Thomas (1996) recommend to include the relevant
variables in the propensity score estimation.
When using all the available covariates, bias arises from selecting a wide bandwidth in
response to the weakness of the common support, using a lower number of covariates,
common support is not a problem but the plausibility of the confoundedness assumption is.
Moreover, this trade-of also affects the estimated standard errors, which are smaller for the
minimal specification where the common support condition poses no problem. Finally,
checking the matching quality can also help to determine the propensity score specification.
After the equation is estimated the predicted values of participating from participation
equation are obtained. The region of common support is defined where distributions of PS
for treatment and comparison group overlap. We use the kernel and local linear matching
for matching the participants and non participants since with the other methods only a small
subset of nonparticipants will ultimately satisfy the criteria to fall within the common
support and thus construct the counterfactual outcome. With kernel and Local Linear
Matching (LLM) use a weighted average of all nonparticipants to construct the
counterfactual match for each participant.
If is the score for participant I and is of nonparticipant , the weights for Kernel
matching are given by;

43
K (.) is a kernel function and is a bandwidth parameter. Kernel matching is analogous to
regression on a constant term whereas LLM uses a constant and slope term, so it is linear.
LLM can include a faster rate of convergence near boundary points (Fan 1992, 1993).
The nearest neighbor matching is used to be precise with Kernel, match treated and
control units taking each treated unit and searching for the control unit with the closest
propensity score; i.e, the Nearest Neighbor. Although it is not necessary, the method is
usually applied with replacement, in the sense that a control unit can be a best match for
more than one treated unit.
The formula for of the matching estimator is:
is the number of observations in the treated group
is the number of controls matched with treated observation i

44
is equal to if j is a control units of i, and zero otherwise
The basic idea behind propensity score matching (PSM) is to match each participant with
an identical nonparticipant and then measure the average difference in the outcome variable
between the participants and the nonparticipants. Propensity score matching is ‘data
hungry’ not only in terms of the number of variables required to estimate participation and
outcomes, but also in the number of participants and non-participants entering the matching
process
Conditional independence is a strong assumption and is not a directly testable criterion it
depends on specific features of the program itself. If unobserved characteristics determine
program participation, conditional independence will be violated and PSM will not be an
appropriate method.
By using the asset index, the socioeconomic status of the households was categorized into
two groups, that is poor and non poor and the two categories were given the value of 0 and
1 consecutively. This categorization is basing on the NBS 2001 and 2007 rural poverty
incidence which was 38.5%. Furthermore the project impact was analyzed by looking on
the economic difference between the participants and non-participants groups. From there
the significance of the socioeconomic status was tested with ANOVA analysis. This was
done to find out if the difference was the results of the project or was to be there even
without the establishment of the PES project

45
CHAPTER FIVE
MAJOR FINDINGS AND INTERPRETATION
5.1 Introduction
This chapter presents results and discussion from the study area. This study has employed
the Propensity Score Matching (PSM) in assessing the poverty status of households
between the participating group of the EPWS project and non–participant group.
5.2 Descriptive Analysis
In this section data is described to see their behavior before undertaking PS analysis. This
will help to understand the nature of the sample data collected. Data was collected from
four villages in Kibungo Juu ward found in Morogoro rural district for participants and non
participants in PES activities. A total sample size of 200 households, 50 from each of the
four villages, was randomly selected. A head of household or a single person involved
decision making of the household was interviewed. From the sample data collected 44%
and 55% of the respondents are females and males respectively. The mean age of
respondents was 39 years old and the majority of these could read and write, as about 76%
completed primary education. The average household size in Kibungo Juu ward is 5.2
which is relatively less than the national average of 6 household members (HBS 2007).
Table 5.1 provides the summary of the population of the surveyed village and the sampling.

46
Table 5.1 Overview of surveyed villages
Village Population No of HHs Surveyed HHs Share interviewed
Nyingwa 1492 319 50 15% Dimilo 1053 234 50 21% Lanzi 1284 303 50 16% kibungo 1290 316 50 15% Source: Ward office
The sample was randomly selected and all the respondents surveyed were aware of PES but
not everyone participated due to factors like sickness, some decided not getting involved,
some were busy with family activities, some had family problems that prevented them from
participating. It was also observed that some didn’t understand the benefits of the PES.
From the sample it was found that about 42% participated immediately when the program
started 8% joined later and 50% didn’t not participate at all (non-participants).
It is hypothesized that the factors that mainly determined participating in the program are
ownership of land, the respondent’s age, the education level, their gender, the household
size and the consumption expenditure. It is important to note that the participation into the
program is voluntary. Table 5.2 gives the mean value of the variables determining ones
participation.

47
Table 5.2 Summary of descriptive Statistics of the variables used in the analysis Variable Description Mean Std. dev Min max
Age Actual age of respondent in years 39.83 13.78 17 83
Education Education level of the respondent;
1=professional and above, 0 otherwise
0.89 0.31 0 1
Household Size Number of households 5.26 3.09 1 21
Gender 1=Male; 0=Female 0.55 0.49 0 1
Cons.
Expenditure
Household consumption expenditure in Tshs 6985 2622.78 2000 14000
Land Size of Agriculture land owned by the
respondent in acres
2.87 3.69 0.5 40
Marital Status Marital status of the respondent;1=married, 0
otherwise
.55 .49 0 1
Assets Owned Number of assets owned by the household 12.94 1.355 9.8 18.93
Years Lived in
the Village
Number of years lived in the village by the
household
30.115 17.03 1 83
Food Security measured by number of meals per day 2.29 0.63 1 4
Welfare perception of household after 2008 2.21 0.89 1 3
Participation into
PES
Households participation in PES activities;
1=Yes,0=No
0.5 0.50 0 1
Forest Product Households commonly harvested forest
products; 1= food products, 0=non-food
products
0.22 0.41 0 1
Change in Plot
Ownership Size
Amount of plot that has increased due to PES 0.89 0.313 0 1
Number of Years
Owned the Plot
Number years the household owned the plot 16.3 15.86 1 82
Type of Land
Tenure (Titled)
Households legal title or ownership rights for
the plot of land
4.22 1.20 1 5

48
5.3 Quantitative Results
5.3.1 Social Economics and Livelihood Data
Based on the survey, the socio-economic characteristics of the households in KibungoJuu
community were analyzed specifically on the villages supported by the PES project to
assess the impact of the projects on sustainable livelihood. Main characteristics of interest
are those related with livelihood assets possessed by household members and therefore are
for the household as whole. Three types of livelihoods assets are distinguished, these are
physical, human and social assets are included in the analysis.
5.3.2 Housing and asset
The well-being of the households was also recorded using information about the type and
quality of the houses people lived in. More than 35% of all households' main dwelling was
made out of poles and mud and more than 40% had grass-thatched roofs. The households
claimed to have better quality houses compared to those they had before PES, as it was
easy to obtain building materials from the trees they planted. The participating group was
seen to have better housing, as more than 60% of their houses were built from permanent
materials while non-participants had houses made mostly of poles and grass-thatched roofs.
This showed a significant difference between the two groups. Figures 5.1.1 and 5.1.2
summarize the details.

49
Figure 5.1.1 Building Materials for the Walls of Household’s Main Dwelling
Figure 5.1.1 shows that participating household has more houses made of burnet/cement
brick compared with those of non-participant. Although the difference seem to be
significant, but there are indications that their involvement in the PES initiative it has
improved their wealth status. There are also significant decrease in the number of houses
made of poles and mud as well as branches and grass. This is important achievement of the
program.
Figure 5.1.2 Property Owned By Household

50
Of significant improvement is the diversification of household income as can be shown in
Figure 5.1.2. One of the advocated benefits of forest conservation is to make the household
use of the forest to improve their welfare. As seen in Figure 5.1.2 with PES there are
significant increase in the number of household with beehives, the increase is almost from
none to about 10 households. This is a clear demonstration of the efforts to diversify the
household income, which is important in the sustainability of the PES initiative. Field
observation further indicates that majority of the households owning bicycles are using
them as business investment, thus generating employment to the youth as well as income to
the households. Hence refraining the youth from engaging into harvesting of forest for
charcoal and timber.
Further the situation before and after the implementation of PES has a positive effect on
the households as shown in Figure 5.1.3. There has been increase in the ownership assets
like phones and bicycles compared to how it was before, the quality of the houses has also
improved. This all shows a positive impact of the program to the households.
Figure 5.1.3 Asset Ownership Before and After Introduction of PES

51
5.3. 3 Food Security
One way of assessing the welfare is by looking at the food security of the households
because it is one of the important aspects of the household wellbeing.
5.3.3.1 Meals per Day
In this case, households were asked to state the number of meals they can afford per day on
average. The average number of meals at the household is three meals per day, any
household having meals less than three is considered to be in the food insecurity category.
Figure 5.2 Meals per Day (in percentages)
From Figure 5.2, results indicate that people from the supported group are likely to afford 3
meals per day than those from the non–supported group. As shown in Figure 5.2, 76% of
households from supported group can afford 3 meals. The overall results show that the
percentages from the non–supported group increases toward the fewer meals while that of
the supported group increases as the number of meals per day increases. More importantly,

52
these results suggest that the non–supported group is the ones that suffer more from food
insecurity.
Figure 5.3 Meals per Day before and after PES (in percentages)
From Figure 5.3, results indicate the situation before and after PES on households’ ability
to afford 3 meals a day. The results indicate that 62% could afford only one meal a day
before PES, whereas with PES, this proportion reduced to 13%, as more households could
afford more than one meal a day. The proportion of households that could afford 3 meals a
day increased from 13% before PES to 36% after PES. This can be attributed to the higher
yields as a result of the households’ training in better farming techniques, such as, contour
farming and the use of manure, which made the farm land more fertile.

53
.5.3.4 Consumption Patterns
Households were asked to show their consumption patterns in some selected foods which
are: meat, fish, beans and milk consumption since it gives information on their spending for
food per day. For the two groups the results are demonstrated in Table 5.3.
Table 5.3 Consumption Patterns
Participants Non-participant
Variables Mean Std. Deviation Mean Std. Deviation Meat consumption 1.88 1,25 1.81 1.01
Fish consumption 1.47 0,83 1.33 0.88
In this question the households were required to mention the days they have been
consuming meat and fish per week. In responding to this question it was found that 61.5%
of the households ate meat for the past seven days and 27% ate fish for the past seven days.
Also found that 55.5% of the households from the supported group ate fish for the past
seven days and 44.4% of the not supported ate fish for seven days for the past seven days.
Other percentages were taken with those who took meat and fish between 1 up to 6 days.
These results suggest that, in the study area meat is the main source of protein. Results
shows that there is no significant difference in consumption of meat between the two
groups, and the consumption of meat is a bit high compared to that of fish. However there
is a significant difference in consumption of the two types of food selected by the two
groups.
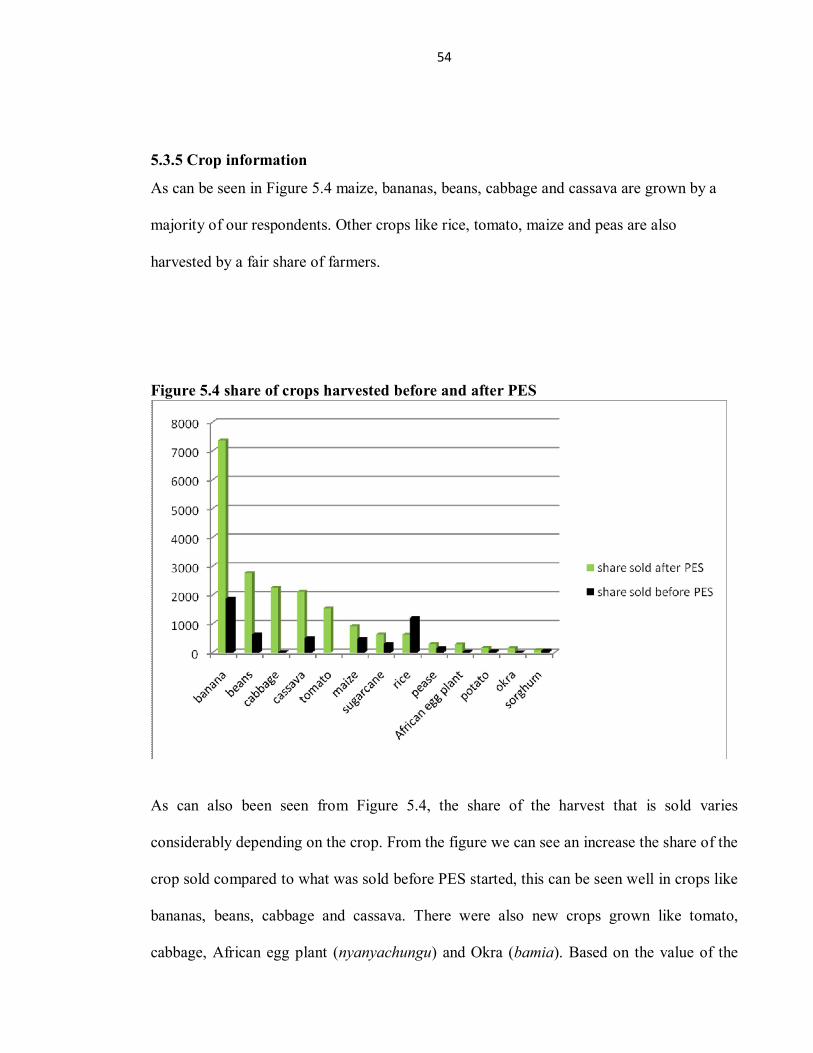
54
5.3.5 Crop information
As can be seen in Figure 5.4 maize, bananas, beans, cabbage and cassava are grown by a
majority of our respondents. Other crops like rice, tomato, maize and peas are also
harvested by a fair share of farmers.
Figure 5.4 share of crops harvested before and after PES
As can also been seen from Figure 5.4, the share of the harvest that is sold varies
considerably depending on the crop. From the figure we can see an increase the share of the
crop sold compared to what was sold before PES started, this can be seen well in crops like
bananas, beans, cabbage and cassava. There were also new crops grown like tomato,
cabbage, African egg plant (nyanyachungu) and Okra (bamia). Based on the value of the

55
different crops, about half the harvest is sold, 10% farmed completely for subsistence and
for 52% of respondents half the harvest was kept for food
If crops are sold, most households sell in the farm, as can be seen in Figure 5.4 although
this is true for crops like cabbage and bananas, there is some variance depending on the
crop. Beans and maize are mostly sold on the road side or directly to homes but bananas are
also sold right at the local market with young men who carry baskets.
5.3.6 Perceptions
This section provides and discusses the results on how the households perceive their
standard of living, size of the forest and availability of biodiversity. Here the respondents
were asked to compare the mentioned situations by giving out their perception on the
situations before and after the establishment of PES.
5.3.6.1 Standard of Living Before and After Year 2008
Respondents were also interviewed on how they compare their household welfare after year
2008.The main intention for this was to look at how they perceive their standard of living
after the establishment of the PES project. As noted earlier that the project started in 2008.
Participants viewed to be better than they were before while majority of the nonparticipants
said things are the same or had improved a bit. More than 67% of the participating group
said their lives had improved compared to how it was before due to the increase in harvest
of crops which increased the income and food. This was due to the improved farming
techniques that they were taught like contour/terrace cultivation and the use of manure. But

56
on the contrary, only 29% respondents from the non–participating group agreed that the
living standard is a little better now. See more results in Figure5.5)
Figure 5.5 Standard of Living before and After Year 2008
5.3.6.2 Comparison of the Household’s Standard of Living with Others in the Community
Furthermore, each household was also required to compare his or her living standard with
other households in the community. In response to this question, the results points out that,
respondents from the supported group perceive their standard of living as somehow good
compared to other households in their community (See more results in Figure5.6).
Figure 5.6 Comparison of the Household’s Standard of Living with Others in the Community

57
5.3.6.3 Perceived changes in the forest
Almost all respondents had witnessed changes in the forest and biodiversity over the past
years. When asked to specify the changes on the quality and availability of resources in the
village/community after the introduction of PES program in terms of the forest size, 68%
said they were satisfied since there are restrictions in entering the forest while 31% said
they were not satisfied with the situation. This tells that more people see the improvement
of the forest size after the introduction PES activities in the communities. On the part of
biodiversity in the forest 75% said they were satisfied with presence of wild animals in the
forest 12% said that it had become harder to find forest products, Figures 5.7.1 and 5.7.2
summarizes the details. As can be seen from the figure majority of the respondent are
satisfied with the improved forest cover as a result of PES program. Respondents at
Nyingwa were more satisfied with the improved forest cover compared with other villages
where nearly 40% agreed that there is a huge improvement due to PES
Figure 5.7.1Size of the forest after the introduction of PES program

58
Figure 5.7.2 Biodiversity in the forest after the introduction of PES program
Furthermore, respondents were asked their perception on how they viewed the forest cover
before PES in terms of the forest size if it became better or worse and 65% said it was
satisfactory and 29.5% said they were not satisfied. On the part of biodiversity in the forest
52% said they were satisfied with the improved biodiversity in the forest example increase
tree species, presence of animals in the forest. See Figure 5.7.3 for further details.

59
Figure 5.7.3 Perception on the size of the forest before the introduction of PES program
5.4 Construction of Wealth Index (WI) and Comparison of Poverty/Welfare between Participants and Non–Participants
The wealth index categorises (asset index) households into two groups as poor and non–
poor. The constructed index takes two values which is 0 for poor and 1 for non–poor. As
presented in Table 5.4 categorization is based on the NBS (2001 and 2007) rural poverty
incidence of Tanzania and field survey where by 38.5% of the KibungoJuu households are
considered as poor and 61.5% to be non–poor.
Table 5.4 Household Wealth Categories Category WI values %Households Poor 0 38.5 Non-poor 1 61.5
Basing on this asset index it has been found that, households who are nonparticipants of
PES have large proportions of households into poor category than that from the supported.
The results show that out of poor households in the study area 55% of poor household

60
comes from the non-participants while the participants group takes only 45%.See Figure
5.8 for further details.
Figure 5.8 poverty level between the participating and non-participating group
The analysis went further by looking on if this difference in welfare between the two
groups was a result of PES project in the community. This was achieved by using ANOVA
analysis where by the results were found to be significant at 5%. This is significant enough
to prove that the project has impact on welfare difference between the households who are
participating in the project and those ones who do not participate. This is a significant
finding in this study as is contrary to the earlier findings by Mkenda, (2007, 2009), where
he could not find the significant difference between the sample of under RUMAKI and
those outside the RUMAKI programme. It is however, consistence with the findings by
Gervas (2010), where it was shown that there were significant improvements of welfare of
communities participating in MACEMP compared to non-participating communities.

61
Table 5.5 ANOVA Results for Project Impact
Sum of squares df Mean Square F Sig Between groups(combined) 0.428 1 0.42 1.707 0.019
Within groups 49.57 198 0.25
Total 50 199
5.5 Econometrics Model
5.5.1 Propensity score matching results
5.5.2 Diagnostic Tests and Model Validation Results
The propensity scores were computed using binary Probit regression models. We estimated
logistic model for comparing PES beneficiaries with all non-beneficiaries, the dependent
variable in the model is a binary variable indicating whether the household was a
beneficiary of the PES project. The explanatory variables used in computing the propensity
scores are those expected to jointly determine the probability to participate in the project
and the outcome. The focus was on the determinants of participation and productive assets
when selecting the independent variables for computing the principle score matching.

62
Table 5.6.1 Logistic Regressions Estimates for Participation in PES
Participation Coefficient Robust Std. Err
Z P>|Z|
Gender -0.230 0.198 -1.16 0.246
Age 0.013 0.008 1.53 0.127
Education
0.297 0.329 0.90 0.366
Household size 0.087** 0.035 2.50 0.012
Land 0.037 0.058 0.64 0.525 assets Owned 0.249** 0.109 2.28 0.023 Consumption Expenditure 0.396*** 0.154 2.57 0.010
Marital Status
-0.303 0.225 -1.34 0.180
Years lived in the village
0.004 0.006 0.60 0.547
Constant - -7.974*** 1.891 -4.22 0.000 Sample size
200
Prob >χ2
0.0000***
Pseudo R2 0.157 Log likelihood -116.76618
The study found that PES participants are more likely to be households with a large size
who participate more in PES activities with a 0.087 treatment effect. Comparing with
nonparticipants, participants also tend to be older and have more land.
Ownership of assets was one of the factors also mentioned by the respondents that
influenced participation and from our model we see a 0.249 treatment effect. Example an

63
interview with some of the households who did not participate one of their reason of not
getting involved was lack of land to cultivate and farming tools like hoes (jembe) and bush
knife (panga)
Consumption expenditure of the respondents is marginally significant in influencing the
participation into the program suggesting that the PES might have been more attractive to
the people in earning more for their consumption, from our model there is 0.396 treatment
effect.
The model results were used to compute the propensity scores that were used in the
Propensity Score Matching (PSM) estimation of Average Treatment effect for the Treated.
Further testing of the comparability of the selected groups was done using a “balancing
test” (Dehejia and Wahba, 2002), which tests for statistically significant differences in the
means of the explanatory variables used in the model between the matched groups of PES
participants and nonparticipants. In all cases, that test showed statistically insignificant
differences in observable characteristics between the matched groups, supporting the
contention that the PSM ensures the comparability of the comparison groups.
The region of common support is [0.097, 0.998] where only 198 observations are matched
with control observations with a mean of 0.503 and Std. Dev 0.215 with 4 blocks. The
number of blocks ensures that the mean propensity score is not different for treated and
controls in each block and the balancing property is satisfied. The final distribution of
treated and controls across blocks are tabulated together with the inferior of each block.

64
Table 5.6.2 Inferior bound, the number of treated and controls for each block Inferior of block of Pscore Do you participate in PES activities Total
No Yes 0.0971367 23 4 27 0.25 47 33 80 0.5 23 37 60 0.75 5 26 31 Total 98 100 198
Table 5.6.2 shows that only 98 of non participants matched with 100 participants in the
common support of the sample of 200. Several methods are possible for selecting matching
observations (Smith and Todd, 2001). We used the kernel matching method (using the
normal density kernel), which uses a weighted average of “neighbors” (within a given
range in terms of the propensity score) of a particular observation to compute matching
observations. Unlike the nearest-neighbor method, using a weighted average improves the
efficiency of the estimator (Smith and Todd, 2001). Observations outside the common
range of propensity scores for both groups (i.e., lacking “common support”) were dropped
from the analysis. This requirement of common support eliminated about some of the total
number of observations, indicating that few of the observations from the various strata were
not comparable.
Table 5.6.3 Bootstrap statistics Variable Reps Observed Bias Std. Err [95% Conf. Interval]
bs1 5 0.2996474 0.1689467 0.1350903 -0.0754233 0.6747181 (N)
0.3524641 0.6263694 (P)
0.1468518 0.6316998 (BC)
N = normal, P = percentile, BC = bias-corrected
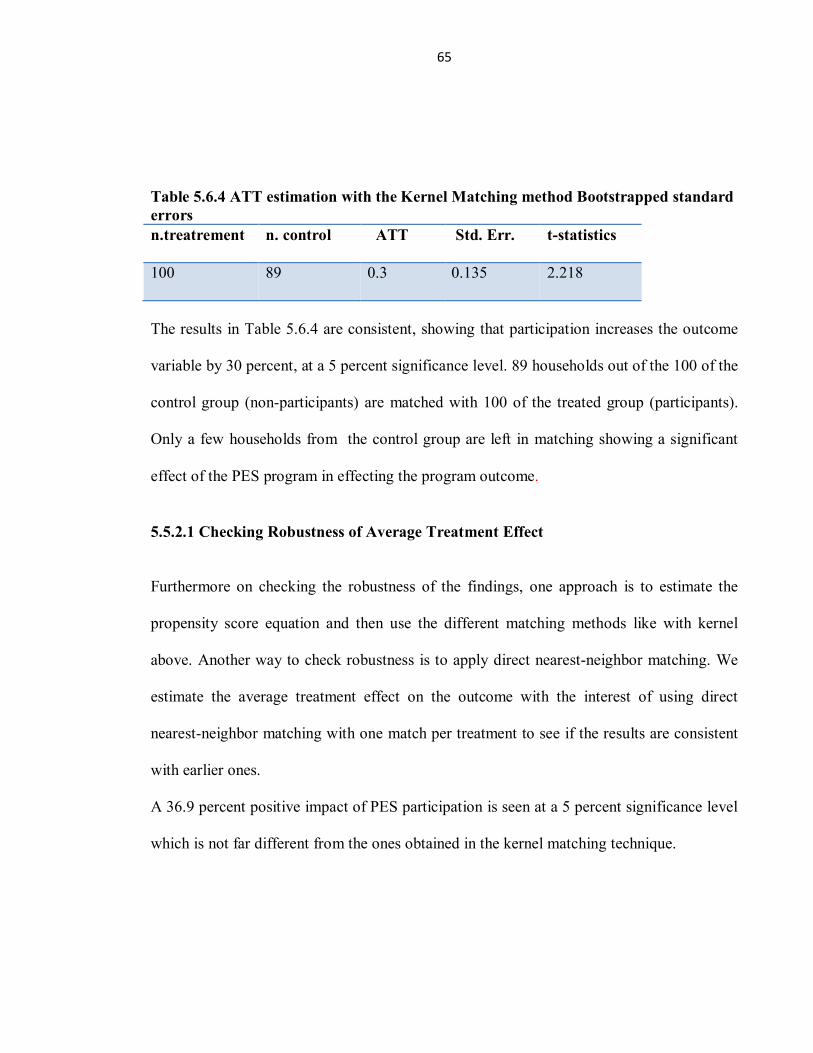
65
Table 5.6.4 ATT estimation with the Kernel Matching method Bootstrapped standard errors n.treatrement n. control ATT Std. Err. t-statistics
100 89 0.3 0.135 2.218
The results in Table 5.6.4 are consistent, showing that participation increases the outcome
variable by 30 percent, at a 5 percent significance level. 89 households out of the 100 of the
control group (non-participants) are matched with 100 of the treated group (participants).
Only a few households from the control group are left in matching showing a significant
effect of the PES program in effecting the program outcome.
5.5.2.1 Checking Robustness of Average Treatment Effect
Furthermore on checking the robustness of the findings, one approach is to estimate the
propensity score equation and then use the different matching methods like with kernel
above. Another way to check robustness is to apply direct nearest-neighbor matching. We
estimate the average treatment effect on the outcome with the interest of using direct
nearest-neighbor matching with one match per treatment to see if the results are consistent
with earlier ones.
A 36.9 percent positive impact of PES participation is seen at a 5 percent significance level
which is not far different from the ones obtained in the kernel matching technique.

66
Table 5.6.5 Matching estimator: Average Treatment Effect for the Treated (ATT) Weighting matrix: inverse variance Number of observation = 200 Number of matches (m) = 1 Outcom
e
Coefficien
t
Std. Err. Z P>|z| [95% Conf. Interval]
SATT 0.3984768 0.1773457
2.25 0.025 0.0508855 0.7460681
Matching variables: gender age education household size, consumption expenditure, land assets time village marital
The study used bootstrapping to compute the standard errors of the estimated ATT,
generating robust standard errors because the matching procedure matched nonparticipating
households to participating households “with replacement” (Abadie and Imbens, 2002 and
2006) on the use of bootstrapping for inference in matching estimators. In kernel matching,
all treated, as well as all controls (in the common support which has been imposed here),
are used. The estimate of the ATT is quite close to the one obtained with nearest-neighbor
matching.
5.6 Perception on Welfare as a result of PES
The study also adopted multinomial probit to estimate the perception of household on there
welfare before and after 2008.
Table 5.7: Results of Marginal effects after MNP for welfare

67
* Significant at the 10% level; ** significant at the 5% level; *** significant at the 1% level
The study found that the probability of a household perceiving welfare improvement
increases with assets availability and household size but decreases with the age of the
household. If a household owns assets, it is likely to perceive that the welfare has been
improved by 0.293 units. Furthermore the household size is likely to be perceived to make
welfare better by 0.045 while it decreases the probability of the household perceiving that
their welfare has been worse by 0.049
Variable
outcome 1(worse)
outcome 2(same)
outcome 3(better)
dy/dx P>z dy/dx P>z dy/dx P>z Gender 0.022 0.765 0.021 0.698 -0.043 0.594 Age 0.010*** 0.002 0.0007 0.783 -0.011*** 0.004 Marital Status 0.057 0.476 -0.0187 0.757 -0.038 0.664 Education 0.153 0.118 -0.085 0.421 -0.068 0.609 Household Size -0.049*** 0.008 0.0041 0.73 0.045** 0.014 Log of Consumption
Expenditure 0.017 0.747 .00068 0.986 -0.017 0.765 Log of Assets Owned -0.169 0.129 -0.1247 0.226 0.293** 0.019 Log of Land 0.123 0.247 0.105 0.285 -0.229* 0.053 Biodiversity After PES 0.038 0.71 0.101* 0.099 -0.139 0.222 Forest Size After PES 0.039 0.677 -0.077 0.316 0.037 0.734 Years lived in The Village -0.001 0.679 -0.0006 0.756 0.001 0.57 Participation -0.308*** 0.000 -0.111** 0.048 0.420*** 0.000 Forest Products 0.108 0.266 -0.122** 0.027 0.013 0.895

68
The results further show that the age of household head is likely to determine how they
perceive their welfare, For example an increase in the age reduces the probability of
belonging to the group that perceive their welfare as being better by 0.011 units, since with
old age the ability to obtain forest products is reduced due to the distance to obtain and
hence make use of the trees planted due to PES project.
Moreover the probability of a household perceiving that their welfare is better increases
with household participation in PES program by 0.420 units but household participation
reduces probability of welfare being perceived worse or being the same by the household
by 0.308 units and 0.111 units respectively. The results further show that if the household
own land is likely to perceive that their welfare is better but with an increase in the
ownership of land reduces the probability of perceiving welfare better due to PES by 0.229
units since land ownership could have been a result of clearing more forest land so as to
acquire land for agriculture.
An increase in Biodiversity availability after PES introduction is likely to increase the
probability of household perceive welfare being the same by a 0.101 units but its not the
case with availability of forest products as an increase in forest products reduces the
probability of households perceiving welfare being the same by 0.122 units.
It is surprising to find that majority of the variables that characterize the household’s
welfare are not significant under “same” or “better”. Consumption expenditure for their
daily livelihood could be the earliest signal on whether their welfare has become better or is

69
still the same. Variable like education level which is likely to explain they perception on
welfare was found insignificant. The education level is likely to influence the perception on
welfare improvement as a result of the PES since more educated people are likely to
perceive welfare gain from PES as compared to uneducated people. The insignificant of
education variable could be due to the lack of significant variation in education level among
the households. Majority of the households have primary level education.
5.7 Household Perception on Forest Size and Biodiversity.
Table 5.8 Marginal Effects of Probit Regression Results on perception of the forest size Variable dy/dx Std. Err. z P>z
Gender 0.147** 0.074 1.97 0.048 Age -0.004 0.003 -1.5 0.132 Education -0.031 0.11 -0.27 0.788 Marital Status 0.0349 0.083 0.42 0.675 Household Size 0.0242 0.017 1.37 0.172 Years lived in the Village 0.0075*** 0.0026 2.83 0.005 Log of Assets -0.137* 0.078 -1.76 0.078 Log of Consumption Expenditure -0.054 0.052 -1.04 0.298 Log of Land 0.1116 0.073 1.52 0.128 Forest Size After PES -0.306*** 0.074 -4.1 0.000 Biodiversity After PES -0.200** 0.089 -2.22 0.026 Forest Products 0.1826** 0.072 2.51 0.012 Participation 0.0575 0.076 0.75 0.455
* Significant at the 10% level; ** significant at the 5% level; *** significant at the 1% level.

70
Table 5.8 presents marginal effects of the Probit model estimates of the determinants of the
change in forest size which gives the situation on the quality of the forest from introduction
of PES. The marginal effects show that one unit increase in the independent variable
increases/decreases the probability of the dependent variable by the magnitude of the
change.
Gender is positive and statistically significant at 5% this suggests that the probability of
perception as the forest size increase if the household is male headed. Furthermore, one
year increase in the time lived in the village by household increases the probability on their
perception of forest size change from PES activities by 0.0075 which is statistically
significant at a 1%.
The increase in Forest size as a result of PES activities reduces the probability of perceiving
the forest has been destructed. Among the strategies of PES is to encourage villages to plan
tree in their own farm, which they can make use for their fuel wood and other NTFP needs
at the household level.. This is also the case on the perception of Biodiversity availability in
the forest after PES activities which reduce the probability by 0.2 units of perceiving
further loose of biodiversity.
Moreover an increase in forest products increases the probability of perceiving an
improvement in the forest cover by 0.182 units since with PES people are able to obtain
forest products from the trees that they planted in their own farm. An increase in the asset
ownership reduces the probability on the perception of the improved forest cover by 0.137
units.

71
Table 5.9 Marginal Effects of Probit Regression Results on perception of biodiversity in the forest
Variable dy/dx Std. Err. z P>z
Gender 0.084 0.0814 1.04 0.297
Age -0.006* 0.003 -1.88 0.06
Education -0.003 0.131 -0.03 0.979
Marital Status 0.0214 0.089 0.24 0.81
Household Size 0.0171 0.017 1 0.319
Years lived in the Village 0.0104*** 0.0029 3.52 0.000
Log of Assets -0.066 0.089 -0.74 0.46
Log of Consumption Expenditure 0.010 0.057 0.19 0.853
Log of Land 0.0744 0.083 0.89 0.375
Forest Size After PES 0.059 0.107 0.56 0.579
Biodiversity After PES -0.372*** 0.090 -4.09 0.000
Forest Products 0.363*** 0.07 4.59 0.000
Participation 0.0489 0.084 0.58 0.564
* Significant at the 10% level; ** significant at the 5% level; *** significant at the 1% level.
Table 5.9 presents marginal effects of the Probit model estimates of the determinants of the
change in biodiversity as a results of the introduction of PES.
Age is negatively and statistically significant at 10%. This suggests that the higher the age
of a household head, the lower the probability of perceiving an improved change of
biodiversity in the forest. Thus as the age of a household head increases, there is a 0.006

72
units chance of the household perceiving a reduction in the availability of biodiversity.
Furthermore, one year increase in the time lived in the village by household increases the
probability on their perception of a change in Biodiversity from PES activities by 0.0104
units which is statistically significant at 1%.
An increase in forest products increases the probability of perceiving an improvement in
biodiversity by 0.363 units since with PES people are able to obtain forest products from
the village forest which is a result of planting trees by the households. The perception of
Biodiversity availability after PES activities reduces the probability by 0.372 units.
Given the two scenarios, before and after PES, on the quality and availability of resources,
it is observed that there is a difference with regard to the forest products. This difference as
reported by the results from the Probit model are attributed to the dependent variable used.
Using the opinion of households concerning the forest size and biodiversity as dependent
variables in the Probit model may have impacted the results as regards to availability of
forest products of the households. This is the case because some households make use of
forest products like reeds, palms as building materials while others sell them as a source of
income. With PES activities, the availability of such products has decreased, since
households are prevented from entering the forest. This explains the differences in
households’ perceptions in regard to changes of the forest size and biodiversity.

73
5.8 Chapter Summary
This chapter presents the results and interpretation of data concerning the impact of PES
project in Kibungo Juu ward towards reducing poverty. Four types of analysis were
employed. These include; Propensity Score Matching (PSM), Descriptive analysis,
ANOVA analysis and Probit regression analysis. This assessment has revealed that there is
a difference in welfare between households who are under the PES project and those that
are not under the project. From the PSM, the assessment shows that there is a 36.9 percent
positive impact of PES participation of the outcome. From the wealth index assessment
shows that a big percentage of the households with lower index value fall under the non–
participating group which is 55% of all households falling in non-poor category of the
study area while from the supported group only 45% were found to fall under the poor
category.
The results from the Logistic regression indicate that; Age, Household size, asset
ownership, land, availability of forest products are significant. This shows that these
variables contribute to the socioeconomic status of the households. The participation
variable is also found to be significant, implying that the households supported by PES are
less likely to fall under the poor category. The study findings from the ANOVA analysis
also show that; the existing difference in poverty status is as a result of the existence of the
PES project in the study area. More so, from the perceptions of the households, the results
show that the households are satisfied by the efforts of the PES project in regard to;
improvement in their welfare, increase in the forest size and the availability of biodiversity.

74

75
CHAPTER SIX
CONCLUSIONS AND RECOMMENDATION
6.1 Introduction
This chapter provides concluding remarks based on the field survey and from the analysis.
Based on the findings, some policy implications to address welfare issues were formulated.
We conclude by suggesting areas for further studies that were identified but could not be
explored.
6.2 Main Conclusions
This study main objective was to evaluate the impact of PES on poverty reduction for the
participating communities, mainly the significant differences in poverty level between
participants and non- participants in the program. Four villages from Uluguru that are in the
program were chosen for this study. Sustainable livelihood in this study was defined in
relation to two outcomes, which are poverty reduction and improvement of resource base.
The project main focus is on conservation practices to ensure sustainable flow of water,
while addressing issues related to poverty alleviation.
The PES project is as an attempt by the Government of Tanzania through WWF and CARE
to improve the management of a substantial and long lasting conservation while alleviating
rural poverty by giving special attention to increasing the participation of the rural poor in
PES schemes as a view to contributing to economic growth. In this regard PSM was
employed to assess the difference in welfare status between participants and non-
participants.
76
Thus, the study singled out two groups in the communities in the four different villages
which receive assistance from PES project. Given the fact that the study was addressing the
comparison between the two groups, no one theory was found to be sufficient to address
this issue. The main research questions that have been addressed in this study were to find
out if PES has any impact on the welfare of the communities in Uluguru. If there is any
significant differences in poverty level between people who participate in PES and those
who do not participate in the program. If there are any improvement in forest cover since
the implementation of PES program and the benefits that have been obtained by Uluguru
communities for having PES. In the process of exploring what more should be done by the
project so as to improve the household’s standard of living. The aim has been to come up
with the recommendations for what the project can do more in order to achieve its objective
of poverty reduction.
The study found that, there is difference in poverty status between participants and non-
participants in the study area. Using wealth index it was revealed that households who
don’t involve themselves in PES are the ones who have a large percentage of poor people in
their community. This was proved by ANOVA analysis that the difference in welfare status
between the two groups in the study area was as a result of the impact of PES project in the
community. The impact of the project was also supported by the Multinomial probit
regression results which found that the household who is in the project is more likely not to
be poor
From the results it was observed that households from the study area have benefited from
PES project. The project has assisted several targets in this study, by providing them with

77
bush knifes, goats, hoes, tree and crop seedlings, and manure. Also the respondents were
able to provide their views on how they perceive their standard of living before and after
the project. From this it was found that there was difference between the two time periods.
In assessing the availability of the resources after the PES project, it was revealed from the
households that the project has an impact on the forest Biodiversity and size. Generally,
material life of the households were found to be poor in case of houses and the construction
material, where it was found that many houses in the study area are poor made of mud and
poles in terms of wall materials, roofed with grass and having earth floors. Here the
difference between the groups was found to be small.
6.3 Recommendations and Agenda for Future/Further Research
The study set out to assess the impact of PES project in Kibungo Juu. This study discovered
that the forest conservation project needs to know what the households prefers more to be
done before they start any implementation since it was observed during this study
stakeholders concentrated more on the project success than the success of it and
improvement of the households welfare. For example they insisted households to plant food
crops and trees so as to conserve water sources but there were no incentives given for
planting the trees as they promised them or provide them with markets for the crops
harvested.
Furthermore, not all the areas covering Uluguru Nature Reserve were taken into account in
the PES project because the core source of water in the Ruvu river was considered but the
down stream villagers were known in conducting illegal activities like mining which made
the water dirty. Therefore in order to improve conservation activities and welfare for the

78
households along Uluguru Mountains that live along the Ruvu River Basin there is a need
to cover a bigger area. It could thus be interesting for future studies to take in consideration
of other villages not included in this study.

79
REFERENCES
Abadie ,A. and Imbens, G (2002) estimation of casual effects using propensity score
weighting. An application to data on right heart cathelerization.
Abadie ,A. and Imbens, G. (2006) failure of the bootstrap for matching estimators.
Econometrica vol76, No.6 (Nov, 2008), 1537-1557
Burgess, N. (2004). How many species are confined to the Eastern Arc Mountains?
Conservation and Management of the Eastern Arc Mountain Forests Project.
Ministry of Natural Resources and Tourism. Project Report No: 2004/01.
CARE-WWF (2007) Hydrologic and land use/cover change analysis for the Ruvu River
(Uluguru) and SigiRiver (East Usambara) watersheds. EPWS Phase I-Making
the Business Case. Dar-es-Salaam,
Dehejia, R. and Wahba, S. (1998) Propensity score matching methods for non experimental
Causal studiesNBER working paper 6829
Ellis, F .1999. Rural livelihood diversity in developing countries: evidence and implication.
Natural Resource Perspective 40
Ferraro, P and.A (2004) Direct payments to conserve biodiversity. Science, November 29,
2002

80
Forest and Bee Keeping Division, Extension and Publicity Unit, Tanzania. 2006.
“Participatory Forest Management in Tanzania: Facts and Figures.” Dar-es-
Salaam: Government of Tanzania, Ministry of Natural Resources and Tourism
Produced by the, Forest and Bee Keeping Division Extension and Publicity Unit.
Gervas,J. (2010) The Impact Of The Coastal And Marine Environment Management
Projects on the Coastal Communities’ Sustainable Livelihoods: The Case Of
MACEMP – Mafia.
HBS, 2007, National Bureau of Statistics. Household Budget Survey
Heckman, J. and Hotz, .V. J. (1989) ‘Choosing among Alternative Methods of Estimating
the Impact of Social Programs: The Case of Manpower Training’, Journal of the
American Statistical Association, 84(408), 862-874
Heckman, J., Lalonde, R. and Smith, J. (1999) The economics and econometrics of
Active labour market programs in Ashen felter, O. and Card, D. Handbook of
labor economics vol III, Amsterdam.
Hope (2005) fire, livelihoods and environmental change in the middle Mahakam (submitted
manual script)
International Food Policy Research institute (2008) Impacts of a Pro-Poor Community-
Driven Development Project in Nigeria CGIAR

81
Kiss, A, (2004). Making biodiversity Conservation a land use priority. In: getting
Biodiversity Project work: Towards more effective Conservation &
Development. T. Mcshane & M. Wells, eds. Columbia University Press, New
York
Landell-Mills N and I.T. Porras.(2002). Silver bullet or fool’s gold? A global review of
markets for forest environmental services and their impact on the poor,
Instruments for Sustainable Private Sector Forestry. London: IIED
Lokina,R. and Kahyarara,G.(1999) Modeling Values of Ecosystem Benefits and Design of
Payments for their Services in Lower Rufiji Basin. University of Dar-es-Salaam
Lokina, R and M. Banga (2010), Participatory Forest Management Perceptions and
Opinions of Forest Dependent Communities in Tanzania University of Dar es
Salaam
Robinson, E.J.Z., Albers, H.J., Lokina, R. and Ngeleza,G., (2008) Kibaha Tanzania’s
Forest Protection, Poverty Alleviation Projects, NTFPs and Charcoal Production:
Modeling Multiple Tools, Goals, and Actors
Rubin,G. and Thomas,S.J. (1996) Misspecification in Recursive Macroeconomic Theory. University of Chicago

82
Lokina, R.and E.J.Z Robinson (2009). Determinants of Successful Participatory Forest
Management in Tanzania Policy Brief
Lovett, J. C., Di Falco, S. And. Adhikari, B., (2004). Household characteristics and forest
dependency: evidence from common property forest management in Nepal.
Ecological Economics,48, 245–257.
Luca Tacconi1, Sango Mahanty, Helen Suich (2009) Assessing the livelihood impacts of
Payments for environmental services: implications for avoided deforestation, XIII
World Forestry Congress Buenos Aires, Argentina
Malimbwi, (2002) Forest extent and ownership in Tanzania. Consultancy report, Tanzania
Conservation and Management Project (TCMP), Forestry and Beekeeping
Division, Dar es Salaam Tanzania
Ministry of Natural Resources and Tourism(2008) Forestry And Beekeeping Division
Management Plan For Uluguru Nature Reserve Mvomero And Morogoro Rural
Districts And Morogoro Municipal - Morogoro Region Five Years Plan.
Mkenda A. F. 2007. Marine parks and household poverty in Tanzania: a baseline analysis.
Tanzania Journal of Development Studies 7, 48-63.
Mkenda, A. F. 2009. A report on household economics baseline survey in coastal
communities: Rufiji, Mafia and Kilwa districts. WWF-Tanzania Project Office.
MNRT (Tanzania Ministry of Natural Resources and Tourism). 1998. National Forest
Policy (March)

83
National Bureau of Statistics Tanzania NBS (2001); Household Budget Survey 2000/01
Dar es Salaam, Tanzania
National Bureau of Statistics Tanzania(NBS). 2010. Household Budget Survey 2010;
Chapter 7: Income and poverty inequality. Dar es Salaam, Tanzania.
National Bureau of Statistics Tanzania NBS (2007); “National Sample Census of
Agriculture in 2002/2003’, volume Ve: Morogoro Regional Report.
Robinson, E J.Z. and Lokina, R B (2011) “Efficiency enforcement and Revenue trade-offs
in Participatory Forest Management: An Example from Tanzania", (Forthcoming
Environment and Development Economics)
Rosa, H., S. Kandel, and L. Dimas. 2003. Compensation for environmental services and
rural communities. San Salvador: PRISMA
Rosenbaum, Paul R., and Donald B. Rubin. 1983. “The Central Role of the Propensity
Score in Observational Studies for Causal Effects.” Biometrika 70 (1): 41–55
Rubin, D. 1987. Multiple imputation for non-response in surveys. New York: John Wiley &
Sons.
Smith, Jeffrey, and Petra Todd. 2005. “Does Matching Overcome LaLonde’s Critique of
Nonexperimental Estimators?” Journal of Econometrics 125 (1–2): 305–53.
Tacconi, L. (2009) Reducing Emmission from deforeststion and forest degradation (REDD)
The Economic Survey (2010) ministry of finance and economic affairs, Dar es Salaam-
Tanzania

84
Theresia.F. (2006) The extent to which ecotourism has improved the livelihood of rural
people and conservation of forest resources on Uluguru mountains. University of
Dar es Salaam.
Trojano. M, F Pellegrini, D Paolicelli, A Fuiani, V Di Renzo (2007) Observational Studies:
Propensity Score Analysis of Non-randomized Data. From the Department of
Neurological and Psychiatric Sciences, University of Bari, Bari, Italy;
Department of Clinical Pharmacology and Epidemiology, Consorzio Mario Negri
Sud, Santa Maria Imbaro, Chieti, Italy
URT (United Republic of Tanzania). 2001. National Forest Programme in Tanzania 2001-
2010. Forestry and Beekeeping Division, Ministry of Natural Resources and
Tourism.
URT (United Republic of Tanzania). (2004). Clean Development Mechanism (CDM): a
national implementation guide. Prepared by Environmental Protection and
Management Services (EPMS), Dar es Salaam, with funding from the UNCTAD
Earth Council Carbon Market Programme, Geneva and the Government of
Norway.
Vonada,R, Phil Covell, Johannes Ebeling,Slayde Hawkins, Jacob Olander (2011) Building
forest carbon projects community engagement guidance.
Winrock International, 2004. Financial Incentives to Communities for Stewardship of
Environmental Resources: Feasibility Study. Winrock International, 1621 North

85
Kent Street, Suite 1200 Arlington, Virginia 22209 USA, www.winrock.org. 50
pp.
The World Bank, 2005: Carbon Finance Booklet, Overview of the World Bank Carbon
Finance Business, World Bank, Web Document assessed on 22nd June, 2005.
<htpp://carbonfinance.org/docs/CFBrochure1.pdf>
Wunder,Sven (2005), Payment for Ecosystem Services;nuts and bolts by center for
international Forestry Research.
Zahabu, E., Malimbwi R.E., and Ngaga, Y.M. (2004) Payments for Environmental Services
as Incentive Opportunities for Catchment Forest Reserves Management in
Tanzania