how to build a culture of engaged employees (p6)
TRANSCRIPT

SPEAKERS:CATHY BROWN, EXECUTIVE DIRECTOR, ENGAGE FOR SUCCESS
WILL DAVIES, DIRECTOR – HUMAN RESOURCES, TEACH FIRST
FACILITATOR:LAI-HAR CHEUNG, HUMAN RESOURCES MANAGER, NCVO
P6: HOW TO BUILD A CULTURE OF ENGAGED EMPLOYEES

Building a culture of engagementWill Davies – HR Director15th June 2015

Our Vision
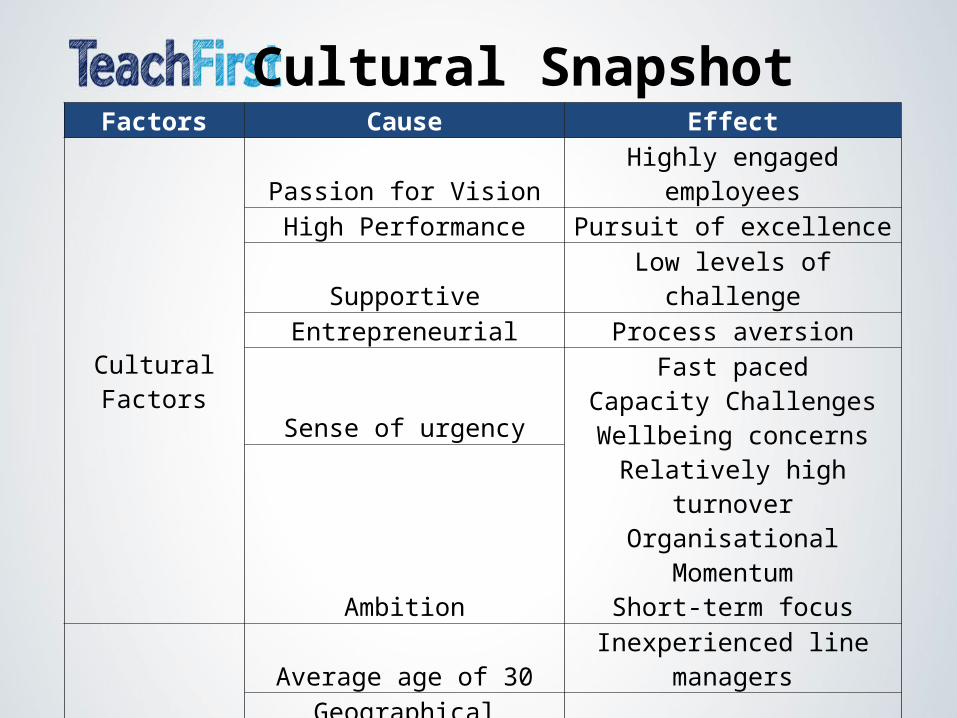
Cultural SnapshotFactors Cause Effect
Cultural Factors
Passion for Vision Highly engaged employeesHigh Performance Pursuit of excellence
Supportive Low levels of challengeEntrepreneurial Process aversion
Sense of urgency
Fast pacedCapacity ChallengesWellbeing concerns
Relatively high turnoverOrganisational Momentum
Short-term focusAmbition
General Organisational
Factors
Average age of 30 Inexperienced line managersGeographical Dispersion Risk of disconnectionDiversification of activity Risk of reduction of clarity
Tough funding climateEver growing requirement for
resourcefulness
Average tenure of 3.5 yearsLoss of organisational
knowledge
Why is our culture important
At Teach First, we are passionate about what we do. United in our belief that educational disadvantage is wrong, this is what drives us to aim high and strive for excellence.
Our shared motivation has already driven us to achieve great things. Working in collaboration with our partners we have changed the lives of thousands of pupils, but there is still so much more to be done. We remain committed to working ever harder to close the gap in achievement, access and aspiration between the UK’s poorest and wealthiest children.
We are proud of our work and approach it with positivity, energy and enthusiasm. Guided by our values, we feel empowered to make and challenge decisions in order to deliver the best results. We trust our colleagues’ integrity and this gives us the freedom to work in a way that suits our individual roles. We are rewarded for the impact we make, not the hours we work. We are supported to create opportunities for personal development and lead our career progression. We all share a sense of urgency in relation to our vision and believe that together we can, and will, make change happen.
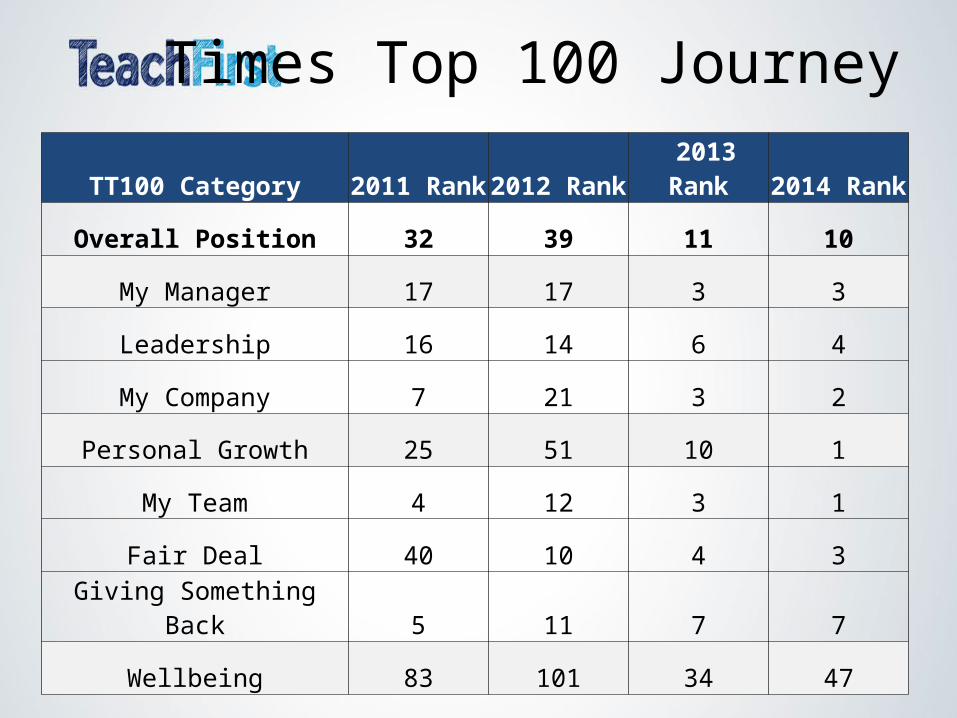
Times Top 100 Journey
TT100 Category 2011 Rank 2012 Rank 2013 Rank 2014 Rank
Overall Position 32 39 11 10
My Manager 17 17 3 3
Leadership 16 14 6 4
My Company 7 21 3 2
Personal Growth 25 51 10 1
My Team 4 12 3 1
Fair Deal 40 10 4 3
Giving Something Back 5 11 7 7
Wellbeing 83 101 34 47
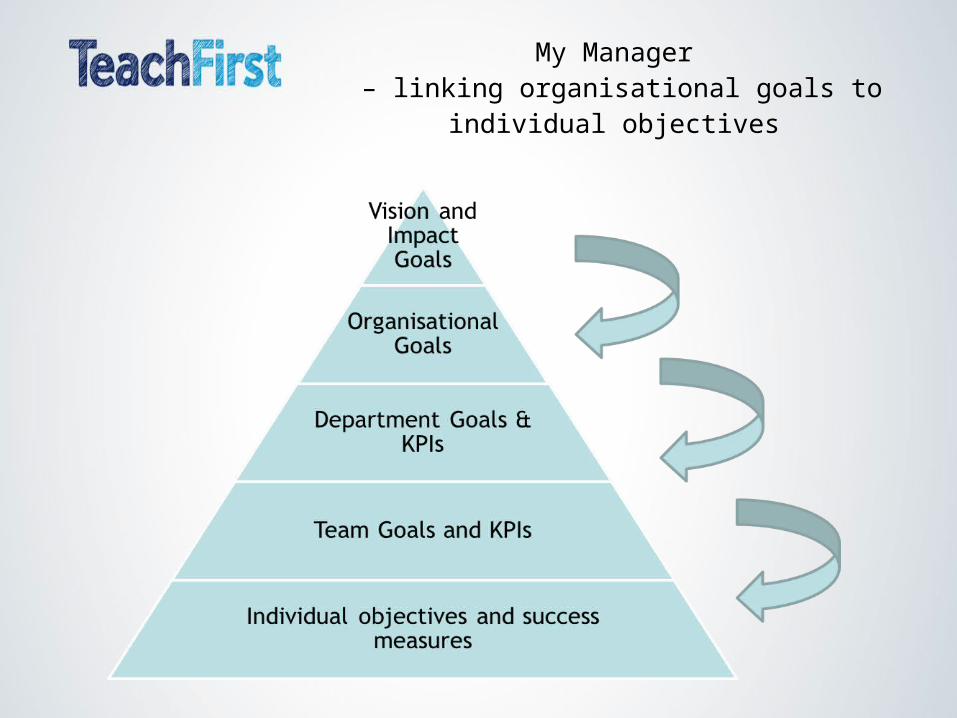
My Manager – linking organisational goals to individual
objectives
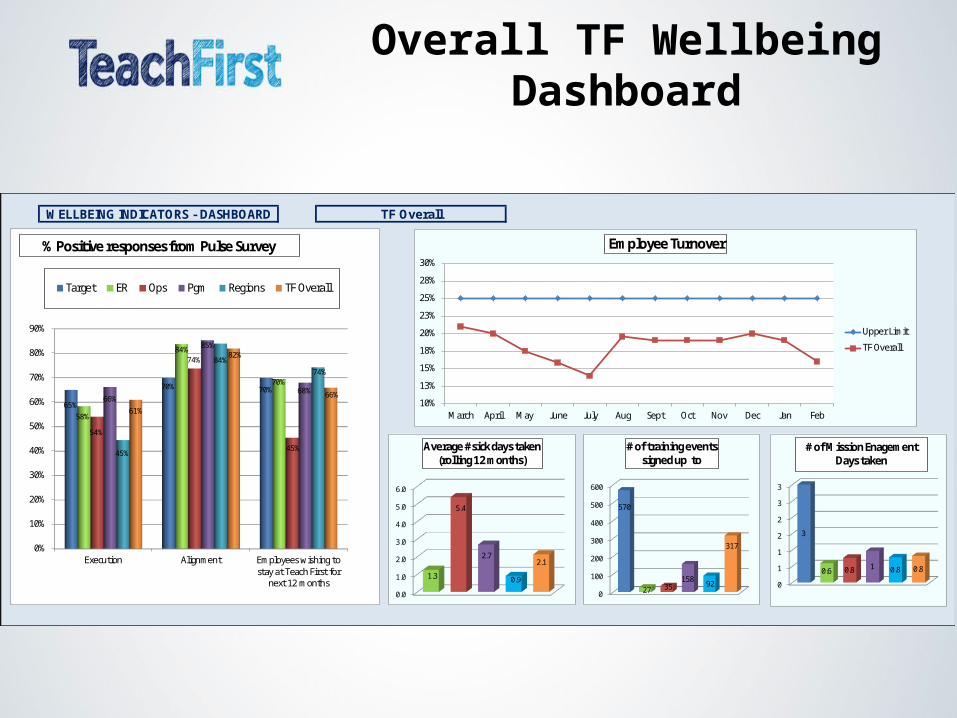
Overall TF Wellbeing Dashboard
WELLBEING INDICATORS - DASHBOARD TF Overall
0%
10%
20%
30%
40%
50%
60%
70%
80%
90%
Execution Alignment Employees wishing tostay at Teach First for
next 12 months
65%
70% 70%
58%
84%
70%
54%
74%
45%
66%
85%
68%
45%
84%
74%
61%
82%
66%
Target ER Ops Pgm Regions TF Overall
% Positive responses from Pulse Survey
0
1
1
2
2
3
3
3
0.6 0.8 1 0.8 0.8
# of Mission Enagement Days taken
0.0
1.0
2.0
3.0
4.0
5.0
6.0
1.3
5.4
2.7
0.9
2.1
Average # sick days taken (rolling 12 months)
0
100
200
300
400
500
600
570
27 35158 92
317
# of training events signed up to
10%
13%
15%
18%
20%
23%
25%
28%
30%
March April May June July Aug Sept Oct Nov Dec Jan Feb
Employee Turnover
Upper Limit
TF Overall
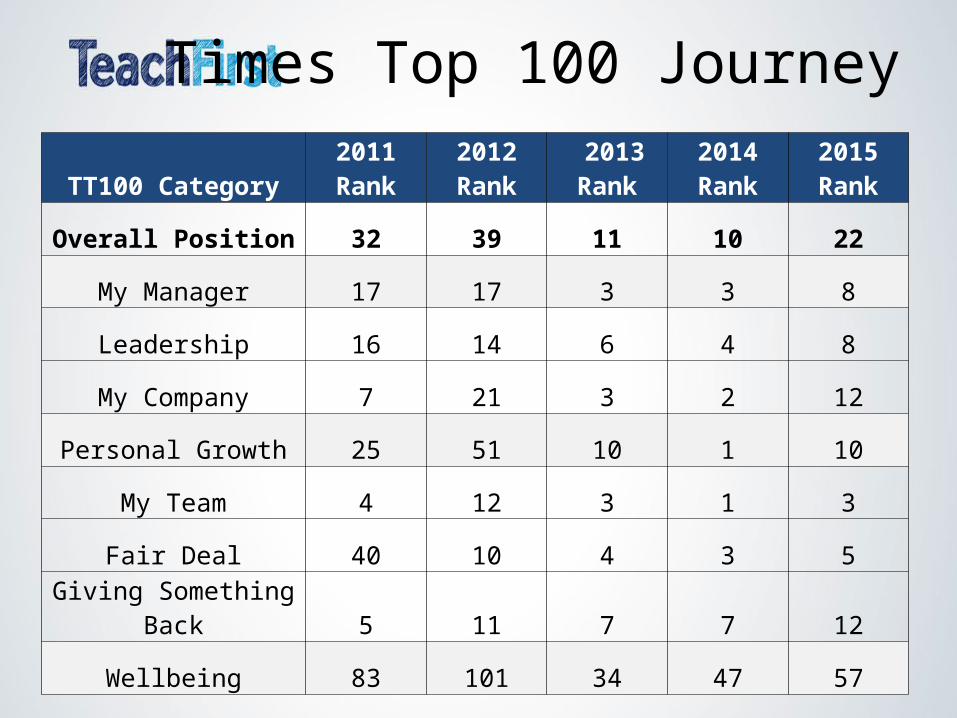
Times Top 100 Journey
TT100 Category 2011 Rank 2012 Rank 2013 Rank 2014 Rank 2015 Rank
Overall Position 32 39 11 10 22
My Manager 17 17 3 3 8
Leadership 16 14 6 4 8
My Company 7 21 3 2 12
Personal Growth 25 51 10 1 10
My Team 4 12 3 1 3
Fair Deal 40 10 4 3 5
Giving Something Back 5 11 7 7 12
Wellbeing 83 101 34 47 57