how to compare virtual devices (nfv) vs hardware devices ... · 2. the vnf itself: the second...
TRANSCRIPT
WHITE PAPER
915-3132-01 Rev. B, June 2014www.ixiacom.com
How To Compare Virtual Devices (NFV) vs Hardware Devices:Testing VNF Performance

2

3
Table of ContentsNetwork Functions Virtualization (NFV): An Introduction .......................... 4
NFV Performance Bottlenecks .................................................................... 5
Resiliency Score: How Does It Relate to NFV? ........................................... 6
Resiliency Score: Firewall Bake-off ............................................................ 7
Data Center Resiliency Score: A Real-World Example ............................... 9

4
Network Functions Virtualization (NFV): An IntroductionNetwork Functions Virtualization (NFV) is a new initiative and networking paradigm shift that aims to move running network functions like switching, routing, firewalls, broadband remote access server (BRAS), and others from purpose built specialized hardware to on commercial off-the-shelf (COTS) server-based platforms. It achieves this through the virtualization of network functions by the creation of Virtual Network Functions (VNFs) which run on the COTS hardware.
Figure 1: Vision for Network Functions Virtualization
Since the foundation of NFV is based on virtualization, it has the numerous benefits virtualization offers, which include:
• Reducing CAPEX: This is realized by running network functions on COTS hardware, as opposed to traditional purpose build specialty platforms.
• Reducing OPEX: This is achieved by the savings realized by reducing space, power and cooling requirements of equipment and simplifying the roll out and management of network services.
• Delivering agility and flexibility: This is achieved by ability to scale virtual machines (VNFs) up or down to address changing network demands.
• Reducing time to market: The very nature of running network functions in software enables operators to roll out new services faster than ever. It also significantly reduces the risk to trial and deploy new services.
The reason this has become so important is the formation of the ETSI ISG group for NFV. In 2012, thirteen leading network operators banded together and produced a white paper outlining the need for virtualized functions as well as integrated orchestration and management. The ETSI ISG for NFV has grown to over 140 participating companies within a year, all of which are (or should be) Ixia customers.
VIRTUALIZATION LAYER
Network Hardware
Server
Virtual Network Function (VNF)
Router Firewall WAN OP
WAN OP
DPIBRAS Session Controller
Router Firewall
VMVMVM
Network FunctionsVirtualization (NFV)
5
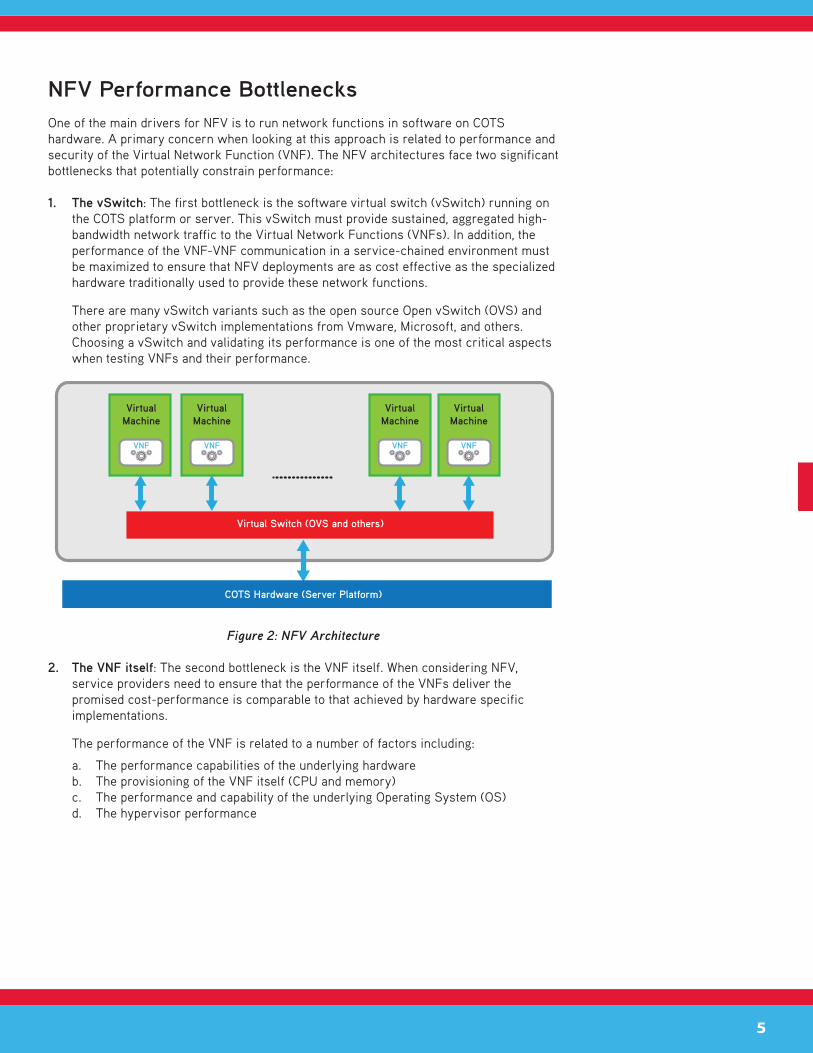
NFV Performance BottlenecksOne of the main drivers for NFV is to run network functions in software on COTS hardware. A primary concern when looking at this approach is related to performance and security of the Virtual Network Function (VNF). The NFV architectures face two significant bottlenecks that potentially constrain performance:
1. The vSwitch: The first bottleneck is the software virtual switch (vSwitch) running on the COTS platform or server. This vSwitch must provide sustained, aggregated high-bandwidth network traffic to the Virtual Network Functions (VNFs). In addition, the performance of the VNF-VNF communication in a service-chained environment must be maximized to ensure that NFV deployments are as cost effective as the specialized hardware traditionally used to provide these network functions.
There are many vSwitch variants such as the open source Open vSwitch (OVS) and other proprietary vSwitch implementations from Vmware, Microsoft, and others. Choosing a vSwitch and validating its performance is one of the most critical aspects when testing VNFs and their performance.
Figure 2: NFV Architecture
2. The VNF itself: The second bottleneck is the VNF itself. When considering NFV, service providers need to ensure that the performance of the VNFs deliver the promised cost-performance is comparable to that achieved by hardware specific implementations.
The performance of the VNF is related to a number of factors including:
a. The performance capabilities of the underlying hardwareb. The provisioning of the VNF itself (CPU and memory)c. The performance and capability of the underlying Operating System (OS)d. The hypervisor performance
VNF VNF VNF VNF
VirtualMachine
Virtual Switch (OVS and others)
COTS Hardware (Server Platform)
VirtualMachine
VirtualMachine
VirtualMachine

6
Resiliency Score: How Does It Relate to NFV?Ixia’s BreakingPoint Resiliency Score™ and the Data Center Resiliency Score™ establishing standards against which network performance and security (physical or virtual) can be measured. Each score provides an automated, standardized, and deterministic method for evaluating and ensuring resiliency and performance.
By using the Resiliency Score, organizations can:
• Measure the performance of Virtual Network Functions (VNFs) and compare it to its physical counterparts
• Measure the effect on performance with changes to virtual resources (VMs, vCPUs, memory, disk and I/O) enabling you to fine tune your virtual infrastructure to ensure maximum performance
• Understand the exact performance, security, and stability of competitive products in a fraction of the by selecting the right vendor
• Right size your infrastructure to avoid performance bottlenecks, security breaches, and outages
• Definitively measure the number of concurrent users a virtualized server will support before response time and stability degrade
• Measure application performance in physical and virtual environments and roll out new application, services and additional users with confidence
• Certify that changes to the virtual environment will not negatively impact existing capacity and that any new application mix or device remains optimized
The Resiliency Score is calculated using standards by organizations such as US–CERT, IEEE, and IETF, as well as real-world traffic mixes from the world’s largest service providers. Users simply select the network or device for evaluation and the speed at which it is required to perform. The solution then runs a battery of simulations using a blended mix of application traffic and malicious attacks. The Resiliency Score simulation provides a common network configuration for all devices in order to maintain fairness and consistency for all vendors and their solutions.
The Resiliency Score is presented as a numeric grade from 1 to 100. Networks and devices may receive no score if they fail to pass traffic at any point or they degrade to an unacceptable performance level. The Data Center Resiliency Score is presented as a numeric grade reflecting how many typical concurrent users a data center can support without degrading to an unacceptable quality of experience (QoE) level. Both scores allow organizations to quickly understand the degree to which infrastructure performance, security, and stability will be impacted by user load, new configurations, and the latest security attacks.
Data Center
4030User Base
7
Using the Resiliency Score, organizations can effectively benchmark the performance, security and scale of the VNFs and compare them to their physical counterparts. Through recursive tests, ixia customers can fine tune their virtual environments and ensure that the VNFs deliver the expected performance, thereby enabling them to transition to NFV environments with confidence.
Resiliency Score: Firewall Bake-offAs mentioned above, the vSwitch you use can have a major effect on the performance of the VNF you wish to deploy. The two big items to look for are the packets per second performance, and any additional latency added by the vSwitch.
Packets per second performance will have a major impact on measurement. The Resiliency Score will typically give you a shocking result on the vSwitch. If this occurs, it generally means the system is not leveraging modern techniques for getting the packets from the wire to the CPU. This is not an issue with the test, but the actual real results. Systems leveraging quality network interface cards with quality drivers will improve the result. Systems that leverage the Intel DPDK (Data Plane Development Kit) will see an even greater improvement. It should be noted that the HyperVisor and the VNF need to take advantage of modern techniques in order to improve small packet performance, specifically in regards to 64 and 128 byte packet performance.
Some vendors will state that packets on the wire aren’t that size, that the average packet size is 512 to 576 – or something to that effect. However, analysis performed by in 2004, 2006 and 2009 by Sprint, BreakingPoint, and other networks showed that 99% of TCP packets are below 70 bytes and above 1400 bytes. This data shows that few packets lie in the middle. Granted, these statistics change based on the type of traffic on the network then – a network in 2014 may be different. TCP setups leverage three 64 packets and end with two 64 packets and ACK, with 64 bytes after the specific window size.
Latency is the next big area of concern. For example, if the hypervisor allows a monitoring tool to use promiscuous mode instead of a specific filtering, all VNFs on the vSwitch will suffer dramatic performance degradation. For improved latency, VNFs that will pass traffic to and from each other should be located on the same system (where possible). This removes the need to hit the network interface, a bottleneck. A word of caution: the performance (packets per second) of the vSwitch can be affected to a great degree if there is inter VNF communication. We suggest monitoring and understanding the packet rates of each VNF and take that into effect when planning your system.
With those two issues explained – let’s go on to our resiliency score. We highly recommend using a hardware-based test system to measure performance. You do not want variability when running the test. Our configuration for this test is as follows:
• Hardware-based firewall:
� In the first test, we configured the Ixia PerfectStorm chassis to run the Resiliency test
� The device under test was a hardware-based firewall
� The resiliency tests were run out of the box and the overall score received by the hardware-based firewall was 95

8
• Software-based firewall (Firewall VNF) :
� In the second test, we also configured the Ixia PerfectStorm chassis to run the Resiliency test. Its important to re-iterate that we recommend a using hardware-based test system to eliminate variability across test runs.
� The device under test was a software-based firewall provided by the same vendor
� The resiliency tests were run out of the box and the overall score received by the software-based firewall was 65
Investigation into the test results showed us what we expected to see. With the default configuration of the software-based firewall, the packets per second performance for small frame sizes was the most severely impacted metric. This resulted in a significantly lower resiliency score when running the software-based Firewall.
After the first run of the test, we changed the underlying HyperVisor to see if that had an impact on the performance. Once this was changed, we saw a significant improvement in performance and an improved resiliency score of 78. It is important in these scenarios, to change a one parameter at a time (as opposed to changing complete system configurations) so that you can easily isolate the bottlenecks in the VNF performance.
Further modifications were made to the provisioning, and accelerators like Intel DPDK were enabled on the software platform, resulting in an equivalent performance on hardware. At the end of multiple iterations, we were finally able to get the same resiliency score of 95 on both the hardware and software-based platforms.

9
Data Center Resiliency Score: A Real-World ExampleLet’s walk through a sample scenario for Data Center Resiliency. In the test performed, a customer was deploying Web servers to support a new online application. They had reached a decision point on whether to install a purpose built hardware-based web server or use its virtualized counterpart. With the virtual environment, each VM has the opportunity to have a certain amount of virtual hardware resources allocated to it.
The customer wanted to ensure that the web server could handle a minimum 8,500 users and needed to know how the virtual web server (VM) needed to be provisioned. For example, should I allocate two virtual CPUs (vCPUs) and 8G of RAM? Or can I get by with one vCPU and 4G of RAM? These are exactly the questions that can be answered by assigning the resources and then running the Data Center Resiliency Score to validate them. During this test, only web server tests for resiliency were run. The others (mail, file and database were disabled)
The resiliency score of the “physical” webserver showed that it was capable of handling the desired number of users. During the first run of the “virtual” web server, the VM were provisioned with one vCPU and 4G of RAM. Running the data center resiliency test resulted in a score of 4,500.
During the Data Center Resiliency Score process, a screen will indicate real-time progress as well as the instantaneous quality of experience (QoE), user count, and latency. The services not being tested are grayed out. We certainly could run Web, File, Database, and Mail at the same time and get a simultaneous view of the status on each.
The test was re-run by increasing the resources allocated to the VM running the Web Server and through successive runs, it was found that the optimal resource allocation needed to support the desired user scale was at 2vCPUs and 8G memory.

10
The resulting Data Center Resiliency score was 8,740.
Besides the score itself, the Ixia system also generates a report that summarizes the test results. For example, you can review the following graph and see how successful transactions varied as more and more users were added, eventually falling below the acceptable range, which in this case was 9,000 users.
Data Center
Build 74544
StrikePack 74543 17.Jan.2011
2
0
0
08740
User Base
0 25 50 75 100 125 150 175 200 225 250 275 300 325 350Time (s)
Perc
ent S
ucce
ss
Users
Success Users
375 400 425 450 475 500 525 550 575 600 625 65005001000150020002500300035004000450050005500
6000650070007500800085009000
50
101520253035404550556065707580859095
105Successful Txns vs. Simulated Users
100Success Range

11
About Ixia Ixia is an active participant in the ETSI ISG for NFV, a chair on the Open Networking Foundation, and has ongoing involvement in other leading industry organizations focused on virtualization. We continue to work with equipment manufacturers and service providers at the forefront of virtualization in helping define best practices for a smooth and profitable migration. As “paradigm shifts” become the norm in data communications, our unrivaled experience working with leading networking equipment manufactures and providers worldwide helps in both in transforming networks and fast-tracking the delivery of compelling new services using virtualized infrastructures.
Ixia’s unique, comprehensive portfolio of hardware and virtualized test and monitoring solutions deliver the “lab to live” insights needed to accelerate and maximize the benefits of NFV throughout the deployment life-cycle. For more information on Ixia’s leadership in virtualization performance testing solutions please visit www.ixiacom.com
WHITE PAPER
Ixia Worldwide Headquarters26601 Agoura Rd.Calabasas, CA 91302
(Toll Free North America)1.877.367.4942
(Outside North America)+1.818.871.1800(Fax) 818.871.1805www.ixiacom.com
Ixia European HeadquartersIxia Technologies Europe LtdClarion House, Norreys DriveMaidenhead SL6 4FLUnited Kingdom
Sales +44 1628 408750(Fax) +44 1628 639916
Ixia Asia Pacifi c Headquarters21 Serangoon North Avenue 5#04-01Singapore 554864
Sales +65.6332.0125Fax +65.6332.0127
915-3132-01 Rev. B, June 2014