how to deal with stress-testing today
TRANSCRIPT
Regulatory Stress-testing | EBA, CCAR … Implementing an optimized Stress testing process
May 2014

2
Overview Why a dedicated offer now ?
THE RIGHT TIME
THE RIGHT EXPERTISE
THE RIGHT ANSWER
The difficulties encountered during the AQR exercise led to a new way of thinking the stress tests. Time is come to rethink it
All the results from AQR have been challenged. Each bank’s maturity would be judged on the capacity to face these new challenges (Data challenger models, PIT Parameters …)
Banks shouldn’t focus only on stress test results. Internal processes are also under judgment to ensure high quality and the timely delivery of the assessment (quality assurance process)
Key learnings of recent AQR & CCAR exercises suggest that some significant moves are required to fulfill market & regulators expectations That is why, based on our recent dialogues with the Financial industry, we have come to the conclusion that new objectives came to light:

Stress-testing | Overview – timeline of recent exercises
Focus | 2014 EBA stress test
Stakes | Key challenges and success factors
Contacts
Appendix
Agenda
1
2
3
4
3
5

4
Stress-testing| Overview – timeline of recent exercises Some background 1.
Stress testing is a key component of financial institutions risk management framework, helping them determine capital levels , but also spot emerging risks and take preventive actions
The 2008-2009 financial crisis highlighted some shortcomings in practices (i.e. less severe scenarios based on historical data, limited involvement of the top management, etc.) that prompted the Basel Committee to issue in May 2009 recommendations on how to conduct stress-tests*
For Institutions, in the short-term the main challenges are threefold:
- Methodology: quickly adopt and implement new approaches / scenarios proposed by supervisors - Project implementation: identify work blocks, wisely plan and provide with adequate resources - Time (submission): submit in time, under tight deadlines and with the appropriate quality of outputs
Incr
eas
ing
inte
nsi
ty,
sco
pe
an
d f
req
ue
ncy
* “Principles for sound stress testing practices and supervision”, Basel Committee on Banking Supervision, May 2009
Between 2008 and 2013, many stress-tests have been held to cope with the sovereign crisis or before a bail out of financial sectors in troubled countries: Greece, Slovenia, Spain, Portugal, Cyprus, Ireland. Stress-testing has become a regular regulatory process and used as a tool to test resilience of financial sectors
In 2014, the CCAR in US demonstrated that new generation of stress-tests are much more intensive and broader. The EBA stress-test will follow suit before the enforcement of the SSM (ECB new central supervisor). For banks, it’s no longer enough to meet current regulatory requirements (e.g. for ICAAP purposes)
2010/2011 EBA Macro Stress Tests
Today

5
Stress-testing| Overview – timeline of recent exercises Mounting regulatory pressure on financial institutions around the world 1.
BIS principles for sound stress testing practices and supervision
US Supervisory Capital Assessment Program (SCAP)
UK liquidity and reverse stress-testing
2009
Collapse of Lehman-Brothers: financial crisis hits US
The crisis spreads to Europe
2008
2nd EBA stress tests
US CCAR + CPAR (≥$10bn)
2011 US CCAR + DFAST
Company stress-tests (≥$50bn and $10bn- $50bn)
UK FDSF
2013
US CCAR + DFAST Company stress-tests
(≥$50bn)
2012
Enforcement of Basel III framework
2015
AQR + EBA stress-tests
BoE stress tests
HKMA liquidity stress-tests
CHINA ST
US CCAR + DFAST Company stress-tests
2014
1st EBA stress tests
2010
Stress-testing progressively has become a cornerstone amid increasing regulatory expectations

• Core templates: Minimum Data required by the EBA - Advance Data Collection (ADC): collected prior to commencing the stress test - Calculation Support and Validation data (CSV): supplied to CAs as input to their quality assurance process; Also used to automatically populate transparency templates - Transparency (TR): Data on stress test outcomes to be disclosed on a bank‐by‐bank basis.
• Additional templates: not required by the EBA but can be required by NCAs - Advance Data Collection (ADC)
6
Key aspects
• The process is not a substitute to existing obligations regarding stress-testing (i.e. ICAAP pillar 2) • Risk coverage : Credit risk, Market risk, Sovereign risk, Securitization, Cost of funding, operational risk (standard approach);
CAs may include additional risks • Assumptions : a static balance sheet , prescribed approaches to market risk and securitization, and a series of caps and floors on net interest
income, risk weighted assets (RWAs) and net trading income • Horizon : over the period 2014-2016 with 31/12/2013 as a starting point • Regulatory (capital) hurdles :
- 8% Common Equity Tier 1 ratio for the baseline scenario - 5.5% Common Equity Tier 1 ratio for the adverse scenario
• Banks will have a maximum of 4 months to complete the process (results due in October 2014)
Scenarios
Disclosures
• Baseline scenario : - Based on the winter 2014 forecast (EU) extended through a
model-based approach to cover the year 2006 (2016 is outside the 2-year horizon of the winter forecast)
• The results will be disclosed on a bank by bank basis consistent at least with 2011 EU-wide stress test. Components: the capital position of banks, risk exposures and sovereign holdings
• Banks are expected to cover potential capital shortfalls within 6 to 9 months after the release of the results
Focus| 2014 EBA stress – test (1/2) The most complex and comprehensive test to date 2.
Data
Risk modeling
Credit risk • Perimeter: banking book excluding counterparty credit risk. • Calculation of Point-in-time PD and LGD • ECB EL benchmarks available for banks
with no point-in-time models • Application of macro-economic scenario to
PIT and regulatory parameters • Regulatory risk parameters to be used for
stressed RWA calculation
Market risk • Simplified approach (Var-banks & Non-Var
banks) : projection of NTI based on bank’s historical loss (2009-2013)
• Comprehensive approach (Var-banks) : translation of macro-economic scenarios to project gains & losses on FV positions using internal models
• CVA and IRC also stressed • RWA: SVar used in adverse scenario
Securitization risk • FV positions : market risk methodology • Impairment estimates for positions not
held for trading • RWA based on risk profile (3 risk buckets)
Sovereign risk • FV positions : market risk methodology • Banking book: credit risk methodology for impairment estimates based on rating migration
• Stress-scenario : - Macro-eco: global debt markets sell-off, a rise in funding
costs, a new recession, and deep dives in property and equity prices.
- Market shocks: set of common stressed market parameters
Key elements • New Segmentation for Clients & Exposures in
the Banking book • Trading Book notional amounts to be re-valued
using IFRS 13 hierarchy • Higher granularity for asset classifications and
the Real Estate portfolio • ‘Simplified version’ of 2013 EBA Forbearance &
Performing/NPLs definitions to be used

7
Project Implementation/Governance/
Resources
Scenarios
Results/ Documentation
Focus| 2014 EBA stress – test (2/2) Preliminary questions that the banks start to ask 2.
Data
Risk modeling
• What processes? How to ensure involvement of the top management in the end-to-end process?
• What is the optimal mix of competences?
• What coverage of risks? Which portfolios? Which entities?
• What scenarios to be used? At which level of severity? What is the planning horizon?
• What models? What parameters to be stressed? How to translate macro-scenarios into risk factors? What level of sophistication? How to value capital impact?
• How to leverage on existing documentation? What are the new requirements?
• How to align the task of documentation with actual performance of the test? How to dot it on time ?
• What data are necessary inputs for scenarios and stress-tests? How to respond to additional data requests from regulators?
• What level of industrialization achieved by implementing (or not) a stress library?

8
3. Stakes | Key challenges and success factors (1/2) Key issues
Successful completion of a stress-
testing process
Data, systems & disclosures
Project implementation
Resources and capabilities
Methodology
Governance & communication
The limited period allowed for the exercises, require a very efficient project management to meet regulatory tight deadlines
Tasks need to be clearly defined, streamlined and rigorously monitored
Supervisors assess results as well as the way they are produced
Completeness, consistency (e.g. finance vs. risk data) and (more importantly) quality
Massive data from different sources
Compliance with stress test requirements (e.g. AQR results used as inputs)
Consistency with external definitions (e.g. EBA definitions of forbearance and NPLs) and accounting principles in force
Heavy documentation, flexibility to answer additional data requests from supervisors
Stress-testing is a very burdensome process.. Recent CCAR exercises suggest that banks will need more people dedicated to the process
The increased complexity and scope require a mix of quantitative, financial, IT and/or economic skills
Excellent capacity for the analysis of regulatory guidelines and identify which texts apply to the bank
Flexibility in incorporating new approaches in ST framework is key
Optimize internal modeling since supervisors increasingly rely on internal models and assess their quality
Translate macro-scenarios into risk factors Leverage on benchmark Detailed documentation of modeling
approaches used by the bank
More integrated approach across all areas and business lines of the bank (front office, finance, risk, etc.)
Board and senior management need to be involved in the development and operation of the stress-testing : close oversight and communication throughout the process
Failure to pass the tests, and the way to process the stress exercise, can lead to an unexpected impact on the firm’s reputation vis–à-vis the market or investors

9
3. Stakes | Key challenges and success factors (2/2) Why CH&Cie?
CH&Cie CREDENTIALS
We accompanied several tier 1 Investment banks in the development of their ICAAP / Stress-testing and risk appetite frameworks
Our experts performed several projects in response to the EBA stress test (design, implementation, impact calculation…) for leading actors of the industry
We are proud to leverage on our internal “Global research Analytics” quantitative department, and have realized extensive works on stress testing methodologies (Sensitivity test, Scenario analysis – historical & hypothetical - , Maximum Loss, Extreme Value Theory…)
Based on our extensive experience in the industry, we understand several banks individual set-ups, know the teams and specific constraints /obligations and modeling approaches
We can also provide with benchmark for our clients to access best practices (see appendix 5B & 5C)
Beyond the 2014 exercise requirements, our work will be designed in order to support periodic needs
A STATE of THE ART EXPERTISE
USED TO WORK UNDER HIGH PRESSURE
RESPECT of DEADLINES & FLEXIBILITY
A RESULTS-DRIVEN TEAM
HIGH QUALITY DELIVERY & COMPLIANCE WITH REGULATORY REQUIREMENTS
Key learnings of the AQR demonstrate the needs of a new approach combining strong and tailored skills

London
Paris
Hong Kong
10
4. Contacts
Our experts will remain at your disposal to discuss further the aforementioned topics
We will be very pleased to share with you the latest developments in implementing stress testing as well as best practices
Stéphane EYRAUD, CEO E-mail: [email protected] Phone number : + 44 78 34 55 03 98 + 33 (0)6 12 41 64 06
Benoit GENEST, Partner and Head of GRA E-mail: [email protected] Phone number : +33 (0)7 87 68 81 77
Ziad FARES, Manager E-mail: [email protected]
Phone number +33 (0)6 62 96 25 00
Matthieu SACHOT, Director E-mail: [email protected]
Phone number +852 9433 0753

Appendix A – Stress parameters – Methodologies
Appendix B – Benchmark on supervisory requirements
Appendix C – Benchmark on central bank models
Appendix D – Regulatory Stress testing - What is required from banks?
11
5. Appendix

Stress parameters - Methodologies Illustrative examples on PD
Different kinds of models can be used to translate a shift in PD or LGD parameters from macro economics data In terms of benchmarking, 5 types of methods are usually implemented (or derivative models)
Method Description Illustration
1
2
3
4
5
Diffusion Models
Regression models
Interpolation models
EVT (Extreme Value Theory)
Bayesian networks
• The model is based on a differential equation of the variable to be explained following the explanatory variables in order to translate the dynamics of evolution of this variable
• ARCH , GARCH models are part of this family
2
2
( )( ( ), ( ), ( ))
PDf X t Y t Z t
t
PD differential equation
Explanatory variable
functions (GDP …)
• The objective is to determine a causal relation between the PD
and explanatory variables
• In other terms, the goal is to put into equation the PD based on a combination of selected explanatory variables, which will lead to the projection of the PD
( ) (0,893. ( ( 1))
0,062. ( 2)
0,02. ( ) 0,54)
PD t InvLogit Logit PD t
Inflation t
Chômage t
• It’s an iterative method for projecting the PD based on the maximum of likelihood
• It’s done through an intermediary stage of assessment of the expectation and then of the maximization of the expectation
• The method is based on extreme values of the variables
• Answers to the question: How will evolve the PD if a extreme though plausible phenomenon occurs?
Change in initial
trend– Extreme event / Outliers
• Probabilistic model based on Bayes theory and conditional probabilities
• Thus it is used to infer the relation between the PD and the evolution of risk parameters
GDP
Unemploy-ment
Interpolation
Oil
PD
12
5A

Bank of Greece
Regulator
13
Theme Benchmark
Definition of default
In models based on loan performance, the key dependent variables are the NPL ratio, the LLP ratio and the historical default frequencies
Model used
Vector autoregressive model using a Logit transformation
Sample used
[2000Q1 - 2007Q4] : First, given our data length and the asymptotic properties of the VAR analysis, a re-estimation of the model is necessary once a new/revised data set comes available
Finally, only one economic indicator is modeled, yet the shock may be directly generated through a range of indicators that influence the level of the NPLs and interact with economic growth
Acknowledging the problems of inference associated with a VAR on a short data series
We find a significant effect of the changes in the euro exchange rates and the Euribor interest rates on the non-performing loan ratio while the effect of GDP growth, albeit small, is found to be significant too
Explanatory variables
Sample used
Explanatory variables
its Financial System Report (Bank of Japan 2007), the BoJ estimates a VAR model comprising five macroeconomic variables (GDP, inflation rate, bank loans outstanding, effective exchange rate, and the overnight call rate)
Explanatory variables
The model analyzes the relationship between a logit transformation of Canadian sectoral default rates and two macroeconomic variables (GDP and interest rate). particular, in stressful periods, when the default rate reaches its historical peak; without nonlinearities, even the extreme shocks would have had a very limited impact on default rates.
Explanatory variables
Bank of Japan
Bank of Canada
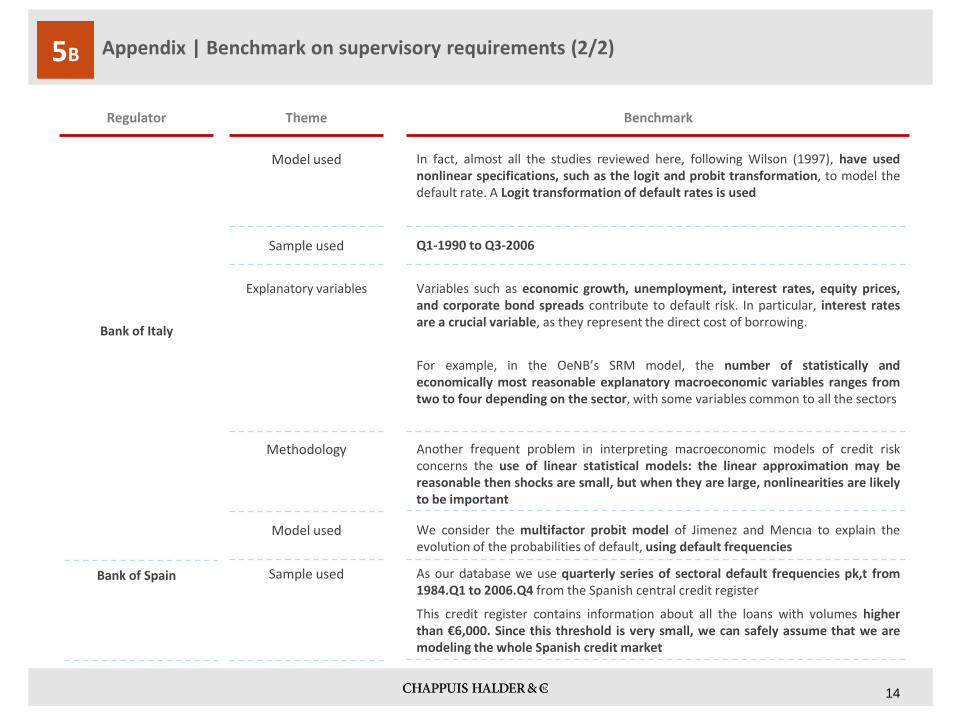
5B Appendix | Benchmark on supervisory requirements (1/2)
Bank of Italy
Regulator
14
Theme Benchmark
Model used
In fact, almost all the studies reviewed here, following Wilson (1997), have used nonlinear specifications, such as the logit and probit transformation, to model the default rate. A Logit transformation of default rates is used
Sample used
Q1-1990 to Q3-2006
Variables such as economic growth, unemployment, interest rates, equity prices, and corporate bond spreads contribute to default risk. In particular, interest rates are a crucial variable, as they represent the direct cost of borrowing.
Explanatory variables
We consider the multifactor probit model of Jimenez and Mencıa to explain the evolution of the probabilities of default, using default frequencies
Model used
Bank of Spain
For example, in the OeNB’s SRM model, the number of statistically and economically most reasonable explanatory macroeconomic variables ranges from two to four depending on the sector, with some variables common to all the sectors
Methodology
Another frequent problem in interpreting macroeconomic models of credit risk concerns the use of linear statistical models: the linear approximation may be reasonable then shocks are small, but when they are large, nonlinearities are likely to be important
As our database we use quarterly series of sectoral default frequencies pk,t from 1984.Q1 to 2006.Q4 from the Spanish central credit register
Sample used
This credit register contains information about all the loans with volumes higher than €6,000. Since this threshold is very small, we can safely assume that we are modeling the whole Spanish credit market
Appendix | Benchmark on supervisory requirements (2/2) 5B

Bank
15
Model
Bank of Canada
Explanatory variables Data
Logit transformation of default rates
- GDP Growth rate
- Unemployment rate
- Medium-term loans rate
Q1-1988 -> Q4-2005
Bank of England
Logit transformation of default rates
- GDP Growth rate
- Short term interest rate
- Equity return
No info
Bank of Italy
Logit transformation of default rates
- GDP Growth rate
- Interest rate
- Equity index
- Competitiveness index
Q1-1990 -> Q3-2006
Bank of Japan
Probit transformation of the probability of rating transition
- GDP Growth rate
- Interest rate
Q1-1985 -> Q4-2005
Bank of Spain
Probit transformation of the default rate
- Quarterely change in real GDP Growth
- Variation of 3-month real IR
- Term spread
Q4-1984 -> Q4-2006
Bank of Netherlands
Logit Transformation of default rates
- Real GDP growth
- Term spread
Q1-1990 -> Q4-2004
Appendix | Benchmark on central bank models (1/2) 5C

Bank
16
Model
Deutsche Bundesbank
Explanatory variables Data
Logit Transformation of Loan Loss Provisions
- Lagged dependent variable
- Credit Growth
- Real GDP Growth
- Variation short-term IR
Q1-1993 -> Q4-2006
ECB
EDF or euro-area corporates - Euro-area real GDP
- CPI inflation
- Real equity prices
- Real euro/US$ exchange rate
- Short term interest rate
Q1-1992 -> Q4-2005
Banque de France
Logit transformation of the probability of a rating transition
- GDP
- Short-term interest rate
- Long-term interest rate
No info
Oesterreichische National Bank
First difference of the Logit transforamtion of default rates
- Real GDP
- Unemployment rate
- Real short-term IR
- Real five-year IRrate
Q1-1969 -> Q4-2007
Swiss National Bank
Logit Transformation of Loan Loss Provisions
- GDP growth
- Unemployment rate
- Level of three month IR
Q1-1987 -> Q4-2004
Appendix | Benchmark on central bank models (2/2) 5C

17
ECB, EBA, NCA EC (economic scenario),
ESRB
Supervisor (s) / regulatory bodies
** China stress-tests details are set to be released in July 2014. At this point no relevant information on the process, methodology or scope are available
Eurozone
Regulatory Stress testing - What is required from banks? Stress tests approaches are aligned across regions
BoE / PRA / FPC
UK*
Federal Reserve
US
HKMA
HK**
EBA FINAL draft ITS (forbearance and NPLs exposures ), 20/02/2014
For IFRS banks: IAS 39, IAS 37, IFRS 13
Scope
Stress testing the UK banking system: guidance for participating firms, April 2014
CRD IV, IAS19
Dodd-Frank Act Stress-tests
TBD
At least 50% of each national banking sector,
At the highest level of consolidation
128 banks
Data requirements
8 major UK banks & building societies
At the highest level of UK consolidation
TBD
Historical/AQR Data – Core (ADC, TR, CSV) & Additional (CSV) Templates2,3
Risks covered (major)
FDSF (Firm Data Submission Framework) – Historical, Year-End Data & P/L Projections
FRY Reports – A/Q/M Data; P/L Projections
TBD
Credit and market risks, securitization, sovereign and funding risks
Scenarios
Credit and market risks,
securitization, operational risk and conduct costs, Pension risk, funding risks
“all potential sources of losses from all on/off balance sheet positions… potential to impact capital”
Liquidity risk (personal loan portfolios)
Regulatory Baseline Stress Scenario
Common EBA Baseline (except dynamic balance sheet)
Variant Stress scenario Bespoke Firm Stress
Baseline, Adverse, Severely Adverse;
Firms’ Scenarios
Personal loan consultation : 3% rise in interest rates
“different degrees of capital outflow”
Relevant regulations / accounting standards
CCAR : Large BHCs & FBO ( ≥ $50 bn in total consolidated assets)
DFAST : BHCs & FBO ( ≥ $10 bn)
Source : EBA, HKMA, Fed, BoE, Moody’s
* UK ST will complement those of the EBA with a more severe and UK-specific stress scenario (e.g. house prices down 35%, unemployment rising to 12% and interest rate to 4%) and four additional firms in the scope
5D

18
Bottom-Up & Top-Down; Firms’ Own Models
Modeling approach
Eurozone
Regulatory Stress testing - What is required from banks? (2) Stress tests approaches are aligned across regions
Bottom-Up /Granular; Firms’ Own Models
UK
Bottom-Up; Firms’ Own Models; Dynamic Projections
US
TBD
HK
Planning horizon 12 quarters (2014-2016)
Frequency
12 quarters (2014-2016) 9 quarters (30 sept.14-
Dec.15) TBD
Annual (2009-2011 EBA); 2014 (ECB)
Hurdles’ Requirements
Annual Annual (regulator-led) Semi-annual (bank-led)
Annual
8% CET1 for the baseline scenario
5.5% CET1 for the adverse scenario
Disclosure
7% CET1 for the baseline scenario (3% Tier 1 leverage ratio)
4.5% CET1 for the variant Stress scenario
CET1 ≥ 5% and above the required regulatory minimum levels in effect
TBD
Results in Oct. 14 (with
AQR results)
Results towards end of Q4
2014
Annual submission: 31/03
(disclosure in June) Semi-Annual submission:
31/03 and 05/07(March and September for disclosure)
TBD
Source : EBA, HKMA, Fed, BoE, Moody’s
5D