how to incorporate your pt’s into your qc program · how to incorporate your pt’s into your qc...
TRANSCRIPT

How to Incorporate Your PT’s into Your QC Program
Shawn KassnerSenior Product Manager
Phenova, Inc.

Covered Topics
1. Laboratory Proficiency Testing (PT) requirements2. PT 101 – The Basics 3. Acceptance Criteria – Where do the come from?4. How to expand use of your PTs and Quality Program5. How to expand your Quality Program

Laboratory PT Requirements• Maintain acceptable performance for the last 2 out of 3 PTs performed. • PTs must be purchased from a TNI accredited PT provider• PTs must be perfumed for each field of certification
Solid Waste (SOIL)
Drinking Water (Water Supply)
Waste Water (Water Pollution)
WET (Whole Effluent Toxicity)
Fields of Proficiency Testing (FoPT)

PT Study Basics
– 45 day study duration – Acceptance limits generated according to TNI FoPT Tables– PT reports are prepared for laboratories and submitted to
Division of Consolidated Laboratory Services by the PT Provide– PT Providers submit study summary to Proficiency Testing
Provider Accreditor for continued evaluation
TNI Compliant Chemistry/Microbiology PT Study
Phenova’s Accrediting Body: A2LA
A2LA website: Click Here

PT Study Basics
– Performed every 6 months– Water Pollution (WP) PTs can be reported in lieu of DMR-QA
• PT provider designate which WPs studies can apply
– DMR-QA • Composed of Chemistry, Microbiology and WET PTs• NOT a TNI compliant study • Regulated by the EPA• Performed once a year• 45+ day study duration • Make-Up PTs not required for “Not Acceptable” grading
Chemistry/Microbiology PT Study

PT Study BasicsField of Proficiently Testing (FoPT) Tables
FoPT Content
Analytes & Analyte Code
Acceptance Criteria
Proficiency TestingReporting Limits
ConcentrationRange
Visit TNI FoPT Webpage: Click Here
PT Reporting Limits: The lowest acceptable limit calculated from the lowest concentration

PT Acceptance CriteriaPT Providers determine Acceptance Criteria w/ FoPT Tables
Acceptance Criteria
Regression Equations
Study Mean +Est. Standard
Deviation Study Mean and
Standard DeviationFixed Limits
Visit TNI FoPT Webpage: Click Here
Acceptance Criteria Are Always Reported in 3 Significant Figures

Using PTs for Quality Control

Using PTs for Quality Control
Why Not Get More From Your PT Standard?
PTs Are The Most Expensive Standard
You Pay For The Standard
You Pay For The Analysis
Evaluate and Improve Your Labs Performance with its PT Data!!!
Because…
Using PTs for Quality Control
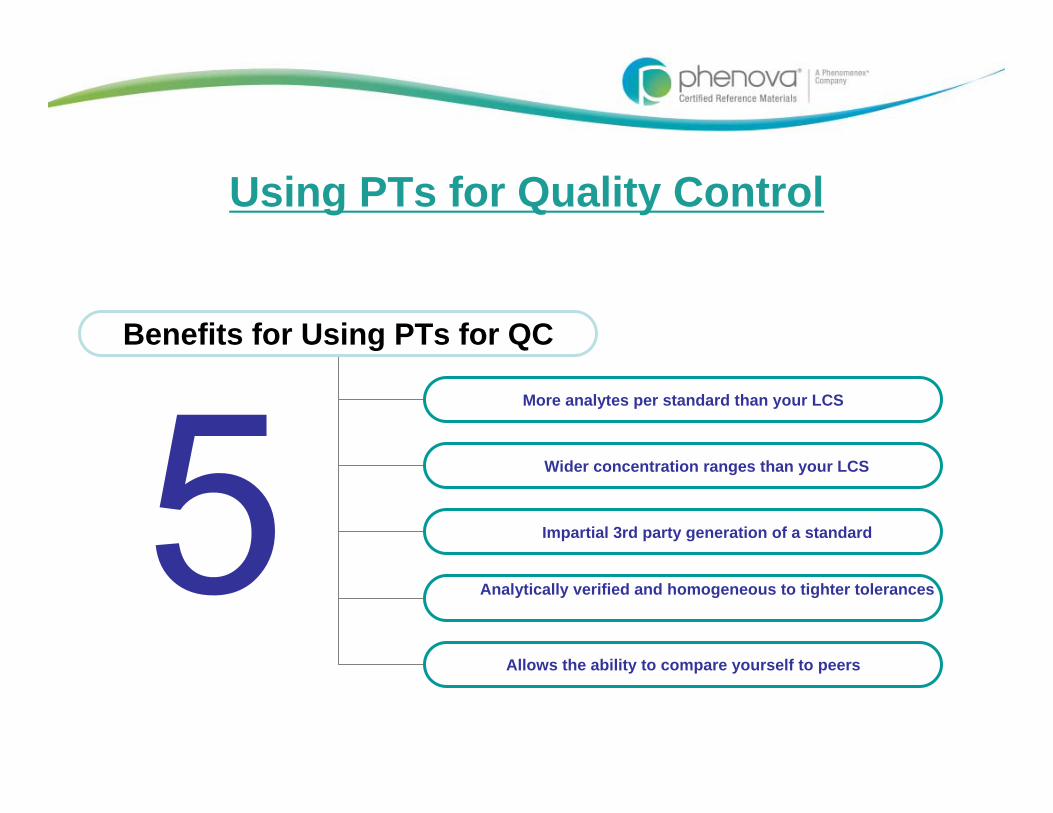
Benefits for Using PTs for QC
More analytes per standard than your LCS
Impartial 3rd party generation of a standard
Analytically verified and homogeneous to tighter tolerances
Wider concentration ranges than your LCS
Allows the ability to compare yourself to peers

Using PTs for Quality Control
Ways You Can Use Your PTs
Spot Analytical Trends
Test new methods/instruments & perform DOCs
Compares across laboratory analyses
See when issues happen, not just where
Monitor laboratory performance & gauge corrective measures

Case Studies
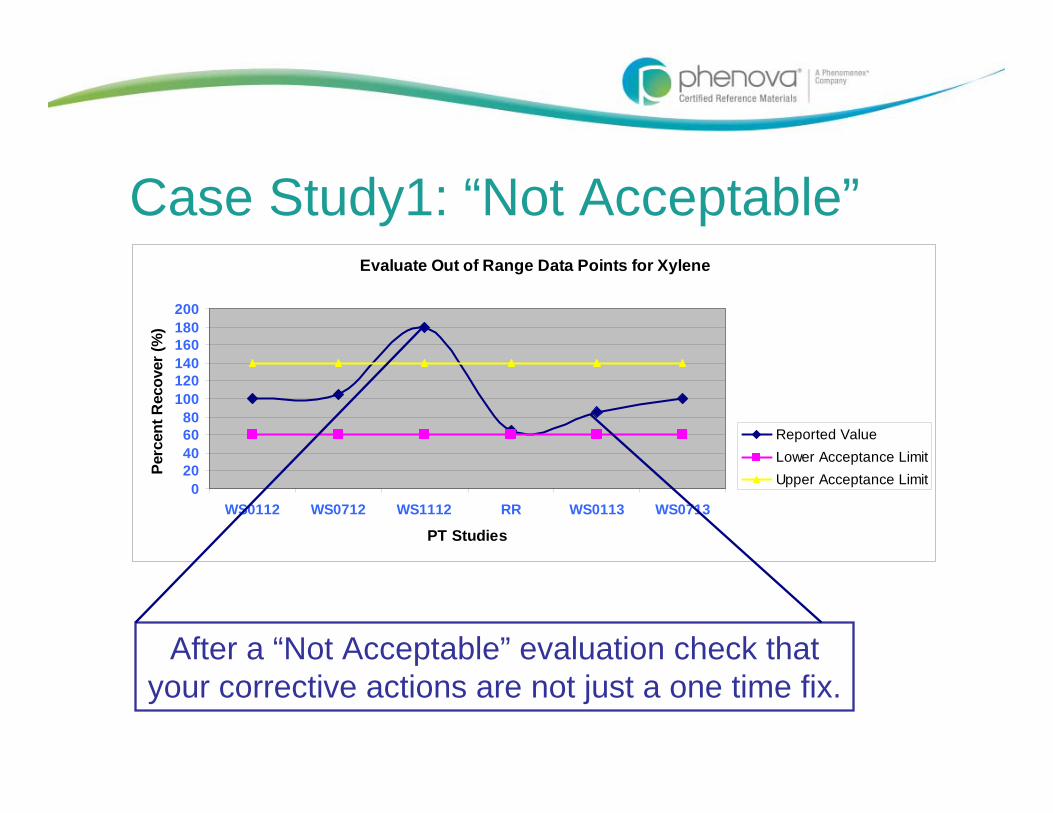
Case Study1: “Not Acceptable”Evaluate Out of Range Data Points for Xylene
020406080
100120140160180200
WS0112 WS0712 WS1112 RR WS0113 WS0713
PT Studies
Perc
ent R
ecov
er (%
)
Reported ValueLower Acceptance LimitUpper Acceptance Limit
After a “Not Acceptable” evaluation check that your corrective actions are not just a one time fix.
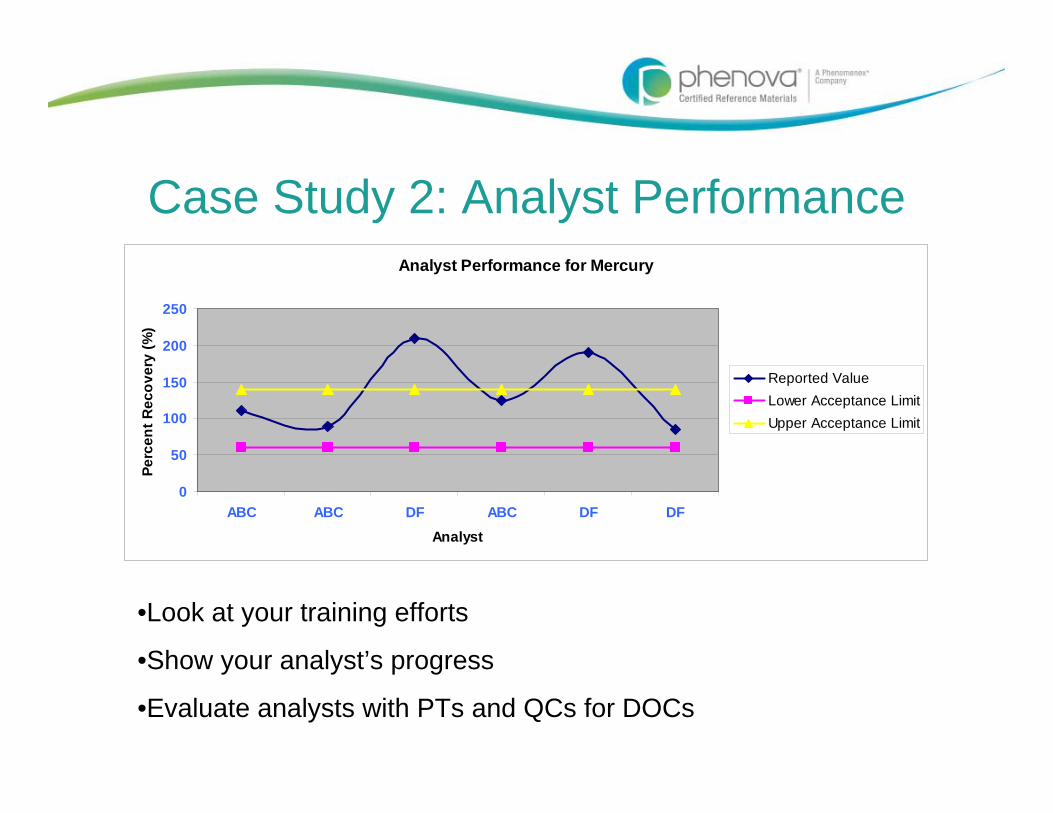
Case Study 2: Analyst PerformanceAnalyst Performance for Mercury
0
50
100
150
200
250
ABC ABC DF ABC DF DFAnalyst
Perc
ent R
ecov
ery
(%)
Reported ValueLower Acceptance LimitUpper Acceptance Limit
•Look at your training efforts
•Show your analyst’s progress
•Evaluate analysts with PTs and QCs for DOCs

Case Study 3: Method Comparison
Performance Track Your Methods
•Compare different methods across your laboratory
•Do you use the same calibration material for multiple methods
•Is one method failing for an analyte but passing with another?
Method Comparison
020406080
100120140160
Run 1 Run 2 Run 3 Run 4 Run 1 Run 2 Run 3 Run 4
Method 1 Method 2
Method Reference
Perc
ent R
ecov
ery
(%)
Reported ValueLower Acceptance LimitUpper Acceptance Limit

Case Study 4: Trending Data
The Best Corrective Action is The One Avoided
•Trend your data to avoid failing a PT before it happens
•Take preventative action before corrective action
Trending Data for 1,3-Dichlorobenzene
020406080
100120140160
WP1011 WP1011 WP0412 WP0412 WP0612 WP0612 WP0413 WP0413
Study ID
Perc
ent R
ecov
ery
(%)
Reported ValueLower Acceptance LimitUpper Acceptance Limit
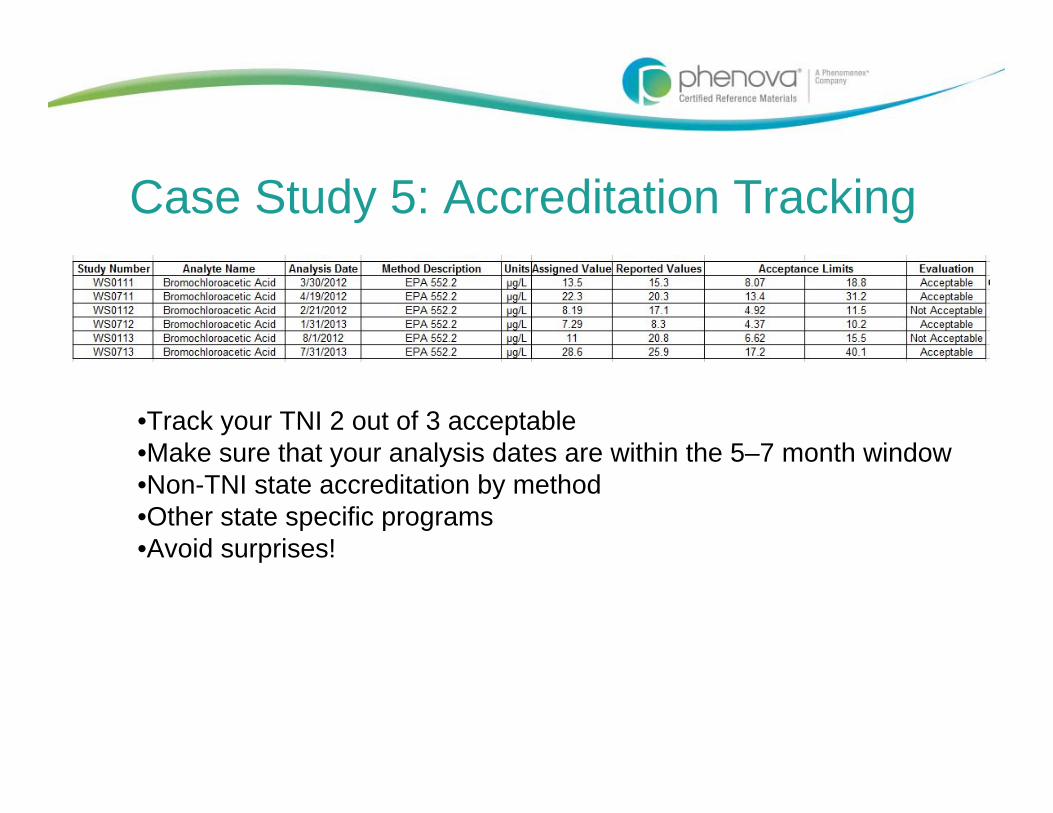
Case Study 5: Accreditation Tracking
•Track your TNI 2 out of 3 acceptable•Make sure that your analysis dates are within the 5–7 month window•Non-TNI state accreditation by method•Other state specific programs•Avoid surprises!

Engaged Quality Programs
How To Engage Your Staff With PT Results
Provide them the study statistical data
Promote Healthy Competition
Reward your lab for a perfect performance
Avoid the “Us” vs. “Them” mentality
What About Your Reward…?

Reward Yourself With…
1. A laboratory staff fully engaged in your quality and PT Program.
2. Develop a quality based environment. 3. Avoid “The PT standard is always wrong!” – it’s
them not us.
Never be afraid to ask for help…

Need Technical Assistance
• Seek out your PT provider for technical help. • We have over 300 year of combined experience. • We have been in your shoes and worked in laboratories ourselves.
Tel: 1-866-942-2978
Email: [email protected]
Your Success is Our Success!
Are They The Right PT Provider For Me?
• Provides study statistics and your laboratory data• Use PT results for your DOC reporting• Generate reports for training records• Allows you to customizable format to review and import data into your
database
Look for a PT Provider Who:
Have You Heard of PT Manage?

PT Manage™
Click here to take a virtual tour
