how to measure long duration, time-weighted average
TRANSCRIPT
How to Measure Long Duration, Time-Weighted Average Concentrations in Air to Provide
a More Accurate Risk Assessment
By:Harry O’Neill, President
BEACON

Road Map
• Current air sampling practices and challenges with that approach
• EPA guidance documents
• Passive sampler types – benefits and limitations
• Why Long-Duration, Time-Integrated Samples are Important
• Principles of how operate
• Demonstration of long duration linear uptake rates
• Reporting limits and standard analytical method
• Comparison data – Accuracy and Precision
• Questions

The Challenge
Temporal Variability
Indoor air concentrations can vary daily by orders of magnitude
Vapor intrusion has shown to be episodic – anomalous events occur
Source:
Johnson, P. Multi-Year Monitoring of a House Overlying a Dilute Chlorinated Hydrocarbon
Plume: Implications for Vapor Intrusion Pathway Assessment
SERDP & ESTCP Webinar Series, 2014.
WINTER MONTHS SPRING MONTHS

The Challenge
Sources:
Johnson, P. Multi-Year Monitoring of a House Overlying a Dilute Chlorinated
Hydrocarbon Plume: Implications for Vapor Intrusion Pathway Assessment
SERDP & ESTCP Webinar Series, 2014.
Holton et al., ES&T, 2013, 47, 13347-13354
Results: Analysis of Sampling Outcomes
With 24 hr samples:
High potential for false negative result concerning VI occurrence
High potential to incorrectly characterize long-term exposure
High potential to incorrectly characterize maximum short-term
exposure
• About half of all 24-h samples would come back non-detect
• Only about 50% chance that sample results would have a
mean concentration inside a 10X range about the true mean
concentration
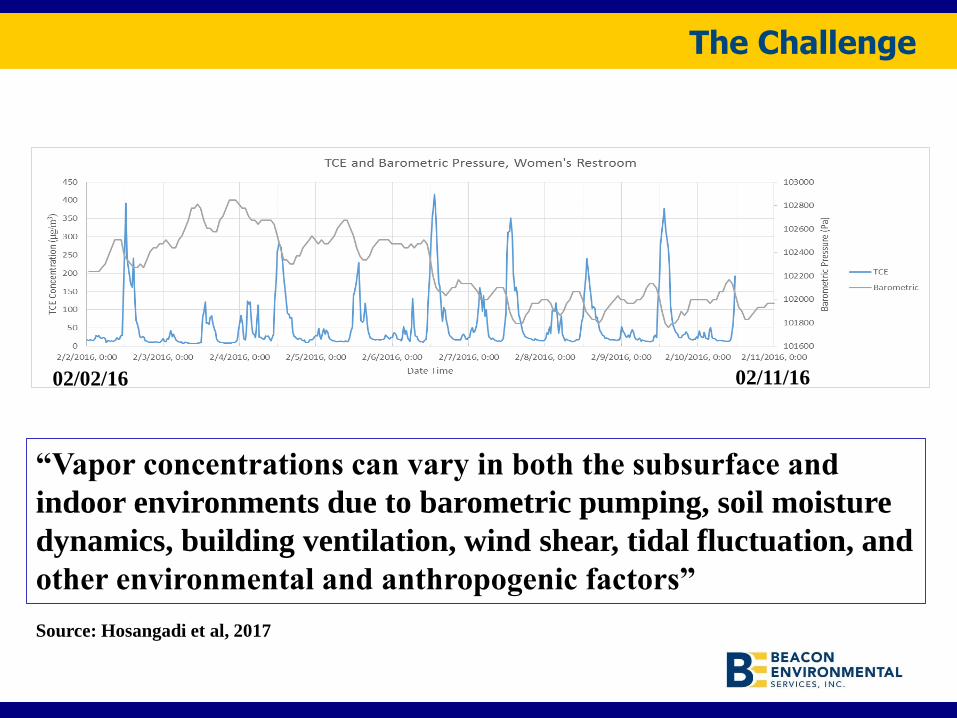
The Challenge
Source: Hosangadi et al, 2017
02/02/16 02/11/16
“Vapor concentrations can vary in both the subsurface and
indoor environments due to barometric pumping, soil moisture
dynamics, building ventilation, wind shear, tidal fluctuation, and
other environmental and anthropogenic factors”
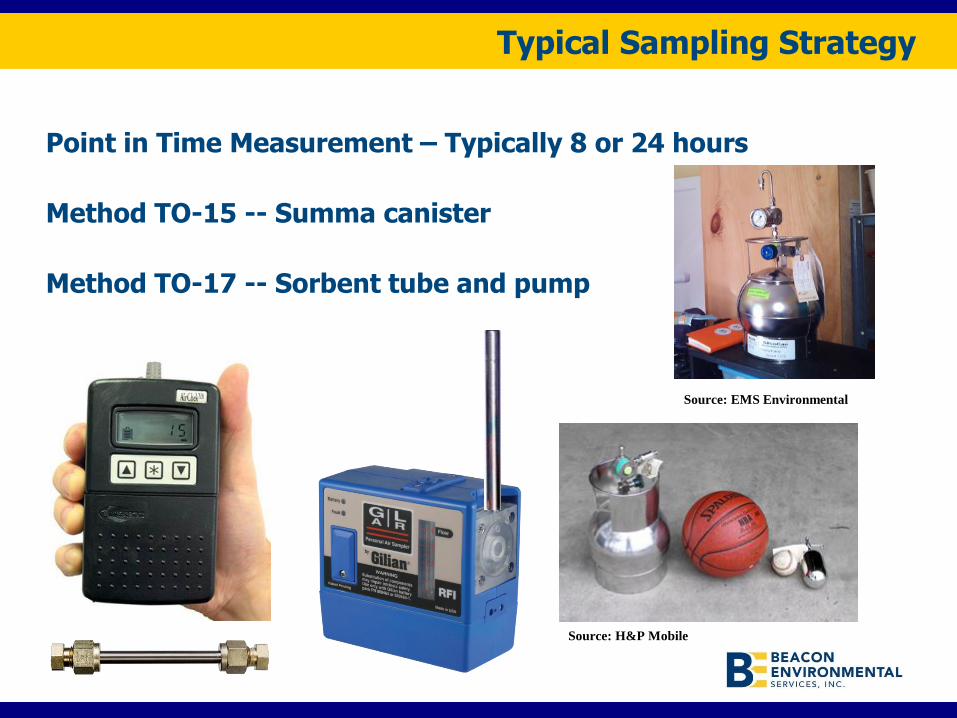
Point in Time Measurement – Typically 8 or 24 hours
Method TO-15 -- Summa canister
Method TO-17 -- Sorbent tube and pump
Typical Sampling Strategy
Source: EMS Environmental
Source: H&P Mobile

Point in Time Measurement – Real Time and Continuous
Portable GC/MS
Optional Sampling Strategy – Continuous Monitoring
Source: EMS Environmental
Source: Inficon Source: VaporSafe
Portable GC/PID/FID/ECD

Optional Sampling Strategy - Passive Sorbent Samplers
Radial Sampler, Badge Sampler, & Axial Samplers
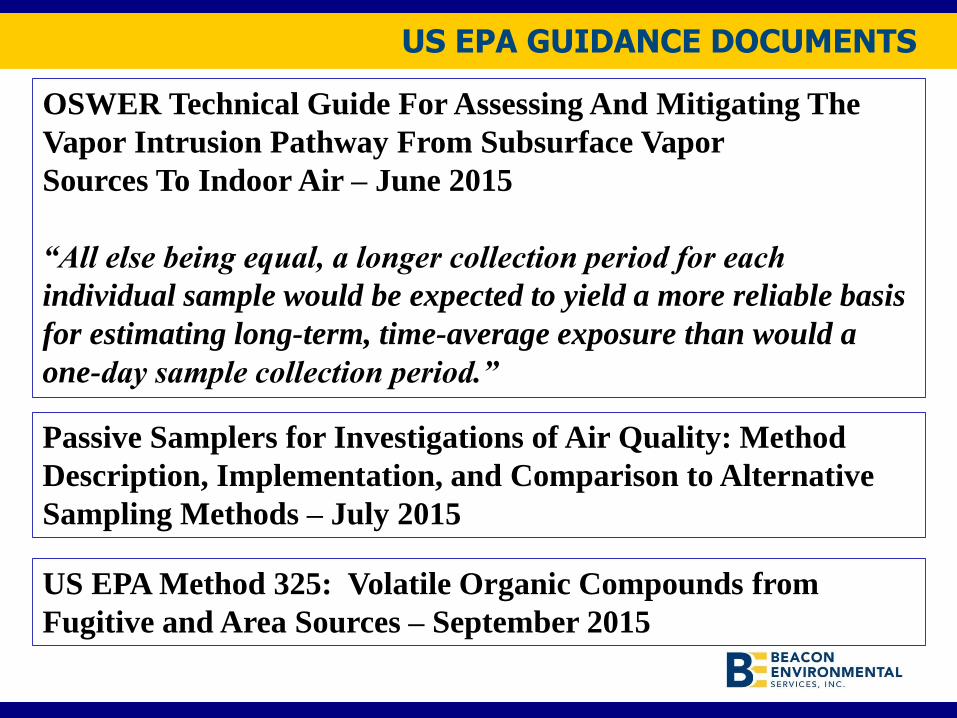
US EPA GUIDANCE DOCUMENTS
Passive Samplers for Investigations of Air Quality: Method
Description, Implementation, and Comparison to Alternative
Sampling Methods – July 2015
OSWER Technical Guide For Assessing And Mitigating The
Vapor Intrusion Pathway From Subsurface Vapor
Sources To Indoor Air – June 2015
“All else being equal, a longer collection period for each
individual sample would be expected to yield a more reliable basis
for estimating long-term, time-average exposure than would a
one-day sample collection period.”
US EPA Method 325: Volatile Organic Compounds from
Fugitive and Area Sources – September 2015
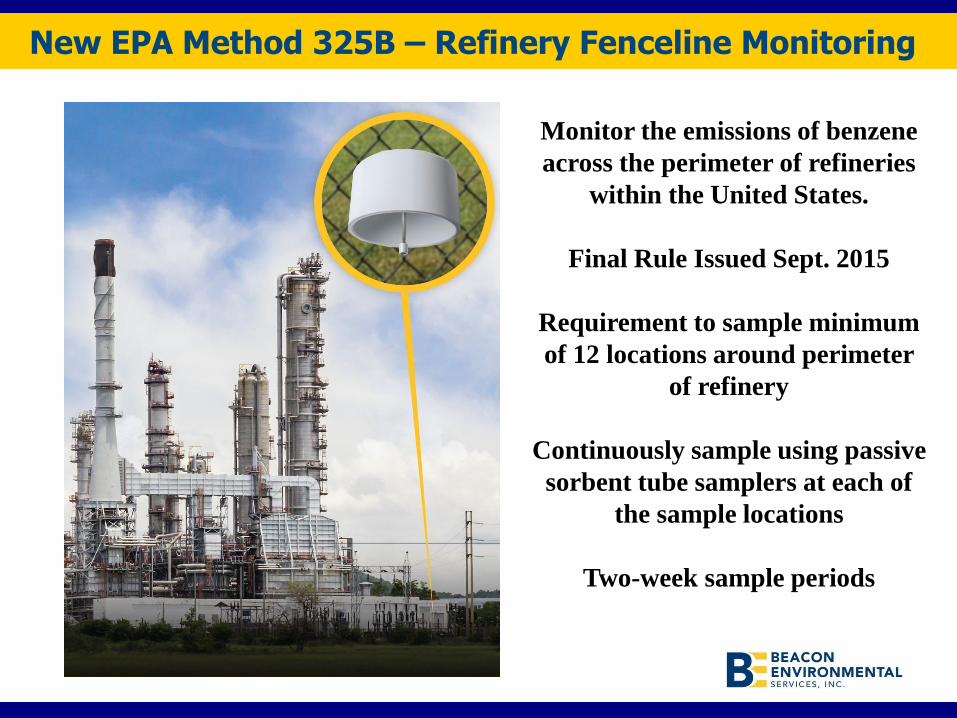
New EPA Method 325B – Refinery Fenceline Monitoring
Monitor the emissions of benzene
across the perimeter of refineries
within the United States.
Final Rule Issued Sept. 2015
Requirement to sample minimum
of 12 locations around perimeter
of refinery
Continuously sample using passive
sorbent tube samplers at each of
the sample locations
Two-week sample periods

Time-Integrated, Passive Samplers
Passive samplers allow for the collection of samples
over several days or weeks to measure organic
compounds in indoor and ambient air, which reports an
average concentration over that time period that may
be more representative of health risks
• Passive samplers are easy to use
• No pumps or flow regulators required
• Quality analytical procedures will produce high quality
data while achieving low reporting limits
• Sorbent samplers can target concentrations that span
orders of magnitude

Types of Passive Sorbent Samplers
High Uptake Rate and Low Uptake Rate Samplers
Example:
Uptake Rates for PCE
Range from 54 ml/min (High) to 0.41 ml/min (Low)
Equivalent to sampling 77 L to 0.59 L per day
or 539 L to 4.1 L per week
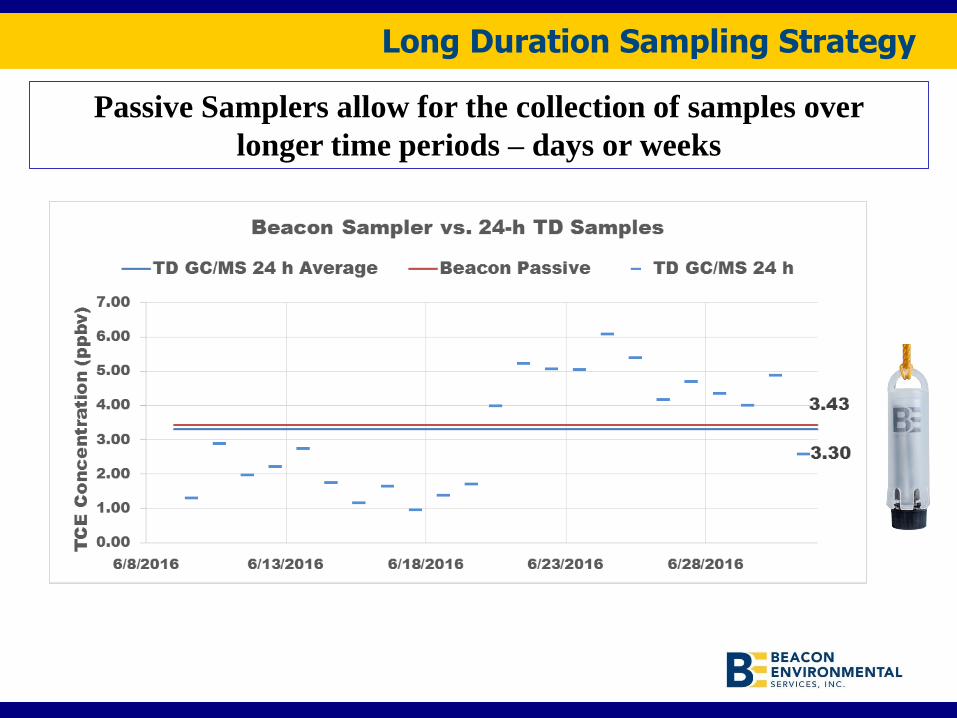
Long Duration Sampling Strategy
Passive Samplers allow for the collection of samples over
longer time periods – days or weeks
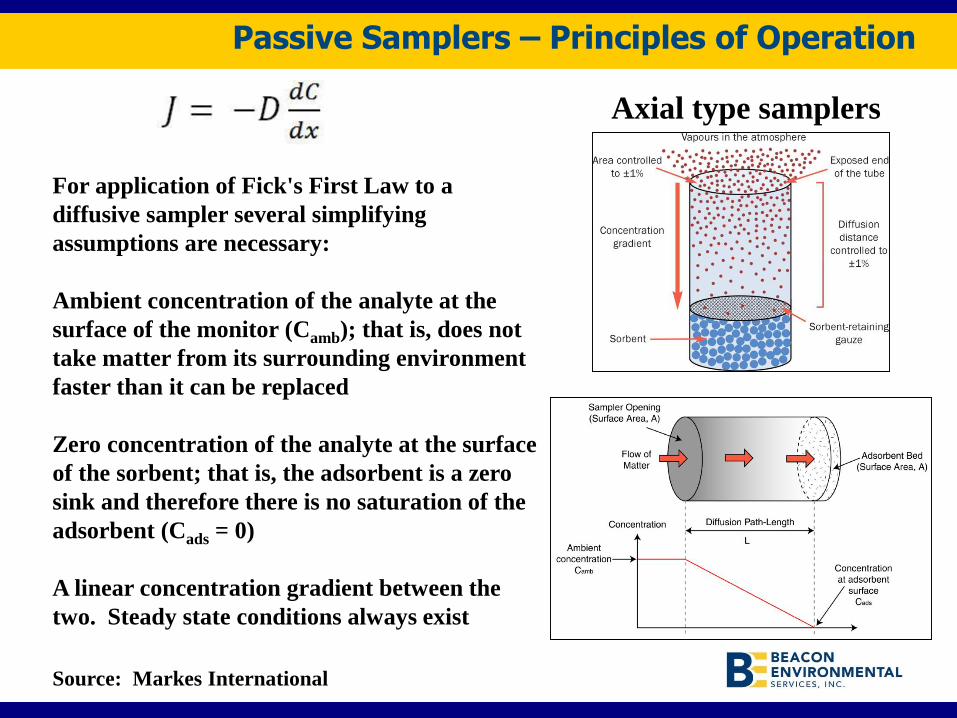
Passive Samplers – Principles of Operation
For application of Fick's First Law to a
diffusive sampler several simplifying
assumptions are necessary:
Ambient concentration of the analyte at the
surface of the monitor (Camb); that is, does not
take matter from its surrounding environment
faster than it can be replaced
Zero concentration of the analyte at the surface
of the sorbent; that is, the adsorbent is a zero
sink and therefore there is no saturation of the
adsorbent (Cads = 0)
A linear concentration gradient between the
two. Steady state conditions always exist
Axial type samplers
Source: Markes International

Principles of Passive Sampling
The adsorbent must be compatible with the target VOCs
The VOCs are retained on the sorbent for the full duration of
the sample period -- no back diffusion
Analytical method must completely desorb the VOCs from the
adsorbent -- no irreversible sorption
Calculate concentration:
C=M/U x t
C = Concentration ug/m3
M = Mass (nanograms x 1000)
U = Uptake rate (ml/min)
t = time (min)

Passive Samplers – Uptake Rates Theoretical
Calculate uptake rates:
U = A/Z x D
uptake rate (U) = ml/min
Area (A) = cm2
Distance (Z) = cm
Diffusivity Coefficient in Air (D) = cm2/sec
(e.g., cm2/cm x cm2/sec x 60 = cm3/min or ml/min)
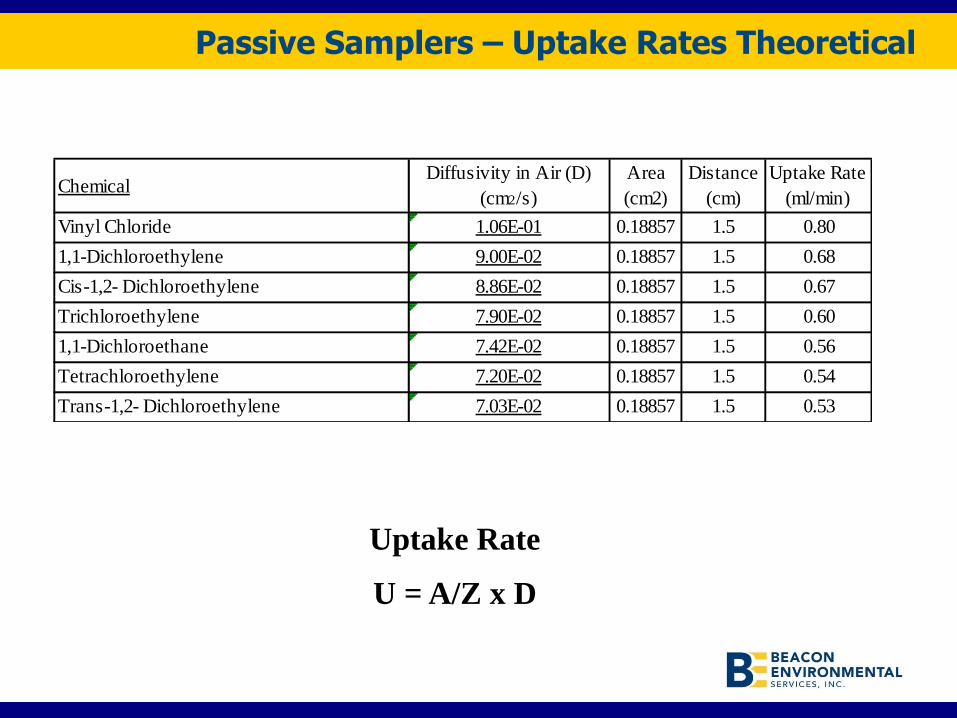
Passive Samplers – Uptake Rates Theoretical
Uptake Rate
U = A/Z x D
ChemicalDiffusivity in Air (D)
(cm2/s)
Area
(cm2)
Distance
(cm)
Uptake Rate
(ml/min)
Vinyl Chloride 1.06E-01 0.18857 1.5 0.80
1,1-Dichloroethylene 9.00E-02 0.18857 1.5 0.68
Cis-1,2- Dichloroethylene 8.86E-02 0.18857 1.5 0.67
Trichloroethylene 7.90E-02 0.18857 1.5 0.60
1,1-Dichloroethane 7.42E-02 0.18857 1.5 0.56
Tetrachloroethylene 7.20E-02 0.18857 1.5 0.54
Trans-1,2- Dichloroethylene 7.03E-02 0.18857 1.5 0.53

Uptake Rates Theoretical vs. Measured
Chemical
Theoretical
Uptake
Rate
(ml/min)
Measured
Uptake
Rate
(ml/min)
Relative
Percent
Difference
(RPD)
Vinyl Chloride 0.80 0.78 2.48%
1,1-Dichloroethylene 0.68 0.57 17.43%
Cis-1,2- Dichloroethylene 0.67 0.58 14.15%
Trichloroethylene 0.60 0.50 17.50%
1,1-Dichloroethane 0.56 0.57 1.83%
Tetrachloroethylene 0.54 0.48 12.33%
Trans-1,2- Dichloroethylene 0.53 0.58 8.96%
Need for new uptake rate studies
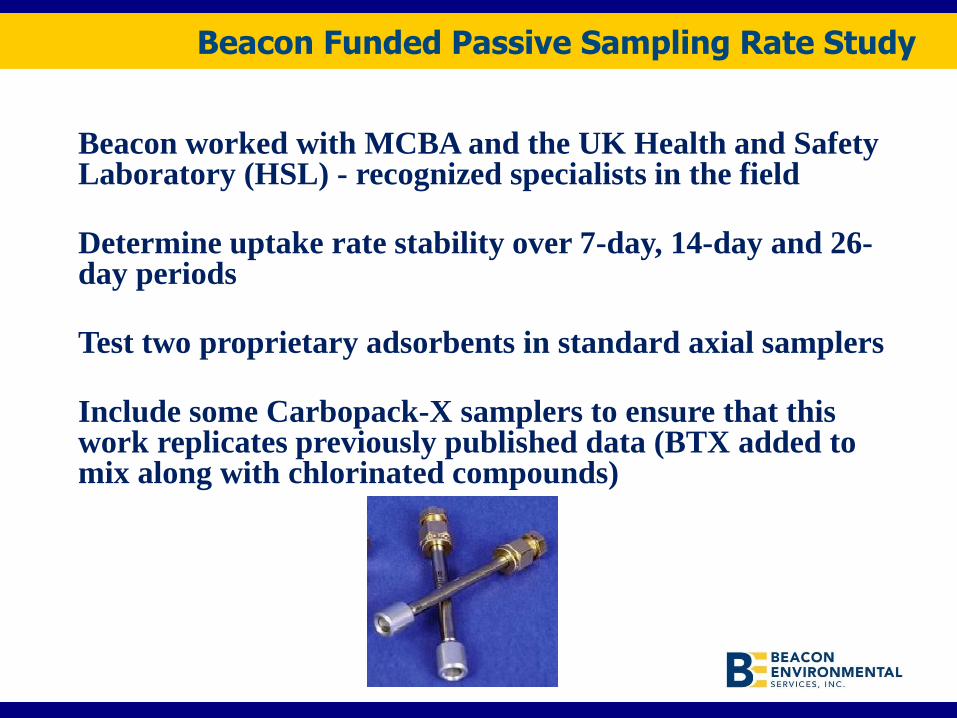
Beacon Funded Passive Sampling Rate Study
Beacon worked with MCBA and the UK Health and Safety Laboratory (HSL) - recognized specialists in the field
Determine uptake rate stability over 7-day, 14-day and 26-day periods
Test two proprietary adsorbents in standard axial samplers
Include some Carbopack-X samplers to ensure that this work replicates previously published data (BTX added to mix along with chlorinated compounds)
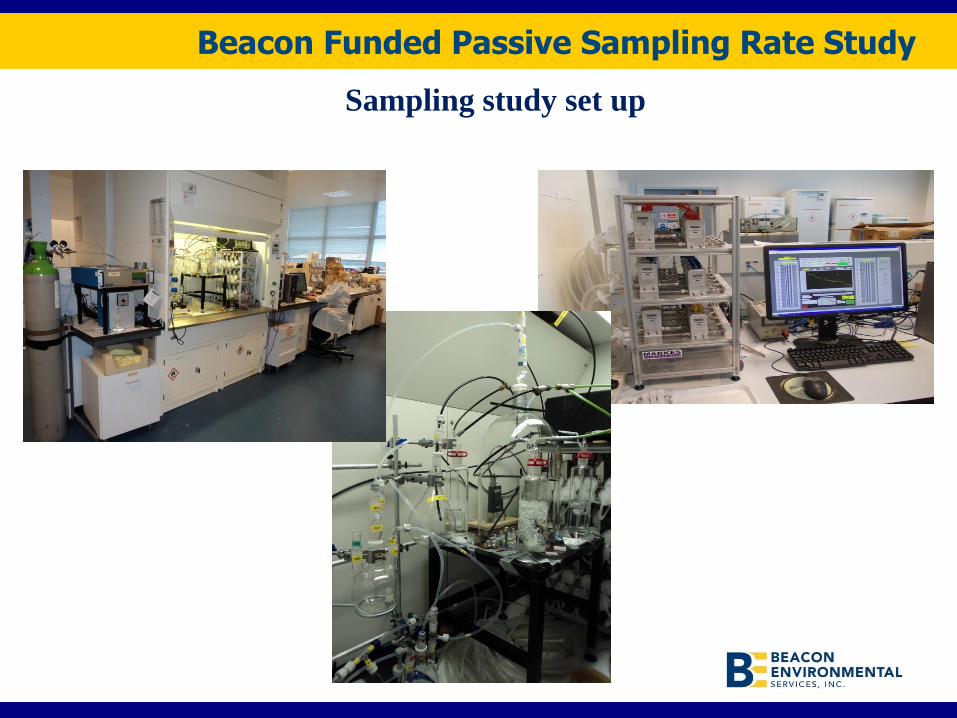
Beacon Funded Passive Sampling Rate Study
Sampling study set up
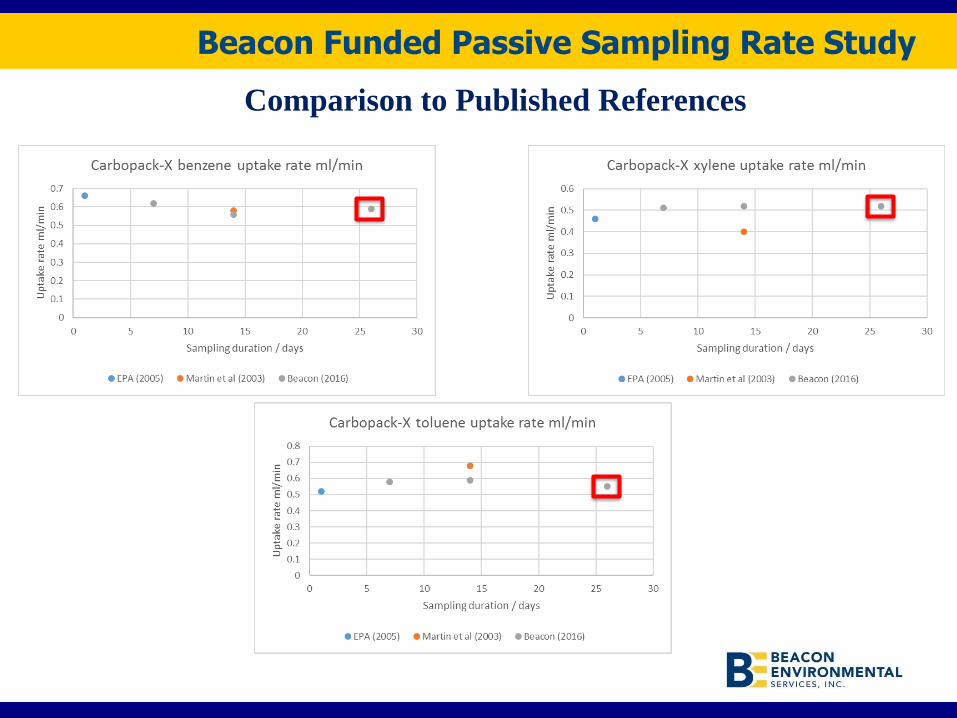
Beacon Funded Passive Sampling Rate Study
Comparison to Published References
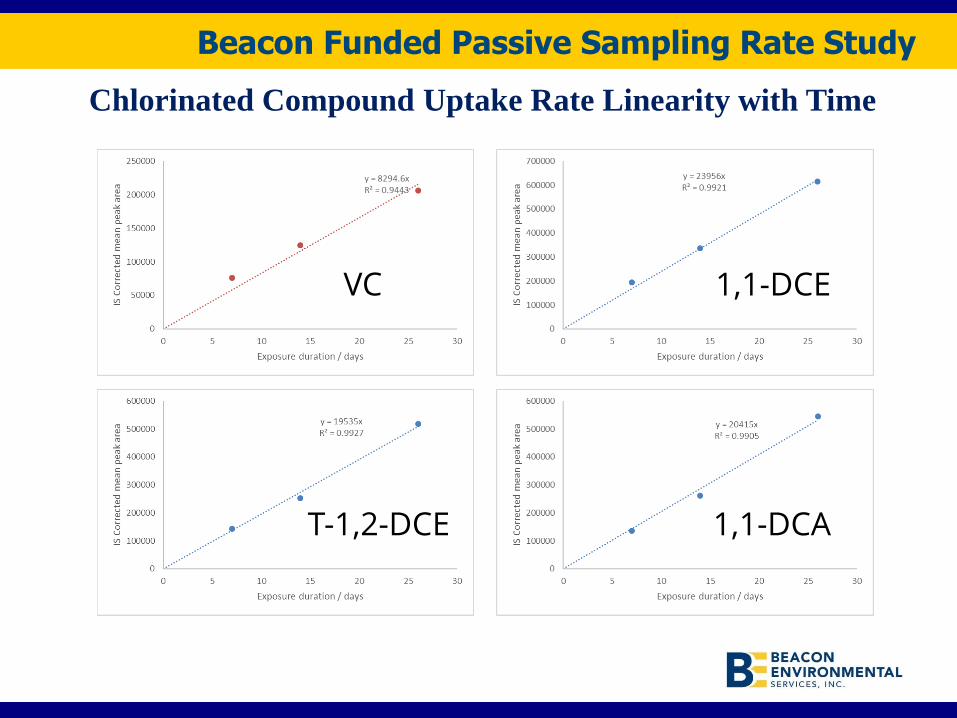
Beacon Funded Passive Sampling Rate Study
Chlorinated Compound Uptake Rate Linearity with Time
VC 1,1-DCE
T-1,2-DCE 1,1-DCA

Beacon Funded Passive Sampling Rate Study
Chlorinated Compound Uptake Rate Linearity with Time
C-1,2-DCE 1,2-DCA
TCE (A) TCE (B)
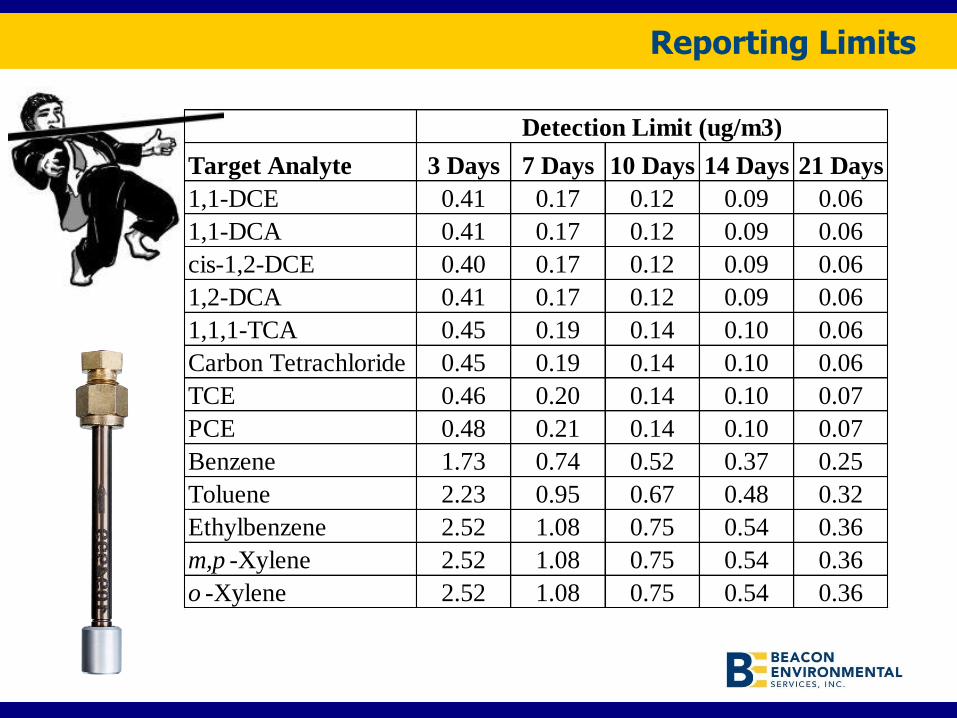
Reporting Limits
Target Analyte 3 Days 7 Days 10 Days 14 Days 21 Days
1,1-DCE 0.41 0.17 0.12 0.09 0.06
1,1-DCA 0.41 0.17 0.12 0.09 0.06
cis-1,2-DCE 0.40 0.17 0.12 0.09 0.06
1,2-DCA 0.41 0.17 0.12 0.09 0.06
1,1,1-TCA 0.45 0.19 0.14 0.10 0.06
Carbon Tetrachloride 0.45 0.19 0.14 0.10 0.06
TCE 0.46 0.20 0.14 0.10 0.07
PCE 0.48 0.21 0.14 0.10 0.07
Benzene 1.73 0.74 0.52 0.37 0.25
Toluene 2.23 0.95 0.67 0.48 0.32
Ethylbenzene 2.52 1.08 0.75 0.54 0.36
m,p -Xylene 2.52 1.08 0.75 0.54 0.36
o -Xylene 2.52 1.08 0.75 0.54 0.36
Detection Limit (ug/m3)

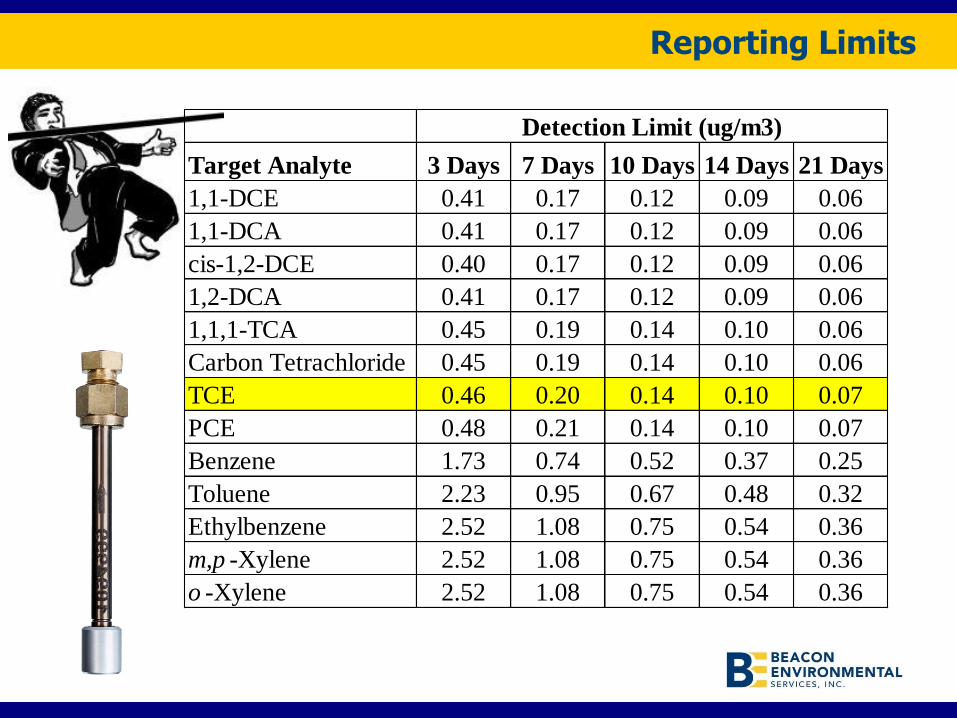
Reporting Limits
Target Analyte 3 Days 7 Days 10 Days 14 Days 21 Days
TCE 0.46 0.20 0.14 0.10 0.07
Detection Limit (ug/m3)
Average reporting limit also indicates that:
TCE conc never exceeded 1.4 ug/m3 in any 24 hour period
TCE conc never exceeded 4.2 ug/m3 in any 8-hour period
Note the 24-hr and 8-hr periods do not need to be continuous

Analysis by EPA Method TO-17
Analysis by thermal desorption-gas chromatography/mass spectrometry (TD-GC/MS) following EPA Method TO-17
• Analytical results based on 5-point initial calibration
• Internal standards and surrogates included with each analysis
• Daily continuing calibration checks
• Laboratory control samples
• System daily tunes and
• Method blanks
• Limit of Detection and Quantitation (LOD and LOQ) Studies
• Meets requirements of Level III/Level IV data quality objectives
• Able to recollect sample split to perform dilutions and re-analyses
TD-GC/MS
Laboratory Accreditation
It is important to have samples analyzed by an
accredited laboratory that has a demonstrated ability
to produce quality data within defined accuracy and
precision limits…
and ask for copies of their proficiency test (PT) results
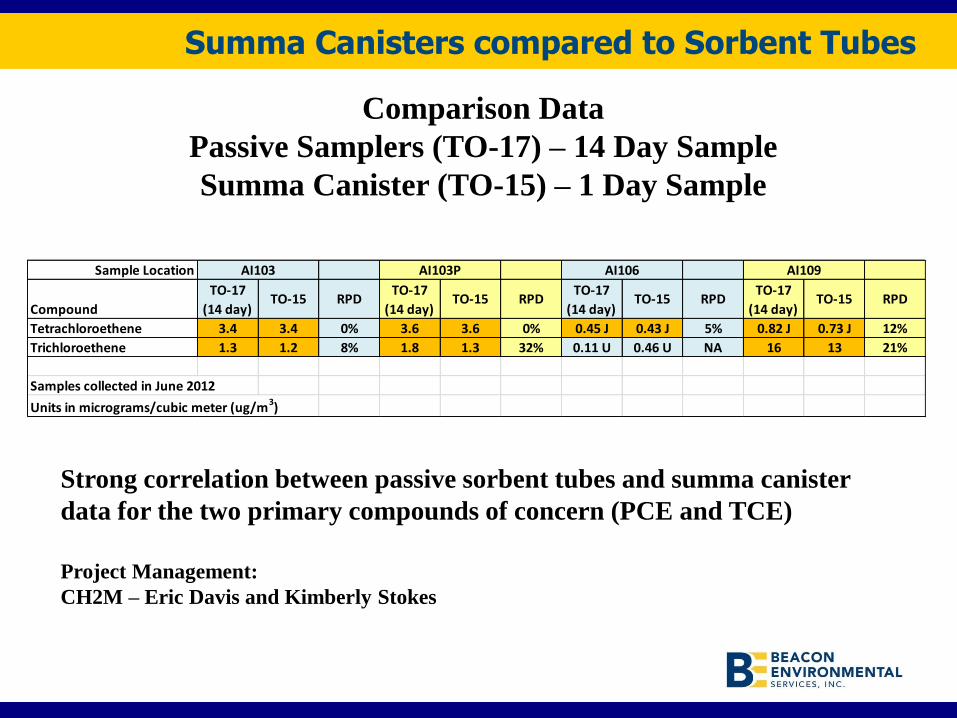
Summa Canisters compared to Sorbent Tubes
Comparison Data
Passive Samplers (TO-17) – 14 Day Sample
Summa Canister (TO-15) – 1 Day Sample
Sample Location
Compound
TO-17
(14 day)TO-15 RPD
TO-17
(14 day)TO-15 RPD
TO-17
(14 day)TO-15 RPD
TO-17
(14 day)TO-15 RPD
Tetrachloroethene 3.4 3.4 0% 3.6 3.6 0% 0.45 J 0.43 J 5% 0.82 J 0.73 J 12%
Trichloroethene 1.3 1.2 8% 1.8 1.3 32% 0.11 U 0.46 U NA 16 13 21%
Samples collected in June 2012
Units in micrograms/cubic meter (ug/m3)
AI103 AI103P AI106 AI109
Strong correlation between passive sorbent tubes and summa canister
data for the two primary compounds of concern (PCE and TCE)
Project Management:
CH2M – Eric Davis and Kimberly Stokes
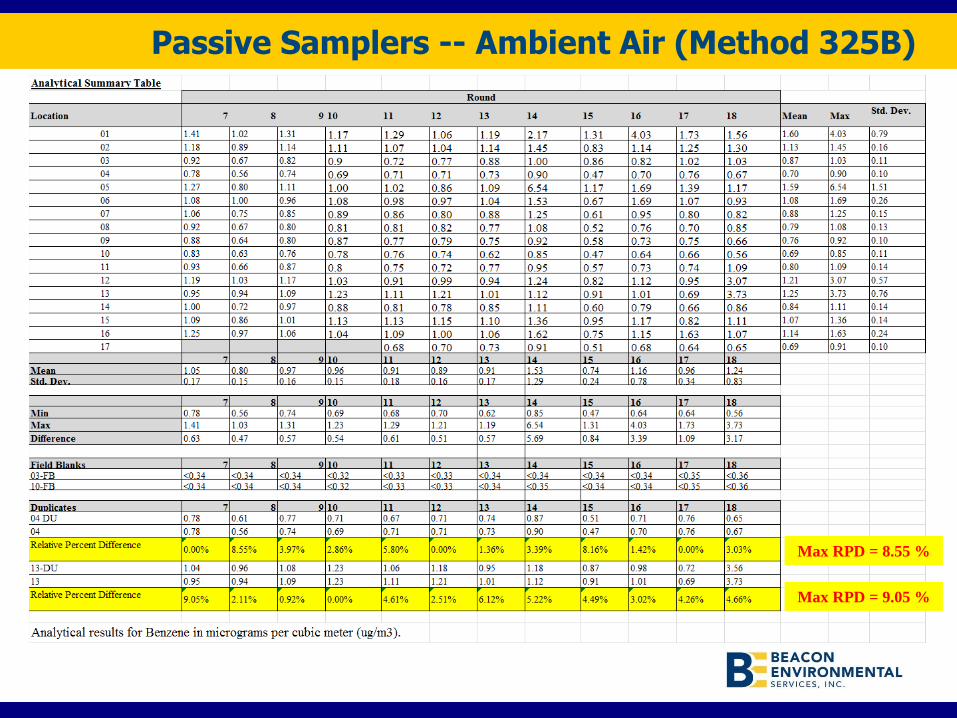
Passive Samplers -- Ambient Air (Method 325B)
Max RPD = 8.55 %
Max RPD = 9.05 %
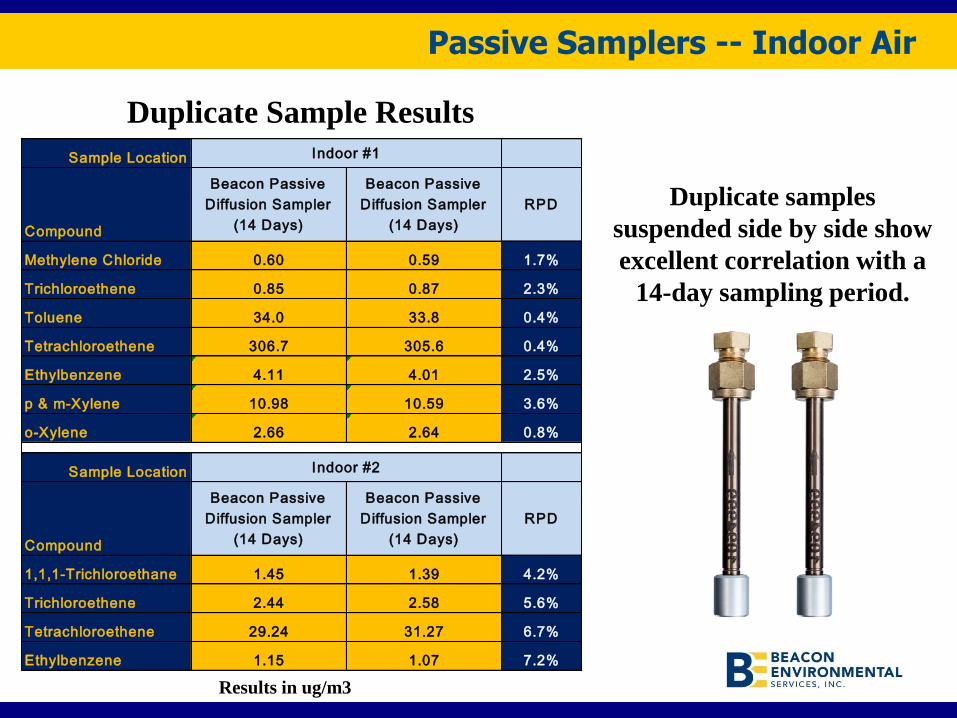
Duplicate Sample Results
Duplicate samples
suspended side by side show
excellent correlation with a
14-day sampling period.
Sample Location
Methylene Chloride 0.60 0.59 1.7%
Trichloroethene 0.85 0.87 2.3%
Toluene 34.0 33.8 0.4%
Tetrachloroethene 306.7 305.6 0.4%
Ethylbenzene 4.11 4.01 2.5%
p & m-Xylene 10.98 10.59 3.6%
o-Xylene 2.66 2.64 0.8%
Sample Location
1,1,1-Trichloroethane 1.45 1.39 4.2%
Trichloroethene 2.44 2.58 5.6%
Tetrachloroethene 29.24 31.27 6.7%
Ethylbenzene 1.15 1.07 7.2%
Indoor #1
Beacon Passive
Diffusion Sampler
(14 Days)
Beacon Passive
Diffusion Sampler
(14 Days)
RPD
Compound
Compound
Indoor #2
Beacon Passive
Diffusion Sampler
(14 Days)
Beacon Passive
Diffusion Sampler
(14 Days)
RPD
Results in ug/m3
Passive Samplers -- Indoor Air
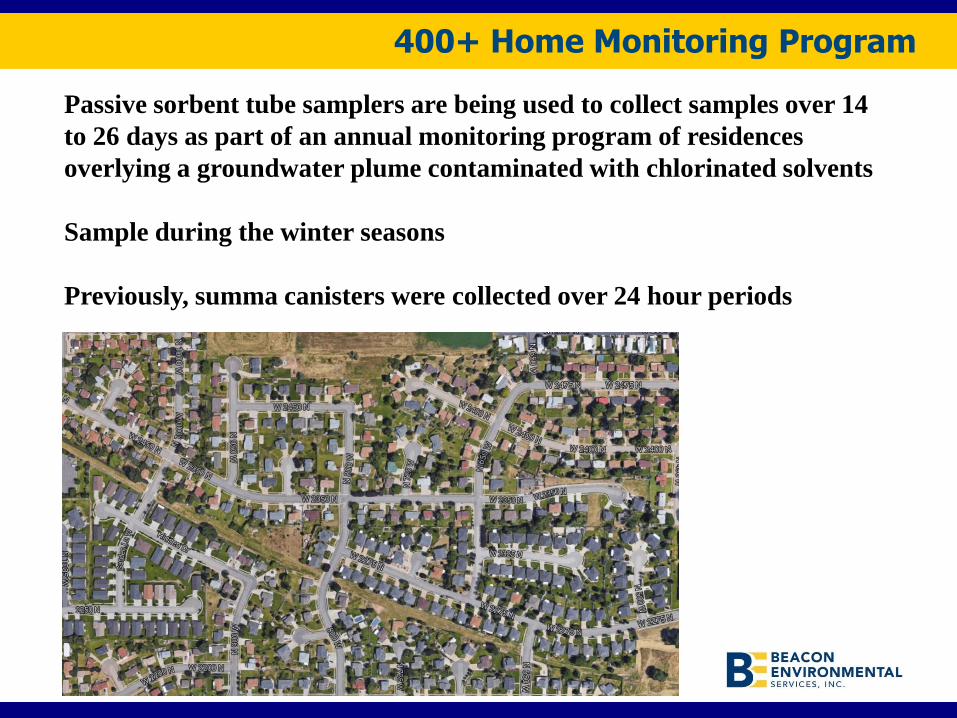
400+ Home Monitoring Program
Passive sorbent tube samplers are being used to collect samples over 14
to 26 days as part of an annual monitoring program of residences
overlying a groundwater plume contaminated with chlorinated solvents
Sample during the winter seasons
Previously, summa canisters were collected over 24 hour periods
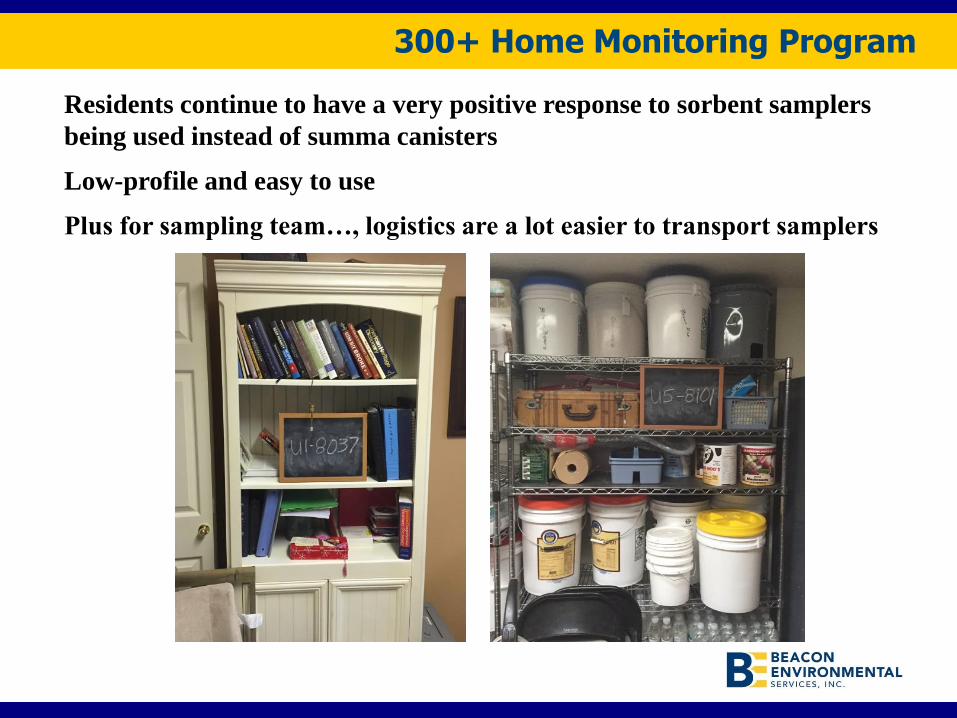
300+ Home Monitoring Program
Residents continue to have a very positive response to sorbent samplers
being used instead of summa canisters
Low-profile and easy to use
Plus for sampling team…, logistics are a lot easier to transport samplers

300+ Home Monitoring Program
Good correlation with prior data collected at homes over past decade
when summa canister samples were collected
Data for blind duplicate passive samples
Passive Sampler Duplicate Passive Sampler
ug/m3 ug/m3
2016-2017 0.12 0.12
2016-2017 0.23 0.23
2015-2016 0.25 0.24
2015-2016 0.26 0.26
2016-2017 0.26 0.26
2015-2016 0.31 0.37
2015-2016 0.63 0.61
2015-2016 1.36 1.32
2015-2016 2.09 2.24
2015-2016 2.86 2.52
2015-2016 8.28 7.8
2015-2016 10.12 9.97
Season

300+ Home Monitoring Program
Data for blind duplicate passive samples
Full Range of Concentrations
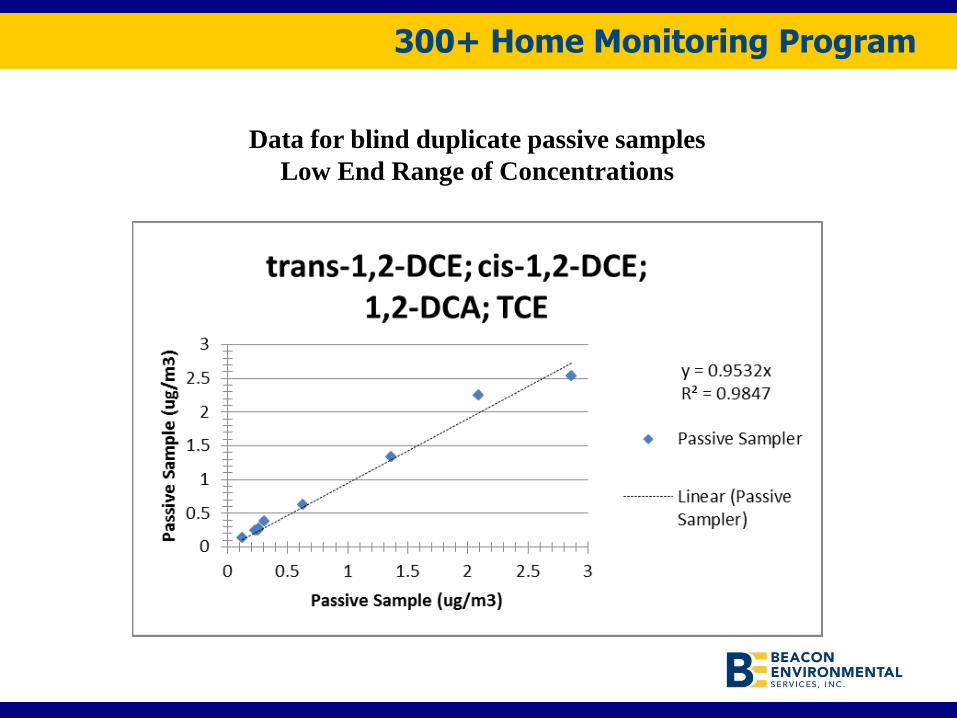
300+ Home Monitoring Program
Data for blind duplicate passive samples
Low End Range of Concentrations

ASU Study House: Time-integrated passive samples collected over
20+ days vs. daily average samples
• Daily 24 hour samples collected on sorbent tubes with pump
(EPA Method TO-17)
• Time-integrated samples collected over multiple days using
Beacon Passive Samplers (Analysis by EPA Method TO-17)
Time Integrated Sampling Study – Indoor Air

Study Set-Up
On going study to compare results of the passive samplers vs. average daily
concentrations measured using Method TO-17 with pumped samples
Time-Integrated Beacon Passive Samplers compared to
Daily 24-hour average measurements
Passive Samplers collected in triplicate; exposed for duration of sampling periods
Pumped samples collected at a flow rate of 10 ml/min with a total volume of 14.4 L

Beacon Passive Samplers – Analysis of Accuracy
Correlation of Beacon Passive Sampler to
Average of 24-hour Active Samples

Beacon Passive Samplers – Analysis of Precision
Samples Collected in Triplicate
Analysis of Trichloroethene (TCE) Results
Sampling Sampling Average Stnd Dev COV
Event Days ug/m3
ppbv ug/m3
ppbv ug/m3
ppbv ppbv1 26 7.56 1.41 6.58 1.22 6.69 1.24 1.29 0.10 0.08
2 23 20.04 3.73 17.92 3.33 17.29 3.22 3.43 0.27 0.08
3 20 16.69 3.11 15.25 2.84 17.00 3.16 3.04 0.17 0.06
4 30 10.48 1.95 9.28 1.73 10.15 1.89 1.86 0.11 0.06
5 52 4.22 0.78 3.96 0.74 3.39 0.63 0.72 0.08 0.11
6 20 5.87 1.09 6.86 1.28 5.45 1.01 1.13 0.14 0.12
7 7 12.86 2.39 11.81 2.20 9.53 1.77 2.12 0.32 0.15
8 7 4.27 0.80 3.76 0.70 4.19 0.78 0.76 0.05 0.07
9 6 5.34 0.99 5.52 1.03 4.61 0.86 0.96 0.09 0.09
10 30 U U U U U U
11 43 2.24 0.42 1.33 0.25 1.78 0.33 0.33 0.09 0.26
12 35 2.23 0.41 2.36 0.44 2.28 0.42 0.42 0.02 0.04
13 36 1.71 0.32 1.66 0.31 1.81 0.34 0.32 0.02 0.05
AVERAGE 0.10
B-X-01 B-X-02 B-X-03
Data Source: Arizona State Univ. Study House
Drs. Paul Johnson, Paul Dahlen, Yuanming Guo

Summary
• Passive adsorbent samplers are easy to use and less
obtrusive than other sampling techniques
• Quality analytical procedures will produce high quality
data while achieving low reporting limits
• Passive samplers can target concentrations that span
orders of magnitude
• Passive samplers allow for the collection of samples over
several days or weeks to measure organic compounds in
indoor and ambient air, which reports an average
concentration that may be more representative of the
health risks to building occupants

Beacon Environmental Services, Inc.
Harry O’Neill
Forest Hill, MD USA
1-410-838-8780
www.beacon-usa.com
Thank you!
Any Questions?
Beacon… We can be your guide