how to reduce inequalities in access to wash · how to reduce inequalities in access to wash: ... a...
TRANSCRIPT
How to reduce inequalities in access to WASHRural water and sanitation in NepalMoizza Binat Sarwar and Nathaniel Mason
Report
June 2017
Overseas Development Institute203 Blackfriars RoadLondon SE1 8NJ
Tel. +44 (0) 20 7922 0300 Fax. +44 (0) 20 7922 0399 E-mail: [email protected]
www.odi.org www.odi.org/facebook www.odi.org/twitter
Readers are encouraged to reproduce material from ODI Reports for their own publications, as long as they are not being sold commercially. As copyright holder, ODI requests due acknowledgement and a copy of the publication. For online use, we ask readers to link to the original resource on the ODI website. The views presented in this paper are those of the author(s) and do not necessarily represent the views of ODI.
© Overseas Development Institute 2017. This work is licensed under a Creative Commons Attribution-NonCommercial Licence (CC BY-NC 4.0).
Cover photo: Woman in Nepal washing water collection pot before collecting water from a village gravity flow tap. © Jim Holmes for DFAT.
Acknowledgements
This research was commissioned by WaterAid. Thanks are due to Henry Northover, Andrés Hueso, Dan Jones and Louisa Gosling at WaterAid UK for their steer and support throughout the project. We are particularly grateful for the kind assistance provided by Ganga D Nepal (Independent consultant) and Tripti Rai and Shikha Shrestha (WaterAid Nepal).
Peer review was provided by Daniel Harris (ODI), Henry Northover, Andrés Hueso, Dan Jones, Louisa Gosling and Tripti Rai. Copy editing was done by Chris Little.
Thanks are also due to WaterAid Nepal and WaterAid UK for their inputs into the methodology and preliminary drafts of this report.
Finally, we would like to thank all the people we interviewed in the course of the project who gave their time so generously and engaged in an open and constructive manner throughout. All quotations from interviewees are anonymous. Any errors or omissions are our own.
How to reduce inequalities in access to WASH: rural water and sanitation in Nepal 3

Contents
Acknowledgements 3
Executive summary 7
1. Introduction 9
1.1. Understanding inequalities and WASH services: general overview of the study 9
1.2. Research approach and methodology 9
1.3. This report: Nepal case study 10
2. Understanding the problem 11
2.1. Wider development trends in Nepal 11
2.2. Rural WASH snapshot 12
2.3. Deeper dive on Government data and definitions 13
3. Political and institutional trajectory of the rural WASH sector 15
3.1. Political prioritisation of WASH 15
3.2. National and local structures of importance for rural WASH 17
3.3. Institutions and procedures for planning and financing rural WASH 19
4. Understanding drivers of progress and inequalities in WASH outcomes 22
4.1. Reasons for success of WASH expansion in Nepal 22
4.2. Challenges faced by the WASH sector 23
5. Conclusions 28
5.1. Summary: broad progress, but significant and persistent inequalities 28
5.2. Entry points for change 30
References 31
Appendix 1: Key Policies on Water and Sanitation 34
Appendix 2: List of interviews 35
4 ODI Report

How to reduce inequalities in access to WASH: rural water and sanitation in Nepal 5
Boxes
Box 1: Six categories of incentives 10
Box 2: National Sanitation and Hygiene Master Plan 2011 17
Box 3: How is social inclusion addressed in wider Government of Nepal policy? 26
List of boxes, figures and tables
Figures
Figure 1: Sanitation trends by rural wealth quintile 14
Figure 2: Water supply trends by rural wealth quintile 14
Figure 3: Linkages between WASH stakeholders in Nepal 21
Tables
Table 1: Stakeholders in the WASH sector in Nepal 20
Acronyms
ADB Asian Development Bank
CLTS Community led total sanitation
DDC District Development Committee
DOLIDAR Department of Local Infrastructure Development and Agricultural Roads
DTO District Technical Office
DWSS Department of Water Supply and Sewerage
DWASHCC District Water Supply and Sanitation Coordination Committee
FEDO Feminist Dalit Organization
GDP Gross domestic product
GoN Government of Nepal
(I)NGO (International) non-governmental organization
JMP Joint Monitoring Programme
MDGs Millennium Development Goals
MOHP Ministry of Health and Population
MoF Ministry of Finance
MoFALD Ministry of Federal Affairs and Local Development
MoPPW Ministry of Physical Planning and Works
MoUD Ministry of Urban Development
MoWSS Ministry of Water Supply and Sanitation (earlier MoFWSS)
NEWAH Nepal Water for Health
NMICS Nepal multiple indicator cluster survey
NPC National Planning Commission
ODF open defecation free
RWASHCC Regional Water and Sanitation Coordination Committee
SDGs Sustainable Development Goals
SEIU Sector Efficiency Improvement Unit
VDC Village Development Committee
WASH water, sanitation and hygiene
WHO World Health Organization
WSUC Water and sanitation users’ committee
6 ODI Report

How to reduce inequalities in access to WASH: rural water and sanitation in Nepal 7
Executive summary
In this study, we identify and analyse successes and challenges to providing equitable access to quality water, sanitation and hygiene (WASH) services in rural areas of Nepal. We do this with the purpose of identifying entry points for change that can support government and non-government agencies in their efforts to ensure that ‘no one is left behind’ in meeting Sustainable Development Goal (SDG) 6, which aims to provide access to water and sanitation for all by 2030.
This report is part of a global study commissioned by WaterAid UK, aimed at understanding plausible pathways of change to promote broad-based and equitable access to water, sanitation and hygiene (WASH) services. We conducted a political-economy analysis exploring the incentives, constraints and opportunities, with a focus on the poorest fifth of the population. Two other country case studies and a synthesis report are available.
We find that despite modest growth, Nepal has experienced notable poverty reduction in both income and non-income indicators in the last two decades due to an increase in government attention and donor funding for sectors such as health, education, water, sanitation and agriculture, as well as an increase in remittances from Nepalis working abroad. Using the international poverty line of $1.25 per day, the incidence of poverty has declined from 68% in 1996 to 53% in 2004 and 25% in 2011 (ADB, 2013). Not only did Nepal meet its target on halving poverty by 2015 under the Millennium Development Goals (MDGs) but also met targets on infant mortality, under-five mortality and on increased coverage of water supply.
Progress in the expansion of WASH has been linked to Government commitments to international agreements such as the MDGs and the UN Water Supply and Sanitation Decade (1981-1990), which drew finance and expertise to the WASH sector. Additionally, the slower progress on sanitation access compared to water has stimulated the Government to focus on sanitation through the open defecation free (ODF) movement. The dominance of approaches such as community led total sanitation and local water and sanitation user committees are emblematic of a wider push towards devolving WASH service development, implementation and maintenance to the community level – a tactic that appears to have supported increases in average levels of access.
Advances in the WASH sector have, therefore, occurred alongside broader reduction of poverty levels, concerted Government effort, and the localisation of responsibility
and ownership for WASH to communities. However, these trends are not valid for the entire Nepali population and significant pockets of deprivation in WASH remain. For instance, Joint Monitoring Plan (JMP) 2015 estimates show substantial progress in extending access to improved water and sanitation in rural areas of the country between 1990 and 2015 – from 63% to 92% in the case of rural water supply and from 2% to 44% in the case of sanitation (WHO and UNICEF, 2015). However, gains have been unevenly distributed across urban and rural areas, between ecological zones (the mountains, hills and low-lying Terai) and across wealth quintiles. There are categories of people in Nepal who remain excluded from the reach of water and, in particular, sanitation services, reflecting wider patterns of inequality in the country. The earthquakes of April 2015, combined with disputes with India in the southern Terai belt of Nepal, significantly affected categories of people already marginalised in the country: respectively, people living in remote hilly areas beyond access of government services and relief efforts, and the income and status poor Dalit and Madheshi population in the Terai belt.
Overall, marginalisation in WASH in Nepal appears to occur along the following lines:
• Geography and topography. Small and dispersed populations, especially in hilly and mountainous terrain, impact on the unit cost of providing services, making investments for WASH services economically challenging.
• Ethnicity and caste affiliation. People belonging to the Dalit caste, the Madhesi ethnic group and the Janajati, or indigenous nationalities have been long discriminated against, including at community level e.g. blocking access of Dalit populations to communal water taps and the refusal of landlords to allow Dalit or Madhesi tenants to build sanitation facilities on their land.
• Gender (women and girls), age (children and the elderly) and disability status exclude certain groups from local water and sanitation users’ committees (WSUCs) that maintain and operate the local water and sanitation schemes.
In addition, wider political and economic factors influence Government, community and household priorities and behaviours around tackling WASH inequalities, especially in the Terai region. Government efforts at sanitation in particular have excluded the Terai

belt until 2014, labelling the area ‘difficult to work in’ for cultural and geographical reasons. Of particular relevance to the Terai belt is the open border with India which puts residents in Nepal (which practices a no-subsidy for household toilets policy) in close contact with sanitation policies employed by the government of India (which has historically subsidised toilet facilities). Across the country, imperfect data on poverty and (especially) other markers of marginalisation, and how these relates to WASH, masks the extent of the challenge. A stalled process of decentralisation appears to have limited the ability of marginalised groups to exercise effective political voice from the local level, or influence local budgeting processes.
Finding entry points for change means navigating the multiple layers of exclusion that have left certain groups out of broad governmental efforts to improve WASH services. In order to combat the persistent inequalities that block access to WASH services, the Government of Nepal, local and international NGOs as well as donors should:
• consider provision of WASH in the context of active legal instruments intended to overturn socially exclusive norms
• support the efforts to improve data on populations and areas that have been left behind
• engage with local project planning and prioritisation processes to encourage more inclusive and accountable services and support sustained dialogue with groups identified in the local context as gatekeepers to safe and equitable WASH practices.
Among WASH sector stakeholders, these recommendations could be taken forward as part of a strengthened planning and review process, built around the new Sector Development Plan and a strengthened Joint Sector Review process. This fits with recent analysis that suggests that the Plan and Review are important building blocks of WASH sector progress, but there is a need to reinforce accessibility, reliability and usability of data as a basis for decision making, and to improve linkages with local processes and governance (WaterAid, 2016).
Such interventions within the WASH sector will need to be sequenced with, and where possible support, corresponding shifts in the wider policy environment. These include: strengthening oversight systems by conducting local elections to increase grassroots accountability; and working towards effective fiscal and political decentralisation. Such issues need to be approached in collaboration with representatives in other social and economic sectors, but WASH representatives can take a leading role to unify a broader set of interest groups.
8 ODI Report
How to reduce inequalities in access to WASH: rural water and sanitation in Nepal 9
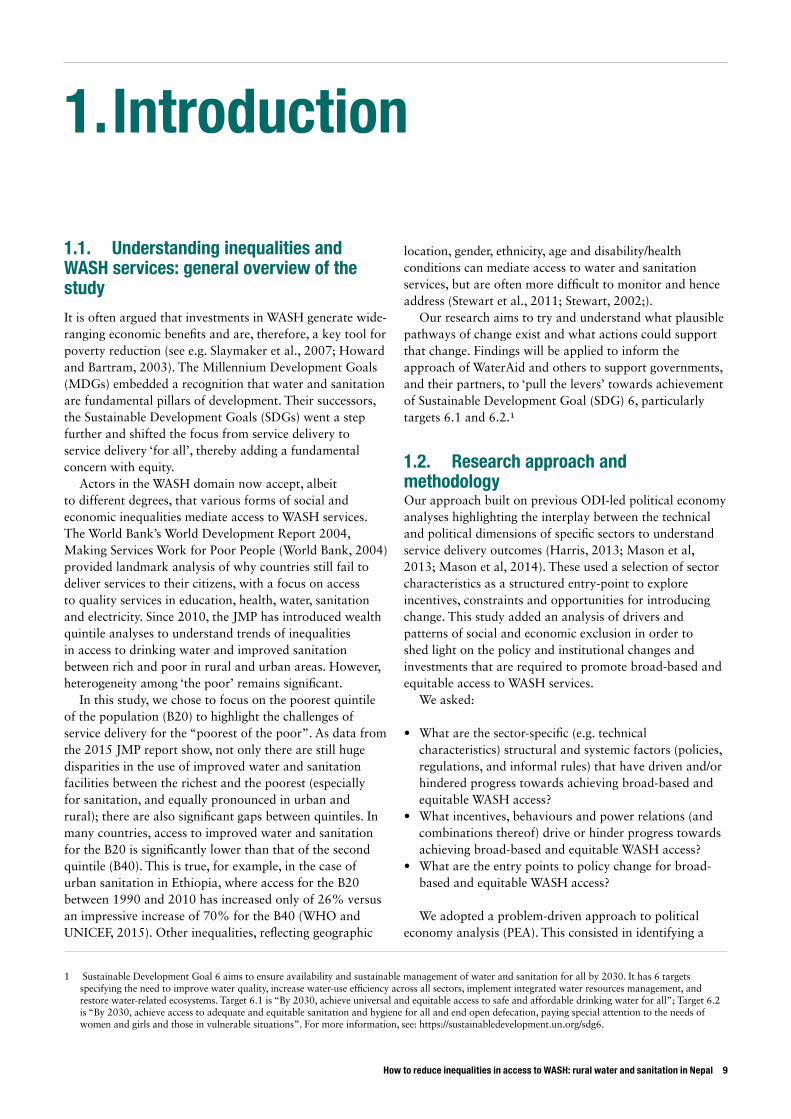
1. Introduction
1 Sustainable Development Goal 6 aims to ensure availability and sustainable management of water and sanitation for all by 2030. It has 6 targets specifying the need to improve water quality, increase water-use efficiency across all sectors, implement integrated water resources management, and restore water-related ecosystems. Target 6.1 is “By 2030, achieve universal and equitable access to safe and affordable drinking water for all”; Target 6.2 is “By 2030, achieve access to adequate and equitable sanitation and hygiene for all and end open defecation, paying special attention to the needs of women and girls and those in vulnerable situations”. For more information, see: https://sustainabledevelopment.un.org/sdg6.
1.1. Understanding inequalities and WASH services: general overview of the studyIt is often argued that investments in WASH generate wide-ranging economic benefits and are, therefore, a key tool for poverty reduction (see e.g. Slaymaker et al., 2007; Howard and Bartram, 2003). The Millennium Development Goals (MDGs) embedded a recognition that water and sanitation are fundamental pillars of development. Their successors, the Sustainable Development Goals (SDGs) went a step further and shifted the focus from service delivery to service delivery ‘for all’, thereby adding a fundamental concern with equity.
Actors in the WASH domain now accept, albeit to different degrees, that various forms of social and economic inequalities mediate access to WASH services. The World Bank’s World Development Report 2004, Making Services Work for Poor People (World Bank, 2004) provided landmark analysis of why countries still fail to deliver services to their citizens, with a focus on access to quality services in education, health, water, sanitation and electricity. Since 2010, the JMP has introduced wealth quintile analyses to understand trends of inequalities in access to drinking water and improved sanitation between rich and poor in rural and urban areas. However, heterogeneity among ‘the poor’ remains significant.
In this study, we chose to focus on the poorest quintile of the population (B20) to highlight the challenges of service delivery for the “poorest of the poor”. As data from the 2015 JMP report show, not only there are still huge disparities in the use of improved water and sanitation facilities between the richest and the poorest (especially for sanitation, and equally pronounced in urban and rural); there are also significant gaps between quintiles. In many countries, access to improved water and sanitation for the B20 is significantly lower than that of the second quintile (B40). This is true, for example, in the case of urban sanitation in Ethiopia, where access for the B20 between 1990 and 2010 has increased only of 26% versus an impressive increase of 70% for the B40 (WHO and UNICEF, 2015). Other inequalities, reflecting geographic
location, gender, ethnicity, age and disability/health conditions can mediate access to water and sanitation services, but are often more difficult to monitor and hence address (Stewart et al., 2011; Stewart, 2002;).
Our research aims to try and understand what plausible pathways of change exist and what actions could support that change. Findings will be applied to inform the approach of WaterAid and others to support governments, and their partners, to ‘pull the levers’ towards achievement of Sustainable Development Goal (SDG) 6, particularly targets 6.1 and 6.2.1
1.2. Research approach and methodology Our approach built on previous ODI-led political economy analyses highlighting the interplay between the technical and political dimensions of specific sectors to understand service delivery outcomes (Harris, 2013; Mason et al, 2013; Mason et al, 2014). These used a selection of sector characteristics as a structured entry-point to explore incentives, constraints and opportunities for introducing change. This study added an analysis of drivers and patterns of social and economic exclusion in order to shed light on the policy and institutional changes and investments that are required to promote broad-based and equitable access to WASH services.
We asked:
• What are the sector-specific (e.g. technical characteristics) structural and systemic factors (policies, regulations, and informal rules) that have driven and/or hindered progress towards achieving broad-based and equitable WASH access?
• What incentives, behaviours and power relations (and combinations thereof) drive or hinder progress towards achieving broad-based and equitable WASH access?
• What are the entry points to policy change for broad-based and equitable WASH access?
We adopted a problem-driven approach to political economy analysis (PEA). This consisted in identifying a

specific problem – in the case of this study, the progress or lack of progress in improving access to WASH for the poorest. We then analysed the structural features that characterise the problem, i.e. formal policies and regulations and informal rules, as well as how formal rules are informally applied in practice. We also took into account power, incentives and behaviours, thus going from what formal and informal rules maintain the status quo, to a deeper interrogation of why those rules, and therefore the problem, persist. Data was primarily gathered through key-informant interviews in the course of fieldwork, and following the six categories of incentive proposed by Harris and Wild (2013) (see box 1).2
1.3. This report: Nepal case study This report focuses on Nepal’s rural sanitation and water supply subsectors. Nepal has made some progress in the last two decades in improving access for poor people and, to some extent, in reducing inequalities in these subsectors.
The provision of WASH for the poorest quintile of Nepal’s population has occurred in a context of significant progress in reducing poverty over two decades despite uneven economic growth. Using the international poverty line of $1.25 per day, the incidence of poverty has declined steadily from 68% in 1996 to 53% in 2004 and 25% in 2011 (ADB 2013). Despite the remarkable decline in the overall poverty level, poverty in rural Nepal is still higher than in urban Nepal, even though rural poverty is declining at a faster pace than urban poverty. While urban poverty fell from 22% in 1996 to 10% in 2004, it rose to 16% in 2011 (ADB 2013). Rural poverty has meanwhile declined continuously from 43%, to 35%, toto 27% (1996, 2004 and 2011, respectively. ADB 2013).
Inequality figures in Nepal have been recorded for three years: 1996, 2004 and 2011. Inequality increased between 1996 and 2004, but narrowed in 2011. The Gini coefficient widened from 0.34 to 0.41 between 1996 and 2004, then went down to 0.33 in 2011 (ADB 2013). Rural inequality in the country was lower than urban inequality and both followed the national trend of registering an increase between 1996-2004 followed by a decrease in 2011 to levels below those of 1996 (ADB 2013).
2 For Nepal, fieldwork took place from 18th to 26th October 2016. During this period, the researcher conducted key informant interviews with 24 expert interviews who were identified purposively in consultation with WaterAid Nepal (see appendix 1).
Box 1: Six categories of incentives
• Oversight: The extent to which oversight systems effectively link actors along the service delivery chain, expose them to incentives and sanctions set by others, and permit them to deploy incentives and sanctions for others.
• Coherence: The degree of coherence in policies and processes for implementation –in terms of whether they are applied (or can be expected to be applied) in a uniform and integrated manner across time, space and groups of people.
• Autonomy: The capacities and scope to come together to solve shared problems locally, or act individually.
• Rents: The availability and distribution of rents, i.e. the potential for actors to derive a benefit without contributing productively.
• Credibility: The extent to which competitive advantage, political or otherwise, can be obtained by making and fulfilling commitments to an electorate or other power base.
• Moral hazard: The degree to which risk-takers are insulated from the consequences of their decisions.
Source: Harris and Wild (2013)
10 ODI Report

How to reduce inequalities in access to WASH: rural water and sanitation in Nepal 11
2. Understanding the problem
3 For further information on historical patterns of exclusion see Gellner (2007).
4 For this reason, this paper will refer to the five development regions in order to convey the primary data accurately.
5 According to the Ministry of Urban Development (2015) the process of allocating municipality and urban status to areas in the country is largely political and very rarely takes into consideration criteria such as population density and urban growth rates. For the purposes of this paper, areas are defined as urban or rural depending on current classification by the Government of Nepal, as evinced in planning documents and interviews.
6 The term is ill-defined, as it includes not just ethnicities and castes in the Constitution but has also been used broadly to refer to women and people with disabilities and to indicate a general category of marginalised people.
7 The geographical divisions –the Terai Region, the Hill Region, the Mountain Region and theTrans-Himalayan Region – when discussing comparative levels of WASH services.
Overall, the rural WASH sector in Nepal is showing some improvements in increasing access for the poorest. This is in a context of strong progress on income and other dimensions of poverty, and fairly stable (and relatively low) levels inequality. However, it still has some way to go – as we will see in this section.
2.1. Wider development trends in NepalIn Nepal, improvements in terms of poverty reduction have been accompanied by dramatic improvements in non-income dimensions of well-being. The country reduced multidimensional poverty three-fold against the Multidimensional Poverty Index (MPI) (from 0.35 to 0.12) over the period 2006-2014, indicating increased access to education, health, and access to basic services (OPHI, 2010; 2016). However, gains have been unevenly distributed across urban and rural areas, ecological zones of the country and wealth quintiles. Inequality in Nepal is historically deeply rooted in practices that sought to separate land owning and administrative elites from those who were dependent on them by blocking access to power and mobility.3
Nepal has been formally divided into 7 federal provinces since the promulgation of the new Constitution in 2015. Each province was formed by grouping together 75 pre-existing districts. However, as the process of reorganisation is still ongoing, government officials continue to refer and organise their work around the previous division of Nepal into 5 constituent development regions (Eastern Development Region, Central Development Region, Western Development Region, Mid-Western Development region, Far-Western Development region).4
Comparing the situation of urban and rural Nepal5, most urban households (67%) are situated in the richest
quintile; 89% of these are in Kathmandu valley. Rural households are six times more likely to be in the poorest quintile than urban households. The inequality between urban and rural areas is also of interest as marginalised populations recognised to be comprised of ‘backward castes/classes’6 – Dalits, Madhesis, and Janajatis according to the Constitution (Government of Nepal, 2015) – are concentrated in remote rural areas. Furthermore, mainly rural areas are also those parts of Nepal that have proved difficult to access e.g. the Terai region, the mountainous mid-Western region and the hilly Far-Western region.
The poverty headcount in the Far-Western Development Region is the highest as calculated by both the MPI 2016 and the Central Bureau of Statistics. Poverty incidences by caste and ethnicity are highest amongst the hill and Terai Dalits.7 In 2011 financial year (FY) these groups were still the poorest with 44% of poor amongst the hill Dalit population and 38% poor amongst the Terai Dalit population (ADB 2013). Following the Terai Dalit group, poverty incidences were highest amongst the other ‘backward castes’ in the Terai areas at 29% in FY 2011, which was followed by the hill Janajatis at 28% (Nepal CBS, 2011).
Remittances can explain a large part of the gains in terms of poverty reduction. Accounting for almost 30% of Gross Domestic Product (GDP) in 2014, Nepal’s remittances are its most important source of foreign exchange, amounting to 2.5 times that the value of exports of goods and services and over two thirds of imports (IMF 2015). The bulk of remittances come from migrant workers in Persian Gulf countries and Malaysia. In recent years, the outflow of workers from Nepal has outpaced that of Pakistan, Bangladesh, Sri Lanka and the Philippines— all larger countries than Nepal, whose migrant workers head to similar destinations. The number of registered migrant

workers leaving Nepal hit a record high of almost 600,000 in 2014 – a very large share for Nepal’s population of about 28 million. Correspondingly, the growth of remittances has averaged 15% per year since 2009/10 (IMF, 2015).
The country is politically and administratively structured into 75 districts, 58 municipalities and 3915 Village Development Committees (VDCs). However, local elections, introduced in 2002 as a critical component of the country’s decentralisation efforts, have not been held to date. The Federal Constitution has envisioned 7 provinces and the existing 75 districts as coordinating political layers, under which local government units such as municipalities and gaunpalikas will be created. In March 2015, the government formed a Local Level Restructuring Commission to make recommendations on how the number and boundaries of the local units should be fixed in order to hold local elections. Up until October 2016, the Commission and major political parties were still divided as to how to fix boundaries (Ghimire, 2016). Consequently, decentralisation has not occurred in practice and the government continues to function in a centralised fashion with a centrally appointed government officer heading each of the 75 districts in lieu of a local elected official.
In the last two years, Nepal experienced two major setbacks. In April 2015, the country was devastated by a series of earthquakes of 7.8 and 6.9 magnitudes within a 17- day interval, followed by aftershocks. The National Planning Commission (NPC) estimated that the total value of damages and losses in the water and sanitation sector caused by the earthquakes stood at $107 million (NPC, 2015a). Over 9,000 lives were lost due to the earthquake, and around 600,000 houses and almost 300,000 toilets were destroyed (Wolfson, 2016). The earthquakes were also setbacks for the sanitation campaigns, especially in 14 highly affected districts. However, in the aftermath, the activation of the emergency WASH cluster coordination system, led by the Department of Water Supply and Sewerage (DWSS), provided access to water, sanitation and hygiene to most of the affected population.
Nepal’s sanitation movement continued to achieve results with the number of open defecation free (ODF) districts doubling from 15 in 2014 to 31 by the end of 2015 (UN Habitat et al, 2016).
Nepal’s economic progress was severely halted between September 2015 and January 2016. Partly, this was a consequence of the earthquakes. However, the suspension of cross-border trade with India also played an important role. This occurred when Madhesis in the southern Terai belt of Nepal protested against the new Constitution by setting up blockades – with unofficial support from India according to the Government of Nepal. The blockade stopped fuel, raw materials and other essential commodities coming into Nepal, leading to shortages and rising prices
8 The MDG targets on water and sanitation required signatory government to ‘Halve, by 2015, the proportion of the population without sustainable access to safe drinking water and basic sanitation’.
for these commodities, including construction materials needed by governmental and non-governmental agencies to rebuild the infrastructure that had been damaged by the earthquake. In the eyes of many government officials, this confirmed the bias that the Terai region, which already recorded the lowest coverage of sanitation in the country, was a difficult area in which to implement government programmes.
2.2. Rural WASH snapshotThe Government of Nepal has set a national target for providing a basic level of water services and access to improved sanitation for all by the end of 2017 (100% of the total population, which is 22.6 million according to the 2011 census; Steering Committee for National Sanitation Action, 2011). As per Government estimates 85% of the total population had access to basic water supply services and 62% has access to basic sanitation facilities by the 2011 Census (Sector Efficiency Improvement Unit, 2016). This compares to estimates of 92% coverage for improved water supply and 46% for improved sanitation, from the JMP. Government and JMP estimates of coverage often differ because the latter are derived using best-fit trend lines, applied to estimates from various nationally representative household surveys. We therefore consider the prevalent definitions and more detailed data used within Nepal’s WASH sector, particularly by Government stakeholders, below. Irrespective of data source, however, while Nepal achieved the MDG targets for water supply (73%) it is still working towards halving the number of people without sanitation facilities in the country, from a low base.8
As noted, the focus of this paper is on water supply and sanitation services in rural areas in Nepal. The JMP estimates that 92% of the Nepali population had access to improved water sources in rural areas in 2015 (up from 63% in 1990), versus 91% in urban areas (declining from 97%) (WHO and UNICEF, 2015). Access to improved sanitation was estimated to be lower in rural areas at 44% (up from 2% in 1990) compared to 56% in urban areas (up from 35%).
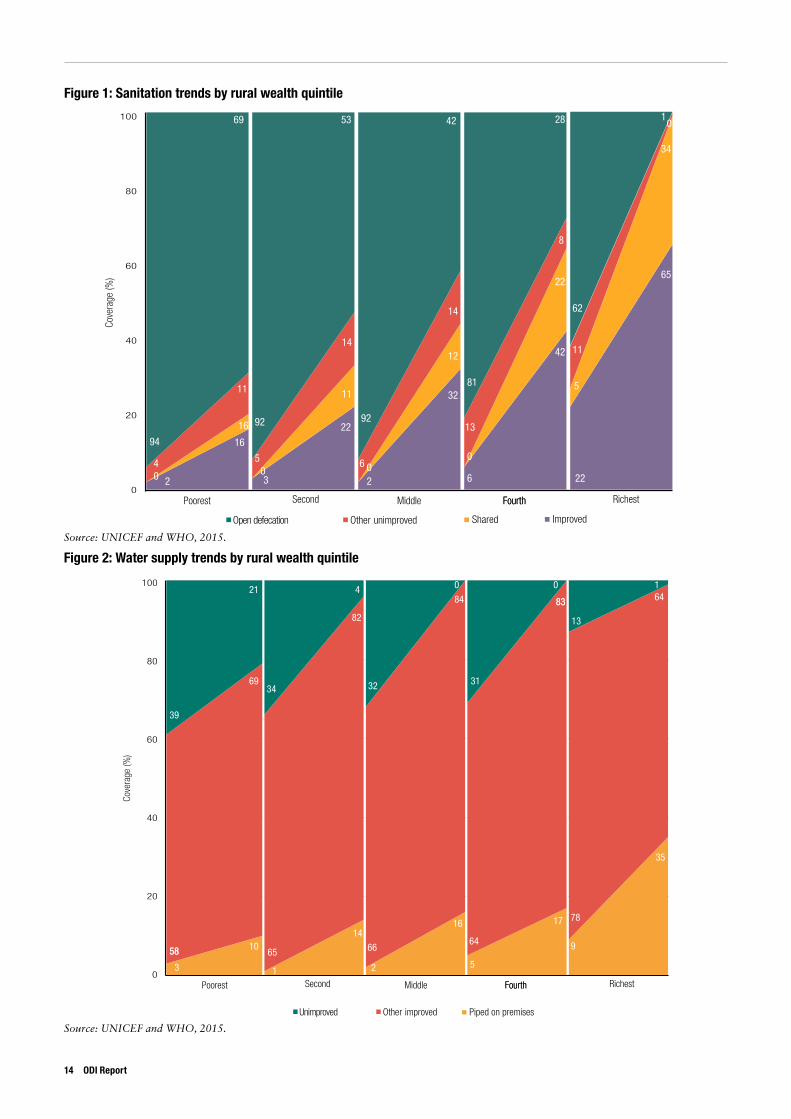
The JMP estimates also suggest that disparities remain between the poorer and wealthier groups in society. In rural areas, progress in the reduction of open defecation was more pronounced in the richest quintile than in the poorest quintile; the % of the population not practicing open defecation increased from 38% to 100% in the richest quintile from 1995 to 2012, while for the poorest quintile the increase was from 6% to 31%. (WHO and UNICEF 2015) Progress in providing access to improved sanitation followed a similar pattern (Figure 1, overleaf). For drinking water, the poorest fifth of the population have lag behind, with over 20% still not having access to an improved
12 ODI Report

How to reduce inequalities in access to WASH: rural water and sanitation in Nepal 13
source, while for all other wealth quintiles universal access is largely achieved. Access to piped water in 2012 was noticeably more likely for the wealthiest than those in other quintiles, having increased at a faster rate, from a slightly higher base, since 1995 (Figure 2, overleaf).
Nepal has made some progress in increasing the share of the poorest that have access to improved WASH services in rural areas, and in absolute terms the poorest 20% are not being left behind to the same extent as in other countries. Our research therefore aims to uncover not only the reasons for whatever progress has been made, but also what has impeded greater progress occurring.
2.3. Deeper dive on Government data and definitions
2.3.1. WaterBasic water service indicators set by the government of Nepal (Ministry of Physical Planning and Works, 2004) specify that water quantity for domestic use should be 45 litres per capita per day (l/c/d). In no case should per capita water availability be lower than 25 l/c/d. However, it appeared that ‘in very remote areas, we also accept if 10 l/c/d of water is made available’ (Key informant interview, 2016). On the dimension of accessibility, the government specifies that for public taps, the horizontal and vertical distance to reach a tap stand should be no more than 150 meters and 50 meters respectively. All households should be able to fetch water within 15 minutes per round trip.
According to the Nepal Multiple Indicator Cluster Survey (NMICS) 2014 , the % of households estimated to have access to piped water via a connection in their home, yard or plot was estimated at 20% in rural areas and 52% in urban areas (UNICEF and CBS, 2014). In rural villages, most drinking water is provided through public taps and tube wells or boreholes. The predominant water supply technology in the hill and mountain regions of Nepal is gravity fed water systems. The JMP quintile data suggests unimproved water sources are more commonly used by the rural poor.
According to Government figures, 43% of community managed water does not meet the national basic service level standards. Adherence to the Government target time for a round-trip collection of 15 minutes is also a challenge. The highest proportion of household members taking 30 minutes or more to collect water was in the Mid-Western Hills (30%; UNICEF and CBS, 2014).
Household members in rural areas were less likely than those in rural areas to treat water if accessed from an unimproved source. The education level of the household head and the household’s wealth were both positively associated with the likelihood of treating water. Treating water was markedly higher among the richest households (UNICEF and CBS, 2014).
A water quality testing module was included in the for the first time in the 2014 NMICS, aiming to collect data on the quality of water actually consumed in Nepal through a test for microbiological parameters such as E. coli and total coliform count. Overall, more than four-fifths (82%) of household members were at risk of E. coli concentration ≥ 1 cfu/100 ml in their household water. People living in the richest households were less likely than those living in the poorest households to have E. coli in their drinking water (64% vs. 91%).
2.3.2. SanitationThe Government of Nepal defines an improved sanitation facility as one that hygienically separates human excreta from human contact. Improved sanitation facilities for excreta disposal include flush or pour flush to a piped sewer system, septic tank or pit latrine; ventilated improved pit latrine; pit latrine with slab; and use of a composting toilet.
According to NMICS 2014, approximately 72% of the population of Nepal lived in households using improved sanitation facilities while 26% still practiced open defecation. People in urban areas were much more likely than rural areas to use improved sanitation facilities (94% as opposed to 67% in rural areas). The JMP figures for 2015 showed a higher proportion of the population practicing open defecation (32%). Similarly, while the trend for improved sanitation echoed NMICS findings in that urban areas did better than rural areas, the absolute estimates for improved sanitation are lower. In urban areas coverage of improved sanitation facilities extended to 56% of the population while in rural areas it extended to 44% of the population.
Considering wealth-based inequalities in access, the JMP 2015 wealth quintile estimates suggest the proportion of population practicing open defecation increases, the lower the wealth quintile (Figure 1, overleaf). However, the NMICS 2014 indicated that overall open defecation was least practiced in the poorest, fourth and wealthiest quintiles while the second and third quintiles had comparatively high rates. Interviewees explained this phenomenon by pointing out that the population most deprived in terms of sanitation was the Terai population, which would typically be found in the second and middle wealth quintiles (Key informant interviews, 2016). According to the NMICS 2014, the highest proportion of household members using improved sanitation facilities was in the Western Hills (94%) and the lowest was in the Central Terai (42%).
Cove
rage
(%)
Poorest Second Middle FourthFourth Richest0
20
40
60
80
100
16
42
14
92
204
16
11
94
69 53
92
14
11
22
503
12
32
6 02 6
0
13
42
22
8
28
81
10
34
65
62
11
5
22
Open defecation Other unimproved Shared Improved
Figure 1: Sanitation trends by rural wealth quintile
Source: UNICEF and WHO, 2015.
8383
Poorest Second Middle FourthFourth Richest0
20
40
60
80
10021
39
69
58
3
10
1
14
65
82
34
58
4 0
32 31
0 1
13
8384 64
66
2
16
64
5
17
9
35
78
Unimproved Other improved Piped on premises
Cove
rage
(%)
Figure 2: Water supply trends by rural wealth quintile
Source: UNICEF and WHO, 2015.
14 ODI Report

How to reduce inequalities in access to WASH: rural water and sanitation in Nepal 15
3. Political and institutional trajectory of the rural WASH sector
The rural WASH sector in Nepal is a crowded space filled with multiple government agencies, and national and international non-governmental organisations. Although the sector appears to have received increasing prioritisation, attempts at a convergence of approaches and efforts have been limited to the formation of regional and national committees that meet infrequently. The promulgation of a new constitution in 2015 has effectively put the country in a transition space where administration proceeds in an ad hoc manner as the country awaits local elections. Meanwhile, international donors and NGOs continue a strong collaboration with the government in the WASH sector, influenced by the success of community led sanitation approaches in countries such as Bangladesh.
3.1. Political prioritisation of WASHThe Department of Water Supply and Sewerage (DWSS), was established in Nepal in 1972 as the lead agency on WASH. It now sits under a dedicated Ministry of Water Supply and Sanitation (MoWSS), created at the end of 2015. However, until the early 1990s, the development of the sector was solely guided by periodic 5-year plans and the annual budget, without a separate sector policy. International attention to Nepal’s sanitation coverage has been in part responsible for shifting the status quo towards advances in the WASH sector. Meetings of the regional South Asia nations’ forum (SAARC) in 1992 highlighted the poor situation of Nepal in relation to its neighbours on water and sanitation coverage. The 1992 Enhanced
Rest room on wheels, Kathmandu. Photo: © Sharada Prasad CS.
8th Five Year Plan increased the allocation for water and sanitation compared to previous years, and called for organisational changes to support improved and expanded sanitation implementation (NPC 1992).
The first policy document on WASH was the Nepal National Sanitation Policy and Guidelines for Planning and Implementation of Sanitation Programmes published in 1994. It resulted in the formation of National and District Water Supply and Sanitation Coordination Committees in 1995. According to our interviews, the rise of interest in WASH in the 1990s was closely connected to other international events such as the declaration of the UN Water Supply and Sanitation Decade 1981-1990, which led to aid agencies supporting: a) community based approaches to the WASH sector; b) an increased focused on rural areas; c) availability of resources and expertise for the WASH sector (Key informant interviews, 2016; Hänninen, 2014). The importance of sanitation is evident in successive five year plans in the period: the 8th Five Year Plan (1992-1997; NPC, 1992); 9th Five Year Plan (1997-2002, NPC, 1997); and 10th Five Year Plan (2002-2007, NPC, 2002).
In Nepal, the rise of the importance of WASH occurred alongside the increased emphasis that the government put on the education and health sectors. In 1990 Nepal reinstated multiparty democracy, which gave local government institutions wider powers than those held by the previous party-less and monarchical Panchayat system. Although multiparty local government elections were held in 1992 and 1998, elected local government bodies were disbanded in 2002 and local elections have not been held since. Initially, however, the 1990s were years of political liberalisation with a focus on decentralisation. This period saw important new sector actors emerge, such as community groups, local bodies, and the private sector – including non-governmental organisations (Key informant interviews, 2016). By the middle of the 1990s, opposition to the monarchy culminated in a Maoist revolution in 1996 leading to a decade-long armed conflict, which ended in 2006 when Nepal was declared a federal democratic republic. Despite the political instability, Nepal continued to record gains in nutrition, reduction of under-5 child mortality and reduction in maternal mortality (Nepal Ministry of Health and Population, 2015), and gains in primary school enrolment (particularly girls) (World Bank, 2007) alongside gains in water and sanitation access.
According to the literature, and as confirmed by our interviews, there are three main reasons that can explain the persistence of improved indicators of non-income well-being despite conflict and modest economic growth. The first reason is that, in most instances, neither the rebels nor Government forces purposely disrupted the delivery of health, education or WASH services, in order to keep local people on their side (Key informant interviews, 2016). Secondly, the spread of community based approaches to health and WASH services in the late 1990s meant that
there was functional community support for projects from local residents that would often include rebels, thus removing the incentive to dismantle local development projects (Key informant interviews, 2016). Finally, increased public investments in health and education and community-led health and sanitation campaigns have contributed to the improvement of social indicators even in years of conflict. This often came with donor support, filling the space left by the Government’s constrained ability to provide oversight from the centre due to high turnovers in the civil service.
Government expenditure on health as a share of GDP has shown a continuous rise from 27% in 1995 to 40% in 2014 (World Bank, 2016). Similarly, in terms of% of GDP, the education budget rose from 4% in 2006, to 5% in 2014 (UNESCO 2016). The budget for the WASH sector has also recorded a year on year increase, going up from c.$130 million in 2010 to c.$280 million in 2016, based on exchanged rates at the time (9.2 billion Nepali rupees in 2010 to 29.3 billion Nepali rupees in 2016). WaterAid (2004) state that total expenditure in the drinking water and sanitation sector in financial year 2003/2004 was $48 million, which compares with an average annual expenditure of $26 million in the 1990s. The government has recognised that 52% of the budget in the sector is dependent on donor funds (SEIU 2016). This is not unusual however. Foreign aid plays a significant role in Nepal’s socioeconomic development, and represents over 26% of the national budget (Ministry of Finance, 2012) and 67% of the public sector budget (UNDP, 2010).
The picture of persistent and growing commitment of government and development partners to social sectors including WASH, with resulting improvements in indicators, is probably more valid in the aggregate than for marginalised and excluded populations. Progress across indicators was recorded for the general population. We have already seen, however, that the averages mask inequalities in outcome where the progress for marginalised populations did not occur at the same level as it did for the general population. In health, maternal mortality is higher among women from mountain districts, rural areas, and in certain caste/ethnic groups (Suvedi et al 2009). In education, geographic disparities are large; lower secondary net enrolment ratios in the Mid-Western region were about 12percentage points lower than those in the Western region. Muslims and Dalits also recorded below average lower secondary and secondary school net enrolment ratios (World Bank, 2007).
Both in literature and in interviews, gender, caste, ethnicity and remoteness have been identified as characteristics that mediate access to WASH in Nepal. Disability and age (of children and elderly) were infrequently mentioned in interviews and literature (Nepal Ministry of Urban Development, 2013). The government discourse suggests that discrimination along the lines of gender and caste has declined over time due to successful
16 ODI Report

How to reduce inequalities in access to WASH: rural water and sanitation in Nepal 17
awareness campaigns in the WASH sector that have corrected information asymmetries so that marginalised communities are made aware of the rights given to them by the state (Key informant interviews, 2016). The question is whether this translates into increased ability to exercise political voice or claim those rights.
Progress in the WASH sector has therefore taken place alongside progress in other dimensions of well-being such as health and education since the 1990s. Progress has been enabled by international attention to human development goals, to which the Government of Nepal has shown strong commitment. Meanwhile, inequalities have persisted in WASH as in other sectors, pointing to broad, societal (rather than sector-specific) patterns of marginalisation. Rural remote areas do worse on health, education and WASH indicators. Marginalised populations such as the Dalits, Madhesis, women and people with disabilities face discrimination in access to various public services and are excluded from government policies (discussed further below). Progress in WASH indicators for these groups has largely been incidental rather than targeted and average figures continue to mask the degree of inequality within Nepal.
3.2. National and local structures of importance for rural WASHThe institutional arrangements in the water supply and sanitation sector entail different layers of Government institutions from central to district and grass root levels. As Nepal waits for local elections, it continues to be administratively divided into 5 development regions, 14 municipalities and 75 districts with the provision of the local government as district level, municipal level and village level. Local bodies have been without elected representatives since May 2002, when the terms of those elected in 1998 expired. As a stopgap measure, successive governments began appointing local officials, and this practice continues today. The WASH sector, like other government sectors, relies on centralised vertical programming. Priorities and programmes are set at the central level by the Ministry of Water and Sanitation and communicated to the local level by the District Water, Sanitation and Hygiene Coordination Committee (DWASHCC). As there have been no local elections since 2002, the local institutions that were put in place to institutionalise democracy in practice have become an extended arm of the Government under the direction of the Department of Local Infrastructure Development and Agricultural Roads (DOLIDAR), which implements
Box 2: National Sanitation and Hygiene Master Plan 2011
First step- open defecation free (ODF) Situation
ODF means ‘open defecation free’ i.e. no faeces are openly exposed to the air. The minimum conditions/indicators/criteria to declare an area to be ODF status are:
• There is no open defecation in the designated area at any given time; • All households have access to improved sanitation facilities (toilets) with full use, operation and maintenance; • All the schools, health facilities and other institutions within the designated areas must have toilet facilities; • Public toilets in public places.
In addition, the following aspects should be encouraged along with ODF declaration process:
• Availability of soap and soap case for hand washing in all households; and • General environmental cleanliness including management of animal, solid and liquid wastes is prevalent in the
designated area.
Second step- Total Sanitised Post-ODF SituationThis phase includes all arrangements leading to sustainable hygiene and sanitation facilities and behaviours.
Although the respective community/VDC/municipality themselves will identify and implement various hygiene and sanitation parameters during the post-ODF step, the following indicators may be suggested to ensure that a ‘total sanitation’ situation is achieved in the given area:
• Use of toilets at households, schools, health facilities and other institutions; • Practice of hand washing with soap at critical times; • Safe handling and treatment of drinking water (e.g. Point of Use treatment) at household’s level; • Proper personal hygiene; and • Proper solid and liquid waste management

programs in each district through the District Technical Office (DTO). DOLIDAR leads the district and local bodies on WASH in areas where the population is greater than 1,000 households. In smaller communities of less than 1,000 households, its parent institution, the Ministry of Federal Affairs and Local Development (MoFALD) assumes responsibility for WASH.
At district level, a DWASHCC is a key WASH structure, nominally led by a Local Government Officer (LGO). However, the centrally appointed LGO also heads parallel committees on roads, electricity and budgetary initiatives. As a consequence, their focus in any given district depends on context and their personal discretion. We interviewed a former LGO. He was aware of the existence of the DWASHCC, but unaware of any particular water or sanitation projects going on in the area; ‘my main focus is on roads to get access to the western part of the district’ (Key informant interviews, 2016). The multiplicity of oversight functions carried out by the LGO means that in practice the work of DWASHCC is led by the other two members of the committee: the Water Supply and Sanitation Division/Sub-Division Offices (WSSD/SDO), which is the technical division office of the of the central DWSS, and the Water and Sanitation Users’ Committee (WSUC). Financial devolution is limited at present,and budget planning in the absence of a local elected body remains centralised. The Ministry of Finance (MoF) sets annual ceilings for each sector and these are then negotiated by sector Ministries and Departments at the sectoral or district level.
The Government of Nepal has formulated and enforced a number of policies, guidelines and acts in the recent years in relation to the WASH sector (see Appendix 1 for a summary). His Majesty’s Government of Nepal (HMGN) started formulating the Water Resources Strategy (WRS) in 1996, which was approved in January 2002 and took the form of the National Water Plan in 2005 (with support from the Canadian International Development Agency and the World Bank). More recently, the Nepal Water Supply, Sanitation and Hygiene Sector Development Plan (2016 – 2030) has also been published (SEIU 2016).
However, the National Water Plan and Nepal Water Supply, Sanitation and Hygiene Sector Development Plan were less often mentioned in interviews and secondary literature. In terms of perceived importance, and usefulness for explaining the trajectory of the rural WASH sector, the most relevant document both in primary and secondary research was the National Sanitation and Hygiene Master Plan 2011, which focused exclusively on sanitation measures. The Plan provides a sequence of improved facilities and hygiene behaviors that the Government of Nepal has committed to incrementally implement with the final goal of achieving full sanitation in the country. The plan concentrates on ending open defecation, through the open defecation free (ODF) movement, as a first significant step to changing behavior. The ODF movement appeared
to be the central focus of the government at the time of interviews. The second step includes all arrangements leading to sustainable hygiene and sanitation behaviours (Box 2, previous page).
The implementation of sanitation goals in the Master Plan occurred within the context of wider regulations that guide the operation of local government and community-based entities. Interviewees pointed to the following as especially relevant:
• Local Self Governance Act (MoFALD, 1991) • District Development Committee Operational
Guidelines (MoFALD, 2010a) • Village Development Committee Operational Guidelines
(MoFALD, 2010b)
The Act states that local government bodies are responsible for providing basic drinking water supply and sanitation facilities. The act thus gives full authority to local bodies - District Development Committees (DDCs), Village Development Committees (VDCs) and municipalities - for decentralised development activities in the territories of their competence. That includes local-level planning, implementation, monitoring and evaluation. VDCs link upwards to the DDCs, which are responsible for overall planning and budget allocation. Each of the 75 districts has a DDC, which is subdivided into VDCs, each comprising of 9 wards. Across all 75 Districts there are a total of c.4000 VDCs, each consisting of a secretary employed by the government, local administrators, leaders and influential community members.
The committees continue to execute local government functions as prescribed in the Local Self Governance Act, such as formulation of annual plans and budgets, oversight of local development projects and ratification of key decisions. While local bodies continue to be governed by centrally appointed government officers, the Water and Sanitation Users’ Committees (WSUCs) remain important. WSUCs are independent community-based organisations, registered for each water and/or sanitation scheme by the DDC. They can make suggestions to the DDC and VDC who approve budget expenditure (Key informant interviews, 2016). 15% of the total budget that is allocated to the local bodies has to be spent on the WASH sector in the area. WSUCs are also responsible for operation and maintenance of water and sanitation projects in collaboration with the VDCs. The VDCs work very closely with the WSUCs, which are represented in DWASHCCs, to implement local projects that receive funding from the central government and the DDC.
Representation and participation in WSUCs is therefore important. They are intended to be made up of 7 to 11 members, with at least 50% female members and fair representation of all social groups in that community. Key positions such as that of chairperson, secretary and treasurer are offered to the female members as far as
18 ODI Report

How to reduce inequalities in access to WASH: rural water and sanitation in Nepal 19
possible; at least one out of three positions should be held by women. The member of the committee should be selected through a mass meeting of all households who will be using the water and sanitation supply. Some interviewees nonetheless suggested that some committees function without the total number of women required, and in certain areas women in the committees have little decision making power, suggesting that criteria for including marginalised populations on WSUCs have not always been enforced in practice.
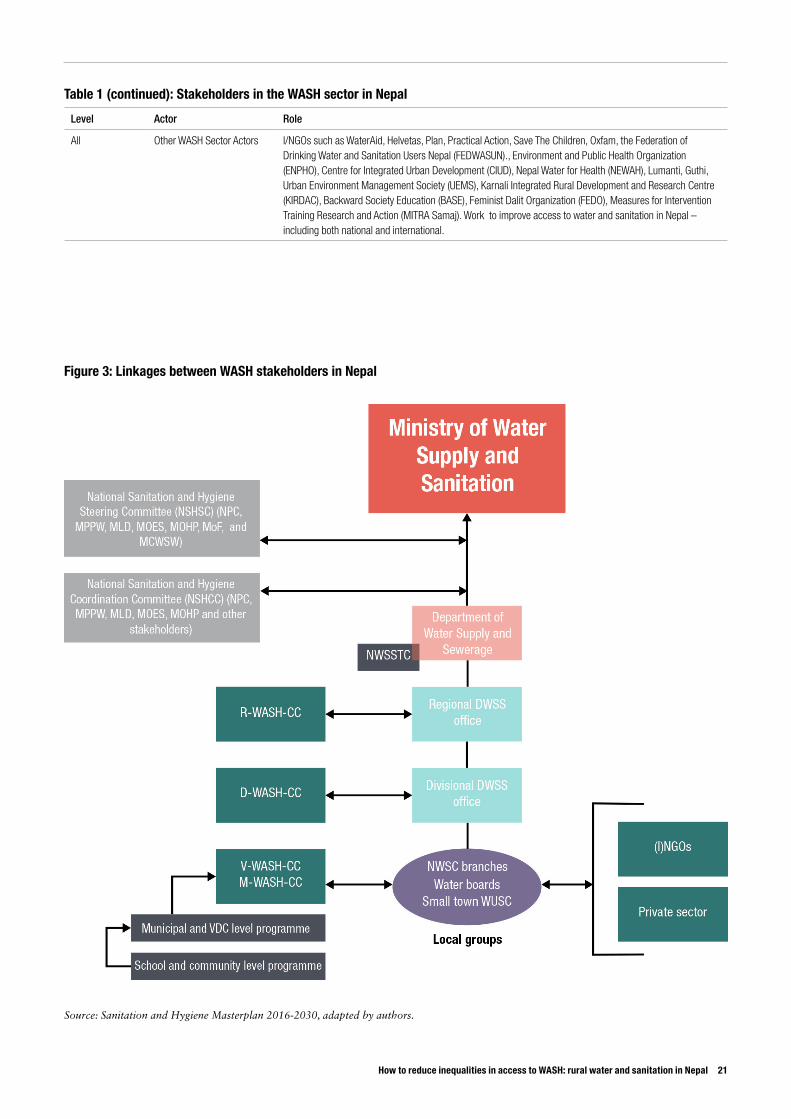
Table 1 (overleaf) provides a brief overview of the wider range of organisations working on WASH, confirming the complex and still quite fragmented nature of the sector, while Figure 3 (page 21) indicates the hierarchy of relations between the different stakeholders.
3.3. Institutions and procedures for planning and financing rural WASHAt national level, the National Planning Commission arranges the budget in collaboration with the Ministry of Finance. Annual allocations are decided centrally by a resource steering committee9 based on annual revenue and expenditure forecasts. This establishes ceilings for each sector, and in turn the ceilings for district and local level bodies. (DDC). The major sources of income for local bodies are intergovernmental transfers that take the form of an unconditional core grant to VDCs and internal revenue generation by the DDCs through taxes and tariffs (WaterAid n.d.). The transfers are based on criteria that include population, area, weighted poverty and weighted cost index (for further information on how grants are allocated to the local bodies see Boex, 2012).
For water supply and sanitation projects funds are devolved to the District Development Committees, which wield considerable authority over planning and coordination. The DDCs select projects annually, in principle on the basis of district development plans that are formulated through a participatory exercise with residents through the WSUCs and the VDCs. The district development plans identify financial and technical support needs for rural water supply and sanitation services. All organisations – governmental and non-governmental
9 Comprised of the National Planning Commission, the central bank and the Ministry of Finance.
– working at the local level are required to work with the DDC and through the priorities identified in the plan. INGOs and donor agencies interviewed for this study confirmed that they could not work directly with the VDCs or WSUCs and had to go through the DWASHCC. Similarly, they could not initiate or work in projects that had not been sanctioned in the district development plan without first seeking approval from the Social Welfare Council and respective District Development Committee.
As stipulated by the 2011 national plan, the VDCs play a lead role in involving WSUCs in the construction of rural water supply and sanitation facilities, including assisting the organised communities to mobilise their contributions in cash and kind. Community contributions are a minimum of 20% of the total cost of water supply, including local and non-local materials and skilled and unskilled labour. At least 1% of the 20% must be in cash. The remainder of the community contribution typically includes unskilled labour and local materials. Similarly, in sanitation the Government has eschewed subsidies for household toilets. For poorer households the Master Plan provides for the establishment of community managed funds that collect money from community members to provide special subsidies for the construction of latrines for poor households. The plan specifies that:
‘for ensuring their access to toilet facilities, locally appropriate support mechanisms will be introduced through the decision of the district, VDC and municipality level coordination committees. By ensuring community contribution, the amount of support (e.g. revolving fund, community reward, material support, etc.) can be flexible for those specially targeted groups. In such areas locally appropriate low cost technological options will be emphasised’.
There is no specific legislation on setting up such a fund, however, and interviewees from the non-governmental sector said that its implementation occurs on an ad hoc basis across the country (Key informant interviews, 2016). Understanding drivers of progress and inequalities in WASH outcomes

Level Actor Role
National Department of Water Supply and Sewerage (DWSS)
DWSS is the lead agency in the sector, exclusively dedicated to planning and implementation of both rural and urban WASH projects.
National National Sanitation and Hygiene SteeringCommittee (NHSC)
Responsible for easing/facilitating the inter-ministerial coordination lead for the promotion of hygiene and sanitation related initiatives in the country.
National National Sanitation and Hygiene Coordination Committee
Responsible for facilitating coordination among concerned stakeholders for the promotion of the hygiene and sanitation related initiatives in the country.
National National Planning Commission
Responsible for guiding and managing national socio-economic development planning, managing the government’s statistical functions, and monitoring and implementing plans and national programs in all sectors (including for MDGs/SDGs).
National Department of Local Infrastructure Development and Agricultual Roads (DOLIDAR)
DOLIDAR is the main implementing agency through its District Technical Office (DTO) at the local level
National Ministry of Federal Affairs and Local Development (MoFALD)
MoFALD assumes responsibility for WASH in smaller communities of less than 1,000 households.
Regional Regional Water and SanitationCoordination Committee(RWASHCC)
Responsible for coordination and monitoring of all hygiene and sanitation promotion activities in regions.
Local District Development Committee (DDC)
Nepal’s 75 District Development Committees (DDCs) make up the top tier of local government in Nepal.
Local Village Development Committee (VDC)
Since 1995, Nepal’s village-level local government bodies have received annual block grants from the central Government for spending on improving local infrastructure and services. The absence of elected local government since mid-2002 means that Nepal’s VDCs rely heavily on their Government-appointed secretaries
Local District water, sanitation and hygiene coordination committee (DWASHCC)
The WASH Coordination Committees at the District (DWASHCC), provides coordination in the preparation of local WASH plans with inputs from WASH Sector Actors and in the effective implementation and monitoring of the local plans
Local Water And Sanitation Users’ Committees (WSUCs)
Consists of 9 users (at least three females); established during construction of a water and sanitation scheme and becomes responsible for O&M after completion of the scheme. Responsibilities includes organising, managing and increasing the operation and maintenance fund for payment of the village maintenance worker, and regular repair and maintenance.
International development partners
ADB Urban water and sanitation sector projects with Ministry of Water Supply and Sewerage (MoWSS)/ DWSS, Ministry of Urban Development (MoUD)/ Department of Urban Development and Building Construction
Embassy of Finland Support to two major bilateral projects to MoFALD and DOLIDAR in rural areas, Currently WASH Sector Development Partner Chair
The World Bank Project with MoWSS/Fund Board in rural areas of Nepal
UN-Habitat Sanitation and hygiene, urban WASH
World Health Organization (WHO)
Water and health, water safety plans and climate change
World Food Programme WASH in Nutrition
Department for International Development (UK)
Gorkha Welfare Scheme
Japan International Cooperation Agency
WASH solutions, capacity building for urban areas
UNICEF Sector development, sanitation and hygiene, WASH in schools, emergency preparedness and response
Table 1: Stakeholders in the WASH sector in Nepal
20 ODI Report
How to reduce inequalities in access to WASH: rural water and sanitation in Nepal 21
Level Actor Role
All Other WASH Sector Actors I/NGOs such as WaterAid, Helvetas, Plan, Practical Action, Save The Children, Oxfam, the Federation of Drinking Water and Sanitation Users Nepal (FEDWASUN)., Environment and Public Health Organization (ENPHO), Centre for Integrated Urban Development (CIUD), Nepal Water for Health (NEWAH), Lumanti, Guthi, Urban Environment Management Society (UEMS), Karnali Integrated Rural Development and Research Centre (KIRDAC), Backward Society Education (BASE), Feminist Dalit Organization (FEDO), Measures for Intervention Training Research and Action (MITRA Samaj). Work to improve access to water and sanitation in Nepal – including both national and international.
Table 1 (continued): Stakeholders in the WASH sector in Nepal
Figure 3: Linkages between WASH stakeholders in Nepal
Source: Sanitation and Hygiene Masterplan 2016-2030, adapted by authors.

4. Understanding drivers of progress and inequalities in WASH outcomes
10 As per government estimates 85% of the total population has access to basic water supply services and 62% has access to basic sanitation facilities (access to toilets) – SEIU (2016)
The Government of Nepal and its partners can be credited with at least some of the significant progress in increasing coverage at the aggregate level: a trend that has not left marginalised groups entirely behind, even if they have tended to benefit incidentally rather than through deliberate targeting. In this section we consider the main drivers of progress, before analysing the reasons why inequalities have persisted.
4.1. Reasons for success of WASH expansion in NepalCritical success factors for the expansion of WASH services in Nepal appear to be the strong role of the Government in developing and rolling out a nationally owned policy and approach to rural water and, particularly, sanitation; productive engagement with the international community including development partners and regional neighbours; and a strong emphasis on community involvement and ownership in implementation approaches.
In 2003, the WASH sector adopted the Community-led Total Sanitation (CLTS) approach, which was originally developed in Bangladesh in the late 1990s. CLTS was introduced to Nepal in 2003 by Nepal Water for Health (NEWAH), Plan Nepal, WaterAid Nepal and others (CLTS Knowledge Hub, 2016). The core element of CLTS included conducting a community led appraisal of sanitation problems aimed at triggering and motivating communities to end the practice of open defecation. CLTS involved no individual household hardware subsidy, which was the main feature differentiating it from previous government programmes that focused on sanitation infrastructure (Kar and Milward, 2011). The approach in Nepal is widely associated with the work of Kamal Kar in Bangladesh during the period 1999-2000. In June 2003, WaterAid Nepal, PLAN Nepal, NEWAH and other government and civil society stakeholders travelled to Bangladesh to visit the Village Education Resource Centre
(VERC) to observe the process and results of sanitation promotion (Allan, 2003). Knowledge gained from the visit was subsequently translated into the first pilot CLTS projects in Karki Danda, Dhading District, Nepal, in October 2003 (WaterAid Nepal, 2006). Since then, the approach has spread throughout the country encouraged by government, INGOs and donor agencies.
Subsequently a Rural Water Supply and Sanitation National Policy was produced in early 2004 and approved by Government. It included the specific requirement that ‘Water and Sanitation Users’ Committees (WSUCs) would be compulsorily registered according to the Water Resources Act 1992 and the Water Supply Regulations 1998.’ UNICEF was closely involved in the formulation of the draft of this policy. It focused strongly on rural water supply and did not consider sanitation in the same detail, highlighting a Government focus at the time on the water supply component of the WASH sector. Interviewees explained the precedence accorded to water supply as a necessary pre-requisite for sanitation facilities (Key informant interviews, 2016).
Over the period 2009-2011, the stark difference between improvements achieved in rolling out the water supply in the country and the very low rate of sanitation coverage10 lent impetus to the creation of a new national sanitation policy. The Government of Nepal in collaboration with UNDP developed an MDG Acceleration Framework that focused on sanitation. In turn, government commitment increased international donor support for sanitation. This process brought about a change from a project based implementation to programmatic implementation; this sector wide approach was encapsulated in the National Sanitation and Hygiene Master Plan of 2011.
Domestically, Joint Secretary of the Ministry of Urban Development Abadh Mishra (appointed in 2011) was seen as crucial to the institutionalisation of sanitation policies and in particular the strength of the ODF movement (Key
22 ODI Report

How to reduce inequalities in access to WASH: rural water and sanitation in Nepal 23
informant interviews, 2016 and UNICEF 2014). Mishra headed the Inter-Ministerial Coordination Committee on Sanitation in Nepal, striving to draw international attention to the issue of sanitation in the country. In 2013, he was central to the decision to host the South Asian Conference on Sanitation (SACOSAN) in Bhaktapur, Kathmandu (Urban Gateway, 2013).
Budgetary allocation for the WASH sector still privileges the water subsector, which receives 80% of the budget, as opposed to the 20% for the sanitation sub-sector (Nepal National Sanitation and Hygiene Coordination Committee, 2016). However, the comparatively lower amount dedicated to sanitation arguably reflects the nature of sanitation policies and campaigns that focus largely on behavioural interventions. International transfer has also contributed to progress: the sanitation subsector has been particularly open to learning from other countries with concepts such as ODF and CLTS, and evolving with its own approaches, such as School Led Total Sanitation. Furthermore, an increase in international migration meant that when migrants returned to their villages, they would often install improved sanitation facilities they had become accustomed to during their time abroad (Key informant interviews, 2016).
While there is more Government funding of infrastructure in the rural water supply subsector, it also retains a strong emphasis on community driven and demand based approaches, with the intensive involvement of WSUCs. The involvement of users in the process was considered central to the expansion of coverage: significantly reducing the burden on the national government’s over-stretched human and financial resources, and laying the groundwork for transferring ownership and maintenance of water infrastructure to the local community.
4.2. Challenges faced by the WASH sectorDespite the success of the community led model in extending coverage of both water and sanitation supply, challenges remain, especially for ensuring coverage of the hardest to reach. In this section we attempt to explain the particular challenges facing poor and marginalised groups, with reference to Nepal’s politics, society and geography.
Some of these challenges relate to the wider WASH policy environment. For example, poor institutional leadership and coordination have prevented the development, until recently, of a compelling vision for serving all Nepali people and particularly the hardest to reach. Other challenges reflect Nepal’s particular geography and topography, and the perceived costs associated with serving different geographic areas. Geographic inequalities are relatively obvious. Nevertheless, much subtler forms of exclusion may be at work within communities, related to the politics of resource prioritisation and planning, prejudice of
individuals or groups, and also how people make economic decisions – all issues that take the focus well beyond the WASH sector. These factors together imply that, while the community-based model has been effective in generating rapid gains in aggregate coverage rates, there needs to be a focus on ensuring it is genuinely inclusive.
4.2.1. Broad based challenges faced by the WASH sectorSlow progress to embed consolidated sector institutions to coordinate across ministries and departments, and across national and local structuresThe WASH sector has lacked a strategic and unified plan that expresses the vision of the Government in both subsectors. The multiplicity of policies that exist to guide the sector is a reflection of the fragmented institutional setup (see Appendix 1). The new Sector Development Plan takes a 15 year perspective and represents a landmark, but at the time of interviews there appeared to be limited awareness of its implications. Coordination has also been a challenge, with multiple actors continuing to work according to project driven modalities. Attempts have been made to coordinate efforts across different actors – government, non-government, INGOs and donors – by establishing national and regional coordination committees. However, these do not meet regularly or subscribe to a schedule of coordination (WaterAid 2016).
A key challenge is to engage departments and ministries other than DWSS and its parent ministry in policy implementation. While most recognise the existence of sanitation policy, they make limited use of it when planning their activities. Interviews within DWSS suggested that the high turnover of positions at the level of Director General also means low awareness about the work of the department. Directives are formulated and issued at the ministry level, and it appears that most of the initiatives were vested in the minister and the joint secretary with the department serving as a conduit for channelling priorities through to a sanitation unit that led the national level campaign on the ODF movement. The absence of coordination and clear leadership leads to overlapping responsibilities and institutional gaps. While this is a general problem, it can have specific implications for inclusion. For instance, while DWSS had recently formed a Gender And Social Inclusion Unit within its offices at the central level, the staff interviewed from the unit were unaware of any specific interventions dealing with the WASH needs of groups based on gender and social criteria in different districts.
At the time of research the Sector Efficiency Improvement Unit within the MoWSS was working on getting parliamentary approval for an umbrella Water Supply and Sanitation Act and a corresponding unified WASH policy that aims to coordinate delivery and implementation at both national and local levels. The impact of the policy remains to be seen.
The quality of water supply, particularly in remote areas, remains a low priorityIssues of quality remain on the backburner of the government agenda. According to NMICS (2014), the chance of detecting E. coli in unimproved and improved sources of water was almost equal (though water from unimproved sources was more likely to be very high risk (47%) compared with water from improved sources (20%)). The Water Quality Surveillance Guideline 2015 endorsed by Ministry of Health awaits implementation due to a lack of cross-sectoral support.
The lack of focus on quality remains perplexing particularly after the fatal outbreak of cholera in Jajarkot in the Mid-Western region in 2009 that affected more than 30,000 people due to the poor quality of water and contamination from open defecation (Pach and Bhattachan, 2014). This could be due to an assumption in the national discourse that the success of the ODF movement would automatically result in improved water quality without the need for additional treatment. It is unclear though if that is the sole or even the main reason for the low focus on quality. A corresponding disinterest by consumers combined with the absence of monitoring systems reinforces the inattention to quality issues. In addition, the frequent landslides and erosion processes in the hilly areas further discourage the construction and maintenance of systems to safeguard water quality. Interviews outside the government suggest that:
‘Access remains the biggest focus, partly because the government has been able to show such high gains but also because it doesn’t seem like anybody is measuring quality. We are trying to push the focus here, to make sure access and quality are not unlinked from each other but there is not much appetite for it at the moment’ (Key informant interviews, 2016).
4.2.2. Key challenges for reaching the unreached
Recognition of the problem and ability to target is impeded by data limitationsThe increase in the coverage in water supply and sanitation facilities in past few decades was mainly attributed to participatory approaches and ownership on part of beneficiaries. Social attitudes towards particular caste, ethnic groups, religion and persons living with chronic illness can be factors in the exclusion of persons or communities from WASH facilities (which are otherwise physically accessible). However, such attitudes can also lead to the exclusion of vulnerable people from participatory processes, actively or simply by majority rule (in areas where marginalised groups are numerically low).
Part of the problem was identified to stem from a lack of knowledge on the proportion and relative strength of marginalised populations in different areas:
‘Often we [NGOs] are unaware of what the exact numbers of Dalit women or disabled people in a place are, unless we directly engage in projects at the local level. This means we cannot often hold accountable local WSUCs about whether they have enough disability friendly taps in the area or enough women on the committee from the Dalit community.’ (Key informant interviews, 2016)
The Central Bureau of Statistics collects and provides data on the total population served but does not provide disaggregated data: neither on the proportion of marginalised groups in the population (which might enable affirmative action quotas to be established for local level committees); nor on access to water and sanitation facilities for marginalised populations such as children, people with disabilities, women and the elderly (Key informant interviews, 2016).
In cases where minorities and the marginalised groups are represented, they lack decision making power. ‘There are Dalit women sometimes who will be part of the WSUC groups, but they never speak up, because they do not feel they have the space or the right to and are there to thumbprint whatever the other members of WSUC decide’ (Key informant interviews, 2016). Local level structures would need to make considerable extra effort for genuine inclusion of members from minority groups, particularly if those groups are numerically small in an area and/or located remotely compared to the village centre. Additionally, there is an absence of strategic plans on how to identify and address the layers of exclusion faced by groups who experience multiple levels of marginalisation e.g. an income poor, Dalit woman living in a remote area. For instance, while a WSUC at the local level needs to have at least 3 female members out of the 9 members comprising the committee, there are no quotas based on caste. Requirements on representation are anyway often met in theory rather than spirit.
Geography and topography shape the perceived incentives for government and households to invest
Geographically, universal access to basic WASH services is a considerable challenge as the unit cost of reaching remote and mountainous areas is high due to the physical difficulty of installing and managing infrastructure in such terrain. It is exacerbated by dispersion of small groups of people across the hill and mountainous areas. In the Mid-Western region, for example, remoteness is a key factor in the delivery of services not just in WASH but also health and education. The Far-Western region is largely hilly while the Mid-Western region is mountainous; these are difficult terrains for establishing infrastructure, particularly water supply systems. Furthermore, the population in the region is scattered and settlements often comprise of as little as four households (Key informant interviews, 2016). As a
24 ODI Report

How to reduce inequalities in access to WASH: rural water and sanitation in Nepal 25
result of climate and land-use changes, the water discharge from a number of springs in the middle hills of Nepal is on the decline, creating not only a situation of water scarcity for communities, but also discouraging further investment in the area (Nepal Rural Water Supply and Sanitation Project, 2016).
High perceived costs correspond with perceived lower gains from serving such areas. Officials highlighted the absence of economic returns made through tariff charges for small populations, as well as the comparatively low contribution that targeting small populations would make to improved average figures of access.
Within individual communities, the same cost calculus can apply. In the Mid-Western region, the majority of households receive water piped to the outside of the house through community taps. Typically, there is a tap for ten to twelve households. However, because of the scattered nature of settlements, houses that are part of smaller settlements are left out of community provision due to high costs of reaching them. For such households, a time-consuming trek is required to reach the nearest community tap (Key informant interviews, 2016). According to the NMICS 2014, the highest proportion of household members taking 30 minutes or more to collect water was in the Mid-Western hills (30%).
Among Nepal’s three ecological regions, the low-lying Terai area in fact has the least access to piped water (14%) though urban areas fare better than rural. In the Terai, about 80% of households draw drinking water from covered wells (UNICEF and Nepal CBS 2014). Although water supply is more accessible in the region compared to the hilly and mountainous areas, one of the major concerns in these regions arising recently has been groundwater contamination from arsenic. It is plausible that this problem will further increase the perceived costs of serving Terai populations with safe water in the future. As we shall consider, however, the Terai as a whole has historically been neglected because it is seen as ‘a very difficult area to work in’, for reasons that go beyond geographic or topographic difficulties (Key informant interview 2016).
Entrenched social norms and attitudes can inhibit the inclusiveness of community based approachesWithin communities, much subtler forms of marginalisation determine access to water and sanitation, beyond the geographic inequalities which are easier to discern. Interviews confirmed that any government policies and programmes for inclusion tended to be area based (targeting the hill regions or the mountainous regions) rather than population focused (targeting provision to people with disabilities, particular ethnicities or the elderly).
11 Though piecemeal efforts were made by NEWAH.
Caste-based exclusion is a major issue. In the Terai region, Dalits and indigenous communities tend to live in isolated areas, often above water sources, where fetching water is even more taxing. Untouchability is widely practised where a water source used by person from the Dalit community is considered to be polluted. As a result, Dalits have often been barred from the use of community water taps. Initially concerned with the lack of access to water, one INGO had considered building separate community taps for the Dalit community but mobilisation by the national Dalit association (Feminist Dalit Organisation, FEDO) and local residents prevented the programme of differential access (Key informant interviews, 2016). The Terai region has only become a focus of WASH efforts since 2014 after the NMICS showed increasing improvement in water supply and access in all other regions of the country except the Terai belt. Commentators attributed the late focus on the Terai region to government’s willingness to show quick gains in WASH access to the international aid community.
The focus on improving the average – rather than targeting access efforts towards those who lacked access to water and sanitation the most– has shifted the national discourse and investments away from the Terai region, deliberately masking inequality in policy outreach as an issue of geographic and social difficulty (Key informant interviews, 2016).11 One government official explained that: ‘[projects in the Terai] can be like throwing a lot of work down the drain. They are culturally not sensitive to the same incentives people in the hill area would be so you have to think differently about how to approach them.’. There is promising evidence that the Government is willing to respond to evidence on geographic inequalities, insofar as it has started to prioritise the Terai on the basis of the NMICS results. The Government has a project with the World Bank in the Terai area and is also collaborating with WaterAid through FEDO to work with Dalit women in the area.
Income is a second consideration. While government efforts to expand WASH aim to maximise community and household contributions, there are policy provisions to cater to the needs of poorer households in the community (National Sanitation and Hygiene Master Plan 2011). Community members, through the offices of the WSUC and the VDCs, are meant to identify poorer households in the community, on criteria including: a) households with food sufficiency (security) for less than six months; b) households that rely on daily wages as the main source of income; c) female-headed households and/or households without adult members that do not have a source of income; d) households with physically disabled persons; and e) any other appropriate criteria as identified by the community. Poor households then contribute 10% of total
cost. However, because marginalised groups such as the Dalits and Madhesis are underrepresented in WSUCs in the area, there is little incentive for non-marginalised groups to pool community funds to provide toilets for poorer community members (Key informant interviews, 2016).
Gender is the final consideration mentioned widely in interviews. Nepal is a largely patriarchal society where the voices of women are only slowly beginning to be heard, particularly in rural areas. Interviewees noted that women in the Terai region are typically even more voiceless than those in other areas of Nepal. As a result, initial efforts to increase the coverage of sanitation relied on convincing the men in the region. Men typically did not consider open defecation by the riverside a problem citing the continuity of the practice across generations as well as the strangeness of using an enclosed space to relieve themselves. Often, ‘the men would say, it is unnatural to use a toilet where you cannot see the sky and there is no air’ (Key informant interviews, 2016). Current efforts aimed at improving sanitation coverage have moved towards approaching women in households as the agents of change. Campaigns targeting women highlighted the safety of using a toilet compared to open defecation particularly at night, as well as the risks posed to the health of children in the household through open defecation. The impact of the new strategy currently remains to be studied.
The Constitution mandates the state institutions to include at least 33% of women in any executive bodies and organisations at all levels (from the WSUCs to VDCs
and DDCs). However, participation of women has not been considered effective in areas such as the Terai as often women are members on paper but not involved in decision making processes. Agencies such as the World Bank and FEDO are now focussing on enabling women in the Terai area to act as agents of change but admit that genuine participation remains an challenge (Key informant interviews, 2016 and Acharya et al., 2016).
In theory the government has committed in the Constitution to providing water supply and sanitation facilities that meet the need of people with disabilities (Government of Nepal, 2015). Provision has, however, been lacking in recent programmes. Wider entrenched social taboos and biases create additional barriers for women undergoing menstruation and people living with HIV/AIDS. There is, again, a lack of direct government focus on these populations. These forms of exclusion were mentioned in passing in interviews, but do not appear to be addressed systematically, or to be a major point of concern for sector stakeholders.
The box below describes the wider efforts to address forms of marginalisation and exclusion rooted in social norms and attitudes, many of which extend beyond the WASH sector. This suggests that while there are policy and legal instruments, and a recognition of key issues, systematic enforcement of anti-exclusion measures, and persistent targeting of excluded groups, is not happening on the scale needed.
26 ODI Report
Box 3: How is social inclusion addressed in wider Government of Nepal policy?
The Constitution of Nepal (2015) recognises all citizens of the country as ‘equal irrespective of religion, race, gender, caste, tribe or ideology’ and affirms the right to water and sanitation as an inalienable human right for all [Article 35 (4)]. Social inclusion was included as a pillar of Nepal’s tenth Five Year Plan (2002-2007) in acknowledgement of the country’s long history of exclusion. The third pillar of the plan focused on targeting excluded groups, with special emphasis on excluded caste/ethnic groups, including women. The gender and social inclusion agenda gained momentum in national debates and discussions after the second ‘people’s war’ in 2006. The Comprehensive Peace Accord of 2006 recognised gender inequality, social exclusion and discrimination, and poverty as driving factors of conflict (ICIMOD 2013). The Constitution also recognises the following groups as particularly vulnerable and marginalised: ‘socially backward women, Dalit, indigenous people, indigenous nationalities, Madhesi, Tharu, minorities, persons with disabilities, marginalised communities, Muslims, backward classes, gender and sexual minorities, youths, farmers, labourers, oppressed or citizens of backward regions and
indigent Khas Arya.’ Commitment in policy at home is matched by progressive commitments to international agendas such as
the MDGs and the SDGs. Even before the SDGs were endorsed and adopted by the UN General Assembly in September 2015, the Government of Nepal was already in the process of preparing a national report which committed the government to targets for 2030 which included ‘95% of households having access to piped water supplies and improved sanitation, all communities being free of open defecation, and all urban households being connected to a sewerage system’ (NPC, 2015b). In the report, the NPC acknowledged that programmes targeting marginalised people in the country were scattered and rarely monitored for impact. Commitments thus remain
generalised without specific legislation or targets set for socially excluded groups. Although caste-based discrimination has been outlawed since the 1960s and is punishable by law, the hierarchy
is entrenched enough in the country to make punishments for violation rare. In 2014, six Dalit women were beaten for using the public well in the Siraha district and, although a complaint was registered against the offenders, there were no follow up reports or any penalty imposed on the perpetrators.

How to reduce inequalities in access to WASH: rural water and sanitation in Nepal 27
Lack of political and fiscal decentralisation gives limited scope for marginalised groups to leverage their strength in numbersSecondary literature carries scant information on the politics of getting a project on the district development plan, and the relative power of different committees in directing resources to their areas of focus. Interviewees expressed negligible knowledge about whether water and sanitation resources could be re-directed from marginalised populations to comparatively well off people. Explanations ranged from ‘the government has committed to a 100% supply of water and sanitation for everyone by 2017 so it is very unlikely any areas would be left out’ to ‘the DDC channels allocations and since it is a centrally provided there is little room for politics at that level’ (Key informant interviews, 2016).
In any case, the lack of local elections makes it unlikely that marginalised groups can exert their influence by putting pressure on the Government through electoral voice. Local elections do not, of course, automatically translate in more representative or inclusive service delivery, and political capture is possible. Interviews with NGOs suggested that while the lack of local elections are hindering the abilities of numerically strong marginalised populations to make their voices count, while also limiting the politicisation of resource allocation (projects for votes).
At the time of fieldwork (October 2016), the country was coming to the end of the budget cycle in the first year after the promulgation of the new Constitution. Local government bodies remain dependent on intergovernmental transfers for their budget, a ceiling for which is decided by a central steering committee and apportioned through vertical programmes. Although local governments can raise part of their budget locally, revenue collection remains limited to large municipalities and almost never occurs at the village level (The Hunger Project, 2015 and Key informant interviews, 2016). According to the Ministry of Finance (2015) ‘fiscal relations between central government and local bodies are complex. Even though there are allocation formulae for unconditional block grants – the major source of revenue to the local bodies – they are not being followed. The timing of grant releases, although trimester-based, is not strictly adhered to. A review of the grant system is planned’.
Communities’ and households’ decisions about what to invest in are influenced by more than just povertyThe strong emphasis on community and household responsibility for development and management of WASH services means that, for inclusive services, the right economic signals need to be in place for all members of society. Inevitably, different groups face different spending and earning decisions. Income is important, but there are other factors at play including perceptions about the financial support available, and land ownership.
Of particular relevance to the Terai belt is the open border with India. The Government of India has subsisdised the provision of toilet facilities. The Government of Nepal meanwhile practices a no-subsidy policy for household toilets. The 2004 Sanitation and Hygiene policy states that ‘no subsidy will be provided for private latrine construction but support may be provided for software… activities… revolving fund and credit facilities may be provisioned. Institutional latrines may be supported in an appropriate resource matching with communities’. Consequently, community based awareness activities that have normally triggered improved sanitation practices in the hill and mountainous regions have failed to become popular in the Terai region. The ability of the residents to view a government subsidised scheme in India ‘often 200 metres from where they live in Nepal’ has a demotivating effect on self-financed sanitation. The Dalit and Madhesi population are meanwhile underrepresented in the WSUCs in the area limiting the efforts of the committees to pool community funds to provide toilets for poorer community members (Key informant interviews, 2016).
An interviewee who had conducted door to door conversations as part of the sanitation campaign reported that community members would prioritise land and money before sanitation (Key informant interviews, 2016). Land ownership is a particular issue in the Terai region. The Dalits and Madhesis are dependent upon higher caste landlords for their livelihoods. The principal occupation of the people in the area is cultivation of land and Dalits and Madhesis typically lack land ownership and cultivate the land for landlords at wages lower than that of higher caste members (Das and Hatlebakk, 2009). This has implications for WASH. For example, an attempt by the Government to buy land to allot a tap per tenant household has met refusal from landlords to provide land for the purpose (Key informant interviews, 2016). The prevalent landlessness of the target population makes it unclear whether the Government will reach the water and sanitation goals in the Terai region, of providing a tap and a toilet for each household by 2017.
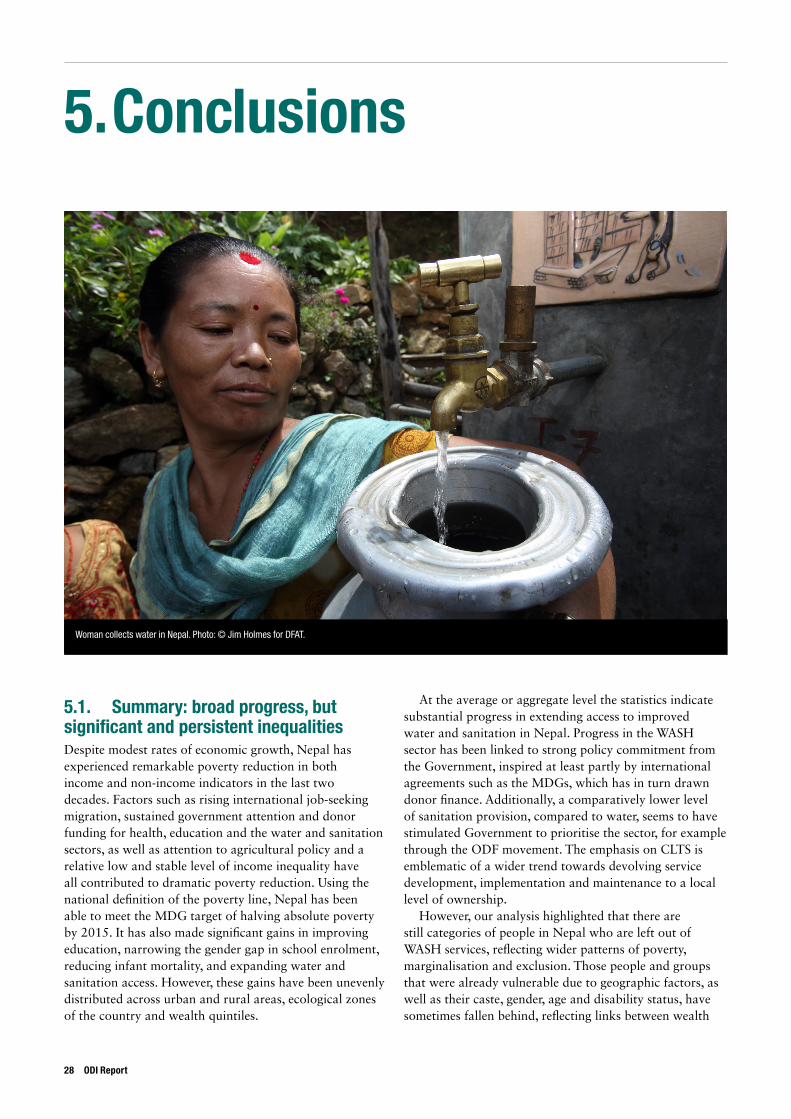
5. Conclusions
5.1. Summary: broad progress, but significant and persistent inequalitiesDespite modest rates of economic growth, Nepal has experienced remarkable poverty reduction in both income and non-income indicators in the last two decades. Factors such as rising international job-seeking migration, sustained government attention and donor funding for health, education and the water and sanitation sectors, as well as attention to agricultural policy and a relative low and stable level of income inequality have all contributed to dramatic poverty reduction. Using the national definition of the poverty line, Nepal has been able to meet the MDG target of halving absolute poverty by 2015. It has also made significant gains in improving education, narrowing the gender gap in school enrolment, reducing infant mortality, and expanding water and sanitation access. However, these gains have been unevenly distributed across urban and rural areas, ecological zones of the country and wealth quintiles.
At the average or aggregate level the statistics indicate substantial progress in extending access to improved water and sanitation in Nepal. Progress in the WASH sector has been linked to strong policy commitment from the Government, inspired at least partly by international agreements such as the MDGs, which has in turn drawn donor finance. Additionally, a comparatively lower level of sanitation provision, compared to water, seems to have stimulated Government to prioritise the sector, for example through the ODF movement. The emphasis on CLTS is emblematic of a wider trend towards devolving service development, implementation and maintenance to a local level of ownership.
However, our analysis highlighted that there are still categories of people in Nepal who are left out of WASH services, reflecting wider patterns of poverty, marginalisation and exclusion. Those people and groups that were already vulnerable due to geographic factors, as well as their caste, gender, age and disability status, have sometimes fallen behind, reflecting links between wealth
28 ODI Report
Woman collects water in Nepal. Photo: © Jim Holmes for DFAT.

How to reduce inequalities in access to WASH: rural water and sanitation in Nepal 29
poverty and WASH poverty. This study has identified key bottlenecks hindering more equitable access to WASH facilities:
• Quality and availability of data on poverty and WASH access impede full recognition of the issues and effective targeting in response
• Geography and topography shape the perceived costs and benefits for government and households to invest in water and sanitation.
• Entrenched norms and attitudes underpin marginalisation and exclusion in communities and present a particular challenge for approaches that rely on community-led action.
• Stalled processes of political and fiscal decentralisation give little opportunity for marginalised groups to exercise their voice, or for local government to respond effectively to local needs.
• Economic, political and social factors differentially influence communities’ and households’ decisions about what to invest in.
The persistence of these ‘bottlenecks’ is explained below using a set of common political and governance factors that can explain dysfunctional relationships, rooted in an understanding of motivations and power (Harris and Wild 2013).
Oversight: Oversight systems are weak – the absence of local elections has meant that the sector continues to be administered centrally with little accountability demanded of the local appointed WSUCs to the residents and users they serve. There is no systematic data on the composition of the WSUCs, particularly in the more marginalised areas of the country. Data is also lacking on the proportion and characteristics of marginalised populations in rural areas, thus weakening the ability of non-governmental observers to track the degree to which local populations are represented in the local committees. The highest office at the local level is held by a centrally appointed civil servant. In theory, they are responsible for responding to community demands. In practice, their multiple functions at the district level result in low prioritisation of the water and sanitation needs of the community, particularly its poorest and most marginalised members. The absence of local elections prevents numerically large marginalised groups from playing a significant role in terms of electoral accountability and oversight.
Coherence: For both rural and urban water and sanitation, there is a low degree of coherence in policies and processes for implementation. Since the 1990s, there have been a range of policies for the WASH sector. Despite the plethora of policy instructions, in practice, the Rural Water Supply and Sanitation Policy of 2004 and the National Sanitation and Hygiene Master Plan of 2011 remained the most relevant at the time of research. The new Sector Development Plan potentially offers a unifying
framework for greater coherence in the long term, which is urgently needed. However, it must be mainstreamed in the context of the recent restructure from 5 development regions into 7 provinces, which leaves Nepal in a transition state where roles for ministries and departments are in a broader flux. There is no specific pro-poor policy to improve access for marginalised groups and progress for the poor overall appears to be incidental rather than a result of direct targeting.
Autonomy: While local WSUCs are in charge of coordinating the implementation of local water supplies and sanitation facilities, in practice there is strong control from the centre on how services are delivered. Local governments remain dependent on a core block grant from the central government. The WASH landscape in Nepal is a crowded space with numerous governmental and national and international non-governmental actors. Although the government of Nepal has made some significant efforts to coordinate actors through regional and national committees, these do not meet regularly and are often unaware of parallel initiatives in the WASH sector. Therefore, at one level technical experts are able to carry out projects with minimum political interference. However, this has allowed a wide range of stakeholders to act independently without knowledge of pre-existing and/or extant efforts in the area. This, in turn, is undermining overall sector performance.
Rents: We found little evidence of distortions in the allocation of public services as a consequence of rent-seeking behaviours. Explanations for this ranged from the lack of informal provision of water, particularly in rural areas; the absence of local elections that would motivate the use of WASH facilities as a political resource for votes; and the remarkable pressure from the government to achieve the goal of universal water and sanitation access by 2017 in order to maintain its international commitments. At the same time, the systematic exclusion of certain groups from service provision suggests that there may be widespread and entrenched use of public resources to serve some groups but not others – a pattern that could be described as a form of rent-seeking.
Credibility: The Government of Nepal has arguably made, and delivered on, a commitment to accelerate WASH provision in aggregate, particularly focusing on sanitation. From our brief review it was not possible to discern to what extent this was motivated by a need to be seen to deliver to the people of Nepal, as opposed to international donors in order to attract further resources – in reality it is likely a combination of the two. However, the extent to which citizens draw a clear line between the services they receive, and the delivery of policy commitments by Government, could plausibly also be influenced by who is actually seen to provide those services. This is exacerbated by the absence of a local elected body that can be held accountable. As things currently stand, civil society organisations play a strong role in service provision
– especially for poor users. Local civil society organisations tend to work with international donor agencies rather than being standalone actors. As such they channel the needs of local communities through more prestigious and financially powerful INGOs that can then advocate for a pro-poor focus in subsequent projects. This provides for some level of deliberate targeting to address WASH inequality, and space for policy dialogue to encourage the Government to prioritise this more explicitly. It remains to be seen whether over the longer term this will result in a parallel system, whereby marginalised communities expect their WASH services to be provided by civil society rather than the government.
Moral hazard: Until the advent of local elections, the formal structure of the state remains centralised. This weakens the accountability link between the national government and its citizens. Budget allocation decisions continue to be made at the central level by a steering committee that lacks local representation. As such, the feedback loop of democratic accountability between leaders and citizens is effectively broken – a form of moral hazard in that they are not exposed to the full risks of poor performance. Put simply, leaders are unlikely to lose their position for failing to serve marginalised people.
5.2. Entry points for change In the light of this analysis we identified the following entry points for organisations such as WaterAid and its partners to work towards more inclusive WASH services in Nepal:
Consider water and sanitation service provision in the context of active legal instruments intended to overturn socially exclusive norms. The provision of water and sanitation is not limited to enabling access to infrastructure, even if this seems to be the main focus of government investment in Nepal, particularly in the water sector. The exclusion from communal water faced by the Dalit population across Nepal and particularly in the Terai region highlights the need for changing social norms through implementation of anti-discrimination laws that already exist. Although there are close links between the international donor community and the Government of Nepal, this change would be best pushed forward by national and local civil society organisations to avoid a situation where external pressure exists at the expense of internal advocacy. Such efforts would also include tracking the involvement of marginalised groups in processes of decision making on WASH issues at the local level, not just in terms of numbers present on committees and meetings but also in voicing concerns and contributing to decisions.
Improve data on populations and areas that have been left behind. A systematic effort to map areas and
populations that remain under-served by the WASH sector would allow: a) the gathering of updated data to make cost-effective decisions about expansion of water and sanitation supply; and b) the monitoring of the degree to which access to water and sanitation services is provided to marginalised populations and areas. Data on local level populations with disabilities and other special needs would also allow monitoring their proportional representation in decision-making committees at the local level. At the national level, the Central Bureau of Statistics should play a leading role in data collection. At the local level, government and non-government organisations could develop capacities for granular citizen generated data.
Engage with local project planning and prioritisation processes to understand and exploit the space they offer for more inclusive and accountable services. Although political decentralisation has stalled, and centrally appointed officials, rather than locally elected leaders, hold sway over resource prioritisation and planning processes, this space is likely to be crucial to ensure that transfers from central government are more effectively used to target excluded groups. WaterAid and other organisations in the WASH sector could partner with civil society organisations and proactive local officials who understand both the politics of local resource prioritisation, and the importance of social inclusion, in order to identify and experiment with mechanisms and processes in a small number of test locations, before communicating findings to the Government and scaling up across a wider area.
Support the government to develop appropriate approaches for groups that prove harder to reach. WaterAid, as an international NGO with strong engagement also in India, may be well placed to work with the Government of Nepal to tailor standard CLTS approaches to the Terai region – addressing the issues of expectations and the lack of land ownership for Dalits and Madhesis. In this case, improving access to WASH services would also involve obtaining the cooperation of landlords on whose land the Dalit and Madhesis population of the Terai area both live and work.
Work with other interest groups and sectors to promote implementation of the decentralisation agenda. Conducting local elections in Nepal would also incentivise local officials to cater to the needs of local people who vote them into power and who will also be liable to pay taxes to fund the local budget. Once elections are underway, civil society members at the local level will have to work to ensure that people living in remote areas and/or marginalised communities that are numerically weak are able to hold the local government accountable for service delivery.
30 ODI Report

How to reduce inequalities in access to WASH: rural water and sanitation in Nepal 31
References Acharya, G., Upreti, B.R., Paudel, S.B., Tandukar, A. and Harris, D. (2016) The Drinking Water and Sanitation
Programme of Nepal’s Local Governance and Community Development Programme. London: Secure Livelihoods Research Consortium.
Allan, S. (2003) The WaterAid Bangladesh/VERC 100% Sanitation Approach; Cost, motivation and subsidy. London: London School of Hygiene and Tropical Medicine.
Asian Development Bank (ADB) (2013) Country Poverty Analysis (Detailed): Nepal. Manila: Asian Development Bank.Boex, J. (2012) ‘Review of the Criteria and Grant Allocation Formulas for Block Grants to DDCs and VDCs in
Nepal.’ Population, 40 (60).CLTS Knowledge Hub (2016) ‘Nepal.’ Website, accessed 04/05/17. Available at: http://www.communityledtotalsanitation.
org/country/nepal Das, A. K., & Hatlebakk, M. (2009) Statistical evidence on social and economic exclusion in Nepal. Bergen: Chr.
Michelsen Institute.Ghimire, B. (2016) ‘Govt accedes to LLRC call, set to revise ToR’. The Kathmandu Post. 4 October 2016.Gellner, D. N. (2007) ‘Caste, ethnicity and inequality in Nepal.’ Economic and Political Weekly, 1823-1828. Government of Nepal (2015) Constitution of Nepal. Kathmandu: Government of Nepal.Hänninen, E. (2014) Legitimating Aid: Donors and Policy Making in the Rural Water Supply and Sanitation Sector in
Nepal. Helsinki: University of Helsinki.Harris, D. (2013) Applied political economy analysis: a problem-driven framework. London: Overseas Development
Institute.Harris, D. and Wild, L. (2013) Finding solutions: making sense of the politics of service delivery. London: Overseas
Development Institute.Howard, G., & Bartram, J. (2003) Domestic water quantity, service level, and health. Geneva: World Health
Organization.International Centre for Integrated Mountain Development (ICIMOD) (2013) Transforming Women’s Economic Power
and Movements in Rural Development: Where Are We Now? Proceedings: AWID International Forum on Women’s Rights and Development: Istanbul.
International Monetary Fund (IMF) (2015) ‘Nepal: 2015 Article IV Consultation’. Press Release. Washington DC: International Monetary Fund.
Kar, K., & Milward, K. (2011). ‘Digging in, Spreading out and Growing up: Introducing CLTS in Africa’. IDS Practice Papers, 2011 (8), 01-64.
Mason, N., Harris, D., and Batley, R. (2013) The technical is political: understanding the political implications of sector characteristics for the delivery of drinking water services. London: Overseas Development Institute.
Mason, N., Harris, D., and Batley, R. (2014) The technical is political: understanding the political implications of sector characteristics for the delivery of sanitation services. London: Overseas Development Institute .
Nepal Central Bureau of Statistics (CBS) (2011) Nepal Living Standards Survey 2010-2011, NLSS Third. Kathmandu: Government of Nepal.
Nepal Ministry of Federal Affairs and Local Development (MoFALD) (1991) Local Self Governance Act (1991). Kathmandu: Government of Nepal .
Nepal Ministry of Federal Affairs and Local Development (MoFALD) (2010a) District Development Committee Operational Guidelines. Kathmandu: Government of Nepal .
Nepal Ministry of Federal Affairs and Local Development (MoFALD) (2010b) Village Development Committee Operational Guidelines. Kathmandu: Government of Nepal.
Nepal Ministry of Finance (MoF) (2015) Public Expenditure and Financial Accountability (PEFA) Assessment Nepal PFM Performance Assessment II. Kathmandu: Government of Nepal .
Nepal Ministry of Finance (MoF) (2012) Foreign Aid in Nepal FY2011-2012. Kathmandu: Government of Nepal. Nepal Ministry of Health and Population (MoHP) (2015) Success Factors for Women’s and Children’s Health.
Kathmandu: Government of Nepal.Nepal Ministry of Physical Planning and Works (MoPPW) (2004) Rural Water Supply and Sanitation National Policy &
Rural Water Supply and Sanitation National Strategy 2004. Kathmandu: Government of Nepal.Nepal Ministry of Urban Development (MoUD) (2015) National Urban Development Strategy 2015. Kathmandu:
Government of Nepal.Nepal Ministry of Urban Development (MoUD) (2013) Gender Equality and Social Inclusion Operational Guidelines.
Kathmandu: Government of Nepal.
Nepal National Planning Commission (NPC) (1992) 8th Five Year Plan (1992-1997). Kathmandu: Government of Nepal.Nepal National Planning Commission (NPC) (1997) 9th Five Year Plan (1997-2002). Kathmandu: Government of Nepal.Nepal National Planning Commission (NPC) (2002) 10th Five Year Plan (2002-2007). Kathmandu: Government of
Nepal.Nepal National Planning Commission (NPC) (2015a) Post Disaster Needs Assessment: Key Findings. Kathmandu:
Government of Nepal.Nepal National Planning Commission (NPC) (2015b) Sustainable Development Goals 2016-2030 National (Preliminary)
Report. Kathmandu: Government of Nepal.Nepal National Sanitation and Hygiene Coordination Committee (2016) Nepal Country Paper On Sixth South Asian
Conference on Sanitation (SACOSAN-VI). 11-13 January, 2016. Dhaka, Bangladesh. Kathmandu: Government of Nepal.
Nepal Rural Water Supply and Sanitation Project (2016) Annual Progress Report FY03 FY 2072/073 – CY 2015/16. Western Nepal Phase II. Kathmandu: Government of Nepal .
Oxford Poverty and Human Development Initiative (OPHI) (2010). Nepal Country Briefing Multidimensional Poverty Index Data Bank. University of Oxford: Oxford.
Oxford Poverty and Human Development Initiative (OPHI) (2016). Nepal Country Briefing, Multidimensional Poverty Index Data Bank. University of Oxford: Oxford.
Pach, A and Bhattachan, A (2014) ‘Understanding Cholera in Nepal.’ Blog post on Stop Cholera. Published on 9 September 2014. https://www.stopcholera.org/blog/understanding-cholera-nepal
Sector Efficiency Improvement Unit (SEIU) (2016) Nepal Water Supply, Sanitation and Hygiene Sector Development Plan (2016 – 2030). Government of Nepal: Kathmandu.
Slaymaker, T., M. Adank, E. Boelee, F. Hagos, A. Nicol, T. Tafesse, D. Tolossa, and J. Tucker, (2007). ‘Water, livelihoods and growth’. RiPPLE Concept Paper. RiPPLE Theme 3. Addis Ababa: Research- Inspired Policy and Practice Learning in Ethiopia and the Nile Region.
Steering Committee for National Sanitation Action (2011) Sanitation and Hygiene Masterplan. Government of Nepal: Kathmandu.
Stewart, F. (2002) ‘Horizontal Inequalities: A Neglected Dimension of Development’. QEH Working Paper Number 81. University of Oxford: Oxford.
Stewart, F., Langer, A., and Venugopal, R. (2011) Horizontal Inequalities and Post-Conflict Development. Basingstoke: Palgrave Macmillan.
Suvedi, B. K., Pradhan, A., Barnett, S., Puri, M., Chitrakar, S. R., Poudel, P., Sharma, S. & Hulton, L. (2009) Nepal maternal mortality and morbidity study 2008/2009: summary of preliminary findings. Kathmandu: Government of Nepal.
The Hunger Project (2015) ‘Participatory Local Democracy: Nepal.’ Website, accessed 04/05/17. Available at: https://localdemocracy.net/countries/asia-pacific/nepal/
UN Habitat, Government of Nepal and WSSCC (2016) Global Sanitation Fund Annual Report 2015. Geneva: Global Sanitation Fund.
UNDP (2010) Country Sector Assessments: UNDP GoAL WaSH Programme. Volume 2 Nepal. New York: United Nations Development Programme.
UNESCO (2016) ‘Education: Expenditure on education as % of GDP (from government sources).’ Website, accessed 04/05/17. Available at: http://data.uis.unesco.org/?queryid=181
UNICEF (2014) Lessons from Nepal’s sanitation social movement “Sanitation for All: All for Sanitation”. Kathmandu: UNICEF.
UNICEF and Central Bureau of Statistics (CBS) (2014) Nepal Multiple Indicator Cluster Survey 2014. Kathmandu: Government of Nepal.
Urban Gateway (2013) ‘South Asian Conference on Sanitation (SACOSAN) to give Fresh Impetus to Sanitation Program in Nepal.’ Website, accessed 04/05/17. Available at : http://www.urbangateway.org/content/news/south-asian-conference-sanitation-sacosan-give-fresh-impetus-sanitation-program-nepal
WaterAid (2016) Nepal WASH Sector Review Process: Analysis and recommendations for moving forward. Nepal Joint Sector Review: Summary report. July 2016. WaterAid: London.
WaterAid Nepal (n.d.) Nepal: Effective financing of local governments to provide water and sanitation services. Kathmandu: WaterAid Nepal.
WaterAid Nepal (2006) Community Led Total Sanitation in Nepal, getting us back on track. Kathmandu: WaterAid Nepal.
WaterAid Nepal (2004) The Water and Sanitation Millennium Development Targets in Nepal: What do they mean? What will they cost? Can Nepal meet them? Kathmandu: WaterAid Nepal.
32 ODI Report

How to reduce inequalities in access to WASH: rural water and sanitation in Nepal 33
WaterAid Nepal (n.d.) Nepal: Effective financing of local governments to provide water and sanitation services. Kathmandu: WaterAid Nepal.
WHO and UNICEF (2015). Progress on Sanitation and Drinking-water, 2015 Update. World Health Organization and UNICEF: Geneva.
Wolfson, E. (2016) ‘One Year After a Devastating Earthquake, Nepal is Still in Ruins’. Newsweek Europe. Published on 21 April 2016. Available at: http://www.newsweek.com/2016/04/29/nepal-earthquake-anniversary-2015-gorkha-kathmandu-450449.html.
World Bank (2004) World Development Report 2004: Making services work for poor people. Washington, DC: World Bank.
World Bank (2007) Attaining the Health and Education Millennium Development Goals in Nepal. South Asia: Human Development Sector. Report No. 12. Washington, DC: World Bank
World Bank (2016) ‘World Bank Open Data.’ Website, accessed 04/05/17. Available at: http://data.worldbank.org/

Appendix 1: Key Policies on Water and Sanitation
Document Key powers and innovations
Directives on Operation of Water Supply Services (2012)
Provides DWSS with the authority to inspect, monitor, assess, supervise and regulate the work and activities of service providers regularly. Requires periodic election of service providers; mandatory auditing of the accounts of service providers; a bar on modifying drinking water supply system structures without prior approval of DWSS; and submission of annual reports by service providers describing all activities, with updated particulars, to the WSSDO/DWSS.
National Hygiene and Sanitation Master Plan (2011)
Recognises the leadership of local bodies; sets out coordination mechanism at central, regional, district and municipality/village levels; highlights ODF status as a key entry point for total sanitation; proposes cost sharing to stimulate ODF initiatives.
National Urban Water Supply and Sanitation Sector Policy (2009)
Recognises WASH services as tools for poverty reduction. Emphasises innovations including output-based aid to support promotion of household toilets; cost recovery principles; and decentralised waste management.
Water Supply Tariff Fixation Commission Act (2006)
Establishes the Water Supply Tariff Fixation Commission as a regulator. Provides for appointments to the Commission that fixes the tariffs to be charged by service providers; authorises the Commission to monitor service providers to ensure compliance with standards.
Water Management Board Act (2006)
Emphasises participation of local bodies and WASH institutions in water and sanitation services in urban areas. Provides for the establishment of an autonomous and independent Water Supply Management Board to own water supply system assets. The Act also provides for licensing operators for the management, operation and maintenance of the systems and leasing of the assets. Sanitation received little attention in the Act.
National Drinking Water Quality Standards (2005)
Set standards for water quality. Service providers are given responsibility for monitoring; local level offices of the Ministry of Health & Population (MoHP) responsible for surveillance. Guidelines specify methods and frequency of sampling and testing.
National Water Plan (2005) Plots short term, medium term and long term action plans for the Water Resources Sector. More focused on environmental concerns (sustainability) and introduces the concept of Integrated Water Resources Management (IWRM).
National Policy and Strategy on Rural Drinking Water Supply and Sanitation (2004)
A wide ranging set of policy statements. Defines water supply service levels; provides basis for inclusion of women and disadvantaged groups in decision making; defines roles and responsibilities of different Government ministries and agencies as well as WSUCs, schools and students and other sector actors. The Policy set a national goal of basic water and Sanitation facilities for all by 2017. It embraces the Nepal Water Supply, Sanitation and Hygiene Sector Development Plan (2016-2030) that "demands a responsive approach” to the provision of rural water supply and sanitation, and uses cost sharing principle (whereby Government would allocate 80% and the users 20% in the implementation of new WASH projects).
Water Resources Act (1992)
This is the umbrella Act governing water resource management, declaring the order of priority of water use, and vesting ownership of water in the State. It provides for the formation of water user associations, establishes a system of licensing, prohibits water pollution, and allows completed projects to be transferred into ownership of users’ associations.
Source: Nepal Water Supply, Sanitation and Hygiene Sector Development Plan (2016 – 2030)
34 ODI Report

How to reduce inequalities in access to WASH: rural water and sanitation in Nepal 35
Appendix 2: List of interviews
Organisation Date and place of interview
Embassy of Finland Kamana Gurung, Coordinator Kathmandu, October 2016
Department of Local Infrastructure Development & Agricultural Roads (DOLIDAR)
Ram Krishna Sapkota, Director General Kathmandu, October 2016
Ministry of Federal Affairs and Local Development
Ram Chandra Tiwari, Under Secretary (Former Local Development Officer, Planning Officer and Executive Officer) of Local development
Kathmandu, October 2016
Central Bureau of Statistics (CBS) Suresh Basnet, Undersecretary Kathmandu, October 2016
National Planning Commission Lila KC, Program Director Kathmandu, October 2016
WaterAid Nepal Shikha Shrestha, Advocacy and Research Manager
Kathmandu, October 2016
WHO Sudan Raj Panthi, National Professional Officer Kathmandu, October 2016
UN Habitat Sudha Shrestha, Acting CTA/GSF Programme Manager
Kathmandu, October 2016
Ministry of Science and Technology Ram Chandra Tiwari, Under-Secretary Kathmandu, October 2016
Feminist Dalit Organisation Upashana Pradhan, Program Officer Kathmandu, October 2016
Nepal Water for Health (NEWAH) Himalaya Panthi, Social Development Manager Kathmandu, October 2016
Department of Water Supply & Sewerage (DWSS)
Binod Kumar Agrawal, Superintending Engineer
Kathmandu, October 2016
Ram Chandra Devkota, Director General Kathmandu, October 2016
Prem Nidhi KC, Community Mobilisation Section
Kathmandu, October 2016
World Bank Silva Shrestha, Water Supply and Sanitation Specialist
Kathmandu, October 2016
Ministry of Water Supply and Sanitation Tejraj Bhatta, Joint Secretary Kathmandu, October 2016
Sector Efiiciency Improvement Unit (SEIU) Prayash Ghimire, Engineer Kathmandu, October 2016
Rural Village Water Resource Management Project
Prem Dutt Bhatta, Project Coordinator & Senior Divisional Engineer of DOLIDAR
Kathmandu, October 2016
WHO Sudan Raj Panthi, National Professional Officer Kathmandu, October 2016
Rural Water Supply Fund Development Board Sanjaya Mishra, Deputy Executive Director Kathmandu, October 2016
Prabesh Niraula, Head, Monitoring and Evaluation Division
Kathmandu, October 2016
Ram Prasad Dhakal, Livelihood Expert Kathmandu, October 2016
Deepa Shakya, Gender, Equity and Social Inclusion Expert
Kathmandu, October 2016
Independent local consultant Ganga D Nepal Kathmandu October 2016

ODI is the UK’s leading independent think tank on international development and humanitarian issues.
Readers are encouraged to reproduce material from ODI Reports for their own publications, as long as they are not being sold commercially. As copyright holder, ODI requests due acknowledgement and a copy of the publication. For online use, we ask readers to link to the original resource on the ODI website. The views presented in this paper are those of the author(s) and do not necessarily represent the views of ODI.© Overseas Development Institute 2017. This work is licensed under a Creative Commons Attribution-NonCommercial Licence (CC BY-NC 4.0).ISSN: 2052-7209
All ODI Reports are available from www.odi.org
Cover photo: Woman in Nepal washing water collection pot before collecting water from a village gravity flow tap. © Jim Holmes for DFAT.
Overseas Development Institute203 Blackfriars Road London SE1 8NJTel +44 (0)20 7922 0300 Fax +44 (0)20 7922 0399
odi.org