how upstream lighting programs are affecting markets … wobus.pdf · how upstream lighting...
TRANSCRIPT
How Upstream Lighting Programs Are Affecting Markets
for Standard CFLs in the U.S.:
Lessons from Michigan
Nicole Wobus, Navigant, Boulder, CO
Tom Mauldin, NMR Group, Somerville, MA
Jill Steiner, Cadmus Group, Lansing, MI
Craig McDonald, Navigant, Boulder, CO
Julianne Meurice, Navigant, Chicago, IL
Alison Jaworowski, DTE Energy, Detroit, MI1
Abstract
Utilities in Michigan assume 90 percent of savings tracked through efficiency programs are
attributable to program activities, and the remaining 10 percent would happen in the absence of the
programs. However, accounting for maturing compact fluorescent lamp (CFL) markets, evaluation
studies in other U.S. jurisdictions have estimated that CFL programs are only responsible for 50 to
60 percent of residential CFL-related energy savings. Because CFL programs comprise a large
portion of the Michigan utilities’ portfolios of program savings, the Michigan Public Service
Commission called for an examination of net savings assumptions for CFL programs. The state’s
investor-owned utilities responded with a collaborative, intensive research effort that considered both
free ridership (sales of incented CFLs that would occur without program support) and
spillover/market effects (sales not tracked through programs but influenced by them). Given the
limitations of any single method to estimate program-attributable savings, and the complex dynamics
unfolding in residential lighting markets, the utilities’ evaluation teams conducted primary research
using a variety of techniques and then employed a Delphi panel to review the research, leverage their
expert perspectives, and reach a consensus.
Drawing on their own market expertise and the evaluation teams’ research findings, panelists
estimated the ratio of program-attributable savings to total gross savings (“net-to-gross ratio”
[NTGR]), both retrospectively and prospectively. The evaluation teams found a NTGR of 0.89 for
the 2009-2013 period, nearly the same value as the deemed estimate used prior to undertaking this
research effort (0.90). For the 2014-2015 period, the advisory panel process resulted in an NTGR
estimate of 0.82. The multi-faceted research approach addressed some limitations of commonly used
NTG research methods, enabling panelists to provide responses that reflect the complex nature of the
evolving CFL market conditions nationally, and in Michigan specifically.
Introduction
Michigan currently assumes 90 percent of savings tracked through efficiency programs are
attributable to program activities, and the remaining 10 percent would have happened in the absence
of the programs. However, evaluation studies in other states have concluded that due to maturing
compact fluorescent lamp (CFL) markets, only 50 to 60 percent of savings are attributable to the
utility programs. Given that CFLs account for a large portion of savings from the utilities’ portfolio
of efficiency incentive programs, the Michigan utility regulatory body, the Michigan Public Service
Commission (MPSC), mandated that the state’s utilities conduct a closer examination of the level of
influence efficiency incentive programs have on the residential lighting market in the state and that
this research-based value be used going forward. Intensive research conducted by evaluation teams
working for the state’s two large electric utilities, Consumers Energy and DTE Energy (“the
1 Ms. Jaworowski was an employee of DTE Energy at the time of the Michigan CFL net-to-gross research effort.
2014 International Energy Policy & Programme Evaluation Conference, Berlin

Companies”), found that the state’s current assumption was on target; taking into account market
effects, the research found that approximately 90 percent of savings tracked by the program to date
could be attributed to the program’s activities.
This paper first presents a brief background discussion of topics that provide the reader with
the context for understanding the content of the paper. This discussion includes a summary of the
framework used in the U.S. to estimate the portion of efficiency program savings that are actually
attributable to the program versus other market factors. The U.S. framework is contrasted with that
used in Europe. The paper then provides background on key federal policies affecting lighting
markets in the U.S., as well as an overview of the Michigan lighting programs that are the focus of
this paper. The remaining sections of the paper summarize the methods used and outcomes of the
intensive effort to measure utility program influence on the residential lighting market in Michigan.
The paper focuses on Michigan evaluators’ use of a Delphi panel, or “advisory panel,”2 to
address the challenge of providing a balanced estimate of net program effects on a market. Using this
method, the team gathered structured, iterative feedback from lighting market experts capable of
taking a long-term, holistic view of the market. Applying this approach, the evaluation team was able
to overcome key limitations of traditional, more narrowly focused evaluation methods. Those
methods often discount reported program savings to reflect free ridership, but do not capture savings
that may accrue over and above those counted by the program.
Background
This section provides the reader with important contextual information to consider when
reviewing the remainder of the paper.
Estimation of Program Influence in the U.S. and Europe
In the U.S., to ensure that energy efficiency program sponsors are only given credit for
energy savings actually induced by their programs, evaluators are tasked with accounting for the fact
that 1) some portion of energy-efficient product sales tracked by the program would occur even in
the absence of an efficiency program, and 2) that programs have impacts that extend beyond the
sales and savings tracked by the sponsor. Evaluators adjust program reported savings to account for
these factors, and the result is an estimate of “net” program savings. The ratio of net savings to the
total savings initially counted by the program (“gross savings”) is referred to as the “net-to-gross
ratio” (NTGR).
Some variation exists in the components different U.S. jurisdictions consider when making
adjustments to arrive at net program savings, and, to some extent, how those components are
defined. The components considered in the Michigan CFL market analysis, and the definitions
applied, include the following:
Free Ridership is savings from an energy efficiency measure that the participant would
have installed without any program incentives, but that they received a financial
incentive or rebate for anyway.
Spillover is savings from an energy-efficient measure which someone was influenced by
a program to adopt and that qualifies for financial incentives or rebates, but for which
no incentive was received.3
2 The research team used the term “advisory panel” in communications with panelists in order to clarify the role of the
panelists, and to use terminology that would be more familiar to a nonacademic audience. 3 Individuals or companies whose purchase of efficient products is driven by program activity but not counted toward
program savings are sometimes referred to as “free drivers.”
2014 International Energy Policy & Programme Evaluation Conference, Berlin
Market effects are savings resulting from a change in market structure or market actor
behavior due to program influence that results in the (un-incented) adoption of energy
efficiency measures.4
These factors are applied to arrive at an NTGR using the following equation:
NTGR = 1 – Free Ridership + Spillover + Market Effects
All factors within the equation are difficult to estimate with precision, but the market effects
component is particularly challenging to estimate. While many experts agree that market effects are
often greater than zero, some jurisdictions elect not to include this component in their NTGR
equation because of the inherent difficulty and uncertainty in estimating a value (NMR Group et al.
2011). One notable feature of the CFL market study in Michigan, a feature that contributed to the
relatively high NTGR estimate, was the inclusion of market effects.
European nations deal with the issue of net savings primarily under the construct of
“additionality” (i.e., whether savings are incremental, or additional, to what would have occurred
under business-as-usual conditions). European nations have addressed this topic for a number of
years both as it relates to counting greenhouse gas emissions as part of the Clean Development
Mechanism (United Nations Framework Convention on Climate Change [UNFCCC] 2011),5 and in
measuring energy savings associated with various Energy Efficiency Obligations and White
Certificates schemes (De Lovinfosse et al. 2012; Bean et al. 2014). As in the U.S., little
standardization exists in the specific methods used for estimating additionality (Bean et al. 2014; De
Lovinfosse et al. 2012). However, in both locations, net savings estimates are based on research into
the baseline market conditions and the dynamics at play in the market (De Lovinfosse et al. 2012;
Staniaszek & Lees 2012).6
Federal Efficiency Standards Affecting the U.S. Lighting Market
Efficiency standards enacted as part of the federal Energy Independence and Security Act
(EISA) of 2007 require the most common light bulbs historically in use in the U.S. (incandescent
bulbs) to use 25-30 percent less energy. Standards for the traditional 100-watt bulb became effective
in 2012. Standards for the traditional 75-watt bulb became effective in 2013, and for the 60- and 40-
watt bulbs in 2014.7 The standards are based on lamp efficacy (lumens/watt), meaning they are
technology-neutral. The standards can be met by some advanced incandescents (halogens), CFLs,
and light-emitting diodes (LEDs) (Appliance Standards Awareness Project 2014). This is significant
because it means the baseline technology is gradually changing from incandescent lamps to
halogens.
4 Overlap can exist between market effects and some forms of spillover. Generally, market effects are considered
adoption of such measures that result from structural changes in the market (i.e., increased availability, change in
baseline price) rather than unsystematic examples of measure adoption. 5 The Clean Development Mechanism provides a methodological tool for assessing additionality. It involves identifying
alternatives to the measure, demonstrating the measure is at a financial disadvantage, demonstrating the presence of
barriers to implementation, and determining the extent to which the measure is already standard practice in a market. 6 Incentives are no longer offered for CFLs in many European nations because the measure is no longer deemed
additional. A European Union directive began limiting the sale of incandescent lamps in European nations starting in
2009, significantly earlier than the 2012 start of efficiency standards on incandescent lamps in the U.S. In Italy’s white
certificate market, CFLs were considered fully additional through 2008. Starting in 2008, additionality coefficients less
than one were used, and in 2011 CFLs were no longer included as an eligible measure (De Lovinfosse et al. 2012). 7 In January 2014, a rider to an omnibus funding bill barred funding to enforce the standard, but some market experts
report that manufacturers were already acting in compliance with the standard and planned to continue to do so.
However, with limited enforcement, there is a risk of illegal imports of EISA noncompliant incandescents (Nadel 2014).
2014 International Energy Policy & Programme Evaluation Conference, Berlin
Overview of Michigan Upstream Lighting Programs
DTE Energy and Consumers Energy (the Companies) each launched residential-focused
lighting programs in 2009. The programs offer financial incentives to manufacturers working in
partnership with retailers. Customers, in turn, receive discounted prices, along with education about
CFL benefits. Retailers allow in-store, utility-branded signage and promotion, and permit the
utilities’ program implementation contractor to monitor stocking habits and signage as well as
deliver in-store events. This “upstream” incentive format is a more cost-efficient model than
providing coupons or rebates to customers because it eliminates the administrative costs of issuing
incentives directly to customers. Additional details, including the numbers of CFLs incented through
the program, are discussed in the “Program and Market Data” section of this paper.
Approach
The regulatory mandate that called for the Companies to estimate a new NTGR for standard
CFLs requested updated values for use in evaluation of the 2014 and 2015 program years.8 Given the
common objectives, the Companies worked together to respond to the mandate. Early in the process,
the Companies engaged the Michigan Energy Optimization (EO) Collaborative group (the
collaborative), a working group of diverse stakeholders facilitated by the MPSC, to review the
proposed approach, provide input to help guide the research activities, and to establish agreed-upon
definitions of the key elements of NTGR.9
Stakeholders agreed that no single research method would fully inform the estimate of an
NTGR. Each Company developed a research plan that included analysis of program and market data,
along with specific studies to measure various elements of an NTGR.
The specific NTG studies carried out by each evaluator focused on historic program activity
(2009-2013) and produced a range of NTGR estimates for each Company. In order to develop a
single NTGR estimate for application in 2014 and 2015, the evaluation teams, with guidance from
the collaborative, convened an advisory panel of industry experts to review the NTG research and
provide their opinion on the appropriate NTGR for use by the Companies.
The advisory panel process was the culminating event of the NTGR development process.
The panelists interpreted the various research efforts and provided their estimates of NTGR for both
the 2009-2013 and 2014-2015 periods. Figure 1 lists the various research activities conducted for
each Company and presented to the advisory panel for their review.
8 The MPSC order mandating action by DTE Energy (Case No. U-17049) was issued on December 20, 2012. The order
mandating action by Consumers Energy (Case No. U-17138) was issued on January 31, 2013. “Standard” CFLs are bare,
spiral-shaped, medium screw-base CFLs with no special features, and they replace common wattage bulbs (not high
wattage). 9 The MPSC staff facilitates an Energy Optimization Collaborative group in which a wide range of stakeholders
participate. The stakeholders include utilities, energy efficiency service providers, environmental advocates, and other
interested parties. The collaborative group provides a forum to discuss a wide range of program design and evaluation
topics in support of the successful implementation of energy efficiency programs. The group works to reach consensus
on issues such as establishment of deemed savings values and approaches to tracking and claiming savings.
2014 International Energy Policy & Programme Evaluation Conference, Berlin

Source: Consumers Energy and DTE Energy evaluation teams
Figure 1. Overview of the NTGR Research Approach
The evaluation teams invited 32 industry experts to participate in the panel; 18 participated in
Stage 1, and all 18 completed the panel process. The advisory panel reflected a broad range of
perspectives and expertise, representing the following types of organizations:
Program administrators and market support organizations, including (non-Michigan)
utility program staff, regional market transformation organizations, and third-party
implementers (six participants)
Evaluators and consultants (four participants)
Government, regulators, and energy/environmental advocates (four participants)
Retailers and manufacturers (four participants)
The advisory panel process included two stages. In the first stage, the evaluation teams
presented participants with the research and market information they had prepared and asked the
panelists to provide their best NTGR estimates. In the second stage, each panelist was provided with
their initial responses for reference, as well as a summary of the full set of responses, organized by
panelist category. Panelists were also provided with the reasoning other panelists provided to support
their proposed NTGR values. Panelists were given the opportunity to modify their original NTGR
values after reviewing the values and supporting rationale provided by others. Figure 2 provides an
overview of the advisory panel process. To preserve the integrity of the advisory process, the
identities of the final panelists were not revealed, although the evaluation identified target
organizations from which they sought to recruit participants. The entire panel process (from
distribution of invitations to presentation of final results) spanned four months.
2014 International Energy Policy & Programme Evaluation Conference, Berlin
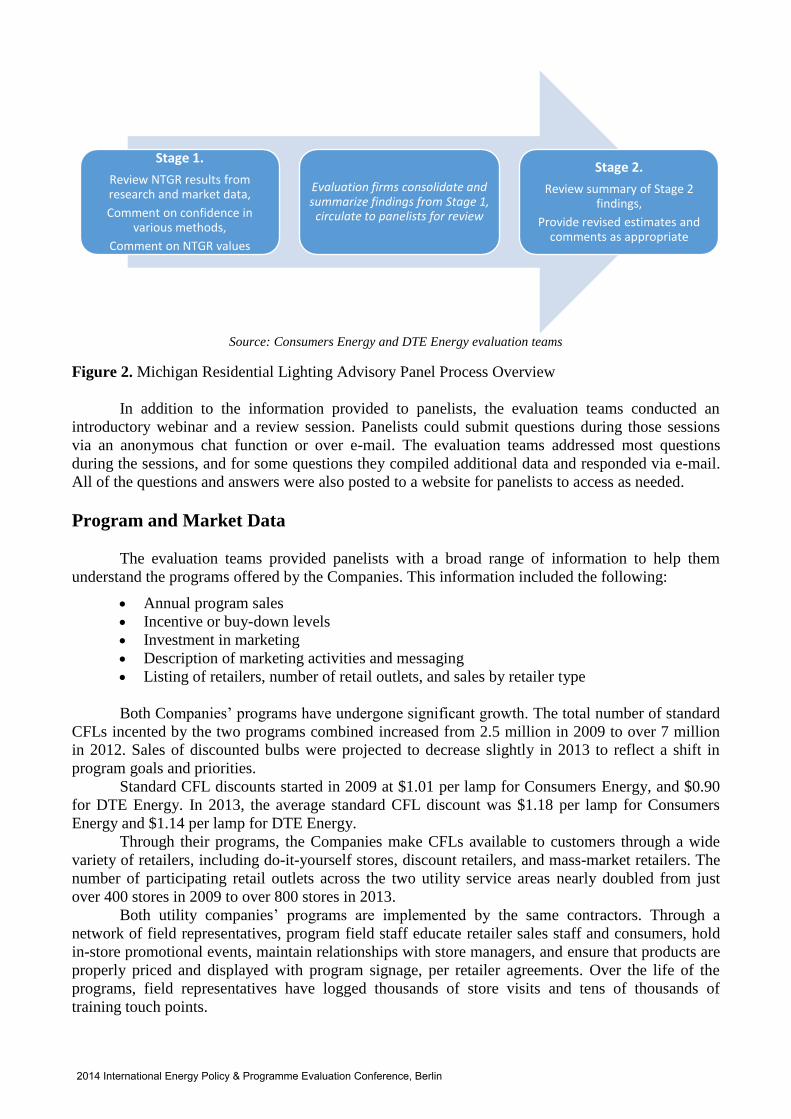
Source: Consumers Energy and DTE Energy evaluation teams
Figure 2. Michigan Residential Lighting Advisory Panel Process Overview
In addition to the information provided to panelists, the evaluation teams conducted an
introductory webinar and a review session. Panelists could submit questions during those sessions
via an anonymous chat function or over e-mail. The evaluation teams addressed most questions
during the sessions, and for some questions they compiled additional data and responded via e-mail.
All of the questions and answers were also posted to a website for panelists to access as needed.
Program and Market Data
The evaluation teams provided panelists with a broad range of information to help them
understand the programs offered by the Companies. This information included the following:
Annual program sales
Incentive or buy-down levels
Investment in marketing
Description of marketing activities and messaging
Listing of retailers, number of retail outlets, and sales by retailer type
Both Companies’ programs have undergone significant growth. The total number of standard
CFLs incented by the two programs combined increased from 2.5 million in 2009 to over 7 million
in 2012. Sales of discounted bulbs were projected to decrease slightly in 2013 to reflect a shift in
program goals and priorities.
Standard CFL discounts started in 2009 at $1.01 per lamp for Consumers Energy, and $0.90
for DTE Energy. In 2013, the average standard CFL discount was $1.18 per lamp for Consumers
Energy and $1.14 per lamp for DTE Energy.
Through their programs, the Companies make CFLs available to customers through a wide
variety of retailers, including do-it-yourself stores, discount retailers, and mass-market retailers. The
number of participating retail outlets across the two utility service areas nearly doubled from just
over 400 stores in 2009 to over 800 stores in 2013.
Both utility companies’ programs are implemented by the same contractors. Through a
network of field representatives, program field staff educate retailer sales staff and consumers, hold
in-store promotional events, maintain relationships with store managers, and ensure that products are
properly priced and displayed with program signage, per retailer agreements. Over the life of the
programs, field representatives have logged thousands of store visits and tens of thousands of
training touch points.
Stage 1.
Review NTGR results from research and market data,
Comment on confidence in various methods,
Comment on NTGR values
Evaluation firms consolidate and summarize findings from Stage 1,
circulate to panelists for review
Stage 2.
Review summary of Stage 2 findings,
Provide revised estimates and comments as appropriate
2014 International Energy Policy & Programme Evaluation Conference, Berlin
In addition to program-specific data summarized previously, the evaluation teams presented
panelists with four sources of market data:
1. Socket saturation data (i.e., the percentage of eligible light sockets in homes filled with
CFLs) collected in the Companies’ service territories
2. U.S. CFL sales data
3. Projections of national market share for CFLs and other bulbs that compete within the
same residential medium screw-base bulb market
4. U.S. Census data comparing key demographic measures across the Companies’ service
territories, as well as for the U.S. as a whole
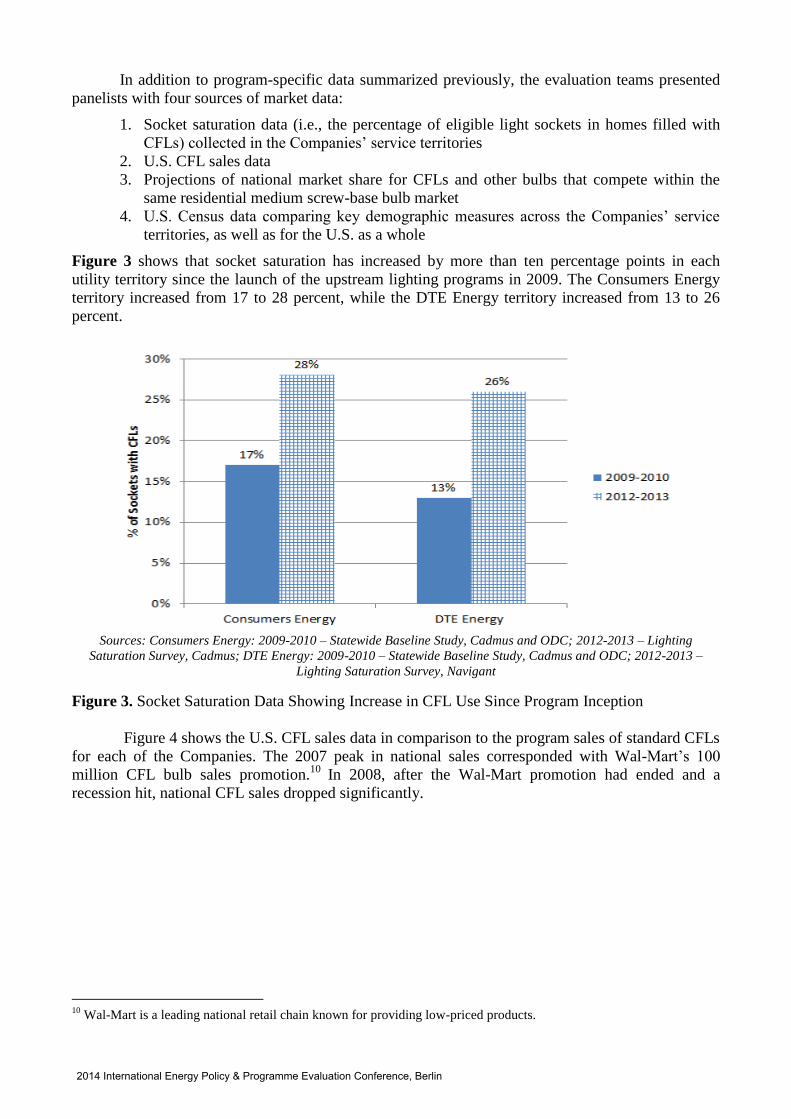
Figure 3 shows that socket saturation has increased by more than ten percentage points in each
utility territory since the launch of the upstream lighting programs in 2009. The Consumers Energy
territory increased from 17 to 28 percent, while the DTE Energy territory increased from 13 to 26
percent.
Sources: Consumers Energy: 2009-2010 – Statewide Baseline Study, Cadmus and ODC; 2012-2013 – Lighting
Saturation Survey, Cadmus; DTE Energy: 2009-2010 – Statewide Baseline Study, Cadmus and ODC; 2012-2013 –
Lighting Saturation Survey, Navigant
Figure 3. Socket Saturation Data Showing Increase in CFL Use Since Program Inception
Figure 4 shows the U.S. CFL sales data in comparison to the program sales of standard CFLs
for each of the Companies. The 2007 peak in national sales corresponded with Wal-Mart’s 100
million CFL bulb sales promotion.10
In 2008, after the Wal-Mart promotion had ended and a
recession hit, national CFL sales dropped significantly.
10
Wal-Mart is a leading national retail chain known for providing low-priced products.
2014 International Energy Policy & Programme Evaluation Conference, Berlin

Sources: U.S. International Trade Commission – Import Statistics; DTE Energy and Consumers Energy upstream
lighting program sales data 2009-2012
Figure 4. U.S. CFL Sales Comparison
The National Electric Manufacturers Association (NEMA) collects market data from member
manufacturers that the organization reports accounts for 95 percent of the U.S. lighting
manufacturing industry (Green 2012). NEMA publishes a nation-wide sales index showing both
historical and projected changes in sales of the three primary bulb types competing in the medium
screw-base bulb market: halogen A-line (marketed as “energy efficient” because they are minimally
compliant with the new federal efficiency standards), incandescents, and CFLs. The index shows a
steady increase in sales of halogen A-line bulbs during 2013. NEMA market penetration data in the
medium screw-base bulb market also shows halogen A-lines gradually gaining market share, filling
the gap left from a decline in incandescent bulb sales in response to EISA standards. Meanwhile, the
CFL market share has remained relatively stable since 2007.11
Total market penetration of halogen A-lines was less than 10 percent of total bulb sales in
2013. However, the steady growth in sales of these lamps, while sales of other technologies shrank
or leveled off, reflects a changing market dynamic for CFLs in the wake of EISA energy efficiency
standards. Even though the market for CFLs has matured substantially in the last decade, CFLs now
have growing competition in the market for “energy-efficient” bulbs. Minimally compliant A-line
halogens, while priced higher than equivalent incandescents, are marketed as “energy efficient” and
sold at a lower price than CFLs. Consumers may not recognize the added value of paying more for
CFLs, and this could potentially erode the market share currently held by CFLs.12
As noted previously, the evaluation teams also reviewed U.S. Census data to explore
potential demographic differences between the DTE Energy and Consumers Energy service
territories, and between these territories’ demographics and that of the U.S. as a whole. The Census
data revealed no major differences between the demographic characteristics of the Companies’
service territories; however, the data did reveal that Michigan is somewhat more economically
11
NEMA lamp indices are composite measures of NEMA member shipment data and are intended to track shifts in
demand for various products. Shipment data are drawn from periodic statistical surveys, and are adjusted to account for
regular seasonal shifts in sales. 12
LEDs also compete in the market for energy-efficient bulbs but have played a relatively small role in the market up to
this point due to their significantly higher price. LEDs are expected to play a much more significant role in the market
going forward.
2014 International Energy Policy & Programme Evaluation Conference, Berlin
disadvantaged than the rest of the nation.
Evaluator Net-to-Gross Analysis
This section presents a summary of the NTG analyses conducted on behalf of the Companies
by the evaluation teams and presented to the advisory panel. The evaluation teams selected a range
of methods for this research effort, with an emphasis on methods that capture spillover and market
effects in addition to free ridership. Analyses conducted previously were also included.
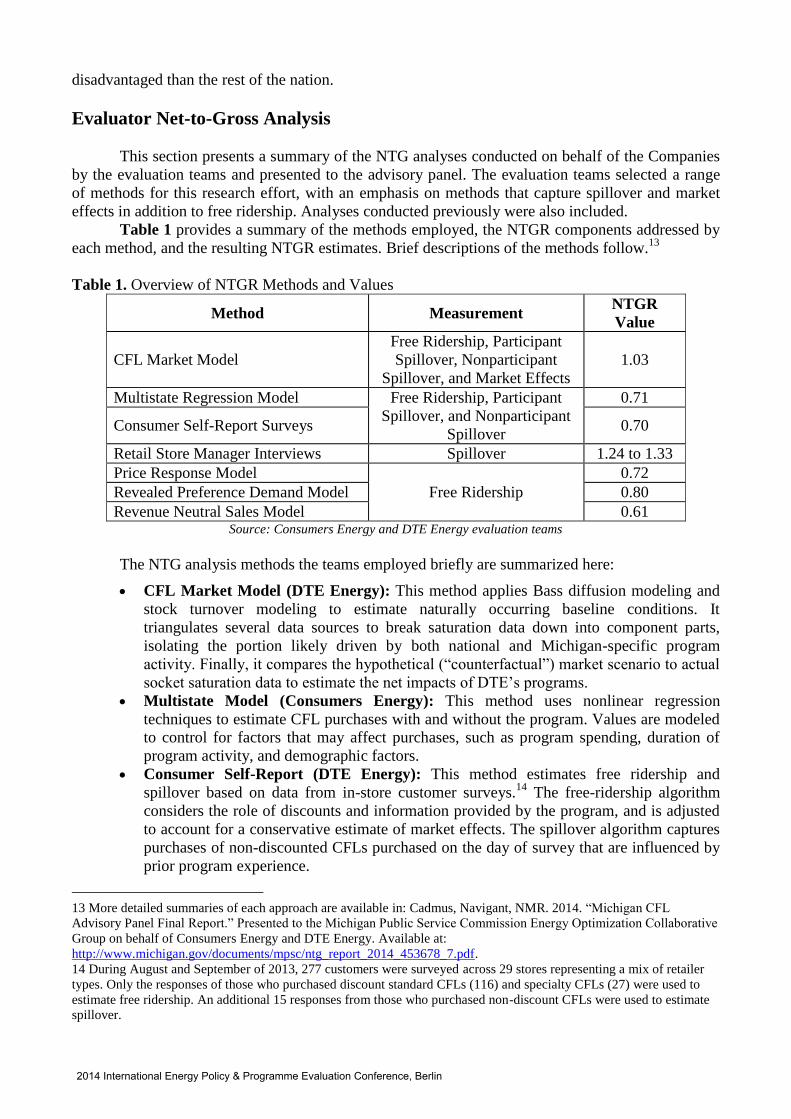
Table 1 provides a summary of the methods employed, the NTGR components addressed by
each method, and the resulting NTGR estimates. Brief descriptions of the methods follow.13
Table 1. Overview of NTGR Methods and Values
Method Measurement NTGR
Value
CFL Market Model
Free Ridership, Participant
Spillover, Nonparticipant
Spillover, and Market Effects
1.03
Multistate Regression Model Free Ridership, Participant
Spillover, and Nonparticipant
Spillover
0.71
Consumer Self-Report Surveys 0.70
Retail Store Manager Interviews Spillover 1.24 to 1.33
Price Response Model
Free Ridership
0.72
Revealed Preference Demand Model 0.80
Revenue Neutral Sales Model 0.61 Source: Consumers Energy and DTE Energy evaluation teams
The NTG analysis methods the teams employed briefly are summarized here:
CFL Market Model (DTE Energy): This method applies Bass diffusion modeling and
stock turnover modeling to estimate naturally occurring baseline conditions. It
triangulates several data sources to break saturation data down into component parts,
isolating the portion likely driven by both national and Michigan-specific program
activity. Finally, it compares the hypothetical (“counterfactual”) market scenario to actual
socket saturation data to estimate the net impacts of DTE’s programs.
Multistate Model (Consumers Energy): This method uses nonlinear regression
techniques to estimate CFL purchases with and without the program. Values are modeled
to control for factors that may affect purchases, such as program spending, duration of
program activity, and demographic factors.
Consumer Self-Report (DTE Energy): This method estimates free ridership and
spillover based on data from in-store customer surveys.14
The free-ridership algorithm
considers the role of discounts and information provided by the program, and is adjusted
to account for a conservative estimate of market effects. The spillover algorithm captures
purchases of non-discounted CFLs purchased on the day of survey that are influenced by
prior program experience.
13 More detailed summaries of each approach are available in: Cadmus, Navigant, NMR. 2014. “Michigan CFL
Advisory Panel Final Report.” Presented to the Michigan Public Service Commission Energy Optimization Collaborative
Group on behalf of Consumers Energy and DTE Energy. Available at:
http://www.michigan.gov/documents/mpsc/ntg_report_2014_453678_7.pdf.
14 During August and September of 2013, 277 customers were surveyed across 29 stores representing a mix of retailer
types. Only the responses of those who purchased discount standard CFLs (116) and specialty CFLs (27) were used to
estimate free ridership. An additional 15 responses from those who purchased non-discount CFLs were used to estimate
spillover.
2014 International Energy Policy & Programme Evaluation Conference, Berlin
Store Manager Interviews (Consumers Energy): This method estimates spillover
based on interviews with store managers at 20 participating stores. Spillover reflects the
store managers’ perceptions of the volume of non-incented CFL sales that are driven by
the program relative to total program bulb sales.
Price Response Model (Consumers Energy): This method estimates price elasticity of
demand using historical program discount and sales data. These results are used to predict
sales with and without the program discount. A cross-section of program package
quantities is modeled since program inception, as a function of price, incentive, number
of promotional events, store type, and bulb type (standard vs. specialty).
Revealed Preference Demand Model (DTE Energy): Using a discrete choice model,
and drawing on actual observed purchase behavior, as well as bulbs stocked on shelves,
this method estimates the probability of buying a CFL instead of an equivalent bulb, with
and without the program.15
Probability is estimated as a function of bulb prices, program
discounts, availability and visibility of equivalent light bulbs, customer’s knowledge of
CFLs and DTE’s lighting program, and the customer’s original bulb purchase plans.
Revenue Neutral Program Sales Model (DTE Energy): This approach assumes that
retailers will offer discounted products only if the volume increase resulting from the
discounted program bulbs is high enough to offset the drop in revenue due to discounted
product prices. Using the price (pre-and post-discount) and quantity of sales allotted in
the retailers’ program participation agreements, the analysis estimates retailers’ projected
CFL sales in the absence of the program, yielding an estimate of maximum free ridership.
Advisory Panel Results and Market Insights
In Stage 1 of the panel, panelists provided estimates of 2009-2013 NTGR values that ranged
from 0.71 to 1.10 and averaged 0.89; 2014-2015 NTGR values ranged from 0.60 to 1.00 and
averaged 0.80.16
In Stage 2, 2009-2013 NTGR values ranged from 0.75 to 1.03 and the average
remained unchanged at 0.89.The range of Stage 2 NTGR values for 2014-2015 remained the same,
though the average NTGR increased slightly to 0.82. There were no outliers in the data set.17
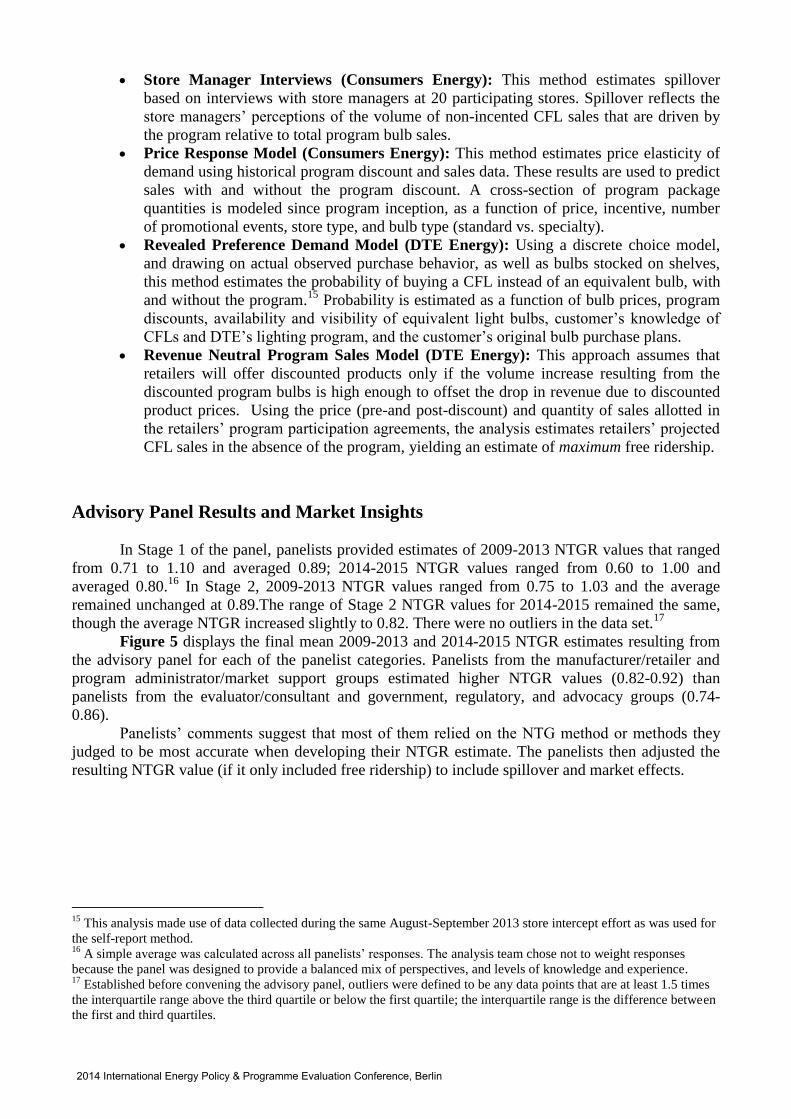
Figure 5 displays the final mean 2009-2013 and 2014-2015 NTGR estimates resulting from
the advisory panel for each of the panelist categories. Panelists from the manufacturer/retailer and
program administrator/market support groups estimated higher NTGR values (0.82-0.92) than
panelists from the evaluator/consultant and government, regulatory, and advocacy groups (0.74-
0.86).
Panelists’ comments suggest that most of them relied on the NTG method or methods they
judged to be most accurate when developing their NTGR estimate. The panelists then adjusted the
resulting NTGR value (if it only included free ridership) to include spillover and market effects.
15
This analysis made use of data collected during the same August-September 2013 store intercept effort as was used for
the self-report method. 16
A simple average was calculated across all panelists’ responses. The analysis team chose not to weight responses
because the panel was designed to provide a balanced mix of perspectives, and levels of knowledge and experience. 17
Established before convening the advisory panel, outliers were defined to be any data points that are at least 1.5 times
the interquartile range above the third quartile or below the first quartile; the interquartile range is the difference between
the first and third quartiles.
2014 International Energy Policy & Programme Evaluation Conference, Berlin
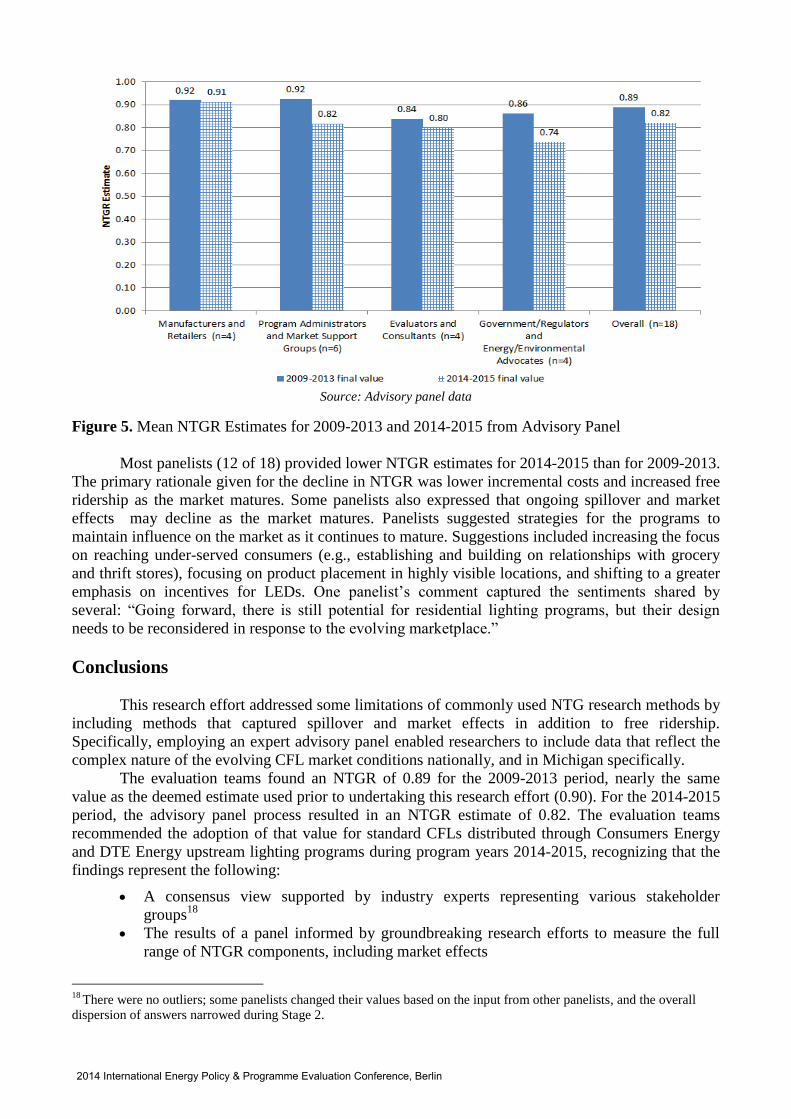
Source: Advisory panel data
Figure 5. Mean NTGR Estimates for 2009-2013 and 2014-2015 from Advisory Panel
Most panelists (12 of 18) provided lower NTGR estimates for 2014-2015 than for 2009-2013.
The primary rationale given for the decline in NTGR was lower incremental costs and increased free
ridership as the market matures. Some panelists also expressed that ongoing spillover and market
effects may decline as the market matures. Panelists suggested strategies for the programs to
maintain influence on the market as it continues to mature. Suggestions included increasing the focus
on reaching under-served consumers (e.g., establishing and building on relationships with grocery
and thrift stores), focusing on product placement in highly visible locations, and shifting to a greater
emphasis on incentives for LEDs. One panelist’s comment captured the sentiments shared by
several: “Going forward, there is still potential for residential lighting programs, but their design
needs to be reconsidered in response to the evolving marketplace.”
Conclusions
This research effort addressed some limitations of commonly used NTG research methods by
including methods that captured spillover and market effects in addition to free ridership.
Specifically, employing an expert advisory panel enabled researchers to include data that reflect the
complex nature of the evolving CFL market conditions nationally, and in Michigan specifically.
The evaluation teams found an NTGR of 0.89 for the 2009-2013 period, nearly the same
value as the deemed estimate used prior to undertaking this research effort (0.90). For the 2014-2015
period, the advisory panel process resulted in an NTGR estimate of 0.82. The evaluation teams
recommended the adoption of that value for standard CFLs distributed through Consumers Energy
and DTE Energy upstream lighting programs during program years 2014-2015, recognizing that the
findings represent the following:
A consensus view supported by industry experts representing various stakeholder
groups18
The results of a panel informed by groundbreaking research efforts to measure the full
range of NTGR components, including market effects
18
There were no outliers; some panelists changed their values based on the input from other panelists, and the overall
dispersion of answers narrowed during Stage 2.
2014 International Energy Policy & Programme Evaluation Conference, Berlin
The NTGR values found in this study are higher than those found in prior NTGR research
conducted in other jurisdictions, in particular in Massachusetts where an advisory panel process was
employed. The following factors likely contributed to the higher values resulting from this research
effort:
The explicit inclusion of multiyear market effects in the definition of NTG in Michigan
(and the explicit exclusion of market effects from the definition of NTG in
Massachusetts) (NMR Group et al. 2011)
The weaker condition of the Michigan economy relative to other regions may have
inhibited customer purchases of discretionary products, such as CFLs.
The Michigan programs have only operated since 2009, a much shorter duration than
programs in some other regions.
Advancements in methods for estimating NTGR yield more reliable and accurate results.
The evaluation teams presented the results of the various research efforts and the advisory
panel results to the EO Collaborative in January 2014. The collaborative group unanimously agreed
to accept the recommendation of the evaluation teams to adopt an NTGR of 0.82 for standard CFL
bulbs promoted through upstream lighting programs in 2014-2015.
References
Appliance Standards Awareness Project. 2014. General Service Lamps: Incandescents plus CFLs,
GSLED, GSOLED. http://www.appliance-standards.org/node/6810. Boston, Mass.: Appliance
Standards Awareness Project.
Bean, F., R. Bruel, S. Scheuer, and A. Walczak. 2014. Implementing the EU Energy Efficiency
Directive: Analysis of Article 7 Member States Reports. Brussels, BEL: The Coalition for
Energy Savings.
De Lovinfosse, I., L. Janeiro, L. Blok, and J. Larkin. 2012. Measurement, Verification and
Additionality of Electricity Demand Reductions. Utrecht, NLD: ECOFYS Group.
Green, Bill. 2012. NEMA Position on Repeal of Light Bulb Efficiency Standards.
http://www.nema.org/Policy/Energy/Documents/NEMA%20Position%20on%20Repeal%20o
f%20Light%20Bulb%20Efficiency%20Standards.pdf. Rosslyn, Va.: National Electric
Manufacturers Association.
Nadel, Steven. 2014. Light Bulb Rider Could Endanger US Jobs.
http://www.aceee.org/blog/2014/01/light-bulb-rider-could-endanger-us-jo. Washington, D.C.:
American Council for an Energy-Efficient Economy.
NMR Group, Inc., KEMA, Cadmus Group, Inc., and Tetra Tech. 2011. Massachusetts ENERGY
STAR Lighting Program: 2010 Annual Report. Somerville, Mass.: NMR Group, Inc.
Staniaszek, D. and E. Lees. 2012. Determining Energy Savings for Energy Efficiency Obligation
Schemes. Montpelier, Vt.: Regulatory Assistance Project.
United Nations Framework Convention on Climate Change (UNFCCC). 2011. “Tool for the
demonstration and assessment of additionality.” Executive Board of the Clean Development
Mechanism Sixty-Fifth Meeting Report Version 01.1, Annex 21. Bonn, DEU: United Nations
Framework Convention on Climate Change.
2014 International Energy Policy & Programme Evaluation Conference, Berlin