how user innovations become commercial …people.hbs.edu/cbaldwin/dr2/bhvrodeokayakhbswpv2.pdf2 how...
TRANSCRIPT

06-032
Copyright © 2006 Carliss Baldwin, Christoph Hienerth and Eric von Hippel
Working papers are in draft form. This working paper is distributed for purposes of comment and discussion only. It may not be reproduced without permission of the copyright holder. Copies of working papers are available from the author.
How User Innovations Become Commercial Products: A Theoretical Investigation and Case Study
Carliss Baldwin Christoph Hienerth Eric von Hippel March 2006

2
How user innovations become commercial products: a theoretical investigation and case study
Carliss Baldwin*, Christoph Hienerth** and Eric von Hippel***
ABSTRACT
In this paper we model the pathways commonly traversed as user innovations are
transformed into commercial products. First, one or more users recognize a new set of design possibilities and begin to innovate. They then join into communities, motivated by the increased efficiency of collective innovation. User-manufacturers then emerge, using high variable cost / low-capital production methods. Finally, as user innovation slows, the market stabilizes enough for high-capital, low variable cost manufacturing to enter. We test the model against the history of the rodeo kayak industry and find it supported. We discuss implications for “dominant design” theory and for innovation practice.
* Harvard Business School, Boston, MA, [email protected] ** Department of Entrepreneurship and Innovation, Vienna University of Economics and Business Administration, [email protected] *** MIT Sloan School of Management, Cambridge, MA, [email protected]
Acknowledgements: First, we would like to thank the editor, Fumio Kodama, and three anonymous reviewers whose comments led to significant improvements in the paper. We also very much appreciate the insights of Joachim Henkel and Jason Woodard on the structure of our models and those of Sonali Shah and Christopher Lettl on our empirical findings. Finally, we benefited greatly from comments provided by participants in the 2005 MIT User Innovation Workshop.

3
1. Introduction and Overview It has been shown that many users – both individuals and firms - develop new products
to serve their own needs. Some of these are later adopted by manufacturers and sold as commercial products. Thus user innovation can greatly influence the rate and direction of innovation in some industries. In this paper we explore the pathways commonly traversed as user innovations are transformed into commercial products. We construct a model, based on design search theory, that explains first, how user innovation is organized and evolves over time, and second, how user innovations become products and affect the evolution of product markets. There is an extensive literature on how changes in product design and production technology affect the organization of industry. This paper brings user innovation into that line of research.
According to the theory developed in this paper, user innovation begins when one or more users of some good recognize a new set of design possibilities– a so-called “design space” –and begin to explore it. In general, one or more communities of user-innovators will soon coalesce and begin to exchange innovation-related information. We use the formal theory of design search to model the behavior of user-innovators and the benefits they obtain by forming communities. Some time after user innovation begins, the first user-purchasers appear – these are users who want to buy the goods that embody the lead user innovations rather than building them for themselves. Manufacturers emerge in response to this demand. We show that, under quite general conditions, the first manufacturers to enter the market are likely to be user-innovators who use the same flexible, high-variable-cost, low-capital production technologies they use to build their own prototypes. The relatively high variable costs of these user-manufacturers will tend to limit the size of the market.
As information about product designs becomes codified, and as market volumes grow, manufacturers—both existing user-manufacturers and established manufacturers from other fields—can justify investing in higher-volume production processes involving higher capital investments. These processes have lower variable costs, hence their use will tend to drive prices lower and expand the market. User-purchasers then have a choice between lower-cost standardized goods and higher-cost, more advanced models that user-innovators continue to develop. We predict that the market will segment along the lines of consumer preferences: we model that segmentation as a function of design quality, usability, and cost. Finally, as a design space matures, the rate of user innovation within that space tends to decline because the expected returns from further design improvements decrease. We model the effects of this “mining out” of the design space on the manufacturers’ choice of technology and capital investment.
We begin this paper with a literature review (section 2), followed by a case history of rodeo kayaking (section 3). This case history serves as the “test case” in the development of our theory. In section 4, we define the basic concepts and terms of our model. In section 5, we explore the decision-making and organization of user-innovators. Next, we consider the economics of manufacturing as user innovation and investment in production technologies change the nature of products and demand (section 6). Section 7 concludes by discussing the theoretical and managerial implications of our findings. 2. Literature review
In this section, we first review research on innovation by users and within user innovation communities. Next, we describe what is known about the role of user-innovators in commercializing the innovations they have developed. Finally, we review prior work on how industry structures change in response to changes in underlying product designs and production technologies.
Innovation by users
Research has shown that some of the most important and novel products and processes have been developed by users - both user firms and individual end users. Thus, Enos (1962) reported that nearly all the most important innovations in oil refining were developed by user firms (oil refineries). Freeman (1968) found that the most widely licensed chemical production processes were developed by user firms. Von Hippel (1988) found that users were the developers of about 80 percent of the most important scientific instrument innovations, and also the developers of most of the major innovations in semiconductor processing. Pavitt (1984) found that many inventions by British firms were for in-house use. Shah (2000) found that the most commercially important equipment innovations in four sporting fields tended to be developed by

4
individual users. It has also been found that commercially attractive products tend to be developed by “lead users” – users that are at the leading edge of important marketplace trends and expect significant benefit from innovating (Urban and von Hippel 1988, Morrison et al. 2002, Franke, von Hippel and Schreier 2005, Olson and Bakke 2001).
Studies have also shown that many users engage in developing or modifying products. In studies of five types of industrial products, the fraction of users reporting developing or modifying products for their own use ranged from 19% to 36% (Urban and von Hippel 1988, Herstatt and von Hippel 1992, Morrison et al. 2000, Franke and von Hippel 2003, Lüthje 2003a). Three studies of user innovation in consumer products found from 10% to 38% of sampled users reporting that they had developed or modified products for their own use (Lüthje 2003b, Franke and Shah 2003, Lüthje et al. 2003). Users with similar interests and needs often form user innovation communities, where members freely reveal their innovations and assist each other with innovation development (Franke and Shah 2002, Hienerth 2004).
Entrepreneurship by users
While it is clear that many users innovate and that user-innovation communities are common, the evidence on the role of user-innovators in the commercialization of their innovations is mixed. On the one hand, von Hippel (1988) found that individual scientists who had developed important scientific instrument innovations seldom founded firms to exploit these. He also found that user firms that had developed new process equipment seldom went into the commercial production of this equipment. In contrast, Shah (2000) found that, in the field of sporting equipment, lead users who developed significant equipment innovations often did become user-manufacturers, producing small volumes of their innovative equipment for purchasers. Some of these small-scale “lifestyle” firms faded away as larger firms entered the market. Others, however, grew into major manufacturers their own right. (For example, Burton Snowboards, founded by an innovating user, has become a major manufacturer of snowboarding equipment). Lettl et al (2005) found that innovating users in the medical equipment field often played important roles in the commercialization of their innovations that fell short of actually starting a company (e.g., helping to find funding or serving as consultants).
Shah and Tripsas (2004) explore when user-innovators are likely to start firms, and compare the competitive advantages of user-startups with established manufacturers. They point out that the likelihood that users will start companies is affected by their opportunity costs. Specifically, the (generally jobless) sports participants who started “lifestyle firms” in Shah’s study had less to lose by starting a company than did the scientists studied by von Hippel. Shah and Tripsas go on to argue that, in terms of resources and capabilities, user-manufacturers have natural information advantages with respect to user needs and desires; they also may obtain free assistance from members of their communities. For their part, established manufacturers may have complementary resources in the form of distribution channels, established brands, and existing manufacturing facilities.
The shift to larger-scale manufacturing
We are not aware of any previous theoretical investigations of how user innovations become commercial products. However, there is an extensive literature on how innovation (by firms not users) affects the organization of industry. Modern studies of industry evolution were initiated by Utterback and Abernathy (1975). They put forward the idea that innovation in an “industry segment” begins with product innovation. Many manufacturers, they said, enter the new segment and compete by offering different product alternatives. Eventually, a “dominant product design” is selected by competition in the marketplace. Thereafter, product innovation declines and process innovation specific to the dominant design becomes a more worthwhile investment. Returns to scale in manufacturing then drive a shift towards increasing industry concentration, and eventually only a few manufacturers with large market shares survive.
The dominant design conjecture has spawned a significant body of empirical research: see Murmann and Frenken (2005) for an analytic overview of this literature. Despite its fruitfulness, the dominant design construct has been criticized for its ambiguity and its dependence on post hoc appraisals (one cannot know a design is “dominant” until it succeeds). In addition, Klepper (1996) has pointed out that a dominant design is not required for a shift from product to process innovation to occur in an industry. As unit production volumes for specific models increase, investments in process innovation will become steadily more attractive whether
5
or not a dominant design exists. Using evidence from the computer industry, Baldwin and Clark (2000) have argued that changes in the modular structure of both product and process designs can cause changes in industry structure via two mechanisms. First, modularizations split up “design spaces” in ways that increase their overall option value. Higher option value justifies more design searches, which in turn create conditions favorable to entry by new firms. Second, modularizations create new “technologically separable interfaces” where transactions between firms can be located. (The term “technologically separable interface” is due to Williamson (1985). Arora et al. (2001) make a similar argument.) Thus modularizations create conditions favorable to vertical disintegration and the formation of so-called “modular clusters.” In complementary work based on the mortgage banking industry, Jacobides and Winter (2005) have argued that, once technologically separable interfaces exist in a supply chain, heterogeneous capabilities across firms in each layer will create “gains from trade.” Over time, exploiting the gains from trade leads to vertical disintegration. However, as this process unfolds, the knowledge relevant to production may become too compartmentalized, which then creates incentives for firms to reintegrate their operations.
The main difference between Abernathy and Utterback’s and Klepper’s theories on the one hand, and the theories of Baldwin and Clark and Jacobides and Winter on the other, is that the latter focus on the determinants of vertical as well as horizontal industry structure. In the latter cases, as long as the overall product and process architecture is stable, in each subindustry of a modular cluster or stage of a supply chain, the dynamics posited by Abernathy and Utterback and Klepper can take place. In this paper, we take a Baldwin and Clark design theory perspective, but leave out the possibility of modularization. Instead we posit that a new “design space” can be opened up and initially explored by users. (The concept of a design space is explained in section 5 below.)
3. Rodeo kayaking—a sport and industry driven by user innovation
When building a theory about complex and inter-related phenomena like innovation and industry evolution, the first task is to construct a model of cause and effect that can explain one set of events in a satisfactory manner. Those events—a case history—serve as the first true test of the theory. A theory that cannot explain its test case has been refuted ab initio. In contrast, a theory that can explain its test case has cleared one hurdle, and merits further testing and refinement.
In a test case it is helpful if the essential patterns stand out and are not obscured by other, potentially conflicting data. Rodeo kayaking—which is both a sport and an industry—satisfies this criterion. The phenomena of interest in this paper are user innovation and product migration from user-innovators to commercial manufacturers. As we will see, the history of rodeo kayaking has been dominated by user innovation for thirty years. During this time period, many innovations by users have become commercial products. Hienerth (2004) has described the evolution of the rodeo kayaking and the industry from inception in the 1970’s to 2002. We next draw upon his account to summarize the features of that history that are critical to testing our theory and models.
Rodeo kayaking involves using specialized kayaks to perform acrobatic “moves” or “tricks” such as spins and flips in rough whitewater. Interest in the sport has grown significantly over the years. In the mid-1970’s whitewater kayaking “enthusiasts” (frequent participants) in the U.S. numbered about 5,000 individuals (Taft 2001). By 2002, about 435,000 enthusiasts in the U.S. took more than five trips per year (Outdoor Industry Association 2004). A similar, but uncounted number of enthusiasts live outside of the U.S., primarily in Europe. Approximately 50,000 rodeo kayaks were purchased in 2002. Industry revenue is currently about $100 million per year including necessary accessories specifically designed for the sport such as paddles and helmets.1
Rodeo kayaking began when, between 1968 and 1970, an avid kayaker named Walt Blackader began to evolve methods of entering waves sideways or backwards. Soon, other “extreme paddlers” joined him and formed a small community. User-innovators in the community began to build their own specialized kayaks and related gear and safety equipment. They built their rodeo kayak prototypes from fiberglass using hand lay-up techniques – a method
1 Colman (1998) . Telephone interviews with Eric Jackson of Jackson Kayak (April 2005) and Robert Sommer of Mega Sports GmbH (October 2004) were used to update the figures.

6
also used by the manufacturers of commercial alpine kayaks at that time. The method was labor intensive but required very little capital. In the early 1970’s rodeo kayak manufacturing began when some user-innovators began to respond to requests from potential purchasers who asked, “can you make me a kayak of the same design as the one you built for yourself?” These first “user-manufacturers” used the same low capital, high variable cost hand lay-up techniques to produce boats for sale that they used to build boats for their own use. In the mid-1970’s two manufacturers already established in the plastics forming business, Uniroyal and Hollowform, identified plastic-hull rodeo kayaks as a potentially profitable market opportunity. They introduced boats based on user designs of that time, but made entirely of plastic (Taft 2001, telephone interview, 2005). Plastic boats could be produced at low variable cost, but required higher capital investment than traditional production methods in the form of relatively expensive, design-specific molds. The introduction of plastic rodeo kayaks was associated with a great expansion of the market: plastic kayaks were less expensive and much more durable than fiberglass kayaks. Many customers who had not started whitewater kayaking because they did not want to spend their leisure time repairing kayaks now bought plastic boats. Also, paddlers could run steeper and more dangerous rivers than before (Taft 2001). Some of the original user-manufacturers switched to plastic boat manufacturing, but others stayed focused on the production of fiberglass boats for specific market segments (e.g., slalom, competition). In the 1980’s most rodeo kayakers used commercially-manufactured plastic boats. But plastic boats did not become a platform for user-innovators, because their hulls could not be easily modified. User-innovators, therefore, built their novel designs using traditional fiberglass lay-up techniques. User innovation in the early and mid 1980’s focused on the development of “squirt boat” kayak hull designs. Squirt boats were designed to have only 51% buoyancy – e.g. if one added more than 1% additional weight, the boats would sink rather than float. Each boat therefore had to be tailored to the body-weight of the paddler. The advantage of low buoyancy was that a kayaker could simply lean forward or backwards to push the bow or stern of the boat under the surface of the water. As a result, kayakers were able to do existing tricks better, and were also able to do new tricks such as cartwheeling for the first time. But although squirt boats were very appealing to highly skilled paddlers, their low buoyancy and tight dimensions made them dangerous and uncomfortable for most kayakers. Only a few thousand squirt boats were made, produced by users for themselves or by user-manufacturers using low-capital fiberglass hand lay-up techniques. In the late 1980’s, user-innovators discovered how to have the “best of both worlds,” in the form of reasonable buoyancy plus the high maneuverability of the squirt boat. Their fundamental innovation was to reduce buoyancy at the ends of the boat while increasing it in the middle. The net effect was a buoyant boat with a bow and stern that could still be easily pushed under the water during execution of a trick. In addition, user-innovators discovered that by building a very flat hull, a planing hull, they could easily spin and maneuver in whitewater. User-innovator communities quickly focused on this new type of boat. Hull designs and new tricks and techniques developed very rapidly, each responding to the other. Flashier tricks on steeper and more dangerous runs brought media attention to the sport and a growing number of people tried out rodeo kayaking. The new, “center-buoyant” planing hull designs evoked enough demand to justify new rounds of investment in the molds for plastic boats. Indeed, a number of new manufacturers entered the industry in the late 1980s and the 1990s in order to satisfy this demand. And while large-scale manufacturers had traditionally changed their designs only every four to five years, in the late 1990s, companies started to change designs on a one or two-year cycle. Around 2000 a fairly standard rodeo kayak design emerged, and the rate of both user innovation and new model introduction by manufacturers decreased. However, the new standard design greatly increased the demand for rodeo kayaks among both competitive and amateur paddlers.
Rodeo Kayak Innovations As indicated, because our theory and models focus on how user innovations become commercial products, we wanted user innovation to be the dominant source of innovation in our test case industry. To verify that this was the case, we compiled a dataset of all innovations in techniques and equipment that were important to the evolution of rodeo kayaking between 1970

7
and 2000. As can be seen in Table 1, we divided the innovations into major and minor categories. Major technique innovations are defined as major tricks that have been assigned performance points by the International Freestyle Committee (IFC) in rodeo competitions; minor technique innovations are recognized improvements of major techniques. For example, performing multiple cartwheels in a kayak is a major technique innovation, while transferring one’s body weight from one side to another to change the direction of a multiple cartwheel (splitwheel) is a related, minor technique innovation. Major equipment innovations are defined as those that changed the way in which people used and paddled rodeo kayaks in a significant way; minor equipment improvements improved the new functionality achieved by these major improvements or made paddling more efficient and comfortable. For example, the flat planing hull was a major equipment innovation, while “divot” indentations to reduce water friction were a related, minor innovation. Table 1: Sources of Rodeo Kayaking Innovations
Source of Innovations
Innovation Type User User-Manufacturer Manufacturer Number Technique Innovations
Major 100% - - 6 Minor 100% - - 33
Hardware Innovations Major 63% 13% 25% 8 Minor 83% 2% 15% 46
We also determined the source of each innovation, and coded the source as either user,
user-manufacturer or manufacturer. (These terms are precisely defined in section 4, below.) The results are summarized in table 1. The full dataset is available from the authors or on the web at http://designresearch.jot.com/RodeoKayakInnovations.
Table 1 shows that users developed 100% of all new techniques, as well as 62% of the major and 83% of the minor equipment innovations in rodeo kayaking. In other words, for thirty years, users have been the dominant innovators in this field. We concluded that the rodeo kayaking industry was an appropriate test case to use in constructing a model of how user innovations become commercial products. 4. Set-up for the model
Our goal in modeling is to explore and characterize the process by which innovations initiated by user-innovators become commercial products. In our model we assume that all innovations come from users – a good fit, as we have seen, to the facts for our rodeo kayak test case. The primary actors in our model are user-innovators, user-purchasers, user-manufacturers and established manufacturers from other industries.
User-innovators seek to develop new designs for their own personal use or (in the case of user firms) internal corporate benefit. They do not anticipate selling goods or services based on their innovations, although they may later go into business as user-manufacturers (see below).
Designing for use and testing by use are the essential characteristics of user-innovators: they may subcontract production and parts supply, but they cannot subcontract the innovation’s design or testing and be user-innovators under our definition.
User-purchasers are satisfied to use an existing design, although they may wish to use an innovative or advanced model. They do not want to innovate or produce the good themselves, but they will pay money to acquire it. User-manufacturers are user-innovators who make copies of their designs and sell them to user-purchasers. In our field observations and those of Shah (2003), user-manufacturers are often the first to enter a new marketplace with a new product. This is one of the empirical observations our model explains (see section 5 below).
Established manufacturers are already in business in some other arena. As a result, they may have complementary assets such as manufacturing capacity, distribution channels and brands. They acquire designs from user-innovators by purchasing them, licensing them or simply copying them. (Note that our list of actors does not include “pure” entrepreneurs, that is, non-

8
users who innovate and start new firms. This is consistent with our theoretical focus on user innovation.)
In the next two sections (5 and 6), we will develop our model along two “tracks.” Section 5 deals with the decisions and actions of user-innovators, while section 6 deals with the decisions and actions of user- and established manufacturers as user-generated innovations arrive.
5. The Search for New Designs by User-Innovators Characteristics of New Designs
Every innovation involves a new design, and designs have certain essential properties (Baldwin and Clark, 2006a). First, designing requires effort, hence new designs are costly. Second, design outcomes are uncertain in several ways. The behavior of a newly designed good and the reaction of users to that behavior are not perfectly predictable. The costliness and uncertainty of new designs in turn can be formalized by modeling the process of design as a search in an unknown territory. (Simon 1981, Nelson and Winter 1977, Levinthal 1997, Baldwin and Clark 2000, Rivkin 2000, Loch et. al. 2001).
A design space is the name given to the abstract territory in which design search takes place. Speaking informally, a design space includes all possible variants in the design of a class of artifact—such as a rodeo kayak. The design of a particular thing corresponds to a single point in the design space. For example, a red kayak and a blue kayak with the same hull design are two points in the kayak design space. Their designs differ on a single dimension—color. (Bell and Newell 1971, Shaw and Garlan 1996, Baldwin and Clark 2000, Murmann and Frenken 2005.)
The following sequence of events takes place in a new design space. First, the new space opens up. Then user-innovators search in this space for new and better designs. As they search, the design space gets “mapped,” that is, the searchers come to understand the properties of a large number of design alternatives. Eventually, the design space may be “mined out,” and search in that space will stop. (Our assumption that the relevant design space is finite and so can be mined out holds up well in the case of rodeo kayaking, as we will show below. Sometimes, however, innovators exploring a design space may decide to alter or expand the space as they explore. We will return to the issue of the limits of design spaces at the end of the paper.)
User-innovators are motivated to explore a design space because they believe that new designs in the space can enhance the things they do. Thus no one has to pay users to search in the design space. This is a critical property of user innovation in general: up to a certain point (described below), design searches by user-innovators are motivated by the users’ own desires for a better product.
Every new design is an option. Technically an option is “the right but not the obligation” to take a particular action (Merton 1998). When a new design is created, users can accept it or reject it. They have “the right but not the obligation” to solve some problem in a new way. Uncertainty combined with optionality justifies investment in multiple design searches, that is, the prototyping and testing of many new designs. Uncertainty also results in a dispersion of outcomes, but optionality implies that only the best of those results will survive (Baldwin and Clark 2000). The last important property of designs is non-rivalry. The use of a design by one person does not preclude another from using it too. Thus designs cannot be “consumed” in the sense of being “used up.” Of course property rights, e.g. patents or copyrights, can turn designs into rival goods: rights owners can prevent others from using their design. However, property rights are a feature of specific institutional regimes, not an intrinsic characteristic of designs. The Opening of a New Design Space and Search by Isolated User-Innovators
The “opening” of a new design space is often a datable event—like the time that Walt Blackader first used a kayak to do tricks in the whitewater of a river. As in this case, user-innovators may trigger the opening by doing something in a new way. But researchers can also open up new design spaces, as Shockley did for the transistor, and Kilby and Noyce for integrated circuits.
For simplicity, we assume that the designs in a particular space can be ranked, and that all users will agree on the ranking. In that case, at any time, there will be one best design, and everyone will agree on what it is. Let the quality of the best pre-existing design by user-innovator i be ai . We can assume that all the ai s are zero when the new design space opens. Then, as the innovators search, their designs will improve, and each innovator’s ai will get higher and higher.

9
By the optionality of designs, any innovator can always fall back on a previous design, thus ai never decreases.
Innovators also have expectations about the quality of the new designs they may find if they make the effort to search. Design outcomes, we have said, are uncertain, hence these beliefs are probabilisitic. We model them as a random variable, X , whose support is a measure of design quality or value. For simplicity, we assume that all innovators perceive X in the same way, and that each new design search generates an independent draw from the distribution of X . (Our qualitative results do not change if design search outcomes are correlated, although the notation becomes more complicated.)
Each user-innovator also has a cost of search, di . This is his perception of the time, effort and money it will take to develop one new prototype for his own use. The innovator can compare this number to the quality of prototypes already in existence and to his expectation of the quality of future designs.
Suppose each user-innovator is completely isolated from all others. Each would then have access to her own best previous design but no one else’s. We assume that the innovator looks at her old design ( ai ); thinks about potential new designs ( X); and the cost of her time and effort ( di ). Investing time and effort in a new design is worthwhile if:
Pr(X > ai )[E(X|X > ai ) ai] di > 0 ; (1) Reward conditional Cost of on success of search Search
where:
Pr(X > ai ) is the probability that the new (uncertain) design will be better than the old one;
E(X|X > ai ) ai is the expected value of the new design, given that it is better, minus the value of the old design.
The left-hand side of expression (1) is well-known in option theory: it is the expected
payoff (net of cost) to a call option. The “strike price” of this option is ai , the value of the best pre-existing design. The cost of purchasing the option is di . It is well-known and intuitive that as
ai increases, the value of the option declines (weakly). (Merton, 1990, pp 262-263.) Thus for any innovator, as the value of her best pre-existing design rises, the “net option value” of search will decline. At some point, the user-innovator will perceive the incremental expected benefit of further search to be less than her opportunity cost, and will stop trying to generate new designs.
Implicitly then there is a “threshold value,” ai * , that makes expression (1) equal to zero:
Pr(X > ai *)[E(X|X > ai *) ai *] di = 0 . (2) Each user-innovator will continue to search until he finds a design that is better than his threshold. In general, the threshold value ai * will differ from person to person (or firm to firm), depending on their perceptions of the design space and their cost of search. Note also that the innovators’ calculations do not have to be formal: they need only have a sense of the value of their own time, the utility of their own best pre-existing design, and the degree of difficulty of design improvement. Search in a Community of User-Innovators
The second event in the “user innovation track” of our model is the transition from isolated user-innovators to a community of user-innovators who freely exchange information on their designs in real-time. By real-time, we mean that designers learn of other designs in time to influence their decisions to search or not on the next round. Real-time communication coupled with free-revealing of new designs has been observed in communities of sports enthusiasts (Franke and Shah 2003, Hienerth, 2004); in open source development communities (Raymond 1999, Henkel, 2005), among firms using similar production equipment and processes (Allen 1983, Nuvolari, 2004), and many other settings (Shah, in press). In rodeo kayaking communities, for

10
example, communication and free-revealing are achieved via frequent joint excursions by members, during which the performance of any innovations can be observed, and the innovations themselves are examined in detail by all who are interested.
More formally, let the previously isolated user-innovators form a community in which they freely reveal their designs. Let a denote the value of the best of all pre-existing designs at a given time:
a max
i{ai } . We assume that any member of the community can use this design if he
or she wishes to do so. For the moment, assume that all members have the same search costs. Each member’s expected benefit from searching is then:
Pr(X > a )[E(X|X > a ) a ] d (3)
This expression is identical in form to expression (1) above—it is the expected payoff to a call option. The option price is the same, but the strike price is now a , the value of the community’s best pre-existing design, which is the maximum of all the individuals’ best designs.
The first result of the model is that search redundancy is reduced within communities. Working separately, all user-innovators will get to designs with value above their personal ai * , but they will do so redundantly. For example, suppose by luck one of the designers achieved a design above everyone’s threshold on the first trial. If all the others knew about that new design and could use it, they would stop searching. But, if they are isolated, they will keep on searching, each on his or her own narrow trajectory.
Let us assume that there are K user-innovators in total and that all have the same threshold value, a * . Let S * denote the average number of searches needed to surpass the threshold. Then, in expectation, isolated user-innovators will conduct KS * searches, while user-innovators in the community will conduct only S * searches.
The second result of the model is that all community members will benefit from the findings of those who search longest. To see this, suppose the community is made up of heterogeneous individuals. Some may have higher or lower search costs; some may have different perceptions of the probability of achieving a better design. As a result, the individual user-innovators’ thresholds, ai * , will vary. Let a denote the maximum of all the individual thresholds:
a max
i{ai *} . (4)
Search in the community will continue until this threshold is surpassed.
To summarize, a community consisting of K user-innovators confers two benefits on its members. First, any given threshold of performance can be attained at a search cost that is on average 1/K of the average search cost of individuals in isolation. Second, community search will continue until the best design exceeds the maximum threshold of all members. Thus, when the search process ends, all members but one will have access to a design that is better than the one they would have settled for had they been searching alone.
These results do not speak to the distribution of benefits and costs among members of the community. One possible distribution is for one individual to do all the innovating, and for all other members to free-ride. In this case, the lone innovator is no better off in the community than if he were searching in isolation. But given any other distribution of search effort, all members of the community are better off in it than outside of it (Baldwin and Clark 2006b). A similar principle applies to mergers of communities: as long as the distribution of effort is not one-sided, then members of two smaller communities will always benefit by joining forces to form a larger community. The “pro-community” results of our model arise because of the non-rival property of designs. If rivalry between user-innovators increases, the benefits of free-revealing and of forming communities will go down. Rivalry can increase through several mechanisms, some of which can be seen operating in present-day rodeo kayaking communities (Hienerth 2004). First, if users within a community compete with each other, willingness to freely reveal performance-enhancing innovations will be reduced (Franke and Shah 2003). Second, if user-innovators become user-manufacturers (or affiliated with established manufacturers) and compete for the same customers, they will perforce become rivals, and their incentives to share design
11
information in a community will go down. (Henkel 2005; Baldwin and Clark 2006b). As an illustration of the latter effect, consider the history of the Home Brew Computer Club. This club was initially formed by hobbyists in the San Francisco Bay area who were interested in developing and improving personal computers for their own use. It flourished for a number of years as members developed and freely shared important advances in that field. Later, when some club members formed companies (for example, Steven Jobs and Stephen Wozniak formed Apple Computer), information flow among the membership decreased, and eventually the club disbanded (Freiberger and Swaine 1999).
The “Mining Out” of a Design Space
We define a successful new design as one that is better than the best previous design. Thus if a is the community’s best design so far, a successful new design is one whose realization is greater than a . For a fixed random variable, X , the probability that the next design is better than the previous best is a (weakly) declining function of a . Intuitively, the better the best previous design, the lower is the probability of surpassing it. This means that, if the community of user-innovators conducts the same number of searches per period, the expected time between successful new designs, denoted T , will tend to increase over time. Indeed, this expected interarrival time will go up each time a successful new design is found. (See the Appendix 1 for a proof. In Section 6 we will show that the expected interarrival time between successful user innovations is of crucial importance to established manufacturers contemplating entry.)
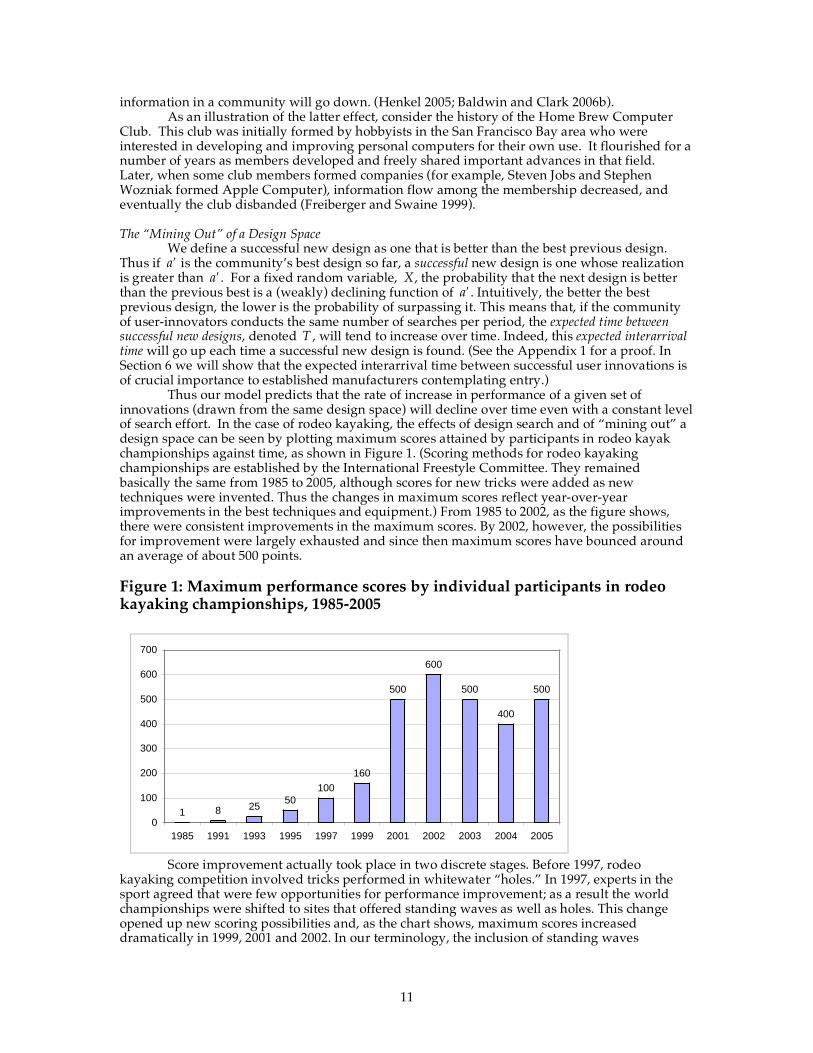
Thus our model predicts that the rate of increase in performance of a given set of innovations (drawn from the same design space) will decline over time even with a constant level of search effort. In the case of rodeo kayaking, the effects of design search and of “mining out” a design space can be seen by plotting maximum scores attained by participants in rodeo kayak championships against time, as shown in Figure 1. (Scoring methods for rodeo kayaking championships are established by the International Freestyle Committee. They remained basically the same from 1985 to 2005, although scores for new tricks were added as new techniques were invented. Thus the changes in maximum scores reflect year-over-year improvements in the best techniques and equipment.) From 1985 to 2002, as the figure shows, there were consistent improvements in the maximum scores. By 2002, however, the possibilities for improvement were largely exhausted and since then maximum scores have bounced around an average of about 500 points.
Figure 1: Maximum performance scores by individual participants in rodeo kayaking championships, 1985-2005
Score improvement actually took place in two discrete stages. Before 1997, rodeo kayaking competition involved tricks performed in whitewater “holes.” In 1997, experts in the sport agreed that were few opportunities for performance improvement; as a result the world championships were shifted to sites that offered standing waves as well as holes. This change opened up new scoring possibilities and, as the chart shows, maximum scores increased dramatically in 1999, 2001 and 2002. In our terminology, the inclusion of standing waves
1 825
50
100
160
500
600
500
400
500
0
100
200
300
400
500
600
700
1985 1991 1993 1995 1997 1999 2001 2002 2003 2004 2005

12
augmented, that is, added new dimensions the searchable design space of techniques. A second prediction of our model is that, other things equal, total search effort by user-
innovators will tend to decline over time. Intuitively, as each user-innovator crosses his performance threshold, ai * , the expected improvement in the design will no longer exceed that person’s perceived value of time, effort and expense, and he will stop attempting to innovate. Although data are sparse, some evidence of this pattern can be seen in rodeo kayaking. In the early 1970s, around half the kayaks made were designed and produced by users in local clubs (Taft, 2001, p. 165). There were no national, much less international communities: user-innovators basically searched in isolation. Then with the introduction of molded plastic kayaks, the number of active user-innovators declined (although the total number of users went up). Plastic kayaks were very difficult to modify, and thus, in terms of our model, plastic kayak users faced very high design costs (high di ). From 1980 to 1985 leading-edge users started designing and building fiberglass squirt boats – first only a few, then increasing to around 1,000 in 1985 (Snyder 2005). These boats had to be customized to each user, hence there was necessarily a lot of experimentation with design modifications. However, with the introduction of center-buoyant, planing hull designs in the 1990s, the number of people designing their own kayaks decreased again. According to Eric Jackson (2005), a two-time world champion and founder of Jackson Kayaks, starting in the 1990s, the number of people working on their own boats came down. By 2000, he estimated, there were only a few hundred people actively working on new hull designs. This is less than .1% of all users - estimated at 3.9 million in 2002 by the Outdoor Industry Association (2004). These active user-innovators typically work on designs for fun and to increase performance for high-level competition. (About 400 people compete at the world level every year. The theory of tournaments applied to design search predicts that competitors may continue to search long after other users have stopped (Aoki 2001).)
In sum, our theory views user-innovators as economic actors who perceive their time and effort to be valuable and respond rationally to changing incentives. As the options in a given design space are mined out, such user-innovators will be less inclined to search in that space. Although we lack hard quantitative evidence, our interviewees perceive that user innovation (particularly in hull design) has declined over time, and that the possibilities inherent in the design space have diminished. 6. Manufacturers’ Entry and Investment
The previous section showed that user innovation has its own organizational logic and dynamic pattern. Where does manufacturing fit into this picture? In this section, we explore the behavior of manufacturers with respect to a stream of user innovations. The exposition proceeds as follows. We begin by characterizing designs and manufacturing technologies along five dimensions. We then construct a model of user-purchaser demand and profit maximization by manufacturers. We use the model to show, first, how profit expectations affect a manufacturer’s decision to enter the market and second, how a market may be split between user-manufacturers and established manufacturers.
Designs and Manufacturing Technologies
Designs and the technologies employed to maufacture them differ on thousands of dimensions, but we will focus on just five, which we believe capture the first-order effects of user-generated innovation on industry structure. The five dimensions are: (1) innovation cost, d ; (2) design quality, a ; (3) user cost of ownership, u ; (4) variable cost of production, c ; and (5) capital cost, C . The first three properties are important to users and user-innovators; the last two are important to manufacturers. Any set of designs and technologies can be categorized according to these five dimensions. Thus our model of manufacturers’ behavior in the presence of user innovation is general, although we will apply it to manufacturers of rodeo kayaks.
As in the previous section, innovation costs, d , are incurred when a user-innovator attempts to change a pre-existing design. Technologies differ in terms of the ease with which a new design prototype can be constructed or an existing design modified. For example, fiberglass hand lay-up is a low-innovation-cost (low d ) technology, and plastic injection molding is a high-innovation-cost (high d ) technology.
We have also already defined design quality, a , as it is perceived by user-innovators. Designs that expert users deem to be “outstanding” have high a ; those that experts consider to

13
be inferior have low a . We assume that user-purchasers and user-innovators perceive design quality in the same way: they agree on a .
User-purchasers also face differential user costs of ownership. Such costs take into account the time, effort and aggravation involved in purchasing, handling and maintaining the good. Designs that result in delicate, hard-to-handle, high-maintenance objects (like squirt boats) have high user costs of ownership, while those that result in robust, easy-to-handle, low-maintenance objects (like plastic boats) have low costs of ownership. We assume that users differ from one another in their perception of ownership costs. Specifically, we assume that (1) for the original user-innovator costs of ownership are zero; and (2) the cost differential between successive users is constant, denoted u . Manufacturers then face a linear inverse demand curve:
p(N) = a uN . (5)
That is, the price needed to sell N units of a good with design quality a is a uN .
Variable costs, c , are the per-unit cost of making an item, including materials, labor, marketing, transportation, administration, management. Capital costs, C , are the upfront costs of making the item, including plant and equipment, inventory, trade credit, plus investments in branding, marketing, and process R&D. Labor-intensive production technologies (like fiberglass hand lay-up) have high variable costs and low capital costs, while automated, machine-intensive technologies (like plastic injection molding) have low variable costs and high capital costs. Profit Maximization
The first step in our analysis is to derive the profit-maximizing strategy of a monopolist. Under the assumptions stated above, a manufacturer facing no competition has the following profit function:
Profits of = p(N)N cN ; (6) of a Monopolist
where p(N) = a uN . Standard optimization methods then give us the optimal price, p * , units sold, N * , and profits, * of the firm:
p * =
a + c2
=a c
2+ c ; (7a)
N * =
a c2u
; (7b)
* =
(a c)2
4u (7c)
Note that innovation cost ( d ) and capital cost ( C) do not enter the expressions for
optimal price, units sold and profit. By definition, the user-purchasers are not interested in changing the design of the good, and so d does not affect their demand. Capital costs affect a manufacturer’s decision to enter the market, but once it has entered, such costs are sunk, and do not affect pricing or production decisions. The Decision to Enter—Why User-Manufacturers Enter First
In deciding whether to enter a given market, a manufacturer must compare the capital costs of his chosen technology to the present value of the stream of expected profits over the lifetime of the investment. Specifically, a manufacturer (who faces no competition) will calculate the net present value (NPV) of his business opportunity as follows:

14
NPV =*
(1 + r)tt=1
T
C
=(a c)2 /4u
(1 + r)tt=1
T
C
(8)
Equation (8) shows how the attractiveness of the investment opportunity depends on the
profit stream, * and the expected lifetime of the profit stream, T . If the next successful user innovation will render the manufacturer’s capital obsolete, then the expected lifetime of the profit stream equals the expected interarrival time between successful designs. In section 5 and Appendix 1, we showed that this interval increases over time as the design space gets mined out. This is where the behavior of user-innovators influences the behavior of manufacturers.
In the early stages of user innovation, the expected interarrival time between successful designs, may be quite short. In that case, the only worthwhile investments have no (or very low) capital. (In equation (8), if T is low, the first term will be small, hence C must be small to obtain a positive NPV.) At this point in the industry’s development, user-manufacturers will have a threefold advantage over established manufacturers in other fields.
First, user-innovators who become user-manufacturers already have product and process designs. In terms of our model, user-manufacturers have already paid the initial design cost, d . Manufacturers from other fields must still pay this cost, which may be large or small depending on the context.
Second, user-manufacturers are already in the community of users, hence they can use low-cost, word-of-mouth marketing techniques. This gives them a lower variable cost, c , in relation to those who are not in the community. Again the advantage may be large or small, depending on the context.
Third, because user-manufacturers can use their prototyping facilities to build products, they can be profitable from the outset, regardless of the actual level of demand or the interarrival time of successful new designs. In effect, in setting up prototyping facilities, user-innovators have already invested a small amount of capital in manufacturing. This sunk capital and the capabilities involved in managing it constitute a competitive advantage vis a vis other manufacturers seeking to enter the market de novo.
What this means is that an established manufacturer who attempts to enter the new market using low-capital methods will be dominated by user-manfacturers on the d, c and C dimensions of its technology. That is a formidable disadvantage to overcome. At the same time, an established manufacturer who wants to use high-capital technology needs to be fairly certain that her profits will exceed some level and that the expected interarrival time between successful new designs is long enough to justify the investment. In other words, the combination of * and T in equation (8) must yield a positive NPV for the capital, C , that the established manufacturer plans to spend.
A good illustration of a low-capital user-manufacturer in the rodeo kayak field is Stefan Steffel. Steffel was a member of the Austrian National Freestyle Kayak Team and participated in the 2003 World Championships. He started to develop kayak helmets in 2002 because he wanted a stylish and functional helmet for his own use. Others who saw his novel helmets wanted their own, and so he began to produce helmets for sale to others. The production technology Steffel uses at the time of this writing is very simple and requires almost no capital. He forms and bonds four thin layers of carbon fabric over a self-designed helmet form, and then adds fittings such as shock-absorbing padding. His production cost per helmet is around $30 plus 3 hours of his time. His tools and material fit into two suitcases, so he can take his “factory” with him when he travels to rodeo kayaking events. In 2005 he expected to sell 60 to 70 helmets using these methods.
Capital-intensive Technologies—An Opportunity for Established Manufacturers
Production and marketing methods that require little or no capital tend to have high variable costs. Thus once manufacturers know that a particular market exists and are confident that the next successful design will not arrive too soon, they have incentives to invest. Where will
15
the capital investment come from? One possibility is that the low-capital user-manufacturers already in the market will make the investments. Another possibility is that an established manufacturer from a nearby product market will enter the new market in competition with the incumbent user-manufacturers. This is most likely to occur if the original user-manufacturers lack the capabilities to implement high-volume production and marketing methods.
What happens when a high-capital firm enters the market in competition with a low-capital firm or firms? Possibly that firm will drive its predecessors out of the market. However, a more likely outcome is a shared market equilibrium as described in the next section.
A Shared Market Equilibrium
In this section we extend our model to show how a market may be split between a user-manufacturer with an advanced design and an established manufacturer with a less advanced design and a low-variable-cost production technology. We then use the model to explain the evolution of the rodeo kayak industry as described in Section 2.
Let Firm 1 be the user-manufacturer and Firm 2 be the established manufacturer. They sell differentiated goods (good 1 and good 2 respectively) and compete on price (Bertrand competition).
Consistent with our previous arguments, we assume that the user-manufacturer has higher design quality and and uses high-variable-cost production methods, while the established manufacturer has lower design quality and uses low- cost methods. In other words, the user-manufacturer’s products are aimed at an elite customer base, while the established manufacturer’s products are targeted at a mass market. These assumptions imply that: a1 > a2 and c1 > c2 .
The two goods also differ in the way individual users perceive their cost of ownership, u .
Specifically, the Nth user is willing to pay for good 1 and good 2 as follows:
Good 1 : WTP1(N) = a1 u1N ;
Good 2 : WTP2 (N) = a2 u2N . Users with negative willingness to pay for a good will not purchase it. Consistent with the idea that good 2 is a mass market good, we assume that a2 /u2 > a1/u1 . This means that more users derive positive utility from good 2 than good 1, and (because a1 > a2 ) implies that u1 > u2 .
Formally the willingness-to-pay functions indicate that “low- N ” users are willing to pay more for good 1 (the user-manufacturer’s product). These users perceive good 1’s design quality to be high and its costs of ownership for them are low. In contrast, “high- N ” users are willing to pay more for good 2 (the established firm’s product). They concede that good 1’s design quality is high, but for them its costs of ownership are high—high enough to offset the design quality. Thus in our model goods differ in terms of their ownership costs, design quality and cost of production, and users differ in the way ownership costs affect their willingness to pay. In other words, the goods are both vertically and horizontally differentiated.
This characterization of users’ behavior arises directly from our field observations. We found that goods supplied by user-manufacturers were often difficult to buy, maintain or use, because user-manufacturers could not afford distribution systems, field service operations, or training centers, all of which require capital. We also found that some user-purchasers—those living far away, those who did not know how to maintain or repair the good, or those who were not experts—would not buy the user-manufacturer’s good for these reasons. But others would purchase it despite these difficulties. It is these differences between goods and among users that we model via the willingness-to-pay functions. (Such differences are succinctly captured in a comment often made about fiberglass kayaks: “Who wants to spend their weekends patching up boats?”)
We follow standard practice and assume that, given a choice between two imperfect substitutes, each user calculates a “consumer surplus” for each good, i.e., the difference between his willingness to pay and the good’s price. He then buys the good with the higher consumer surplus, as long as it is greater than zero. (Thus in our model, user costs of ownership operate like

16
transportation costs in a Hotelling spatial competition model—see Tirole, 1988, p. 277-279.2 However, in contrast to many Hotelling-type models, we do not allow our firms to strategically choose their “locations.”)
We now consider a non-cooperative pricing game between the two firms. The objective function of Firm i , i = (1,2) is:
max
pii = (pi ci ) Di (pi , pj ) ; (9)
where j denotes the other firm. The corresponding first order condition is:
Di (pi , pj ) + (pi ci )
Di (pi , pj )
pi= 0 ; (10)
To determine the Bertrand-Nash equilibrium of this game (if one exists), we must specify the firms’ demand functions, D1 and D2 ; solve the system of equations corresponding to the first order conditions; and check that the second order conditions are satisfied (Tirole, 1988, p. 428).
In Appendix 2 we show that, under our assumptions, the demand functions for Firms 1 and 2 respectively are:
D1(p1, p2 ) =
(a1 a2 ) (p1 p2 )u1 u2
; (11a)
D2 (p1, p2 ) =
a2 p2u2
(a1 a2 ) (p1 p2 )u1 u2
. (11b)
Substituting these demand functions and their partial derivatives into the first order conditions yields a linear system of two equations in two unknowns, p1 and p2 . Checking the second order conditions confirms that the unique solution of this system is a Nash equilibrium. The equilibrium, if it exists, is summarized by the following equations:
p1 =
a1 + c12
a2 p22
; (12a)
p2 =
a2 + c22
a1 p12(u1/u2 )
. (12b)
(For some parameter values, e.g., c1 > a1 , an equilibrium may not exist.)
Figure 2 depicts such an equilibrium. Firm 1 is the user-manufacturer and Firm 2 the established manufacturer, thus by assumption, the Firm 1’s willingness-to-pay function has a higher intercept and steeper slope and its variable cost is higher than Firm 2’s. In equilibrium, Firm 1 charges a relatively high price, p1 and users to the left of the first vertical line D1 purchase this “elite” product. Firm 2 charges a lower price, p2 , and users located between the
2 To see this, consider a store located at the origin that sells two goods, which are imperfect substitutes. Good 1 is of higher quality, but more costly (per mile) to ship; good 2 is of lower quality, but cheaper (per mile) to ship. Users live at different distances from the store, and must pay the shipping cost. No user will buy more than one unit of one good. Under these assumptions, users who “live” close to the origin will purchase good 1; those who live farther away will purchase good 2; and those who live very far away will purchase neither. Users’ purchase behavior switches from good 1 to good 2 at the “point of indifference”, that is, the point where the N th user’s consumer surpluses for the two goods are equal. Similarly, users’ purchase behavior switches from good 2 to “no purchase” at the point where the N th user’s consumer surplus for good 2 equals zero. The switching points depend on the prices charged by each firm (see Figure 2 below).

17
vertical lines D1 and D1 + D2 buy this “mass market” product. At D1, the consumer surpluses of the two goods are equal: CS1(D1) = CS2 (D2 ) . Total units sold equal D1 + D2 . Firm 1’s profit,
(p1 c1) D1, is indicated by the square shaded area next to the vertical axis; Firm 2’s profit,
(p2 c2 ) D2 , by the rectangular shaded area between the vertical lines D1 and D1 + D2 .
Figure 2: Market shared between a user-manufacturer of high-quality, elite products and an established manufacturer of low-quality, mass market products
0
2000
0
Units (N)
Willin
gn
ess t
o P
ay,
Pric
e,
Co
st
($
)
Purchasers' willingness-to-pay for the user-manufacturer's product
a1-u1N
Purchasers' willingness-to-pay for the established firm's product
a2-u2N
User-manufacturer's price, p1
User-manufacturer's cost, c1
Established firm's price, p2
Established firm's cost, c2
Demand for user-manufacturer's
product, D1
Total demand,
D1+D2 = (a2-p2)/u2
CS1(D1)
CS2(D1)
Market Evolution Resulting from a Series of User Innovations Precisely how the market will be shared depends on the relative values of the key
parameters, a ,u and c . Depending on these parameters, the prices charged by the two competitors may be close together or far apart, and the market share of the user-manufacturer may be large or small. Furthermore, each time a successful user innovation arrives or a new production technology is invented, the parameter values will change, causing prices (and demands) to shift to a new equilibrium.
We can use this model to explain the evolution of the rodeo kayak industry described in section 2. We begin in the late 1970s, when two established plastic boat manufacturers were already in the market. Recall that relative to fiberglass boats, plastic boats had lower user costs as well lower variable costs of production. But relative to the most advanced hulls, the plastic boats were of lower quality (experts could not do as many tricks with them).
The first user-innovation challenge came in the form of fiberglass squirt boats. These had high design quality, but also very high user costs: they were delicate and hard to maintain and required expert handling. Because of their high user costs, the purchasers’ willingness-to-pay function for squirt boats would have had a very steep slope. It seems intuitive that squirt boats would have high prices and very low market shares. (Of course, it is necessary to solve the model for appropriate parameter values to confirm this intuition: we will do so below.)

18
The second user-innovation challenge was a breakthrough design: the “best of both worlds” snub-nosed, planing hull design of the late 1980s. In reality, our dataset on innovations shows that the breakthrough was the result of steady, ongoing user experimentation and innovation in both techniques and equipment. The end result, however, was a design that was superior to squirt boats in terms of absolute design quality (experts could do more tricks with it) and much easier (for anyone) to handle. In terms of our model, the “center-buoyant” boats had both a higher a and a lower u than squirt boats. But while these designs were experimental, user-manufacturers sensibly relied on low capital, high variable cost fiberglass production methods. In terms of our model, the center-buoyant boats initially had approximately the same production cost, c , as squirt boats.
The third challenge was a manufacturing innovation made possible by prior user innovations. As the user-innovators began to converge on a “standard” center-buoyant design, some firms began to make the new hulls out of plastic. Plastic production methods brought down the variable cost of center-buoyant boats, and, because plastic is easier to maintain, user costs declined still further.
We can use the shared equilibrium model to predict how the original plastic boats would fare against the challenges of this stream of user innovations. As a thought experiment, therefore, we chose parameter values for each type of boat that reflected what we knew about their relative design quality, user cost and variable cost. We then solved the model for three competitive confrontations, pitting the original plastic boats against (1) squirt boats; (2) fiberglass center-buoyant boats; and (3) plastic center-buoyant boats. (These confrontations roughly represent the state of competition in the market during the following periods: (1) 1980-1985; (2) 1985-1995; and (3) 1995-present.)
The inputs to the thought experiment are summarized in table 2. Consistent with our previous discussion, we assume that, in terms of design quality, squirt boats hulls have higher design quality than the original plastic hull, and center-buoyant hulls are better still. The original plastic hulls have the lowest user cost, followed by center-buoyant plastic, center-buoyant fiberglass, and squirt boats. Finally, plastic hulls have much lower variable costs than fiberglass hulls (but we assume that center-buoyant plastic hulls are slightly more expensive to make than the original plastic hulls). Table 2: Inputs to the shared equilibrium model
Table 3 shows the outputs from the shared equilibrium model. Moving from left to right
we see how user-generated innovations can migrate from a tiny niche to market dominance. The model tells us that two things have to happen for this migration to take place. First, the advanced user-innovator designs have to become usable by large numbers of user-purchasers, that is u must fall. Second, mass production methods have to reduce the variable cost ( c) of making the advanced designs. Only then will their prices come down below most user-purchasers’ willingness-to-pay. Interestingly, however, the price of the more advanced designs does not need to be as low as the original mass-market product for the new designs to become dominant. In the last panel of table 3, the original plastic boats have prices less than half of center-buoyant boats, and yet the original boats’ market share and profits are very low. There is no mystery here: center-buoyant boats have (by assumption) twice the design quality and their user costs are comparable to original plastic boats. This means that most user-purchasers are willing to pay a substantial premium for a center-buoyant plastic boat. Only those with the highest user cost (or least ability to pay) will purchase an original plastic boat.
Center- Center-Original Squirt Buoyant Buoyant
Inputs Plastic Boat Fiberglass Plastic
a (design quality) 1000 1500 2000 2000u (user cost) 0.05 0.5 0.2 0.1c (variable cost) 200 800 800 220

19
Table 3: Output from the shared equilibrium model
The Impact of a Breakthrough Design
If we focus on the first and second panels of table 3, we can see how a “breakthrough” design, defined as one that combines high design quality ( a ) with low user cost ( u), dramatically changes entry incentives for user-manufacturers. In comparison with squirt boats, revenue from center-buoyant fiberglass hulls is almost ten times higher and profits almost twenty time higher! Thus a “breakthrough” design originating in a user-innovator community creates opportunities for new user-manufacturers to enter the market. Indeed each successful new design following the breakthrough creates another opportunity for entry. And because user-manufacturers use low-capital methods, they can enter profitably even when the designs are turning over rapidly, ie., the expected interarrival time between successful designs, T , is very short. In contrast, manufacturers using high-capital methods must be assured that T is long enough to allow them to recoup their capital.
Combining the results of sections 5 and 6, our theory predicts that, following the discovery of a breakthrough design (high a , low u), there will be a rash of startups by user-manufacturers using low capital technology. Such entry will continue, albeit at a diminishing rate until the design space of the breakthrough is mined out. (This prediction is consistent with the argument advanced by Agarwal and Bayus, 2002, that an outward shifting demand curve may cause a "sales takeoff" in a new industry. In our model, reductions in user cost, u, precisely translate into an outward shift in the demand curve for the product in question.)
To test this prediction, we looked at entry by new firms into the rodeo kayak market following the advent of center-buoyant, planing hull designs in the late 1980s. Between 1986 and 2003, at least fifteen new firms entered the rodeo kayaking industry worldwide. Of these, twelve were user-manufacturers by our definition; one was a new business unit of a corporate parent; and two had founders whose relationship to the sport was indeterminate.3
Fiberglass technology provided a platform for user innovation through the late 1980s and early 1990s, and allowed user-manufacturers to form new firms with little or no initial capital investment. However, today all surviving manufacturers in our sample offer plastic boats for sale. (There may be firms too small to be in our sample, but we have accounted for all firms with any presence on the worldwide web, and all firms that have entered boats in the world competitions since 1993. Interestingly, 1993 was the last year in which a homemade boat, i.e., a pure user innovation, placed in world competition.)
3 To arrive at these figures, we began with the companies listed in Hienerth (2004) that made whitewater kayaks. (We included only boat manufacturers, excluding companies that made kayak gear or supplied ancillary services.) We augmented the list via a snowball search of retailer websites. We visited the website of each company, searching for descriptions of the company’s founders and a founding date. Not every company revealed the exact year of its founding, but most gave some clue, for example “we are a new company,” or “in business for ten years.” Obviously this method will miss companies that went into business and then failed, and companies with no websites: thus we know only that “at least fifteen” companies were founded in the time interval. The relative percentages of user-manufacturers, manufacturers, and “indeterminate” in the surviving set will be representative of the initial set as long as failure rates do not systematically differ across the three subgroups.
Center- Center-Original vs. Squirt Original vs. Buoyant Original vs. Buoyant
Outputs Plastic Boat Plastic Fiberglass Plastic Plastic
Price 572 936 493 1,147 289 754Units Sold 8,262 302 7,822 2,311 3,543 10,686Profit ($000) 3,072 41 2,295 801 314 5,709Gross Margin (%) 65% 15% 59% 30% 31% 71%
Market Share (units) 96.47% 3.53% 77.19% 22.81% 24.90% 75.10%Market Share (revenue) 94.36% 5.64% 59.29% 40.71% 11.26% 88.74%Total Units Sold (Np + Ns) 8,564 10,133 14,229Total Revenue ($000) 5,007 6,509 9,082

20
The fact that all manufacturers now make plastic boats raises the question, can fiberglass center-buoyant boats compete with plastic center-buoyant boats? Using our model, the question can be made more general: when can firms specializing in advanced, experimental designs with low usability and high costs of production survive in a shared market equilibrium? To answer this question, we can look back at figure 2 and the first panel of table 3 (original plastic vs. squirt boats). Here we see that as long as the experimental designs have higher design quality for some users-purchasers, then an advanced, experimental sector, perhaps fueled by user innovation, will survive. High-cost experimental designs will support low-capital manufacturing until the design space is mined out. Thus, again combining results from sections 5 and 6, our theory predicts that user innovation and the high-cost experimental sector of an industry will decline at approximately the same rate.
When a design space is mined out, then what?
When user innovation ceases, does that mean that all innovation will stop? Not at all. First of all, firms have incentives to search for innovations that user-innovators will be indifferent to. User innovators, by definition, search for innovations they can use themselves. The number of other users who benefit from the innovation does not matter to them. But a firm can aggregate small increases in willingness-to-pay (or decreases in cost) over many users (von Hippel 2005). Thus some design searches—those that are expected to deliver modest benefit to a large number of users—will be attractive to firms, even after user-innovators consider the possibilities of the design space to be exhausted.
Second, innovations that change the cost of generating (and testing) new designs—the cost we have labeled “ d”—will change user innovators’ incentives. If d goes down, users who previously had no incentive to search, may begin to search again. There are in turn two basic ways to change d . The first involves modularization; the second involves creating a toolkit.
A modular design architecture splits up the work of innovation into a set of smaller task modules. Modularizations often increase the option value of a set of design spaces, thereby increasing everyone’s incentives to search (Baldwin and Clark 2000). But modularity has another important effect on user-innovators: different people can devote their effort to different parts of the system, yet gain the benefit of the whole (Baldwin and Clark 2006b). Thus, given a modular architecture, design projects that a single person would not tackle alone may be undertaken by a community of user-innovators. (This result, like many others, arises because of the non-rival property of designs.) Toolkits also depend on modularity, but in a different way. In essence a toolkit splits the tasks of design into those that are common and repetitive and those that are uncommon or unique. The common and redundant tasks are automated. In terms of our model, a toolkit splits the design cost, d , into a capital component—the toolkit and the knowledge necessary to use it—and a variable component—the designer’s decisions within the framework of the toolkit. By investing in the toolkit, a designer can reduce the time and effort needed to generate new designs. By the analysis of section 5, a reduction in a user-innovator’s design cost, di , results in an increase that person’s threshold, ai * , and possibly the community threshold, a . Thus the introduction of a toolkit can rejuvenate user innovation in a design space that was previously deemed to be exhausted. 7. Discussion
Our theory and models indicate that industries built upon user innovation will evolve as follows. First, one or more users of some good recognize a new set of design possibilities– a so-called “design space” –and begin to explore it. Users will then search in the design space to obtain the direct use value of their discoveries. Against the expected value of a new design they offset the cost of their own time, effort and out-of-pocket expenses. They benefit by freely revealing their designs in a community of like-minded innovators. At some point in this process, user-purchasers will emerge, interested in buying copies of user innovations rather than making them for themselves. In response, some user-innovators may become user-manufacturers, using high-variable-cost, low-capital methods to satisfy the demands of fellow community members.
Later, as the no-longer-new design space begins to be “mined out”, better solutions become harder to find and the rate of user innovation slows. As a result, investments in manufacturing methods involving higher capital costs and lower variable costs become feasible. User-manufacturers or others respond by making such investments and lower-cost products will

21
increase the size of the market. User-innovators who require the very best performance continue to innovate, however, and also continue to sell smaller numbers of high-performance products to user-purchasers who are willing to pay for advanced designs. But progressive mining out of the design space leads to steadily lower rates of user innovation, less entry, and eventually to the collapse of the user-driven experimental sector of the industry.
Our model of design search indicates that there are large benefits to having a free-revealing community. Any scale of community is more efficient than design search by innovators acting in isolation. Search efficiency goes up as the size of the community goes up or as free revealing occurs among multiple communities. However, the benefits of community hinge on the non-rival property of designs. Rivalry in innovation can be introduced via competition among firms or by organized competition in the form of games or tournaments. If there is "too much" competition of either type, the community form of organization will not be viable.
The events described in our model of industry evolution do not have to happen in a strict order. Also in some cases, one or more of the steps we describe might be left out. In the case of rodeo kayaking, for example, recall that the production of squirt boats never shifted from a low-capital / high variable cost regime to a high-capital / low-variable cost regime. Although squirt boats represented an important stage in the user development of rodeo kayaks, this particular type of boat was difficult for non-experts to use. Also, each individual boat produced had to be tailored to the body weight of its owner. For both reasons, there was not enough demand for a standard design to justify making high fixed-cost investments in the production of a specific squirt boat model.
Generality of the models
We think our models (of design search and industry evolution) may be quite generally applicable to fields and industries where users are an important source of innovation, and where design spaces are finite and so subject to being mined out. To test this possibility, we next subject the models to several thought experiments. Each involves varying a basic condition or assumption in one or both of the models.
First, in our model of industry evolution, the transition from a low-capital/high-variable cost manufacturing regime to a high-capital/low-variable cost one occurs as a design space is mined out and the pace of user innovation slows as a consequence . What if there is no fixed design space and so no mining out? Design spaces can be expanded via the creativity of designers supported by the consensus of users that the expansion is “a good idea.” Indeed, we saw a minor example of design space expansion in our rodeo kayaking test case: the inclusion of standing waves as well as “holes” in rodeo kayaking competitions starting in 1999. Expanding an existing design space is equivalent to opening up a new design space (albeit perhaps a small one). Our model of design search predicts that this should result in a temporary increase in the rate of user innovation. And in fact, our data show that the pace of rodeo kayaking technique and equipment innovation quickened for a period before leveling off (see figure 1).
However, some products and markets appear to have design spaces that are relatively easy to expand. (Baldwin and Clark, 2000, call such expansion “augmentation.”) Personal digital assistants and cell phones are examples of this. Their functionalities have evolved in a relatively unfettered way – for example, cell phone functionality recently expanded to include cameras. Our model of design search does not apply to such cases, although it might be extended in that direction. But it is clear that, absent a fixed design space with a stationary distribution of opportunities, the mining out predicted by our model will not occur. In that case, the rate of user innovation will not necessarily decline over time, and low-capital, experimental user-manufacturers and high-capital, mainstream manufacturers might coexist indefinitely.
Second, what happens if the design-specific investments assumed in our model of industry evolution are not required to get the variable costs of production and distribution down? For example, so called “mass-customized” production methods are based on computer-driven production tools that can be automatically adjusted to produce single units of unique products at variable costs similar to those achievable by fixed, design-specific production tooling (Pine 1993). To the extent that such production methods are available to user-manufacturers (for example through outsourcing as in the fabless semiconductor market or assembly stage of computers), it seems to us that small-scale user-manufacturers could move more seamlessly into higher volume production as their markets grew. In such cases, it will be harder for new entrants to use capital investment to dislodge user-manufacturers who have secured an early position in an emerging
22
market. Third, what happens if users can innovate by modifying products that manufacturers produce via high-capital/low-variable cost methods? Recall that in our rodeo kayaking case this was not the situation: it was technically difficult for rodeo kayak user-innovators to modify mass-produced plastic kayaks to incorporate their new design ideas, and so they were forced to build their prototypes “from scratch” from fiberglass, using high-variable-cost hand fabrication methods. Often, however, mass produced products do serve as convenient platforms for user-innovators. For example, most user-innovators who develop improvements to their “street” vehicles start with an existing car – a “tuner car” - and build modifications onto it that rather than starting from scratch. In such cases, we would still see a transition from low-capital to high-capital production methods in some stages of the supply chain, as predicted in our model. But other manufacturers, following the tracks of the user-innovators, might specialize in modifying the low-cost mass-produced product. We can see this pattern for example, in the number of aftermarket firms, some quite large, that sell modifications to standard cars produced by major auto manufacturers. The auto aftermarket is estimated to be $29 billion in 2005 (Vasilash 2005).
Fourth, what happens if manufacturers are not required for the production of a product, as in the case of information products? A set of commercial firms may still emerge focused on diffusion and design transfer. Specifically, in our model, "manufacturers" have two roles. They physically make multiple copies of a given design (production) and they transfer new designs to users who don't want to design themselves. Conceptually, these two roles can be separated. For example, information goods have designs that can be copied very cheaply, using generic electronic technologies. Once an information good has been converted into a digital format, it doesn't require specialized physical or chemical processes to be "manufactured." So one of the two roles we have assigned to manufacturers disappears. The "design transfer" role may still remain, however, in which case, we will see firms emerge whose function is to sort, collate, evaluate and transfer designs between users.
As an illustration, for a significant period of time, open source software products such as the Linux operating system and Apache web server software were developed, distributed and supported in the field only by their user communities – no manufacturer was required. Users innovated and shared their innovations in an “experimental” version of the software. Community core members then selected the features that would be included in the “standard release,” which was distributed to users who valued consistency, stability and dependability. As the number of users of the standard releases grew, however, commercial suppliers such as Red Hat found it profitable to create even more user-friendly packaged releases. In terms of our model, Red Hat is in the design transfer role vis a vis Linux.
Finally, what happens if being a user-manufacturer is not an attractive proposition? In our model, user-manufacturers are the first producers of user innovations because they are assumed to have lower costs than “outside” manufacturers in the early, low volume stages of a market. More specifically, users who become low-volume manufacturers have better information about user needs and lower design and marketing costs than “outside” manufacturing firms. However, sometimes there can be offsetting regulatory or other costs for user-innovators. In such cases, the user-manufacturer stage of our model may be skipped and “outside” firms may be the first to manufacture user innovations. Relationship to “dominant design” and other theories of industry evolution
Recall from the literature review that our focus on users as the primary innovators raises subsidiary sets of questions related to industrial organization and industry evolution. First, how will the user-innovators organize themselves? Specifically, what social configurations will allow them to pursue and diffuse innovations efficiently? Second, how will the industry evolve over time? What types of firms will enter, and when? Third, is the concept of “dominant design” useful in these settings? And will there be a switch to process innovation, and “evolution toward concentration” as Abernathy and Utterback and Klepper suggest?
We have addressed the first two sets of questions in our models and case-related discussions. We have argued that users will organize themselves into free revealing communities, and that, often, user-manufacturers will enter first. If they do, established manufacturers may have an opportunity to enter by investing in high-capital processes. Technically the user-manufacturers have the same opportunity, but they may lack capital or requisite capabilities. Entry by high-capital firms will not necessarily drive low-capital firms out

23
of the market. A shared market equilibrium may result. A "breakthrough" design is one that greatly increases the usability of a set of advanced designs. Breakthroughs create a lot of demand, first in the low-capital sector, then in the high-capital sector. There will be a "flurry" (or perhaps a blizzard) of entry by user-manufacturers, followed by a wave of investment in high-capital processes. And a breakthrough design may drive high-capital incumbents out of the market, unless they can make the transition to the new designs. What does our model say about the concept of dominant designs? In rodeo-kayaking, products have now converged on a standard center-buoyant, planing hull design. Utterback and Abernathy predict that this event will be followed by a shakeout of firms, as production becomes more concentrated. We find that, to the contrary, the first effect of the development of that breakthrough design was to stimulate a lot of entry by new firms that experimented with variants of the "operational principle" of the breakthrough. Our model predicts that industry concentration will really take hold only after the design space is mined out. On that view, the last successful new design, not the breakthrough, corresponds to the dominant design. As Murmann and Frenken (2005) point out, on a long enough time scale, all designs from the "breakthrough" to the "last success" may look like variants on one design. But a great deal of design history and industry turbulence may occur in the time between breakthrough and last success!
Will there be a switch to process innovation, and “evolution toward concentration” as Utterback and Abernathy and Klepper suggest? Yes. Opportunities for process innovation open up as soon as the existence of the market is established. However, these opportunities consistently get more valuable as T , the expected interarrival time of successful new user-developed designs, increases. Thus the mix of search effort will be changing over time—user innovation (which is by definition, product innovation) will go down over time, and process innovation will go up as T gets longer, making process investments more valuable. Eventually, according to our model, all user innovation will stop, and T will be at its maximum. In that state, most innovation will be process innovation. And if the process investments have the characteristics of sunk-cost capital (as defined by Sutton 1991), then the ending market structure will be highly concentrated and oligopolistic.
Managerial Implications
Manufacturers do not yet tend to look systematically at the new product opportunities that user innovations, user innovation communities and related emerging markets represent. The model we have presented here provides a first opportunity for both user-manufacturers and established manufacturers to think systematically about the dynamics of these types of markets, and to plan their business strategies accordingly.
User-manufacturers will be interested to understand that they often have comparative advantages over established manufacturers during the early stages of user exploration of a new design space. It is important for them to understand the nature of these advantages and how and why they diminish over time. If user-manufacturers wish to continue to compete in the major portion of their market as it matures, they must also acquire the advantages of established manufacturers, such as access to high-capital production processes, established distribution channels, and well-known brands. They can also elect to continue their role as early, niche manufacturers of leading-edge products. As long as user-innovators are actively searching in the design space, the low-capital, experimental sector of the industry will continue to be viable. When user innovation stops, however, this low-capital sector will disappear.
Established manufacturers wishing to apply production and distribution methods requiring high model-specific capital investments to an emerging market must pay close attention to T , the interarrival time of successful new designs. As our model shows, the arrival of new user-developed designs can obsolete design-specific investments made by manufacturers. Therefore, manufacturers should postpone their entry into the market until T and model-specific market volumes have reached levels that justify their investments (see equation 8). (User manufacturers using low-capital technologies, in contrast, can flourish under conditions of low T .) Surviving manufacturers will still search for new designs. However, their incentives are to look for innovations of modest value that can be applied to many units. Cost-reducing process innovations and widely valued new features are two examples of this type of innovation.
Opportunities for further research
There are clear opportunities for further research both with respect to model

24
development and empirical research. In the first place, while the theory and models we have presented are quite general, they have some clear limitations. There are several interesting avenues that invite exploration. For example, on the design search modeling “track”, it would be interesting to look at the impact of organized competition on innovation and free revealing in user communities. On the one hand, tournaments are known to increase investment in activities that contribute to winning (Frank and Cook 1995, Aoki 2001). On the other hand, rivalry between user-innovators creates disincentives to free reveal, and thus may attenuate the benefits of communities. This inherent tension calls for a model, as well as further empirical work to investigate how the tension is dealt with in different settings. On the manufacturing “track”, one obvious limitation of our model is that it deals with only two firms and one dimension of user and product heterogeneity (usability). A more realistic model would allow for multiple firms and several dimensions of heterogeneity. New case studies focused on different industry and innovation conditions would also certainly enrich our understanding of the pathways traversed from user innovations to commercial products and enhance future theory and model development. For example, the particular case explored here—rodeo kayaking—involves a tightly defined “legitimate” design space. In effect, the worldwide community of rodeo kayakers has a tacit, but strong, shared understanding of their sport. They also have a collective interest in being able to compete and to compare their performances within a clear, commonly understood framework: introduction of a flying kayak into a rodeo kayaking contest would probably not be welcomed. As indicated above, many products and markets, for example, cell phones and personal digital assistants, have design spaces that are more open and expandable—that is, freer to evolve new functionalities. Few would disallow a convenient addition to a cell phone because “cell phones aren’t supposed to do that.” In such cases, the model of design search developed here will not hold. The overall rate of user innovation will not decline over time—it may even increase in response to modularizations or the addition of especially rich new design subspaces. And if the rate of user innovation remains high, our model of industry evolution indicates that low-capital, experimental user-manufacturers and high-capital, mass-market manufacturers might coexist indefinitely (although we expect there would be turnover in both as the underlying designs changed). Under these conditions we speculate that high-capital manufacturers may set their sights more finely, seeking temporary “islands of stability” within a shifting product and market landscape, and making design-specific investments in production capabilities at those locations. Studies of such cases are clearly needed to build the basis for a still broader understanding of the pathways traversed as user innovations are transformed into commercial products.
25
References Allen, R. C. (1983). “Collective Invention.” Journal of Economic Behavior and Organization 4(1): 1-24. Aoki , Masahiko (2001) Towards a Comparative Institutional Analysis, Cambridge, MA: MIT Press. Arora, Ashish, Andrea Fosfuri, Alfonso Gambardella (2001) Markets for Technology: The Economics of Innovation and Corporate Strategy, MIT Press, Cambridge, MA. Baldwin, Carliss Y. and Kim B. Clark (2000). Design Rules, Volume 1, The Power of Modularity, Cambridge MA: MIT Press. Baldwin, Carliss Y. and Kim B. Clark (2006a) "Between 'Knowledge' and the 'Economy': Notes on the Scientific Study of Designs," Advancing Knowledge and the Knowledge Economy, (Brian Kahin and Dominique Foray, eds.) Cambridge, MA: MIT Press. Baldwin, Carliss Y. and Kim B. Clark (2006b) "The Architecture of Participation: Does Code Architecture Mitigate Free Riding in the Open Source Development Model?" Management Science (forthcoming) Bell, C. Gordon and Allen Newell (1971) Computer Structures: Readings and Examples, New York, NY: McGraw-Hill. Colman, Stormy (1998) “Rodeo’s Ripple Effect. Playboating Pushes Kayaking into the Economic Mainstream,” Paddler Magazine No. 4. Enos, J. L. (1962). Petroleum Progress and Profits: A History of Process Innovation. Cambridge MA: MIT Press. Frank, Robert H. and Philip J. Cook (1995) The Winner-Take-All Society, New York, NY: Free Press. Franke, Nikolaus and Sonali Shah (2003). “How Communities Support Innovative Activities: An Exploration of Assistance and Sharing Among End-Users,” Research Policy 32(1):157-178. Franke, Nikolaus and Eric von Hippel (2003). “Satisfying Heterogeneous User Needs via Innovation Toolkits: The Case of Apache Security Software.” Research Policy 32(7): 1199-1215. Franke, Nikolaus, Eric von Hippel, and Martin Schreier (2005) “Finding commercially attractive user innovations: An exploration and test of “lead user” theory,” Journal of Product Innovation Management, forthcoming. Freeman, C. (1968). “Chemical Process Plant: Innovation and the World Market.” National Institute Economic Review 45(August): 29-57. Freiberger, Paul and Michael Swaine (1999) Fire in the Valley: The Making of the Personal Computer, 2nd Ed., McGraw Hill, New York, NY. Henkel, Joachim (2005) “The Jukebox Model of Innovation,” CEPR Discussion Paper 4507, http://www.tim.wi.tum.de/paper/Henkel_Jukebox_2005.pdf , viewed 2/27/06. Henkel, Joachim (forthcoming), “Selective Revealing in Open Innovation Processes: The Case of Embedded Linux,” Research Policy. Available at http://www.tim.wi.tum.de/paper/Henkel_Selective_revealing_2005.pdf (viewed 2/27/06). Herstatt, Cornelius and Eric von Hippel (1992). “From Experience: Developing New Product Concepts Via the Lead User Method: A Case Study in a "Low Tech" Field.” Journal of Product Innovation Management 9(3): 213-222. Herzig, Daniel: personal interview with C. Hienerth, 20/05/2003, Graz, Austria. Hienerth, Christoph (2004). “The Commercialization of User Innovations: Sixteen Cases in an Extreme Sporting Industry,” in Proceedings of the 26th R&D Management Conference, Sesimbra, Portugal. Jackson, Eric: personal interview with C. Hienerth, 24/05/2003, Graz, Austria. Telephone interviews with C. Hienerth, 29/10/2004, 04/04/2005. Jacobides, Michael G. and Sidney G. Winter (forthcoming) "Co-evolution of Capability and Transaction Costs: Explaining the Institutional Structure of Production," Strategic Management Journal. Klepper, Steven (1996) “Entry, Exit, Growth and Innovation over the Product Life Cycle, American Economic Review, 86(30):562-583.

26
Kruger, Celliers: personal interview with C. Hienerth, 23/05/2003, Graz, Austria. Langer, Nico: personal interview with C. Hienerth, 25/05/2003, Graz, Austria. Larsson, Lars: personal interview with C. Hienerth, 21/05/2003, Graz, Austria. Lettl, Christoper, C. Herstatt and H. Gemünden (2004). “The Entrepreneurial Role of Innovative Users: Evidence from Radical Innovations in the Field of Medical Technology.” Technical University Berlin. Working Paper. Levinthal, Daniel A. (1997) "Adaptation on Rugged Landscapes" Management Science, 43: 934-950. Linyado, Kennedy: personal interview with C. Hienerth, 21/05/2003, Graz, Austria. Loch, Christoph H., Christian Terwiesch and Stefan Thomke (2001) “Parallel and Sequential Testing of Design Alternatives,” Management Science, 45(5):663-678. Lüthje, C. (2003). “Customers as Co-Inventors: An Empirical Analysis of the Antecedents of Customer-Driven Innovations in the Field of Medical Equipment.” Proceedings from the 32th EMAC Conference 2003, Glasgow. Lüthje, C. (2004). “Characteristics of Innovating Users in a Consumer Goods Field: An Empirical Study of Sport-Related Product Consumers.” Technovation, (September). Lüthje, Christian, Cornelius Herstatt and Eric von Hippel (2005), “User-innovators and “local” information: The case of mountain biking,” Research Policy, Vol 34, No. 6 (August) pp. 951-965. Martinsen, Erik: personal interview with C. Hienerth, 22/05/2003, Graz, Austria. Merton, Robert C. (1990) Continuous-Time Finance, Cambridge, MA: Basil Blackwell. Merton, Robert C. (1998) “Applications of Option-Pricing Theory: Twenty-Five Years Later,” Nobel Lecture published in American Economic Review 88(3):323-349. Morrison, P. D., J. H. Roberts and E. von Hippel (2000). “Determinants of User Innovation and Innovation Sharing in a Local Market.” Management Science 46(12): 1513-1527. Murmann, Johann Peter and Koen Frenken (2005) "Toward a Systematic Framework for Research on Dominant Designs, Technological Innovations, and Industrial Change" Northwestern University Working Paper (January 8, 2005) http://papers.ssrn.com/sol3/papers.cfm?abstract_id=737063, viewed 8/28/05. Mutton, Ken: personal interview with C. Hienerth, 23/05/2003, Graz, Austria. Nelson, Richard R. and Sidney G. Winter (1977) “In Search of a Useful Theory of Innovation,” Research Policy, 6(1): 36-76. Michael Neumann (2001) “Der Mann hinter der Marke (The Man Behind the Brand, the story of Horst Fuersattel, founder of HF kayak gear),” Paddelmagazin, Issue No. 4.
Nuvolari, A. (2004). “Collective Invention during the British Industrial Revolution: The Case of the Cornish Pumping Engine.” Cambridge Journal of Economics 28(3): 347-363.
Olson, E. L. and G. Bakke (2001). “Implementing the Lead User Method in a High Technology Firm: A Longitudinal Study of Intentions versus Actions.” Journal of Product Innovation Management 18(2): 388-395. Outdoor Industry Association (2004) Outdoor Recreation Participation Study for the United States, Outdoor Industry Association, Boulder, CO p. 213.
Pavitt, K. (1984). “Sectoral Patterns of Technical Change: Towards a Taxonomy and a Theory.” Research Policy 13(6): 343-373. Pine, J. B. II. (1993). Mass Customization: The New Frontier in Business Competition. Boston, MA: Harvard Business School Press. Raymond, Eric S. (1999) The Cathedral and the Bazaar, O’Reilly & Associates, Inc., Sebastopol, CA. Rivkin, Jan W. (2000) “Imitation of Complex Strategies” Management Science 46:824-844.
27
Schaeftlein, Arnd: personal interview with C. Hienerth, 24/05/2003, Graz, Austria. Schauff, Schorschi: personal interview with C. Hienerth, 22/05/2003, Graz, Austria. Schlott, Ingrid: telephone interview with C. Hienerth, 24/04/2005. Shah, Sonali K. (2000) “Sources and Patterns of Innovation in a Consumer Products Field: Innovations in Sporting Equipment.” MIT Sloan School of Management Working Paper # 4105, Cambridge, MA. Shah, Sonali K. (2003). “Community-Based Innovation & Product Development: Findings From Open Source Software and Consumer Sporting Goods,” unpublished Ph.D thesis, Sloan School of Management, Massachusetts Institute of Technology, Cambridge, MA. Shah, Sonali K. (2005) “Open Beyond Software,” Open Sources 2, (eds. Chris Dibona, Danese Cooper and Mark Stone) O’Reilly Media, Sebastopol, CA. Shah, Sonali and Mary Tripsas (2004) “When Do User-Innovators Start Firms? Towards A Theory of User Entrepreneurship” University of Illinois Working Paper #04-0106, Champaign, IL. Shaw, Mary and David Garlan (1996) Software Architecture: An Emerging Discipline, Upper Saddle River, NJ: Prentice-Hall. Simon, Herbert A. (1981). The Sciences of the Artificial, 2nd Ed., MIT Press, Cambridge, MA. Snyder, Jimi (2005) (A famous squirt boat kayaker) telephone interview with C. Hienerth, 14/04/2005. Sommer, Robert: telephone interview with C. Hienerth, 30/10/2004. Steffel, Stefan: personal interview with C. Hienerth, 20/05/2003, Graz, Austria. Telephone interview with C. Hienerth, 29/08/2004. Strohmeier, Seppi: personal interview with C. Hienerth, 25/05/2003, Graz, Austria. Sutton, John (1991) Sunk Costs and Market Structure: Price Competition, Advertising and the Evolution of Concentration, Cambridge, MA: MIT Press. Taft, Susan L. (2001) The River Chasers, Flowing Water Press and Alpen Books Press, Mukilteo, WA. Taft, Sue: telephone interview with C. Hienerth, 05/04/2005. Tirole, Jean (1988) The Theory of Industrial Organization, MIT Press, Cambridge, MA. Urban, G. L. and E. von Hippel (1988). “Lead User Analyses for the Development of New Industrial Products.” Management Science 34(5): 569-82. Utterback, J. M. and W. J. Abernathy (1975). “A Dynamic Model of Process and Product Innovation.” Omega – The International Journal of Management Science 3(6): 639-656. von Hippel, Eric (1988). The Sources of Innovation, Oxford: Oxford University Press. von Hippel, Eric (2005). Democratizing Innovation, Cambridge, MA: MIT Press. von Hippel, Eric and Stan N. Finkelstein (1979), "Analysis of Innovation in Automated Clinical Chemistry Analyzers," Science & Public Policy 6 (1):24-37. Williamson, Oliver E. (1985). The Economic Institutions of Capitalism, Free Press, New York, NY. Vasilash, Gary S. (2005) “Unconventional Innovation,” Automotive Design and Production (August)

28
Appendix 1 The expected interarrival time between successful new designs
Proposition. The expected interarrival time between successful new designs, denoted T , is increasing in a , the quality of the best pre-existing design, and decreasing in k , the number of independent design searches.
Proof. Let p a Pr(X a ) , that is, the probability that a given search will fail to uncover a design better than the best pre-existing design. Note that p a increases with a : the better the pre-existing standard, the higher the probability that it will not be bested.
The expected interarrival time of the next successful design is then:
T( a , k) = t [p a
k(t 1)
t=1
(1 p a k )] .
This expression is an expectation, a sum of outcomes weighted by probabilities [in brackets]. The probabilities refer to the event that (1) no experiment has produced a successful design for t 1 periods and (2) one (or more) experiments produces a successful design in period t . Naturally the probability weights sum to one.
Call the bracketed expression P (for probability weight). The partial derivative of P with respect to a is:
P a = kp a
k(t 1) t(p k 1) p k[ ]dp a
d a .
The first term is postive, and we have said that dp a /d a is positive. The term in brackets is negative for small t , and positive (and increasing in t ) for large t . Thus increasing a has the effect of decreasing the probability weights on small ts (short interarrival times) and increasing the weights on large ts (long interarrival times). As a result, holding k fixed, T( a , k) grows as a increases.
Following the same logic, the partial derivative of P with respect to k is:
Pk
= p a kt ln p a t(p k 1) p k[ ] .
Because p a < 1 , ln p a < 0 , and the first term is negative. The term in brackets is the same as in the previous expression: it is negative for small t , and positive (and increasing in t ) for large t . Thus increasing k has the effect of increasing the probability weights on short interarrival times and decreasing the weights on long interarrival times. Holding a fixed, T( a , k) becomes shorter as k increases. QED.

29
Appendix 2 Demand functions for Firms 1 and 2 and the Bertrand-Nash equilibrium
Demand for good 1 Proposition 1. In a shared market equilibrium, Firm 1’s demand function is:
D1(p1, p2 ) =
(a1 a2 ) (p1 p2 )u1 u2
(11a)
Proof. The consumer surpluses of good 1 and good 2 at a given point, N , are equal if:
a1 u1N p1 = a2 u2N p2 . This equation has a unique solution, denoted N * :
N * =
(a1 a2 ) (p1 p2 )u1 u2
For N < N * , good 1, which has the steeper (negative) slope, will be preferred. For N > N * , good 2 will be preferred. As long as N* > 0 , users for whom N (0,N*) will purchase good 1. Thus
D1(p1, p2 ) = N * . QED Demand for good 2 Proposition 2. Firm 2’s demand function is:
D2 (p1, p2 ) =
a2 p2u2
(a1 a2 ) (p1 p2 )u1 u2
. (11b)
Proof. By the argument in Proposition 1, users for whom N < N * will purchase good 1
and those for whom N > N * will purchase good 2 or nothing. Setting the consumer surplus of good 2 equal to zero and solving for the point of indifference, we have:
N * * =
a2 p2u2
.
As long as N* < N * * , users for whom N (N*,N * *) will purchase good 2. Thus
D2 (p1, p2 ) = N * * N * . QED Bertrand-Nash Equilibrium
Substituting the demand functions and their partial derivatives into the first order conditions (equation 10 in the text), we obtain:
FOC 1 : 1
p1=
(a1 a2 ) (p1 p2 )u1 u2
+ (p1 c1)1
(u1 u2 )= 0 ;
FOC 2 : 2
p2=
a2 p2u2
(a1 a2 ) (p1 p2 )u1 u2
(p2 c2 )1
u2
1u1 u2
= 0 .
This is a linear system of two equations in two unknowns ( p1 and p2 ), thus it has a
unique solution (unless the two equations are linearly dependent, which they are not in our case). In FOC 1,the signs of all terms containing p1are negative. In FOC 2, the signs of all terms
containing p2 are negative. Thus 2
i / pi2
< 0 , and the solution is a Nash equilibrium.