how well is chronic heart failure being managed?
DESCRIPTION
How Well is Chronic Heart Failure Being Managed?. Gregg C. Fonarow, MD Eliot Corday Professor of Cardiovascular Medicine and Science UCLA Division of Cardiology Director, Ahmanson-UCLA Cardiomyopathy Center Director, UCLA Cardiology Fellowship Training Program Los Angeles, California. - PowerPoint PPT PresentationTRANSCRIPT
How Well is Chronic Heart Failure Being Managed?
Gregg C. Fonarow, MDEliot Corday Professor of
Cardiovascular Medicine and ScienceUCLA Division of Cardiology
Director, Ahmanson-UCLA Cardiomyopathy CenterDirector, UCLA Cardiology
Fellowship Training ProgramLos Angeles, California
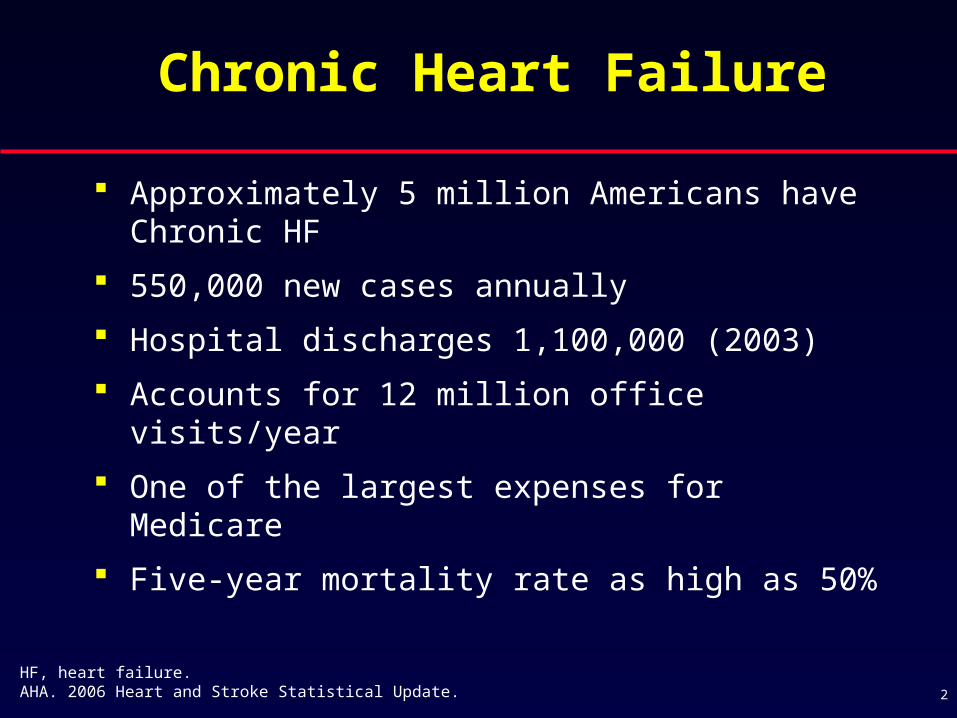
HF, heart failure.AHA. 2006 Heart and Stroke Statistical Update. 2
Chronic Heart Failure
Approximately 5 million Americans have Chronic HF
550,000 new cases annually
Hospital discharges 1,100,000 (2003)
Accounts for 12 million office visits/year
One of the largest expenses for Medicare
Five-year mortality rate as high as 50%
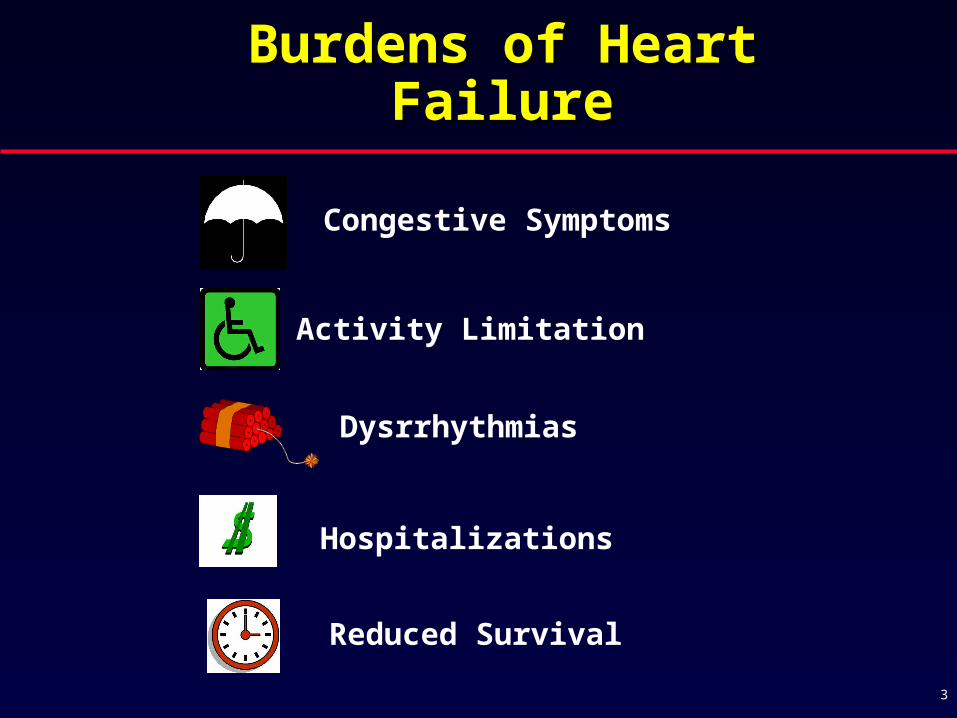
Burdens of Heart FailureBurdens of Heart Failure
Congestive Symptoms
Activity Limitation
Dysrrhythmias
Reduced Survival
Hospitalizations
3
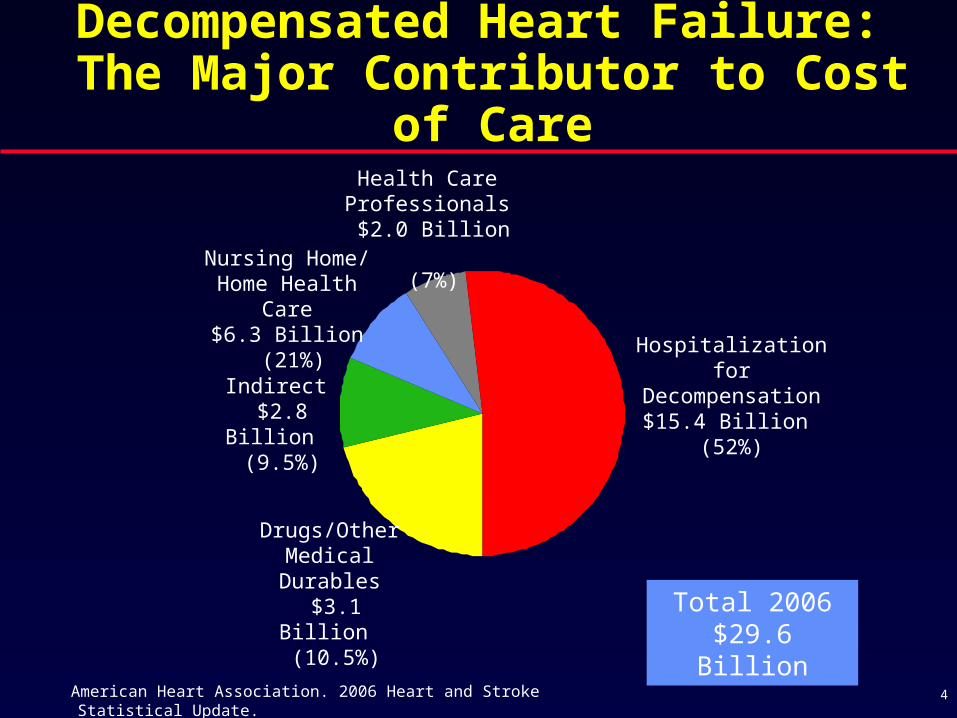
Decompensated Heart Failure: The Major Contributor to Cost of Care
Hospitalization for Decompensation
$15.4 Billion (52%)
Drugs/Other Medical Durables
$3.1 Billion (10.5%)
Indirect $2.8 Billion
(9.5%)
Nursing Home/ Home Health Care
$6.3 Billion (21%)
Health CareProfessionals $2.0 Billion
(7%)
Total 2006$29.6 Billion
American Heart Association. 2006 Heart and Stroke Statistical Update. 4

Heart Failure Hospitalizations
0
100,000
200,000
300,000
400,000
500,000
600,000
'79 '81 '83 '85 '87 '89 '91 '93 '95 '97 ‘9920
01
Dis
ch
arg
es
Women
Men
AHA, 1998 Heart and Stroke Statistical Update.NCHS, National Center for Health Statistics.AHA, Heart Disease and Stroke Statistics -- 2005 Update.
The number of heart failure hospitalizations is increasing in both men and women
CDC/NCHS: Hospital discharges include patients both living and dead.
5
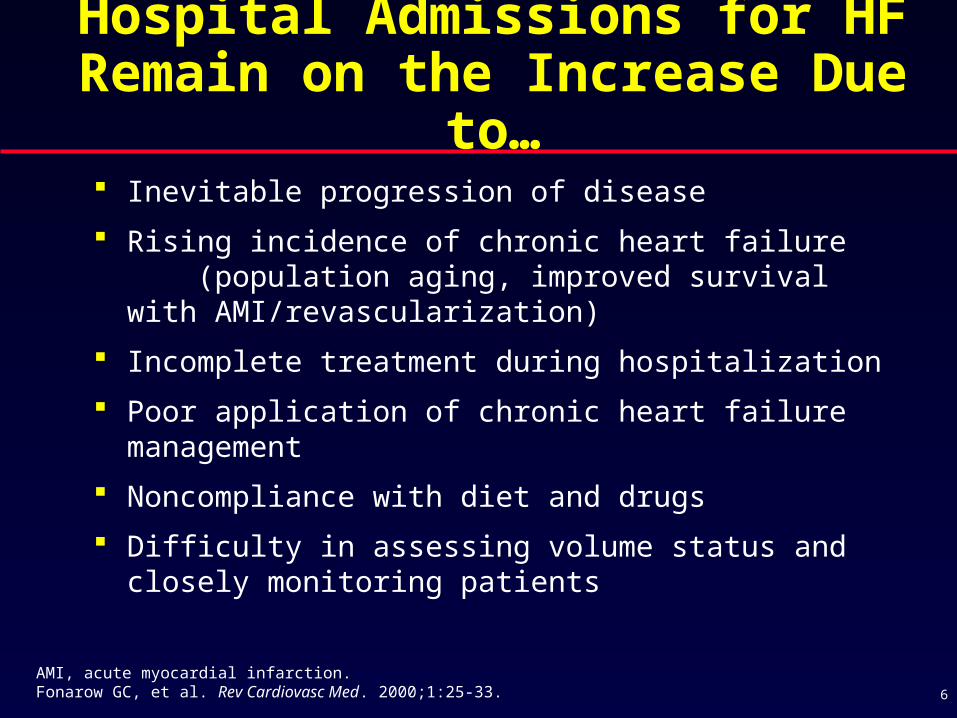
AMI, acute myocardial infarction.Fonarow GC, et al. Rev Cardiovasc Med. 2000;1:25-33.
Hospital Admissions for HF Remain on the Increase Due to…
Inevitable progression of disease
Rising incidence of chronic heart failure (population aging, improved survival with AMI/revascularization)
Incomplete treatment during hospitalization
Poor application of chronic heart failure management
Noncompliance with diet and drugs
Difficulty in assessing volume status and closely monitoring patients
6
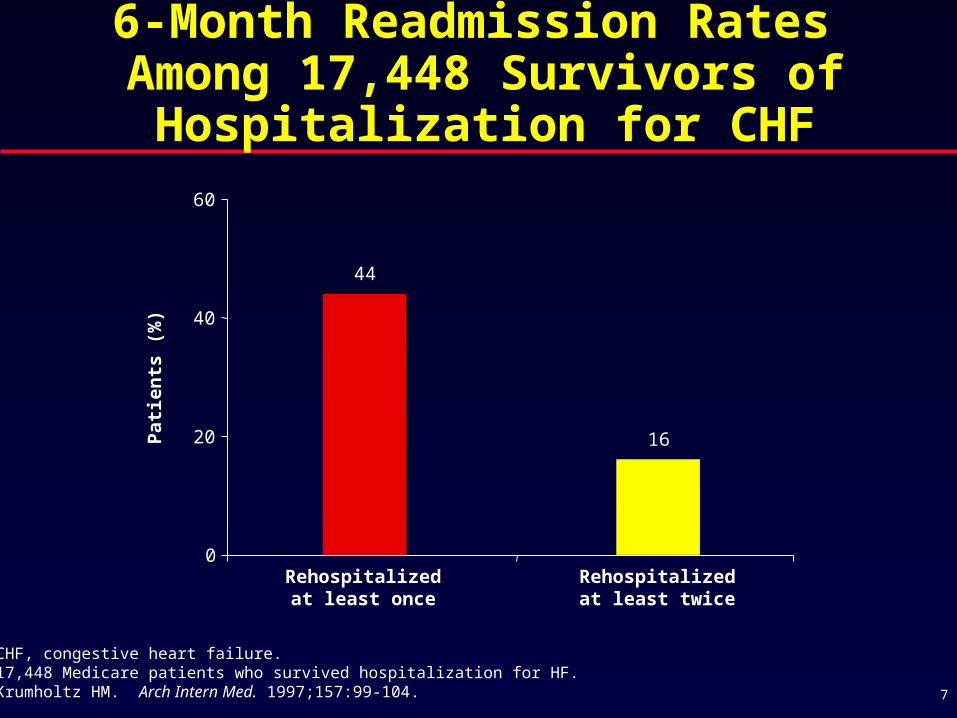
6-Month Readmission Rates Among 17,448 Survivors of
Hospitalization for CHF
CHF, congestive heart failure.17,448 Medicare patients who survived hospitalization for HF.Krumholtz HM. Arch Intern Med. 1997;157:99-104.
Rehospitalizedat least once
Rehospitalizedat least twice
0
20
40
60
Pat
ien
ts (
%)
16
44
7
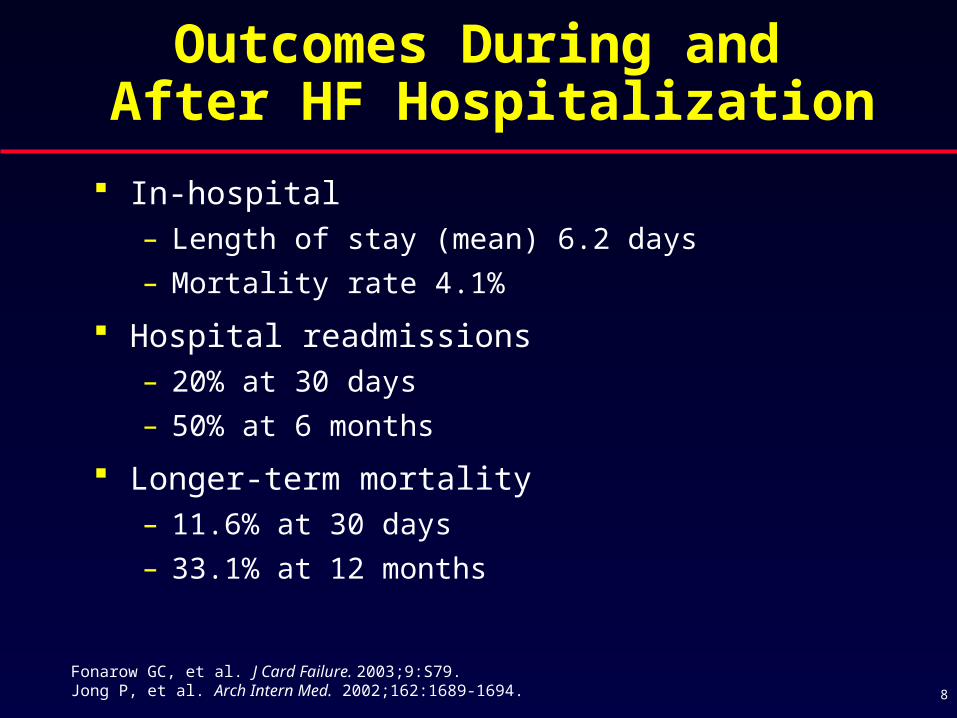
Fonarow GC, et al. J Card Failure. 2003;9:S79. Jong P, et al. Arch Intern Med. 2002;162:1689-1694.
Outcomes During and After HF Hospitalization
In-hospital– Length of stay (mean) 6.2 days
– Mortality rate 4.1%
Hospital readmissions– 20% at 30 days
– 50% at 6 months
Longer-term mortality– 11.6% at 30 days
– 33.1% at 12 months
8
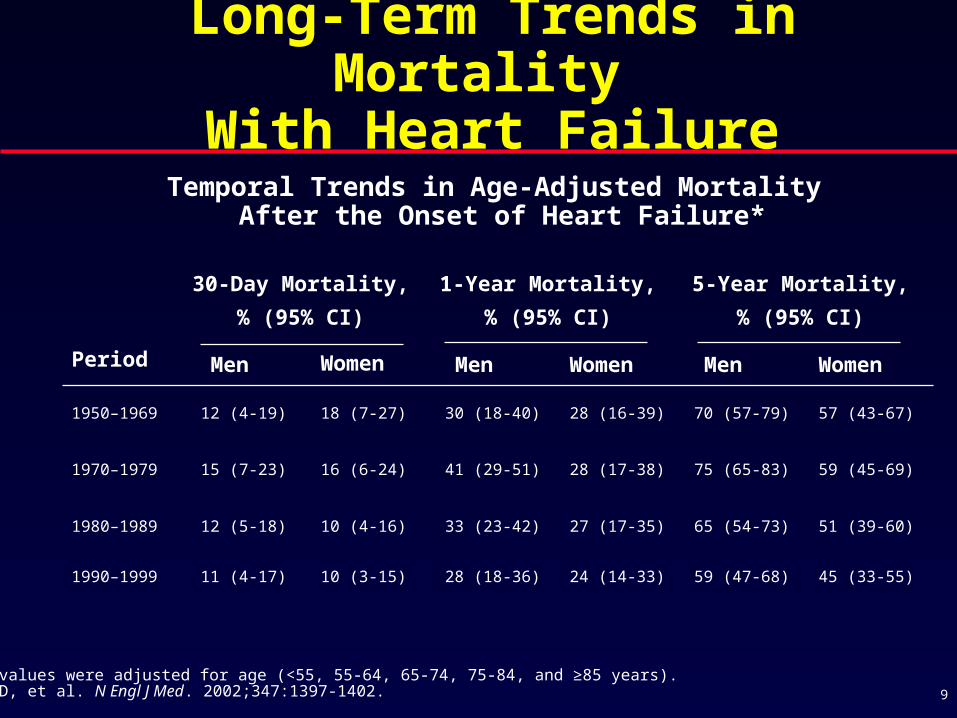
45 (33-55)59 (47-68)24 (14-33)28 (18-36)10 (3-15)11 (4-17)1990–1999
51 (39-60)65 (54-73)27 (17-35)33 (23-42)10 (4-16)12 (5-18)1980–1989
59 (45-69)75 (65-83)28 (17-38)41 (29-51)16 (6-24)15 (7-23)1970–1979
57 (43-67)70 (57-79)28 (16-39)30 (18-40)18 (7-27)12 (4-19)1950–1969
WomenMenWomenMen WomenMenPeriod
5-Year Mortality,
% (95% CI)
1-Year Mortality,
% (95% CI)
30-Day Mortality,
% (95% CI)
Temporal Trends in Age-Adjusted Mortality After the Onset of Heart Failure*
*All values were adjusted for age (<55, 55-64, 65-74, 75-84, and ≥85 years).Levy D, et al. N Engl J Med. 2002;347:1397-1402.
Long-Term Trends in Mortality With Heart Failure
9
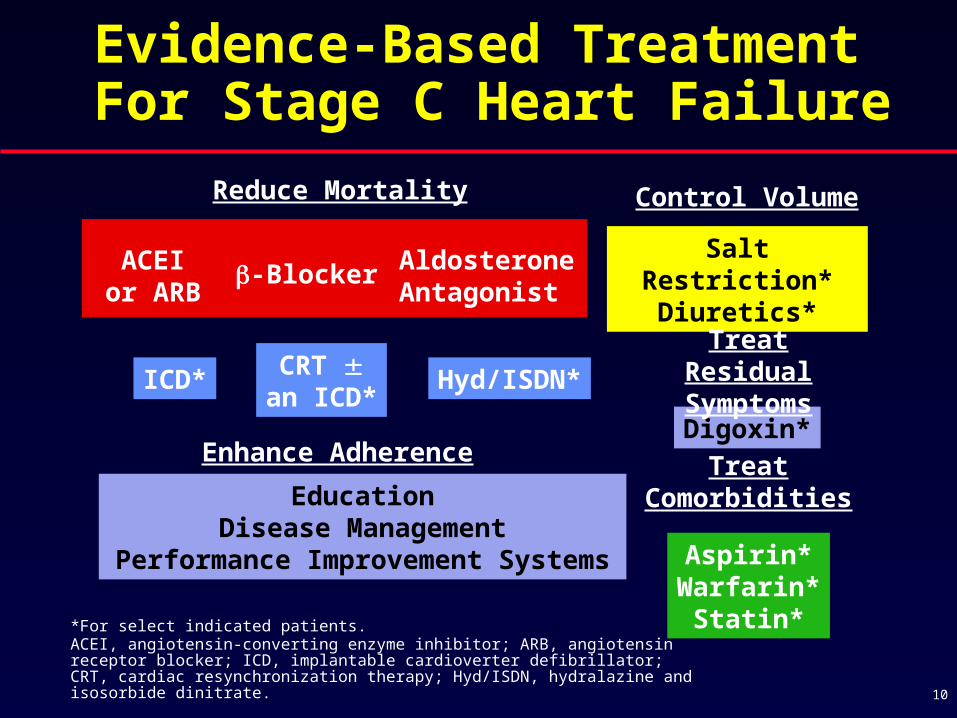
*For select indicated patients. ACEI, angiotensin-converting enzyme inhibitor; ARB, angiotensin receptor blocker; ICD, implantable cardioverter defibrillator; CRT, cardiac resynchronization therapy; Hyd/ISDN, hydralazine and isosorbide dinitrate.
Control VolumeReduce Mortality
Salt Restriction*Diuretics*
Digoxin*
-BlockerACEIor ARB
AldosteroneAntagonist
Treat Residual SymptomsCRT
an ICD*Hyd/ISDN*ICD*
Treat Comorbidities
Aspirin*Warfarin*
Statin*
Enhance Adherence
EducationDisease Management
Performance Improvement Systems
Evidence-Based Treatment For Stage C Heart Failure
10
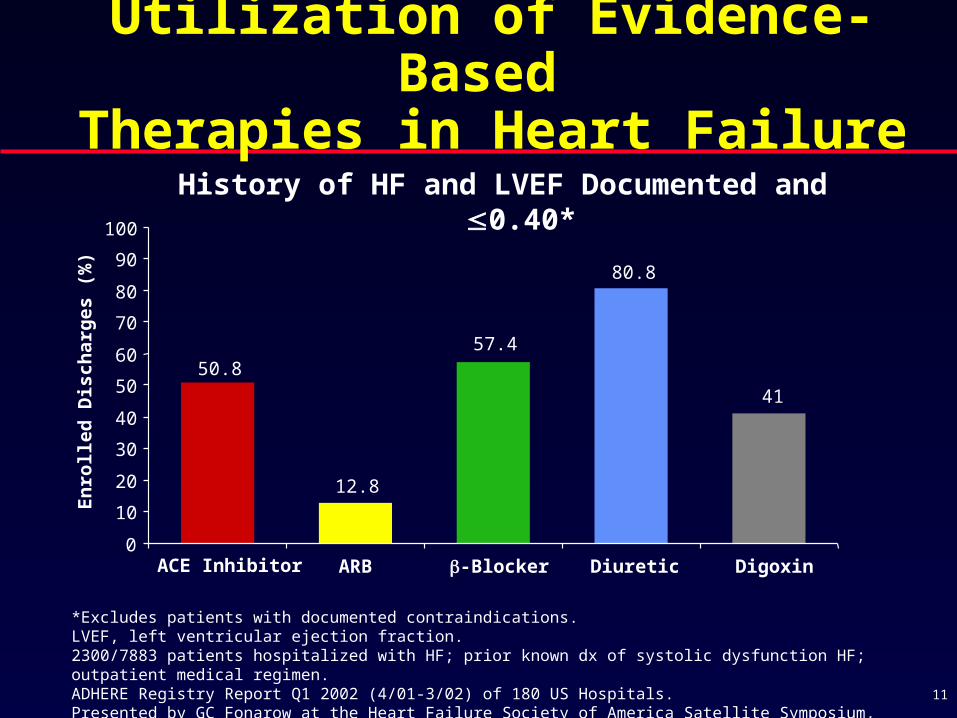
*Excludes patients with documented contraindications.LVEF, left ventricular ejection fraction.2300/7883 patients hospitalized with HF; prior known dx of systolic dysfunction HF; outpatient medical regimen.ADHERE Registry Report Q1 2002 (4/01-3/02) of 180 US Hospitals.Presented by GC Fonarow at the Heart Failure Society of America Satellite Symposium, September 23, 2002.
50.8
12.8
57.4
80.8
41
0
10
20
30
40
50
60
70
80
90
100
En
roll
ed
Dis
ch
arg
es (
%)
ACE Inhibitor ARB -Blocker Diuretic Digoxin
History of HF and LVEF Documented and 0.40*
Utilization of Evidence-Based Therapies in Heart Failure
11
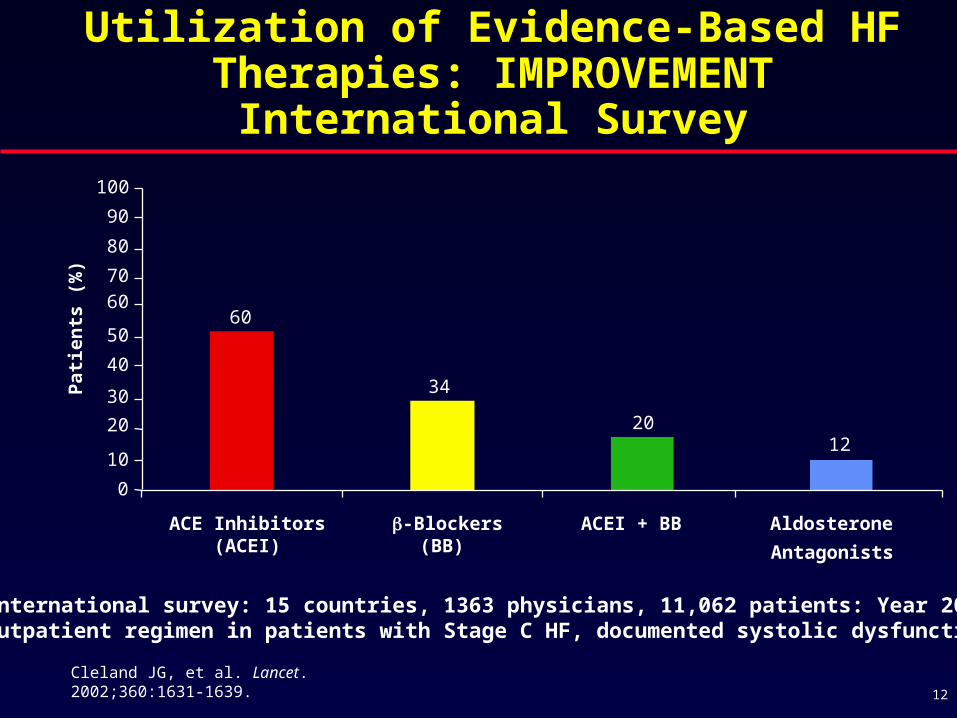
60
34
2012
0
10
20
30
40
50
60
70
80
90
100
ACE Inhibitors(ACEI)
-Blockers(BB)
ACEI + BB Aldosterone
Antagonists
Pat
ien
ts (
%)
Cleland JG, et al. Lancet. 2002;360:1631-1639.
International survey: 15 countries, 1363 physicians, 11,062 patients: Year 2000.Outpatient regimen in patients with Stage C HF, documented systolic dysfunction.
Utilization of Evidence-Based HF Therapies: IMPROVEMENT International
Survey
12
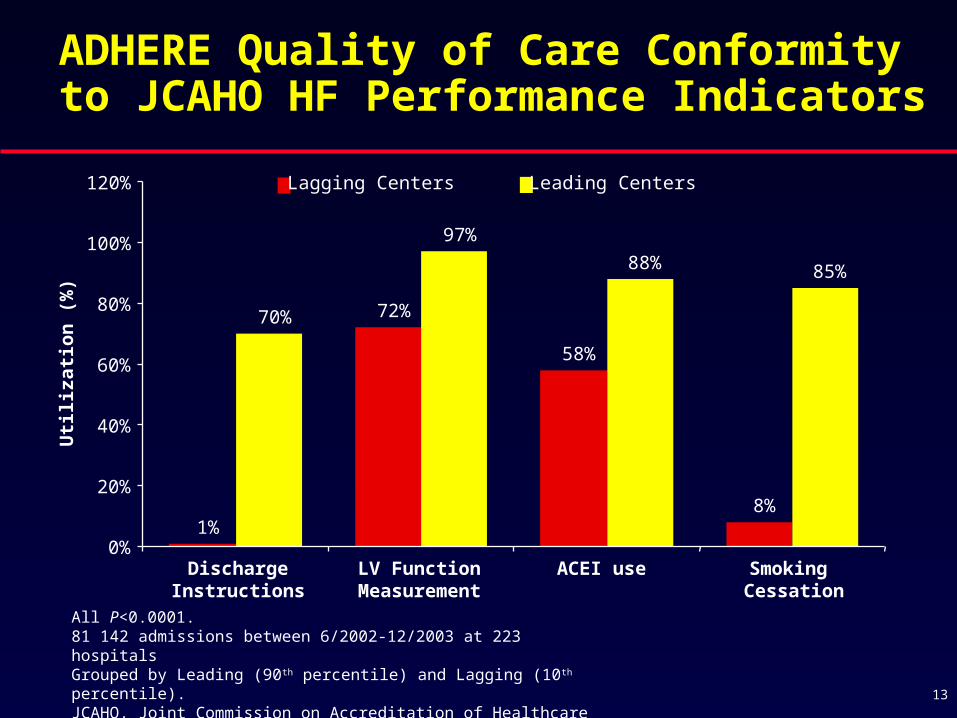
All P<0.0001.81 142 admissions between 6/2002-12/2003 at 223 hospitalsGrouped by Leading (90th percentile) and Lagging (10th percentile).JCAHO, Joint Commission on Accreditation of Healthcare Organizations.Fonarow GC, et al. Arch Intern Med. 2005;165:1469-1477.
1%
72%
58%
8%
70%
97%
88% 85%
0%
20%
40%
60%
80%
100%
120% Lagging Centers Leading Centers
DischargeInstructions
LV FunctionMeasurement
ACEI use Smoking Cessation
Uti
liza
tio
n (
%)
ADHERE Quality of Care Conformity to JCAHO HF Performance Indicators
13

“Failure” of Usual Care in Heart Failure
Failure to prescribe evidence-based medications
Failure to discontinue medication that may exacerbate HF
Failure to titrate medications to target doses
Failure to adequately address co-morbidities
Failure to adhere to prescribed medications
Failure to comply with dietary regimen
Failure to adequately assess congestion
Failure to seek early care with escalating symptoms
Failure of adequate discharge planning
Failure of adequate follow-up
Failure of adequate monitoring
Failure of patient social support systems
Failure to address patient and caregiver needs
14
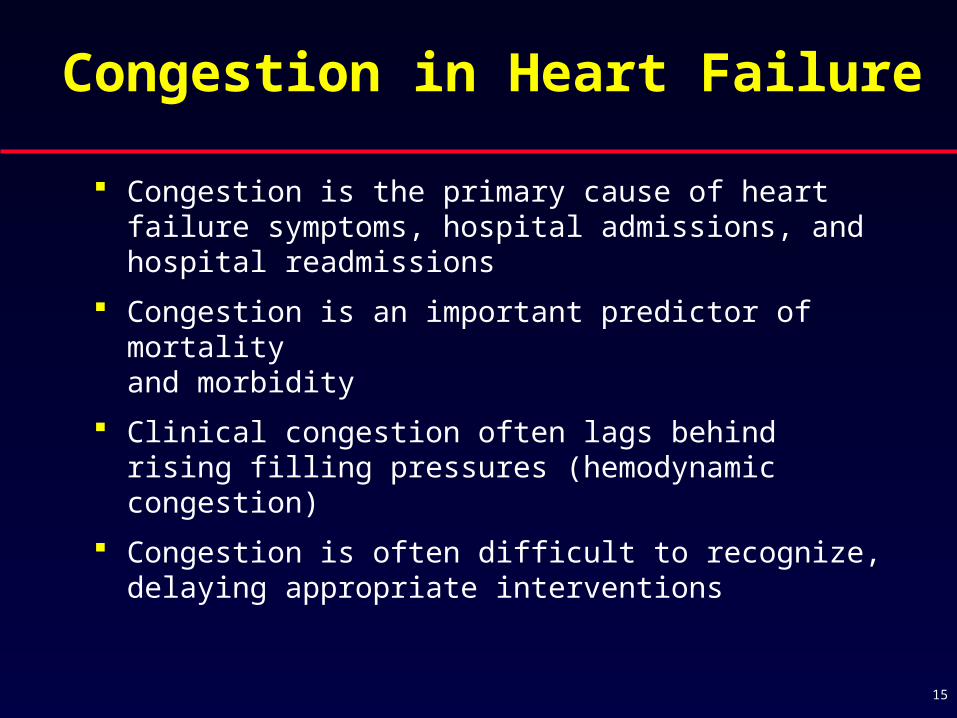
Congestion in Heart Failure
Congestion is the primary cause of heart failure symptoms, hospital admissions, and hospital readmissions
Congestion is an important predictor of mortality and morbidity
Clinical congestion often lags behind rising filling pressures (hemodynamic congestion)
Congestion is often difficult to recognize, delaying appropriate interventions
15

Any dyspnea (%) 89
Dyspnea at rest (%) 34
Fatigue (%) 32
Rales (%) 68
Peripheral edema (%) 66
Pulmonary congestion (%) 75
SBP <90 mm Hg (%) 2
ADHERE, Acute Decompensated Heart Failure National Registry.Adapted from Fonarow GC. Rev Cardiovasc Med. 2003;4(Suppl 7):S21-S30.
150,000 Hospitalization Episodes in ADHERE
Clinical Presentation of Patients Hospitalized with Heart Failure
16

PCWP, pulmonary capillary wedge pressure; CI, cardiac index; CXR, chest X-ray; JVP, jugular venous pressure.1. Mahdyoon H, et al. Am J Card. 2003;63:625-627.2. Stevenson LW, et al. JAMA. 1989;261:884-888.
Congestion Often Does not Translate into Signs/Symptoms
Among patients with severe heart failure1
– PCWP 33 ± 6 mm Hg, CI 1.8 ± 0.5, LVEF 0.18 ± 0.06
– CXR: 27% no congestion, 41% minimal congestion
Among patients with moderate to severe heart failure2
– PCWP 30 ± 9 mm Hg, CI 2.1 ± 0.8, LVEF 0.18 ± 0.06
– No rales: 84%, No edema: 80%, No JVP 50%, No orthopnea: 22%
Hemodynamic congestion may not be recognized clinically (doesn’t translate into symptoms/signs until late)
17
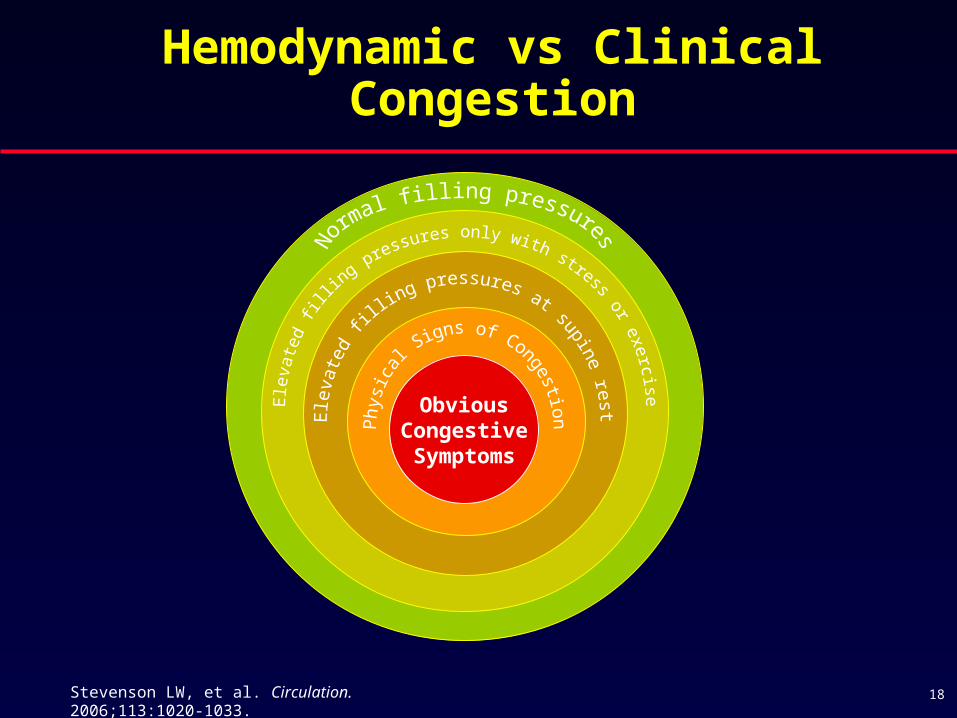
Hemodynamic vs Clinical Congestion
Stevenson LW, et al. Circulation. 2006;113:1020-1033. 18
ObviousCongestiveSymptoms

RV, right ventricular; PA, pulmonary artery.
Adamson PB, et al. J Am Coll Cardiol. 2003;41:565-571.
Congestion Precedes Hospitalization
Pressure Change Hospitalization
Days Relative to the Event
Baseline -7 -6 -5 -4 -3 -2 -1 Recovery
Ch
ang
e (
%)
-10
0
10
20
30
40
RV Systolic Pressure
Estimated PA Diastolic Pressure
Heart Rate
19

1. Mahdyoon H, et al. Am J Card. 1989;63:625-627.2. Stevenson LW, et al. JAMA. 1989;261:884-888.
Importance of Recognizing Congestion
In chronic heart failure, LV filling pressures(even severe) infrequently cause rales and acute pulmonary edema1,2
Recognizing hemodynamic congestion is challenging
Identifying congestion early will lead to early treatment, and possibly prevent progression of heart failure and hospitalizations
20
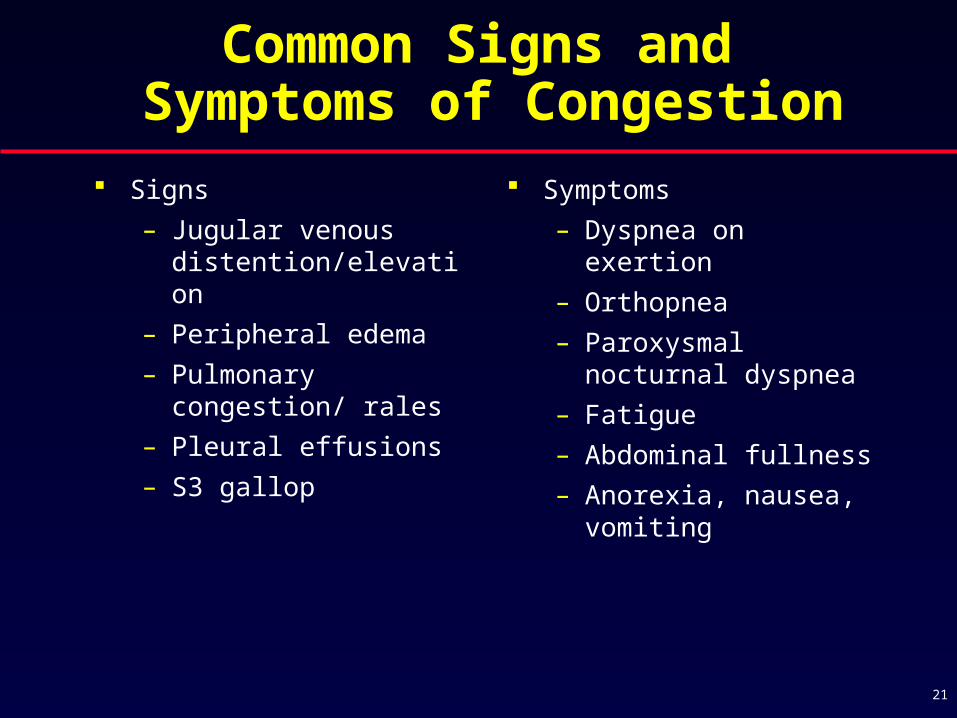
Common Signs and Symptoms of Congestion
Signs
– Jugular venous distention/elevation
– Peripheral edema
– Pulmonary congestion/ rales
– Pleural effusions
– S3 gallop
Symptoms
– Dyspnea on exertion
– Orthopnea
– Paroxysmal nocturnal dyspnea
– Fatigue
– Abdominal fullness
– Anorexia, nausea, vomiting
21
22
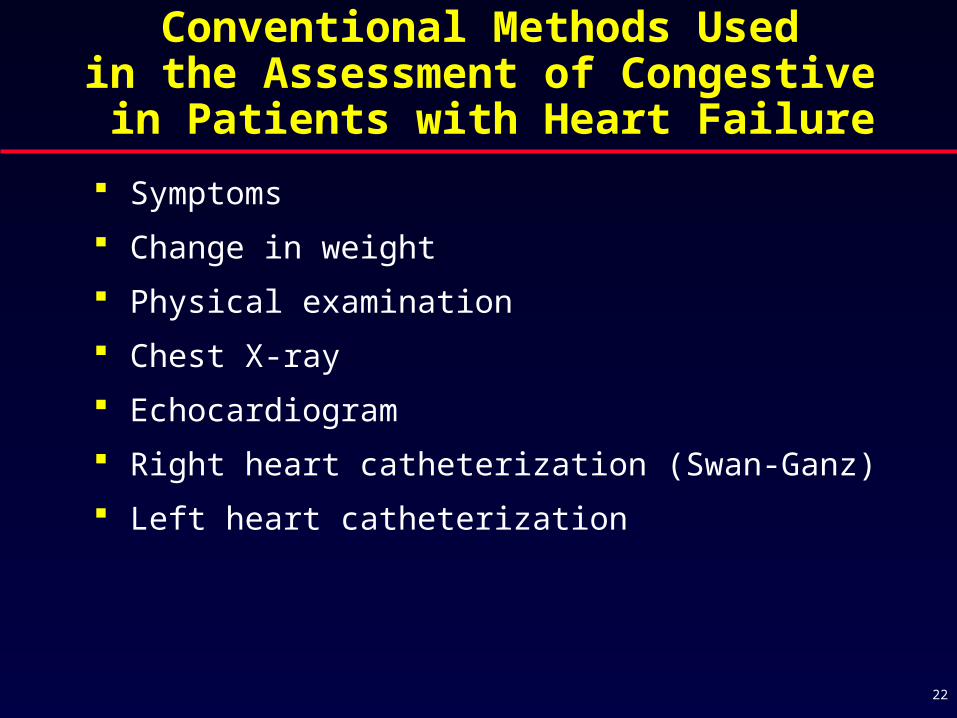
Conventional Methods Used in the Assessment of Congestive
in Patients with Heart Failure
Symptoms
Change in weight
Physical examination
Chest X-ray
Echocardiogram
Right heart catheterization (Swan-Ganz)
Left heart catheterization

The Challenge of DiagnosingHeart Failure: Physical Examination
JVP on Physical Exam
– Great if well seen
– In OPTIMIZE-HF and ADHERE, in the majority of hospitalized HF patients, initial exammissed it
– Obesity epidemic: good luck
S3 on physical exam
– Great if heard
– Missed 4/5 times
OPTIMIZE-HF, Organized Program to Initiate Life-Saving Treatment in Hospitalized Patients with Heart Failure. 23
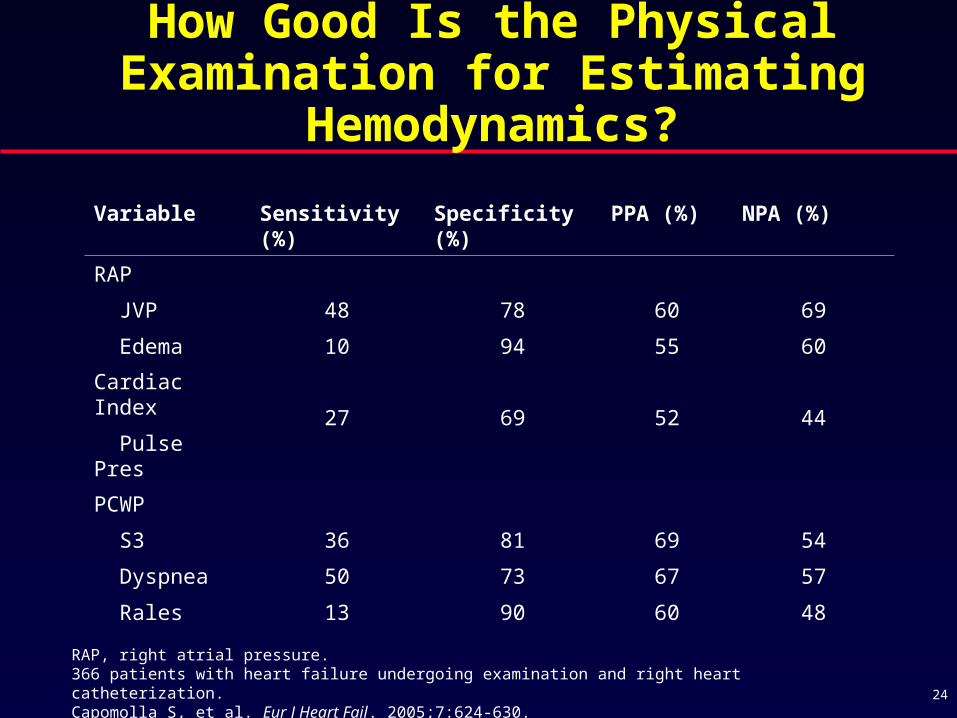
How Good Is the Physical Examination for Estimating Hemodynamics?
RAP, right atrial pressure.366 patients with heart failure undergoing examination and right heart catheterization.Capomolla S, et al. Eur J Heart Fail. 2005;7:624-630.
Variable Sensitivity (%) Specificity (%) PPA (%) NPA (%)
RAP
JVP
Edema
48
10
78
94
60
55
69
60
Cardiac Index
Pulse Pres 27 69 52 44
PCWP
S3
Dyspnea
Rales
36
50
13
81
73
90
69
67
60
54
57
48
24
Stevenson LW, et al. JAMA. 1989;261:884-888. 25
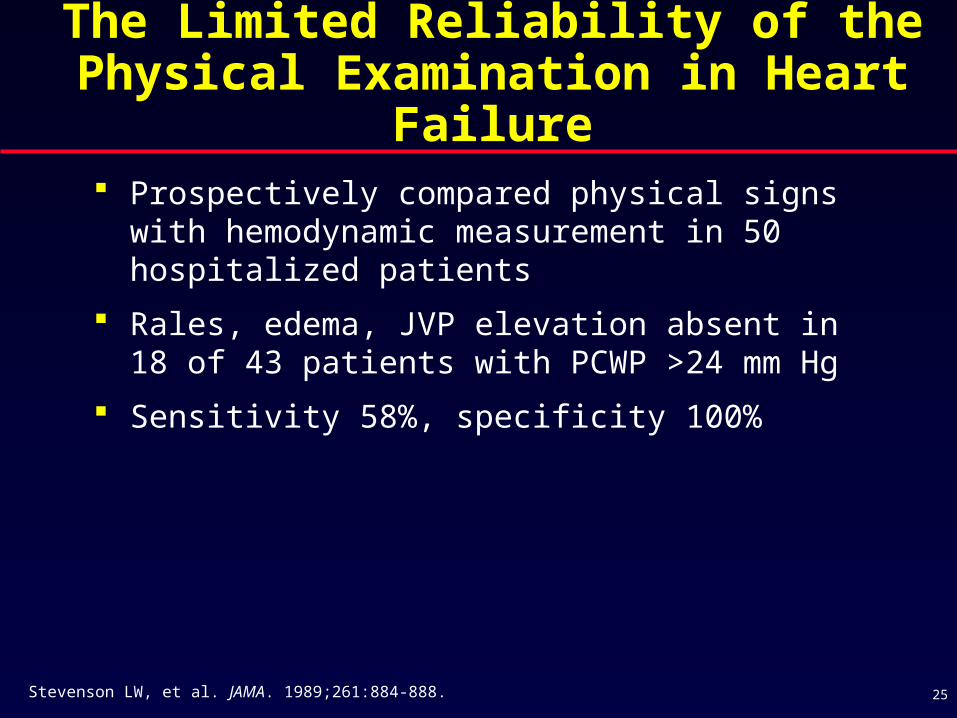
The Limited Reliability of the Physical Examination in Heart Failure
Prospectively compared physical signs with hemodynamic measurement in 50 hospitalized patients
Rales, edema, JVP elevation absent in 18 of 43 patients with PCWP >24 mm Hg
Sensitivity 58%, specificity 100%

LVEDP, left ventricular end-diastolic pressure.Marcus GM, et al. JAMA. 2005;293:2238-2244.
Phonocardiographic Analysis of S3 and S4 in Patients Undergoing Catheterization
Heart sound Elevated LVEDP
S3 sensitivity (%) 41
S4 sensitivity (%) 46
S3 specificity (%) 92
S4 specificity (%) 80
26
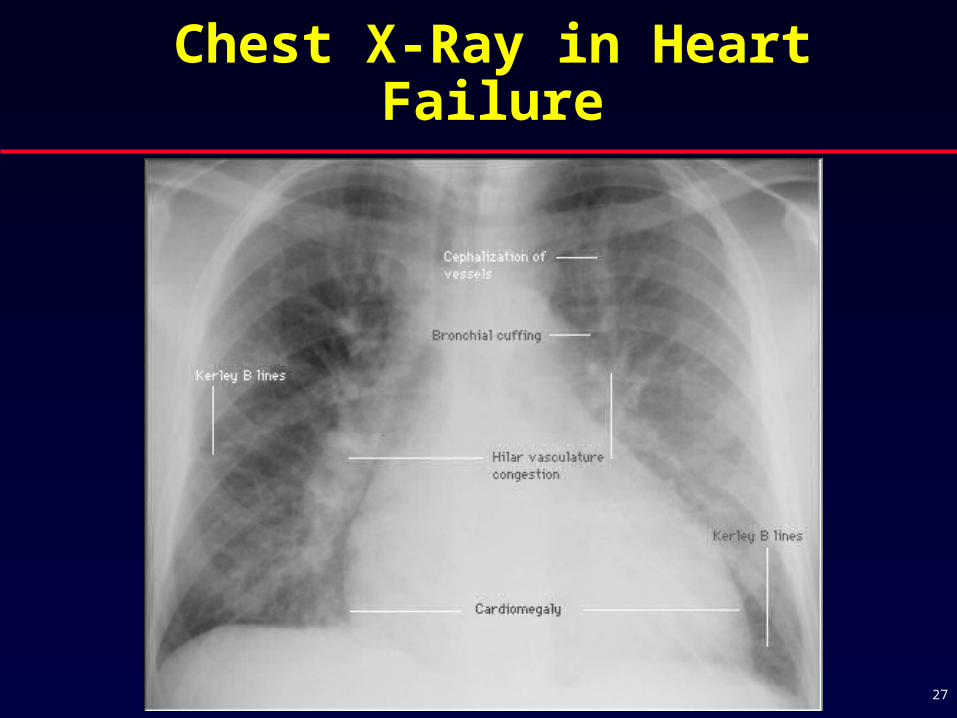
Chest X-Ray in Heart Failure
27

How Good Is Chest X-ray in Diagnosing Heart Failure?
CXR blows
– Misses 20% of echo- proven cardiomegaly
– Detection of pleural effusion if supine
• 67% sensitivity
• 70% specificity
– Even worse if done portable
Kono T, et al. Jpn Circ J. 1992;56(4):359-365.Ruskin JA, et al. Am J Roentgenol. 1987;148(4):681-683. 28
Hospitalizations for Heart Failure
Congestion is the primary reason for heart failure admissions
Low cardiac output and associated signs/symptoms are uncommon
Suboptimal weight reduction during hospitalization
Although appear improved clinically, many patients are discharged with signs and symptoms (related to pulmonary congestion that is not being identified clinically)
29
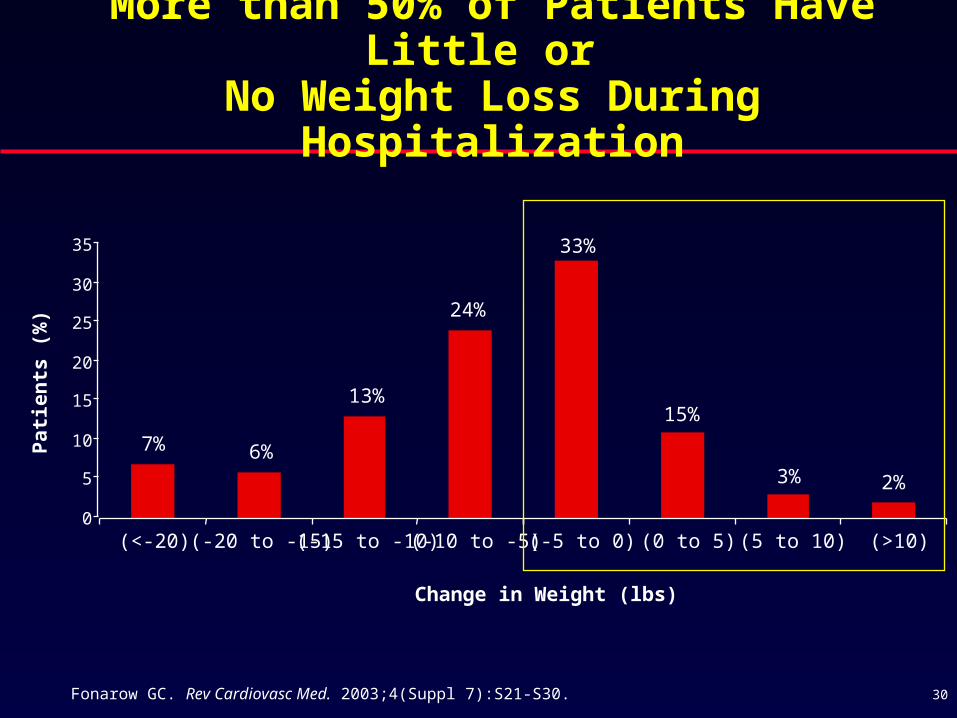
2%3%
15%
33%
24%
13%
6%7%
0
5
10
15
20
25
30
35
(<-20) (-20 to -15) (-15 to -10) (-10 to -5) (-5 to 0) (0 to 5) (5 to 10) (>10)
Change in Weight (lbs)
Pa
tie
nts
(%
)
Fonarow GC. Rev Cardiovasc Med. 2003;4(Suppl 7):S21-S30.
More than 50% of Patients Have Little or No Weight Loss During Hospitalization
30

Admission Discharge
Symptoms (%)
Dyspnea on exertion 79 58Dyspnea at rest 42 5Orthopnea 50 12
PND 33 4Fatigue 53 57
Signs (%)
JVP >6cm 33 6Rales 57 13S3 gallop 20 6Edema >2+ 50 13
PND, paroxysmal nocturnal dyspnea.Gattis WA, et al. J Am Coll Cardiol. 2004;43:1534-1541.
Change in Heart Failure Signs and Symptoms (Admission to Discharge)
31
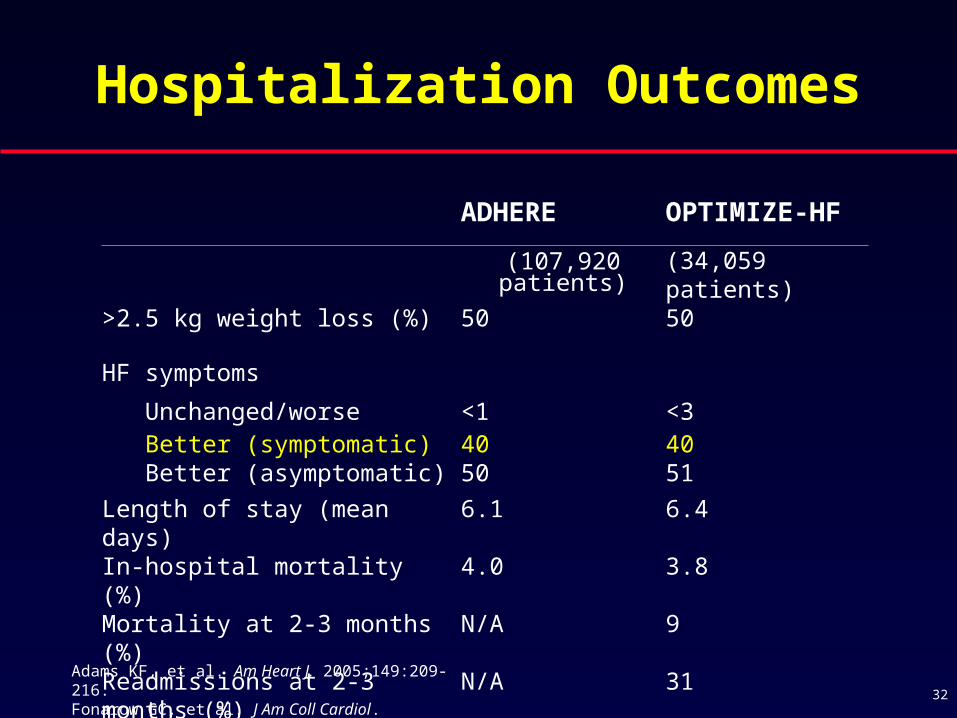
ADHERE OPTIMIZE-HF
(107,920 patients) (34,059 patients)
>2.5 kg weight loss (%) 50 50
HF symptoms
Unchanged/worse <1 <3 Better (symptomatic) 40 40 Better (asymptomatic) 50 51
Length of stay (mean days) 6.1 6.4 In-hospital mortality (%) 4.0 3.8Mortality at 2-3 months (%) N/A 9
Readmissions at 2-3 months (%) N/A 31
Hospitalization Outcomes
Adams KF, et al. Am Heart J. 2005;149:209-216. Fonarow GC, et al. J Am Coll Cardiol. 2004;844-4A. 32
BNP, brain (B-type) natriuretic peptide; NT, N-terminal. 33
Outpatient Monitoring of Congestion
Signs and symptoms
Daily weights
Natriuretic peptides (BNP and NT-pro BNP)
Noninvasive bioimpedence monitors

Limited Reliability of Daily Weights Over Time
Daily weights are helpful but not always reliable predictors of heart failure status
Many patients have difficulty operating/reading scales or remember to weigh themselves
Weight gain may reflect normal fluctuations, variation in time/conditions of weights, or improved appetite with improved heart failure
Weight loss due to loss of muscle/fat (cachexia) may obscure increased fluid retention
34

*Still investigational.
Interventions to Relieve Congestion
Increase dietary sodium restriction
Fluid restriction
Increase dose, frequency, or mode of administration of loop diuretics
Add/adjust dose of aldosterone antagonist
Thiazide diuretics
Metolazone
Vasopressin antagonists*
Ultrafiltration*
35
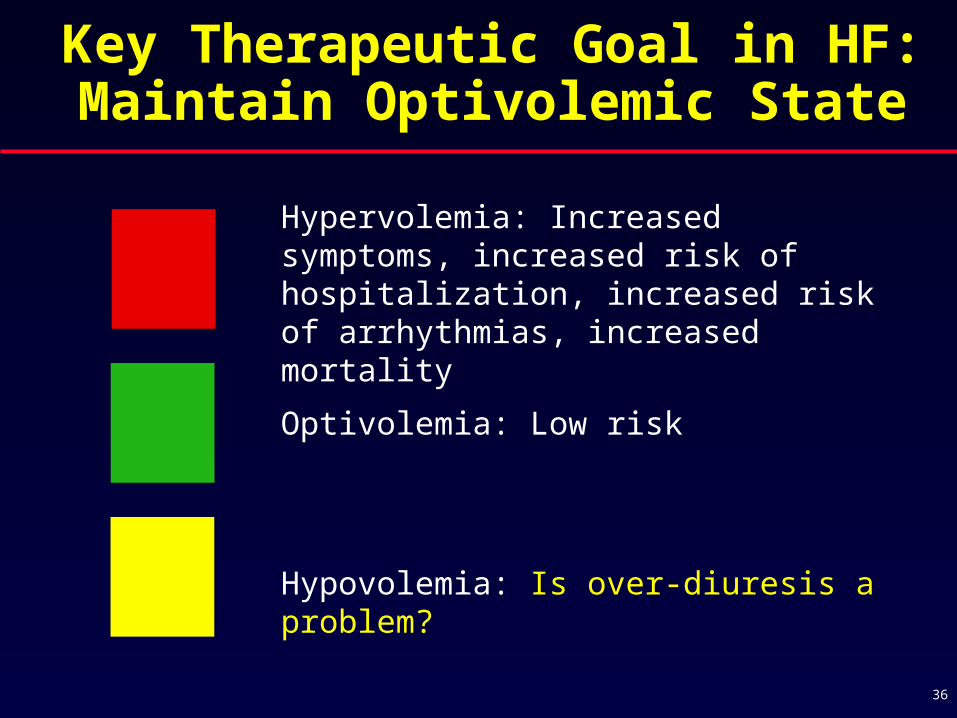
Key Therapeutic Goal in HF:Maintain Optivolemic State
Hypervolemia: Increased symptoms, increased risk of hospitalization, increased risk of arrhythmias, increased mortality
Optivolemia: Low risk
Hypovolemia: Is over-diuresis a problem?
36

Ravnan SL, et al. Congest Heart Fail. 2002;8:80-85.Brater DC. Drugs. 1985;30:427-443.
Loop Diuretics and Heart Failure
There have been no outcome studies of diuretictherapy for the treatment of heart failure and, thus, it’s effects on morbidity and mortality are not known
Diuretic therapy administered as monotherapy results in all of the following:– Further activation of renin-angiotensin-aldosterone
system
– Further activation of sympathetic nervous system
– Reflex vasoconstriction, increased afterload
– Decrease in stroke volume and cardiac output
– Substantial reduction in glomerular filtration rate (GFR)
37
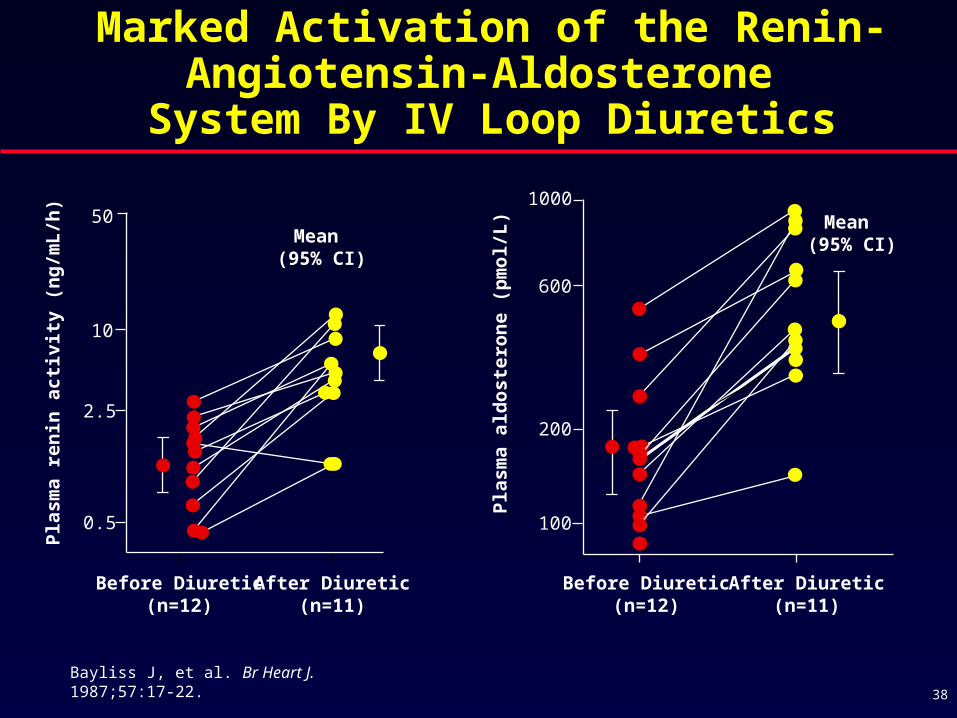
Bayliss J, et al. Br Heart J. 1987;57:17-22.
Pla
sma
ren
in a
ctiv
ity
(ng
/mL
/h)
Before Diuretic(n=12)
After Diuretic(n=11)
50
10
2.5
0.5P
lasm
a a
ldo
ste
ron
e (p
mo
l/L
)
Before Diuretic(n=12)
After Diuretic(n=11)
1000
600
200
100
Mean (95% CI)Mean
(95% CI)
Marked Activation of the Renin- Angiotensin-Aldosterone
System By IV Loop Diuretics
38
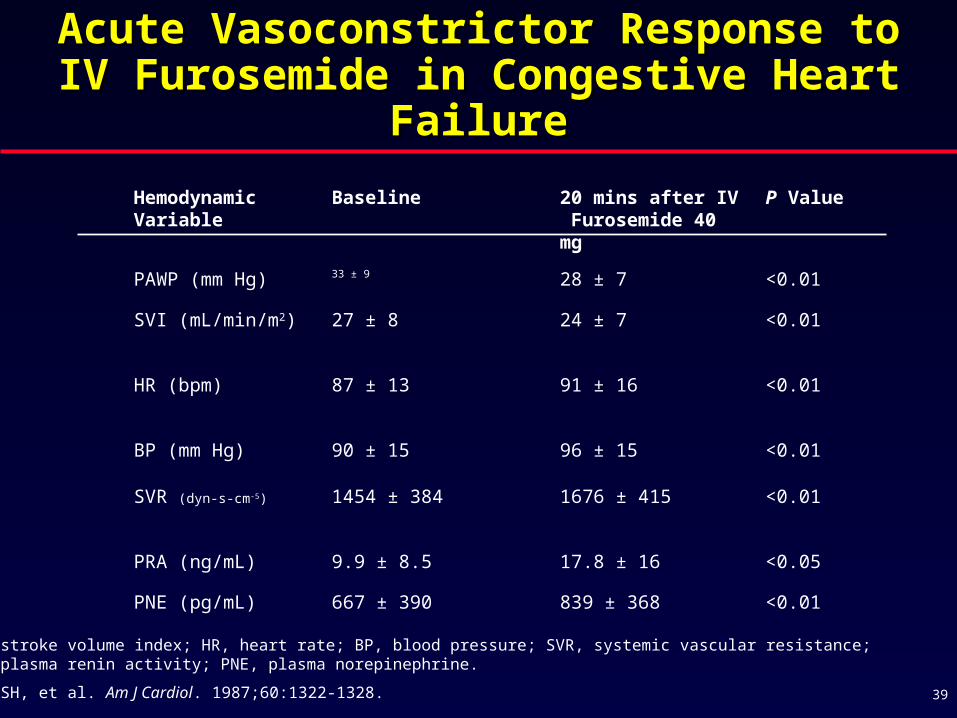
Acute Vasoconstrictor Response to IV Acute Vasoconstrictor Response to IV Furosemide in Congestive Heart FailureFurosemide in Congestive Heart Failure
<0.01839 ± 368667 ± 390PNE (pg/mL)
<0.0517.8 ± 169.9 ± 8.5PRA (ng/mL)
<0.011676 ± 4151454 ± 384SVR (dyn-s-cm-5)
<0.0196 ± 1590 ± 15BP (mm Hg)
<0.0191 ± 1687 ± 13HR (bpm)
<0.0124 ± 727 ± 8SVI (mL/min/m2)
<0.0128 ± 733 ± 9
PAWP (mm Hg)
P Value20 mins after IV Furosemide 40 mg
BaselineHemodynamic Variable
SVI, stroke volume index; HR, heart rate; BP, blood pressure; SVR, systemic vascular resistance; PRA, plasma renin activity; PNE, plasma norepinephrine.
Kubo SH, et al. Am J Cardiol. 1987;60:1322-1328. 39

Change in GFR after furosemide 80 mg IV, Class III HF n=16 age 61, LVEF 0.28, CAD 63%, Gottlieb SS, et al. Circulation. 2002;105:1348-1353.
-25
-20
-15
-10
-5
0
5
10
15
0 500 1000 1500 2000 2500
Urine Output (mL) 0 - 8 hours
GF
R (
% c
ha
ng
e)
Placebo
IV Furosemide
Furosemide Monotherapy Causes a Significant Decline in Renal Function
40

Higher Doses of Loop Diuretic is Associated with Increased
Mortality in Severe HF
Retrospective analysis of 1153 patients with advanced HF from PRAISE study
Loop diuretic above and below median compared
High diuretic use independent predictor of:
– Total mortality (HR 1.37; P=0.018)
– SCD (HR 1.39; P=0.042)
– Pump failure death (HR 1.51; P=0.034)
Metolozone use also independent predictor of mortality
PRAISE, Prospective Randomized Amlodipine Survival Evaluation; SCD, sudden cardiac death.Neuberg GW, et al. Am Heart J. 2002;144:31-38.
1.0
0.8
0.6
0.4
0.2
0
To
tal
mo
rta
lity
Months from Randomization
0 6 12 18 24 30 36
Chi-square=33.83P=0.0001
Group Diuretic dose ACE inhibitor dose
A High Low n=240B High High n=160C Low Low n=526D Low High n=224
A
B
C
D
41
Difficulty Assessing Volume Status
May contribute to over diuresis and higher dose than necessary loop diuretic use
Over diuresis contributes to adverse symptoms such as dizziness and headache
Over diuresis contributes to renal dysfunction and increased risk of acute renal failure
Excess diuretic use is associated with further neurohumoral activation
Excess diuretic use is associated with increased mortality
42
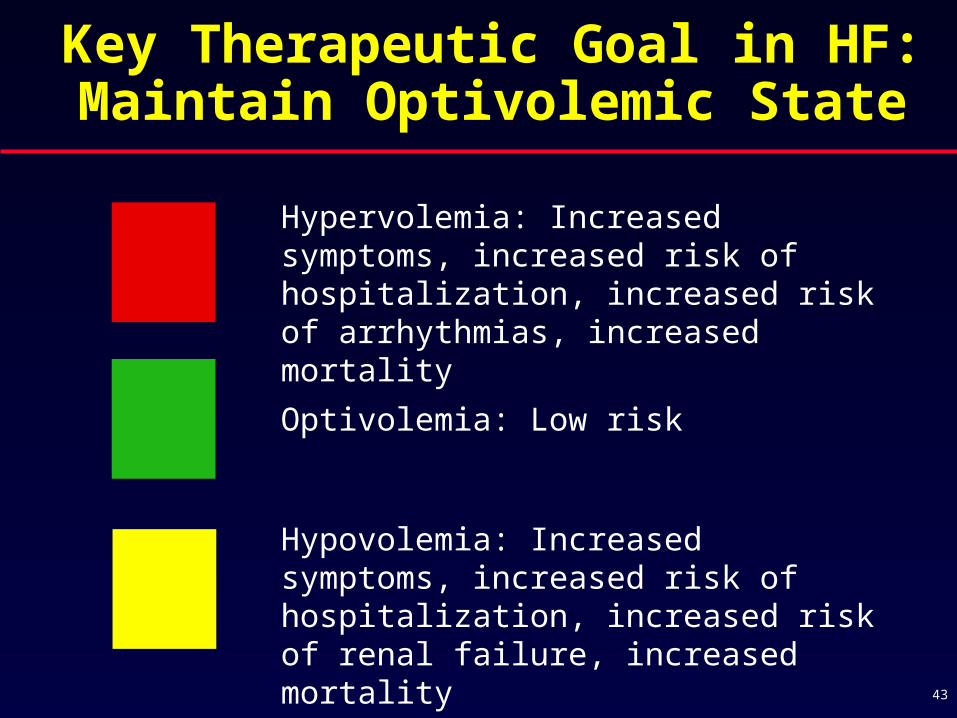
Key Therapeutic Goal in HF:Maintain Optivolemic State
Hypervolemia: Increased symptoms, increased risk of hospitalization, increased risk of arrhythmias, increased mortality
Optivolemia: Low risk
Hypovolemia: Increased symptoms, increased risk of hospitalization, increased risk of renal failure, increased mortality
43
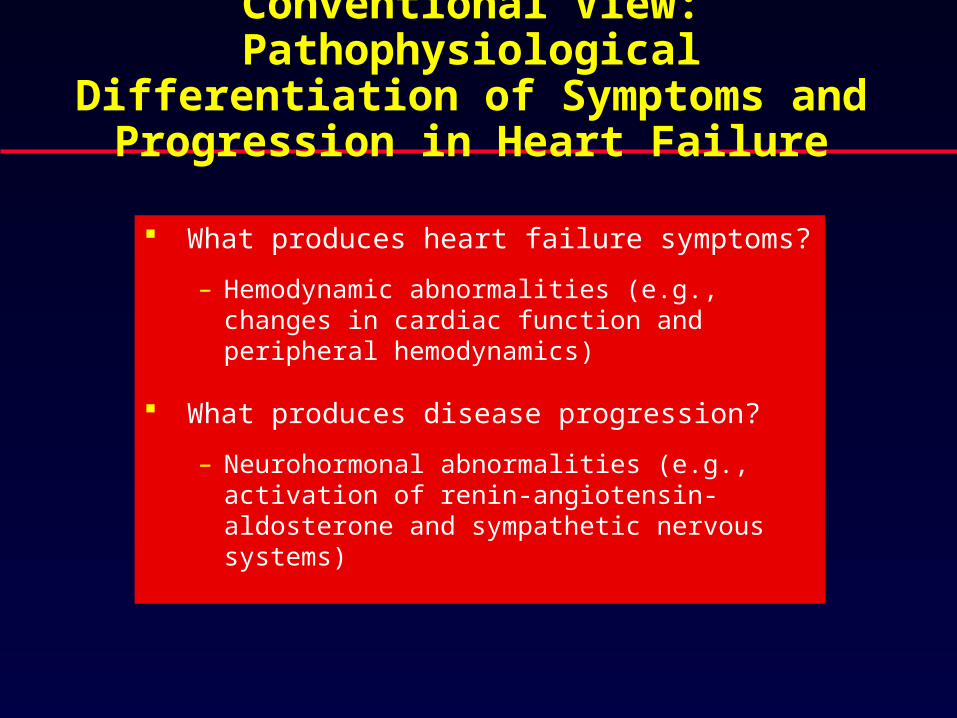
Conventional View: Pathophysiological Differentiation of Symptoms and
Progression in Heart Failure
What produces heart failure symptoms?
– Hemodynamic abnormalities (e.g., changes in cardiac function and peripheral hemodynamics)
What produces disease progression?
– Neurohormonal abnormalities (e.g., activation of renin-angiotensin-aldosterone and sympathetic nervous systems)
4
3
2 2
1 1 10.8 0.8 0.8 0.8 0.8
0.5 0.5 0.5 0.5 0.50.4 0.4 0.4 0.4 0.4 0.4 0.4
0.2 0.2 0.2 0.2 0.2 0.2 0.2 0.2 0.2 0.2 0.2 0.2 0.2 0.2 0.2 0.2 0.2 0.2 0.2 0.2 0.2 0.2 0.2 0.2
0
1
2
3
4
5
1 2 3 4 5 6 7 8 9 10 11 12 13 14 15 16 17 18 19 20 21 22 23 24
Time (weeks)
Mo
rtal
ity
%
AHF Hospitalization Stage C Outpatient
HR=20
HR=10
HR=4
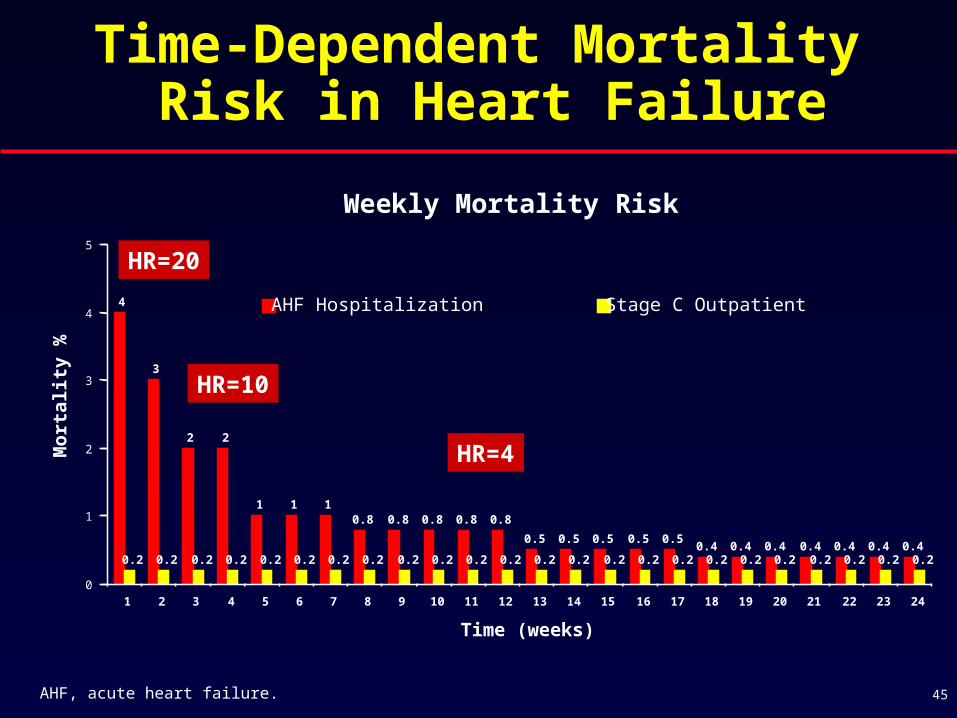
Weekly Mortality Risk
Time-Dependent Mortality Risk in Heart Failure
AHF, acute heart failure. 45
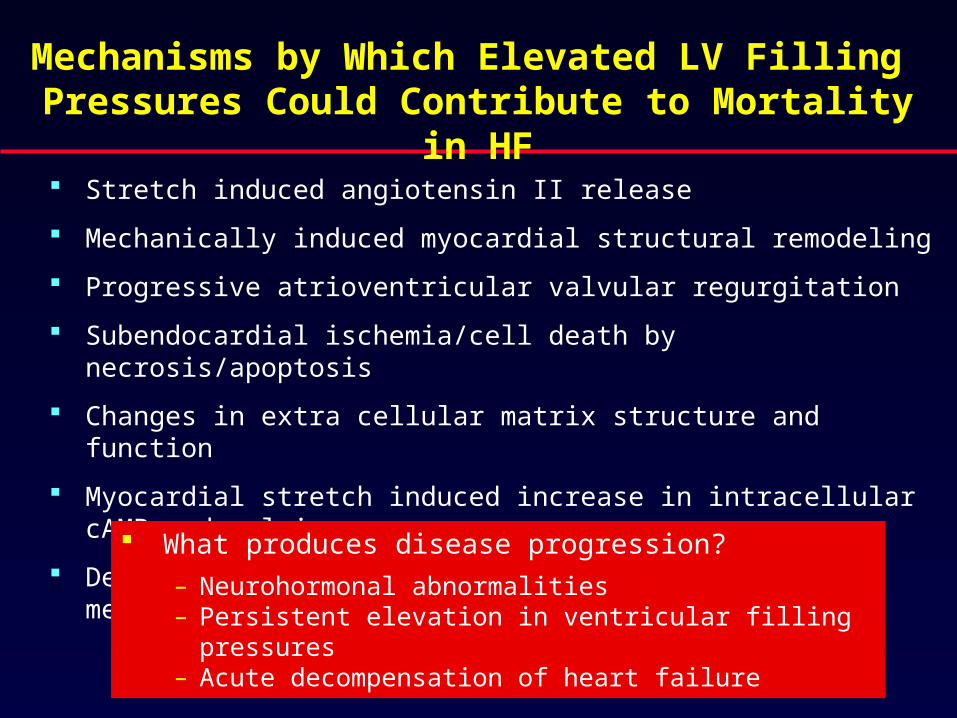
Stretch induced angiotensin II release
Mechanically induced myocardial structural remodeling
Progressive atrioventricular valvular regurgitation
Subendocardial ischemia/cell death by necrosis/apoptosis
Changes in extra cellular matrix structure and function
Myocardial stretch induced increase in intracellular cAMP and calcium
Desensitization of low pressure ventricular mechanoreceptors
Mechanisms by Which Elevated LV Filling Pressures Could Contribute to Mortality in HF
What produces disease progression?
– Neurohormonal abnormalities– Persistent elevation in ventricular filling pressures– Acute decompensation of heart failure
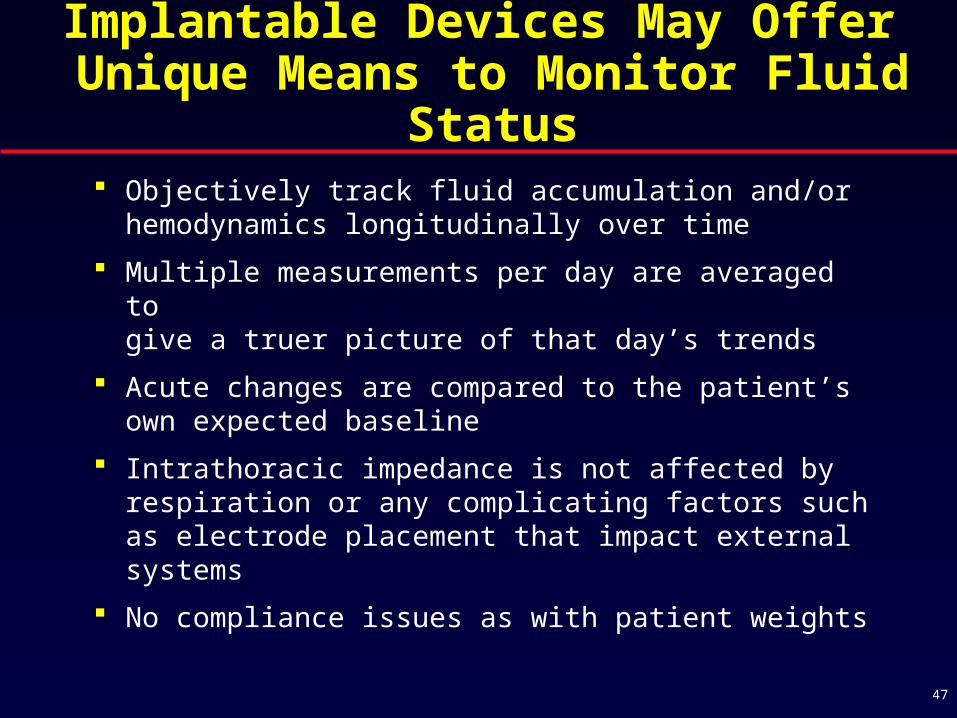
Implantable Devices May Offer Unique Means to Monitor Fluid Status
Objectively track fluid accumulation and/or hemodynamics longitudinally over time
Multiple measurements per day are averaged to give a truer picture of that day’s trends
Acute changes are compared to the patient’s own expected baseline
Intrathoracic impedance is not affected by respiration or any complicating factors such as electrode placement that impact external systems
No compliance issues as with patient weights
47
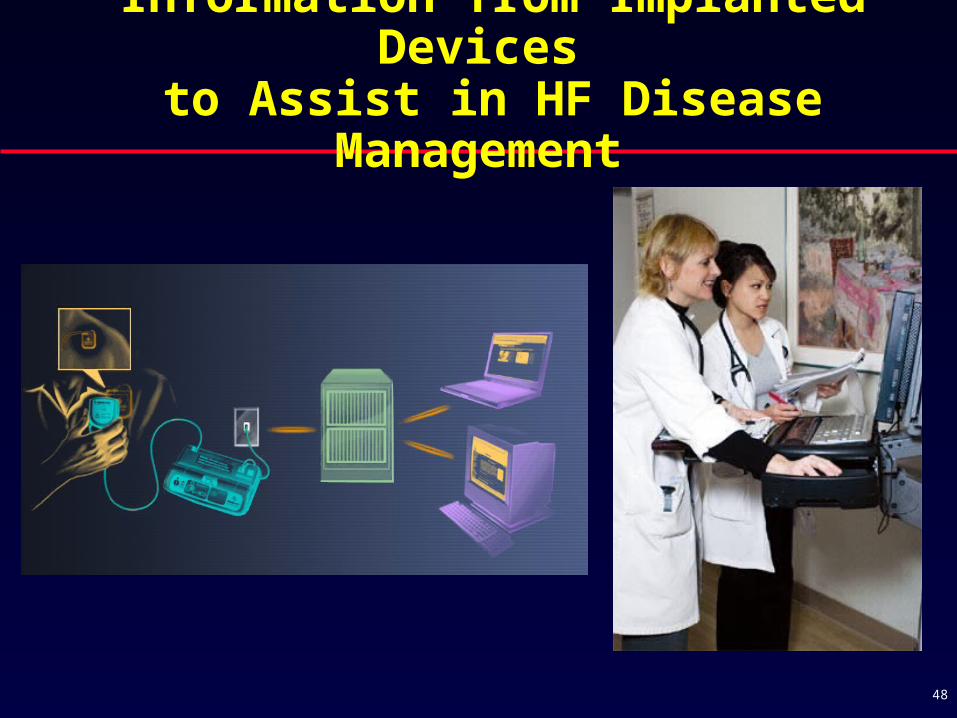
Information from Implanted Devices to Assist in HF Disease Management
48

Congestion in Heart Failure: Conclusions
Congestion is the primary cause of heart failure symptoms, hospital admissions, and hospital readmissions
Congestion is an important predictor of mortality and morbidity
Congestion contributes to progression of heart failure
Clinical congestion often lags behind rising filling pressures
Congestion is often difficult to recognize, delaying appropriate interventions
Improved methods to monitoring congestion may improve clinical management and outcomes
49
50
Optimal Care of Heart Failure: How to Improve Outcomes
Optimize survival enhancing oral medications (ACE inhibitors and/or ARB, beta-blockers, aldosterone antagonists)
Optimize survival-enhancing heart failure device therapies (ICD, CRT)
Optimize patient education and heart failure disease management
Maintain optimal volume status