how will new high sensitive troponins affect the...
TRANSCRIPT

How will new high sensitive troponins
affect the criteria?
Hugo A Katus MDAbteilung Innere Medizin III
Kardiologie, Angiologie, Pulmologie
Universitätsklinikum Heidelberg

hsTnT (5th Generation)
99th percentile = 0.013 µg/L
Even more sensitive:
The new Troponin T assay hs
Giannitsis et al Clin Chem 2010

Criteria of Myocardial Infarction
Myocardial necrosis:
Detection of rise and/or fall of cardiac biomarker
(preferably troponins) with at least one value
above the 99th percentile of the upper reference limit
With evidence of myocardial ischemia with
at least one of the following:
• Symptoms of ischemia
• New ST-T changes or LBBB
• Development of new Q-waves
• Imaging evidence of new loss of viable myocardium
• or new regional wall motion abnormality
Universal Definition of Myocardial Infarction
The Joint ESC-ACCF-AHA-WHF Task Force

Sub-Classification of AMI
Type 1 Spontaneous myocardial infarction related to ischemia due to a primary coronary event such as plaque erosion or rupture, fissuring or dissection
Type 2 Myocardial infarction secondary to ischemia due to imbalance between
oxygen demand and supply e.g. coronary spasm, anemia, or hypotension
Type 3 Sudden cardiac death with symptoms of ischemia, accompanied by new
ST elevation or LBBB, or verified coronary thrombus by angiography or autopsy, but death occurring before blood samples could be obtained
Type 4a Myocardial infarction associated with PCI
Type 4b Myocardial infarction associated with verified stent thrombosis
Type 5 Myocardial infarction associated with CABG
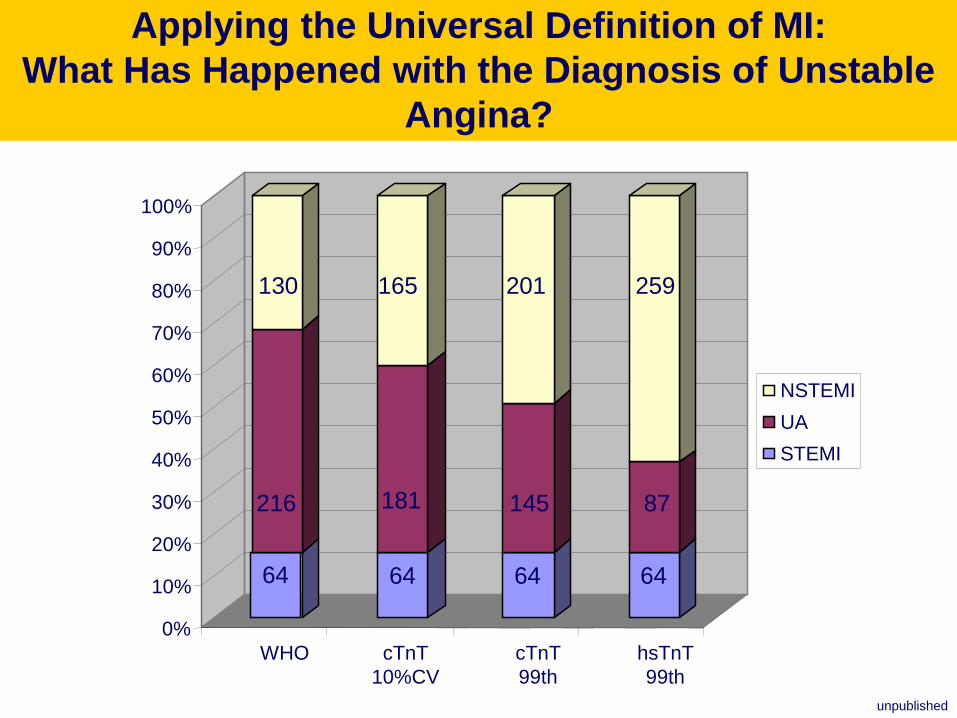
0%
10%
20%
30%
40%
50%
60%
70%
80%
90%
100%
WHO cTnT
10%CV
cTnT
99th
hsTnT
99th
NSTEMI
UA
STEMI
216
130 165 201
181 145
64 64 64
259
87
64
Applying the Universal Definition of MI:
What Has Happened with the Diagnosis of Unstable
Angina?
unpublished

Sens
%
Spec
%
PPV NPV
Baseline sample >99th
FU sample 3hours >99th
FU sample >99th + 20%delta
FU sample >99th + 117%delta
62
100
85
69
77
77
57
100
69
65
79
100
71
100
67
88
Diagnostic performance of serial blood sampling
using 99th percentile in evolving MI
Giannitsis E, et al. Clin Chem 2010
Higher delta improves specificity

N=1530 HR 95%CI p-value
TnThs ≥14 pg/ml 7.591 1.006-57.3 0.049
Age ≥ 75 years 2.753 1.448-5.233 0.002
GFR <60 ml/min/1.73m2 2.318 1.364-3.938 0.002
TIMI Risk Score by
Tertiles1.193 0.876-1.626 0.263
NT-proBNP > 2399
pg/ml (ROC-optimized)5.698 3.252-9.983 <0.001
cTnT ≥ 0.03 µg/l 1.752 0.778-3.947 0.176
Predictors of Death at 3 years FU
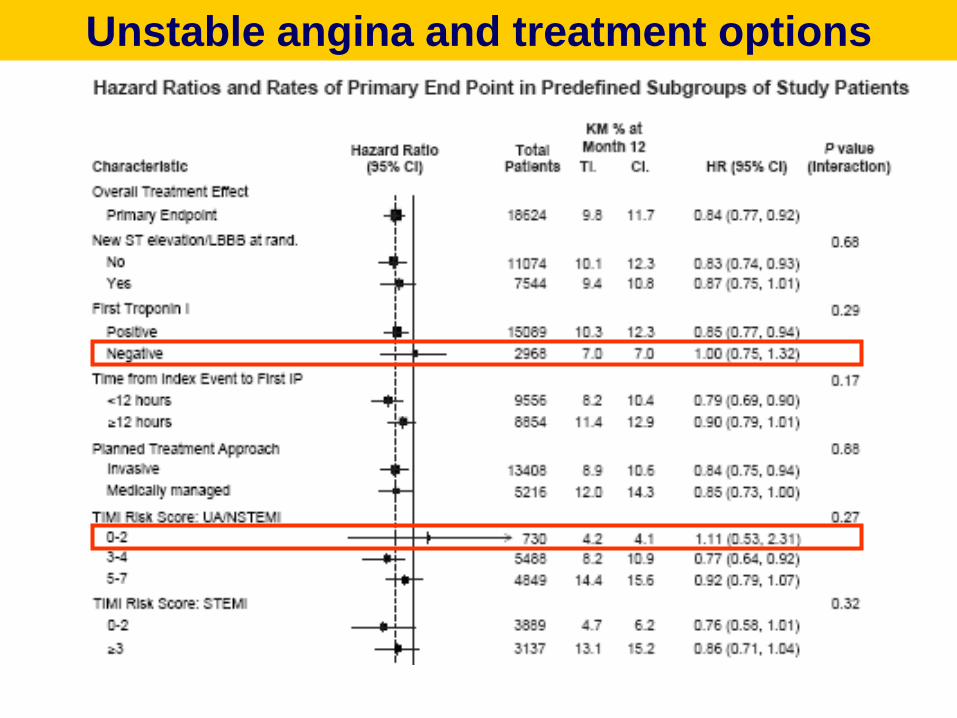
Unstable angina and treatment options

Sub-Classification of AMI
Type 1 Spontaneous myocardial infarction related to ischemia due to a primary
coronary event such as plaque erosion or rupture, fissuring or dissection
Type 2 Myocardial infarction secondary to ischemia due to imbalance between oxygen demand and supply e.g. coronary spasm, anemia, or hypotension
Type 3 Sudden cardiac death with symptoms of ischemia, accompanied by new
ST elevation or LBBB, or verified coronary thrombus by angiography or autopsy, but death occurring before blood samples could be obtained
Type 4a Myocardial infarction associated with PCI
Type 4b Myocardial infarction associated with verified stent thrombosis
Type 5 Myocardial infarction associated with CABG

20% of consecutive pts admitted to CPU TnThs positive !!
69% elevations are not due to clinical ACS !!
STEMI
62 pts
(1.8%)
NSTEMI
149 pts
(4.3%)
UA
173 pts
(4.9%)
TnThs positive
non-ACS
471 pts
(13.5%)
TnThs negative
non-ACS
2645 pts
(75.6%)
Median number of TnThs measurements 3 (IQR 3-5, range 2-6)
CPU Registry Heidelberg (n=3,327)
8.6.2009 – 30.11.2009 (6-months)
Diagnoses in Chest Pain Patients

High Sensitive Troponin T is a Strong Predictor of
Outcomes in Patients with Chronic Heart Failure - A
Study from the Val-HeFT Trial
Roberto Latini Heart Failure: Predicting Clinical Outcomes - Monday, November 14, 2005,

Lankeit M,….Giannitsis E, Katus HA, Konstantinides SDGK 2009; Poster
Acute Pulmonary Embolism
Probability of Long-Term Survival

hsTnT and Plaque Morphology in Stable
Coronary Artery Disease
0
10
20
30
40
50
Card
iac C
TM
-hsT
nT
(p
g/m
l)
a. d.b. c.
Normal CA Calcified CA-Pl Non Calcified CA-Pl Complex CA-Pl

Januzzi et al, 2009, Submitted
<.001
.05
.04
.001
.04
.09
.001
1.5 (±3.0)
0.8 (±2.0)
0.5 (±1.4)
1.7 (±3.0)
0.06 (±0.3)
0.05 (±0.3)
0.9 (±1.3)
4.4 (±4.0)
1.8 (±3.0)
1.4 (±2.5)
4.8 (±5.0)
0.4 (±1.0)
0.2 (±0.5)
2 (±1.8)
Coronary CT angiographySegments with calcified plaque
Segments with non-calcified plaque
Segments with mixed plaque
Segments with plaque
Segments with significant stenosis
Vessels with significant stenosis
Vessels with plaque
.02
.01
.50
.20
.01
.30
.008
95 (±24.0)
55 (17.0)
117 (±30.0)
38 (±16.0)
147 (±39.0)
68 (±9.0)
24 (8%)
107 (±33.0)
69 (±31.0)
122 (±45.0)
48 (±41.0)
173 (±60.0)
65 (±14.0)
8 (22%)
Cardiac chamber size and functionLeft atrial diastolic volume, mL
Left atrial systolic volume, mL
Left ventricular end diastolic volume, mL
Left ventricular end systolic volume, mL
Left ventricular mass
Left ventricular ejection fraction, %
Regional left ventricular dysfunction
<.001
.05
42 (23-86)
0.82 (0.73-0.92)
248 (92-492)
0.93 (0.75-1.07)
Biomarkers besides TnTNT-proBNP, pg/mL, median (interquartile range)
Cystatin-C, mg/L, median (interquartile range)
PhsTnT <13 pg/mL
(N=302)
hsTnT ≥13 pg/mL
(N=38)
Characteristic
CT angiography and biomarkers in subjects
without ACS as a function of hsTnT

Sub-Classification of AMI
Type 1 Spontaneous myocardial infarction related to ischemia due to a primary
coronary event such as plaque erosion or rupture, fissuring or dissection
Type 2 Myocardial infarction secondary to ischemia due to imbalance between
oxygen demand and supply e.g. coronary spasm, anemia, or hypotension
Type 3 Sudden cardiac death with symptoms of ischemia, accompanied by new
ST elevation or LBBB, or verified coronary thrombus by angiography or autopsy, but death occurring before blood samples could be obtained
Type 4a Myocardial infarction associated with PCI
Type 4b Myocardial infarction associated with verified stent thrombosis
Type 5 Myocardial infarction associated with CABG

1,949 patients from the Mayo Clinic registry
All had normal CK-MB after the procedure
383 (19.6%) patients with elevated cTnT
Prasad, A. et al. J Am Coll Cardiol 2006;48:1765-1770
Kaplan-Meier survival estimates for those with (TnT >=0.03) and without (TnT)

Cutoff concentrations for diagnosis of
periprocedural MI
0
10
20
30
40
50
60
70
80
90
100
3xURL
10%CV
=0.03 ng/ml
3xURL
99th perc
4th gen cTnT
=0.01 ng/ml
3xURL
99th perc
hsTnT
=14 ng/L
hsT
nT
ng
/L
0.09
ng/ml
0.03
ng/ml 42
ng/L

Elevation of troponin after
scheduled PCI: 28.7%
PCI-related MI by
Universal definition: 14.5%.
Type IV MI: Death OR 17.25 (2.71–109.96), P = 0.003,
Re-PCI OR 10.86 (3.2–36.94), P<0.001 Testa L et al. QJM 2009;102:369-378
2359 patients, 4 studies
Incidence and prognostic role of Universal Definition
Type IV MIMeta-analysis 15 studies, 7578 patients
≥3x99th percentile
<3x99th percentile

Type 4 MIs after Elective PCI
(> 3x 99th percentile = 42 pg/ml)
160
140
120
100
80
60
40
20
0
TnTbaseline Peak within 24hrs
Median 6.13
IQR2.99 to 11.31
Median 15,8
IQR 9.8 to 23.9
P = 0.0012
N=20 paired samples
Incidence Type IV MI: 10%
>3x99th percentile

Prognostic significance of preprocedural cardiac troponin
elevation among patients
with stable CAD undergoing PCI: The EVENT Registry
7592 consecutive patients
142 (6.0%) cTnT + at baselineJeremias A, et al.Circulation 2008

Sub-Classification of AMI
Type 1 Spontaneous myocardial infarction related to ischemia due to a primary
coronary event such as plaque erosion or rupture, fissuring or dissection
Type 2 Myocardial infarction secondary to ischemia due to imbalance between
oxygen demand and supply e.g. coronary spasm, anemia, or hypotension
Type 3 Sudden cardiac death with symptoms of ischemia, accompanied by new
ST elevation or LBBB, or verified coronary thrombus by angiography or autopsy, but death occurring before blood samples could be obtained
Type 4a Myocardial infarction associated with PCI
Type 4b Myocardial infarction associated with verified stent thrombosis
Type 5 Myocardial infarction associated with CABG

follow-up [days]
0 200 400 600 800 1000 1200
cu
mu
lati
ve c
ard
iac s
urv
ival [%
]
0
80
85
90
95
100
cTnT > 0,46µg/L at 48 hrs
cTnT > 0,46µg/L at 48 hrs
log rank 8.46 p = 0.0036
CTnT and Out-Come Following CABG-
Surgery

0
20
40
60
80
100
120
140
160
1 2 3
5xURL
10%CV
=0.03 ng/ml
5xURL
99th perc
4th gen cTnT
=0.01 ng/ml
5xURL
99th perc
hsTnT
=14 ng/L
hsT
nT
ng
/L
0.15
ng/ml
0.05
ng/ml70
ng/L
Cutoff concentrations for diagnosis of
MI post CABG
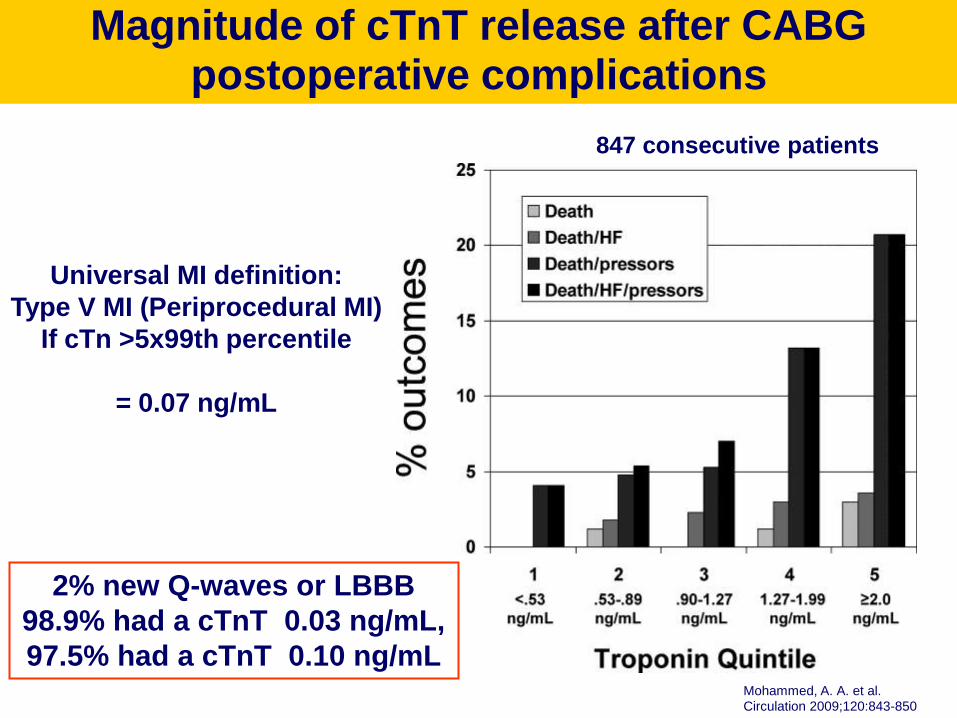
Mohammed, A. A. et al. Circulation 2009;120:843-850
Magnitude of cTnT release after CABG postoperative complications
Universal MI definition:
Type V MI (Periprocedural MI)
If cTn >5x99th percentile
= 0.07 ng/mL
847 consecutive patients
2% new Q-waves or LBBB
98.9% had a cTnT 0.03 ng/mL,
97.5% had a cTnT 0.10 ng/mL

Impact of hsTn on AMI Diagnosis/ Criteria
• Type 1: Many more patients rule in for AMI, prevalence of unstable angina will diminish but risk prediction will be improved
• Type 2 AMIs will remain a diagnostic challenge
• Type 4 AMI will be observed in 10-40% of elective PCIs. The prognostic impact of minor marker increases needs to be tested prospectively
• Type 5 AMI will need revision due to extra-ordinarily high rate of peri-operative AMI diagnoses and lack of prognostic information at low levels


Troponin Release: Type of Surgery
miscellaneous
CABG
Valve repair
CABG + valve
0
0,2
0,4
0,6
0,8
1
1,2
1,4
1,6
4 8 24 48 72 96
time after surgery
Ca
rdia
c T
rop
on
in T
(µ
g/L
)
hours
p=0.024
p=0.007
p=0.009
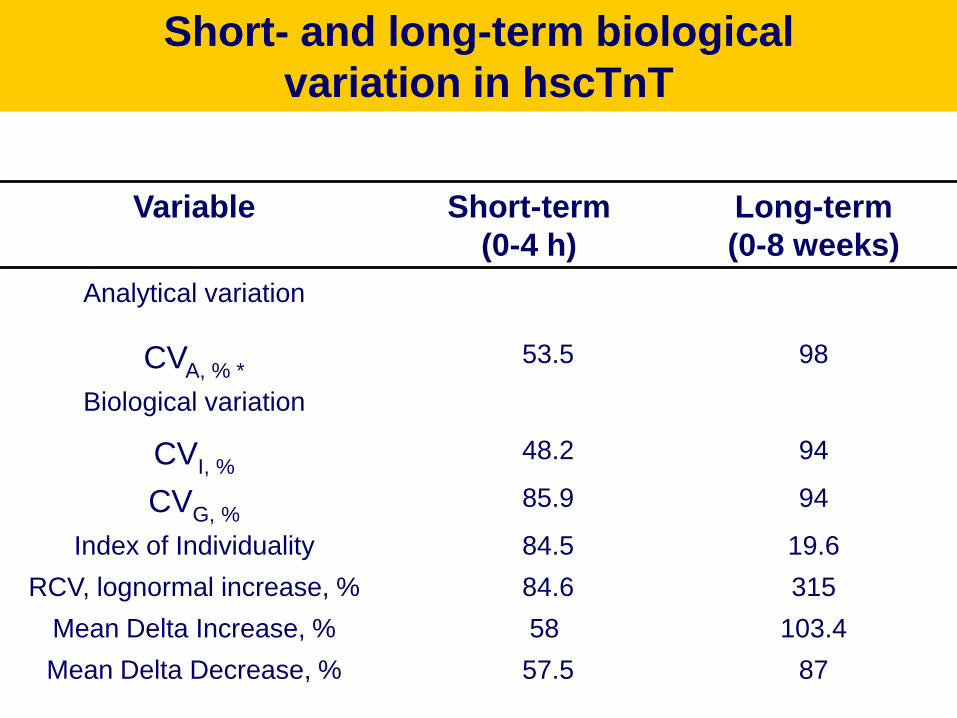
Short- and long-term biological
variation in hscTnT
8757.5Mean Delta Decrease, %
103.458Mean Delta Increase, %
31584.6RCV, lognormal increase, %
19.684.5Index of Individuality
9485.9CVG, %
9448.2CVI, %
Biological variation
9853.5CVA, % *
Analytical variation
Long-term
(0-8 weeks)
Short-term
(0-4 h)
Variable

0 20 40 60 80 100
100
80
60
40
20
0
100-Specificity
Se
nsitiv
ity
Sensitivity: 75,0 Specificity: 96,0 Criterion : >117,6546
Sensitivity: 78,6 Specificity: 100,0 Criterion : >242,6287
ROC 0.94
95% CI: 0.812 to 0.990
PPV 100 %
NPV 88.9 %
ROC 0.817
95% CI: 0.655 to 0.924
PPV 91.6 %
NPV 86.8 %
Optimal delta change for prediction
of evolving NSTEMI*
Giannitsis et al. Clin Chem 2010*MI defined by 4th gen. cTnT

AUC 0.885
SE 0,0157
Cutoff >112.4
P<0.0001
Maximal hsTnT within 6 hours
for prediction of MI
0 20 40 60 80 100
100
80
60
40
20
0
100-Specificity
Sensitiv
ity
Sensitivity: 77,0
Specificity: 88,2
Criterion : >112,4
Sens 77.03 (70.7 - 82.6 )
Spec 88.16 (85.2 - 90.7 )
NPV 91.3 (88.6 - 93.5 )
PPV 70.5 (64.2 - 76.4 )

100000
10000
1000
100
10
1
0,1
0,01
deltam
ax_m
inhsT
nT
ACS
N=379
non-ACS
N=395
17.3%
IQR 8.6-32.6
P<0.001
39%
IQR 14.4-139.6
Early delta change in ACS versus
TnThs-positive non-ACS patients

Diagnostic sensitivity of TnT hs
compared to cTnT
p between cTnT adm and hsTnT adm (UAP/NSTEMI) < 0.0001
p between cTnT final and hsTnT final (UAP/NSTEMI) < 0.0001
p between cTnT adm and cTnT final (UAP/NSTEMI) = 0.0003
p between hsTnT adm and hsTnT final (UAP/NSTEMI) = 0.0008
0
20
40
60
80
100
120
cTnT adm hsTnT adm cTnT final hsTnT final
STEMI
NSTEMI
UAP
non cardiac
n = 115
nu
mb
er
n
17 17 17 17
21 2121
21
20
57
32
45
31
46
22
55


Morrow, D. A. et al. Circulation 2009;119:2758-2764
Distribution of new or recurrent MIs (n=1218) by the universal definition of MI clinical
classification

0,00 200,00 400,00 600,00 800,00 1000,00 1200,00
0,4
0,5
0,6
0,7
0,8
0,9
1,0
l
All-cause Death by TnThs 99th percentile
Log rank 33.07
P<0.0001
days
Su
rviv
al
N=376
N=1154
N=1530

All-cause mortality at 3yrs follow up
cTnThs tertiles by diagnosis
N=1530
0
5
10
15
20
25
Non-STE-ACS STEMI Non-ACS
0%
5.7%
11.9%
18.9%
23.8%
2.9%0.7%
9.7%
13.5%
0/56 6/106 17/142 1/34 3/21 5/2137/3833/420 47/347
Tertile1
Median 10.9 (7.3-15.8)
Tertile2
Median 76.1 (50.5-116.5)
Tertile3
Median 524 (300.7 - 1203.8)

Latini R. et al. Circulation 2007;116
HsTnT and Outcomes in Heart Failure: The Valheft-Trial

Case 4: A 78 year old female
History:
• referred to our chest pain unit with dizziness, vomiting and nausea
• no typical cardiac chest pain
• discrete shortness of breath and decrease of performance
• known diseases: subtle renal failure (MDRD 50 ml/min/1.73m2)
• CVRF: hypertension, hypercholesterolemia
• medication: ASS 100mg 0-1-0, candesartan 16mg 1-0-1, hydrochlorothiazid
12,5mg 1-0-1, nebivolol 5mg ½-0-½, pravastatin 20mg 0-0-1, estrogen
0,6mg 1-0-0
Physical examination:
• 67.0 kg, 1.70 cm, BMI 23 kg/m2,
• RR adm 130/60mmHg, HR adm 80/min, 36.1 °C
• Auscultation: Cor/Pulmo: unsuspicious

Case 4: EKG
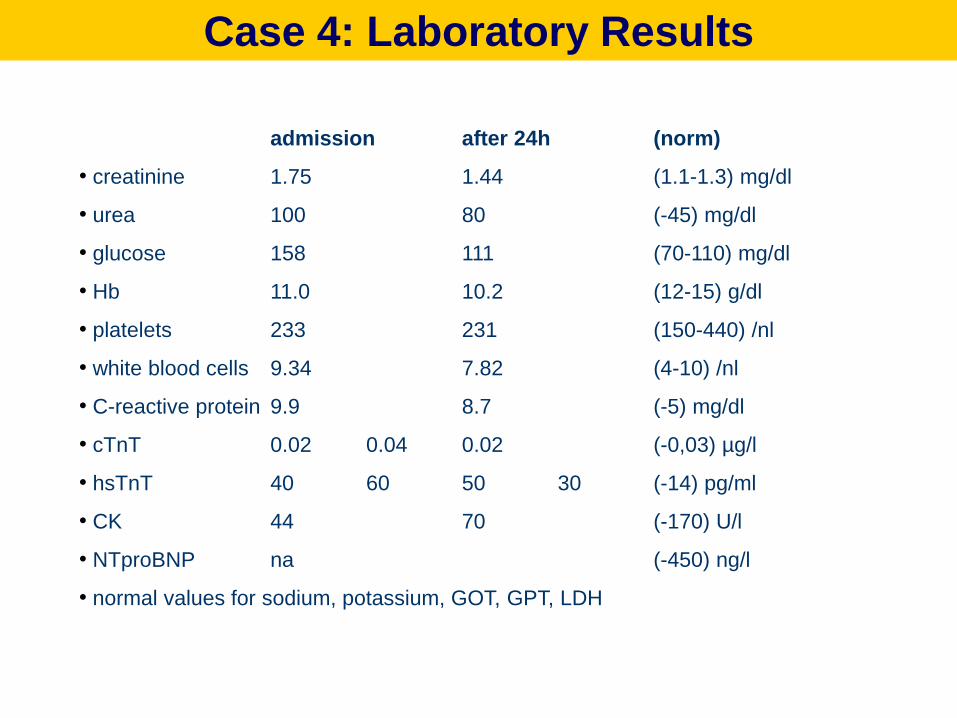
Case 4: Laboratory Results
admission after 24h (norm)
• creatinine 1.75 1.44 (1.1-1.3) mg/dl
• urea 100 80 (-45) mg/dl
• glucose 158 111 (70-110) mg/dl
• Hb 11.0 10.2 (12-15) g/dl
• platelets 233 231 (150-440) /nl
• white blood cells 9.34 7.82 (4-10) /nl
• C-reactive protein 9.9 8.7 (-5) mg/dl
• cTnT 0.02 0.04 0.02 (-0,03) µg/l
• hsTnT 40 60 50 30 (-14) pg/ml
• CK 44 70 (-170) U/l
• NTproBNP na (-450) ng/l
• normal values for sodium, potassium, GOT, GPT, LDH

Case 4: Left Ventricular Angiography

Case 4: Coronary Angiography

Mohammed, A. A. et al. Circulation 2009;120:843-850
Postoperative cTnT results as a function of outcome after CABG