how will the 3.11 earthquake transform the …...suffered the triple-whammy of a major earthquake, a...
TRANSCRIPT

64
How Will the 3.11 Earthquake Transform the Population and Labor Market in Iwate, Miyagi and Fukushima?: Knowledge Gained from Existing Studies of Disasters Yanfei Zhou The Japan Institute for Labour Policy and Training
Based on existing studies of disasters, one can see that human capital and be-ing on the path to growth are the two keys to the recovery of the disas-ter-afflicted areas. If human capital outflows due to the nuclear power plant accident are also taken into account, the damage to human capital in Fukushi-ma Prefecture has been immense, and given that the underlying trend of the economy there was somewhat stagnant even before the disaster, one would expect that it will take longer to achieve recovery there than in the other two prefectures, and that it will be difficult to regain its previous population and scale of employment. On the other hand, the scale of the damage to human capital in Iwate and Miyagi Prefectures was about the same scale as that seen in Kobe as a result of the Great Hanshin Awaji Earthquake. It is anticipated that the post-disaster reconstruction of Miyagi Prefecture, which was on the path to growth to some extent before the disaster, will progress rather more smoothly than it will in Iwate Prefecture, where the pre-disaster economy was somewhat stagnant. In fact, if one looks solely at trends in employment, the economic climate and population, one can see that the path to recovery from the aftermath of this disaster through to the present day has followed a path that runs broadly in line with projections.
I. Introduction The magnitude 9.0 earthquake and massive tsunami on a scale rarely seen over the
course of history that struck East Japan on March 11, 2011 caused unprecedented devasta-tion for the citizens of the Tohoku region, focused primarily on Iwate, Miyagi and Fuku-shima Prefectures. It was the worst disaster to assail Japan since the end of World War II, with 19,317 people dead or missing and more than 350,000 homes completely or partially destroyed, while the number of evacuees fleeing their hometowns reached 400,000 at its peak (figures announced by the National Police Agency on December 20, 2011). In particu-lar, Fukushima Prefecture, where the Fukushima Daiichi Nuclear Power Plant is located, suffered the triple-whammy of a major earthquake, a huge tsunami and a nuclear disaster, causing incalculable human and economic damage.
Most of the disaster-afflicted areas were already suffering from severe aging of the population even before the disaster, with a gradual but ongoing exodus of the younger pop-ulation, so there is concern that this major disaster will bring about a further outflow of the population. Above all, there is a strong possibility that the outflow of population and em-ployment will be more acute in Fukushima Prefecture than in other disaster-afflicted areas, due to the impact of the nuclear power plant accident.

How Will the 3.11 Earthquake Transform the Population and Labor Market in the Disaster Areas?
65
This March marked the passage of a year since the occurrence of the Great East Japan Earthquake. Data concerning the population and employment, including in the disas-ter-afflicted areas, is being published, albeit only in piecemeal fashion, and we are now be-ginning to be able to grasp—to some extent—the degree to which reconstruction has pro-gressed. In this study, the author would like to use the latest statistical data, together with knowledge gained from existing studies of disasters, in order to consider with the reader the future direction of the population and labor markets in these three Tohoku prefectures (Iwate, Miyagi and Fukushima Prefectures).
II. The Two Keys Determining the Pace and Degree of Reconstruction
1. Human Capital Will Determine the Pace of Reconstruction More Than Physical Capital
According to research carried out both within Japan and overseas concerning the his-tory of natural disasters, although economic activity, the population, and workforce markets contract temporarily in the aftermath of a major disaster, there are many cases in which they subsequently rebound strongly and experience a renaissance. For example, the 1871 Great Chicago Fire burnt down more than 17,000 houses, resulting in more than 100,000 people losing their homes, but by 1880, not only had homes for those 100,000 people been rebuilt, but also the city of Chicago was able to take in a further 200,000 new citizens. In San Fran-cisco in 1906, an earthquake caused an exodus of 200,000 people, equivalent to half the total population of the city, but by 1910, just four years later, the city had recovered to its previous population level (Vigdor 2008).
One of the main reasons why both Chicago and San Francisco were able to recover from disaster so quickly is believed to be the fact that there was little human damage. Ac-cording to official statistics, the number of people who died in the fire in Chicago and the earthquake in San Francisco was no more than around 300 and 500, respectively (Bales 2005; Bronson 2006).
Rather than physical capital, such as houses, factories, equipment and infrastructure, the key to economic activity is usually human capital, such as the knowledge, skills and know-how of living people. For example, according to estimates in Mankiw (1997), the degree to which physical capital factors have contributed to past economic growth in the US is no more than around 14%-25%, with two-thirds to three-quarters of economic growth resulting from human capital factors, such as technological innovation and labor inputs. In addition to this, physical capital recovers much faster than human capital. If the quantity of physical capital is limited, it is possible to restore production activities more rapidly by in-creasing inputs of manpower or increasing the labor productivity of employees. Accordingly, even if a municipality suffers immense damage to its physical capital as a result of a natural disaster, that municipality can be expected to recover comparatively quickly if the human

Japan Labor Review, vol. 9, no. 4, Autumn 2012
66
Note: Compiled by the author from Kobe City Government (2011), Dai 87 Kai Kobeshi Tokeisho Heisei 22 Nendoban [87th Kobe City Statistical Yearbook: FY2010 Edition].
Figure 1. Changes in the Population of Kobe (1976–2010)
damage is small.
In fact, if one compares past examples of disaster recovery, one can see that in mu-nicipalities where the scale of the damage to physical capital is about the same, the subse-quent reconstruction and recovery of the population took longer in those municipalities where the human damage was greater.
An example of this can be seen in Kobe, following the Great Hanshin Awaji Earth-quake, in which the scale of damage to homes was about the same as that resulting from the San Francisco earthquake. In the Great Hanshin Awaji Earthquake of January 1995, which is still fresh in the memories of the Japanese people, more than 100,000 houses were com-pletely or partially destroyed, resulting in more than 200,000 people losing their homes, while the number of people who left Kobe was approximately 100,000 at its highest (Kobe City 2012). Moreover, more than 4,500 people lost their lives in Kobe as a result of this disaster, so one can see that the number of victims was much higher than in the case of the San Francisco earthquake. As a result, Chicago was able to recover its previous level of population in the space of four years, but it took Kobe until around 2005—ten years after the disaster—to recover its previous population level (Figure 1). Moreover, even as of 2010, the population growth curve for Kobe had still not returned to the pre-disaster trend, so one could not say that the effects of the disaster had completely disappeared.
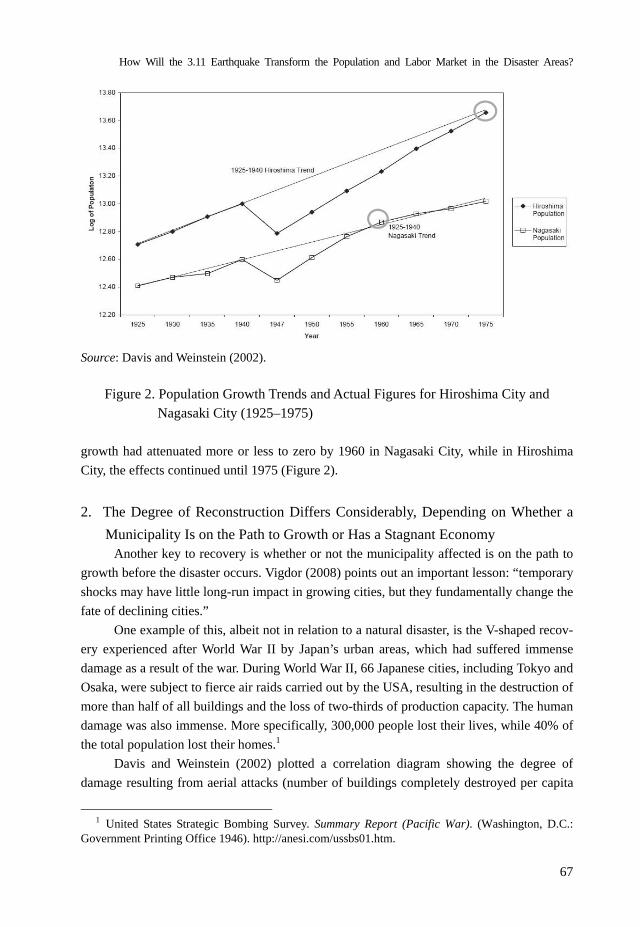
Moreover, in the cases of the cities of Hiroshima and Nagasaki, which both suffered atomic bomb attacks, it took 15 years longer for the population to return to its original level in Hiroshima, where the number of victims was greater (20.8% of the total population died), than in Nagasaki, where there were comparatively fewer victims (8.5% of the total population died). According to Davis and Weinstein (2002), the impact of the atomic bombs on population
How Will the 3.11 Earthquake Transform the Population and Labor Market in the Disaster Areas?
67
Source: Davis and Weinstein (2002).
Figure 2. Population Growth Trends and Actual Figures for Hiroshima City and
Nagasaki City (1925–1975)
growth had attenuated more or less to zero by 1960 in Nagasaki City, while in Hiroshima City, the effects continued until 1975 (Figure 2).
2. The Degree of Reconstruction Differs Considerably, Depending on Whether a Municipality Is on the Path to Growth or Has a Stagnant Economy
Another key to recovery is whether or not the municipality affected is on the path to growth before the disaster occurs. Vigdor (2008) points out an important lesson: “temporary shocks may have little long-run impact in growing cities, but they fundamentally change the fate of declining cities.”
One example of this, albeit not in relation to a natural disaster, is the V-shaped recov-ery experienced after World War II by Japan’s urban areas, which had suffered immense damage as a result of the war. During World War II, 66 Japanese cities, including Tokyo and Osaka, were subject to fierce air raids carried out by the USA, resulting in the destruction of more than half of all buildings and the loss of two-thirds of production capacity. The human damage was also immense. More specifically, 300,000 people lost their lives, while 40% of the total population lost their homes.1
Davis and Weinstein (2002) plotted a correlation diagram showing the degree of damage resulting from aerial attacks (number of buildings completely destroyed per capita
1 United States Strategic Bombing Survey. Summary Report (Pacific War). (Washington, D.C.:
Government Printing Office 1946). http://anesi.com/ussbs01.htm.

Japan Labor Review, vol. 9, no. 4, Autumn 2012
68
and number of deaths) and the postwar economic growth rate, from which they discovered that the greater the severity of the damage sustained by a city as a result of the air raids, the higher was its economic growth rate during the postwar period (1947-1960). Moreover, in their analysis based on rigorous statistical estimates, it emerged that the impact of the US military’s air raids on the scale of the population of a city was not permanent, but rather was a temporary shock. The effects of this temporary shock attenuated at a very rapid pace, in proportion to the scale of the damage, and it is reported that its impact on the scale of the population of cities diminished to zero over the course of 15-20 years, on average.
As Davis and Weinstein (2002) pointed out, there is a strong possibility that the cities chosen as targets for aerial attacks were cities that had high potential growth rates in the first place. For these cities, which were on the path to growth, major air raids were no more than a temporary shock, and it did not take that long for them to catch up with the popula-tion growth of other cities that did not suffer damage from aerial attacks (such as Kyoto and Sapporo).
On the other hand, the city of New Orleans in the USA is an example of a municipal-ity that experienced a major natural disaster during a period of stagnation. As a result of Hurricane Katrina, which occurred in August 2005, 80% of the total land area of New Or-leans was flooded, more than 1,200 people lost their lives, and the number of people who were forced to evacuate their homes reached 450,000 at its highest. The economy of New Orleans had been stagnating since before the disaster and the city faced such problems as population decline, outflows of employment and wages that were lower than the national average (Dolfman, Wasser, and Bergman 2007). According to the US population census carried out in 2000, before the disaster, the only strong industrial sectors in New Orleans were the entertainment and tourism, and coastal transportation sectors and the employment situation was very harsh, with employment opportunities for a further 37,000 people need-ing to be created in order to bring the city up to the national average employment level (Vigdor 2008). Consequently, it would appear that Hurricane Katrina inflicted a fundamen-tal blow on New Orleans, which was a municipality in stagnation.
In Figure 3, Vigdor (2008) forecast the medium- to long-term decline in the scale of the population in New Orleans. Before the disaster, New Orleans was already facing a de-cline in employment and population, while the demand for the construction of new houses was so weak that the market price of a house was lower than the marginal cost of building a new house. To put it another way, in pre-disaster New Orleans, demand and supply in the housing market were in equilibrium at Point B. After the disaster occurred, the housing stock decreased considerably and it was not possible for the construction of new houses to keep pace with the demand for housing. Consequently, the housing price in New Orleans rose considerably in the immediate aftermath of the disaster, halting temporarily at Point E. However, as time passes, the construction of new houses will continue to a point at which the marginal cost of housing construction and the market price of houses correspond with each other, eventually reaching long-term equilibrium between demand and supply at Point F.

How Will the 3.11 Earthquake Transform the Population and Labor Market in the Disaster Areas?
69
Where strong demand = path to growth A: Pre-disaster equilibrium point D: Pass point immediately after the disasterC: Post-disaster equilibrium point
Where weak demand = stagnant economy B: Pre-disaster equilibrium point E: Pass point immediately after the disaster F: Post-disaster equilibrium point
Source: Vigdor (2008). Note: Chicago in 1871 is given as an example of a municipality with strong demand, which was
on the path to growth before the disaster. Population was flowing gradually into the munic-ipality from before the disaster, and the market price of housing was higher than the mar-ginal cost of housing construction (in equilibrium at Point A). As a result of the disaster, the price of housing temporarily jumps to Point D, but eventually reaches a new equilibrium at Point C. In that situation, the impact of the disaster is temporary and it is deemed to have no effect on the medium- to long-term growth of the municipality.
Figure 3. The Post-Disaster Recovery Scenario Differs According to Whether the
Economy Is on the Path to Growth or Stagnating
Compared with the previous equilibrium point (Point B), not only has the quantity of housing stock declined at the new equilibrium point (Point F), but the price has also risen. In other words, in the projection in this model, it would seem that the average price of housing in post-disaster New Orleans will rise compared with the pre-disaster level, while the scale of the municipality will decreased in terms of both the population and the number of houses.

Japan Labor Review, vol. 9, no. 4, Autumn 2012
70
Source: Compiled by the author from statistical values published by the United States Census
Bureau. Note: Figures for 2006 - 2009 are projected values as of July 1 each year. The other figures are
values shown in the census for April 1 each year.
Figure 4. Changes in the Population Scale of New Orleans and the Post-Disaster Population Recovery Rate (dotted line) (1950–2010)
In fact, the projection by Vigdor (2008) more or less hits the mark. As can be seen
from Figure 4, the population of New Orleans rebounded strongly during the first three years after the disaster, recovering to 74% of its pre-disaster scale by 2008. However, the population increase subsequently slowed gradually, and had more or less stopped by 2009, four years after the disaster. According to the 2010 US population census, the population of New Orleans remained around 30% lower than it had been ten years previously, and the scale of the municipality was slightly smaller than it had been before the disaster.2
Housing prices in New Orleans also rose after the disaster, in line with the projections of Vigdor (2008). For example, in the case of the district of New Orleans known as Orleans Parish, whereas the contract price of a single house (average for September–December each year) was US$203,435 in 2004, before the disaster, it rose considerably in the immediate aftermath of the disaster, reaching US$357,063 (up 75.5%) in 2005. Although the price of a single house declined somewhat thereafter, as of 2011, the average price in the district in question continues to be high, at US$258,322, 27.0% higher than the pre-disaster average.3
2 Campbell Robertson, “Smaller New Orleans after Katrina: Census Shows,” New York Times,
February 3, 2011. 3 Figures calculated by the author, based on market statistics published by the New Orleans Met-
ropolitan Association of Realtors (http://www.nomar.org/).

How Will the 3.11 Earthquake Transform the Population and Labor Market in the Disaster Areas?
71
III. Post-Disaster Labor Markets
1. Positive Shocks Resulting from a Disaster Bring about an Increase in Employ-ment Opportunities
Large-scale disasters also cause serious damage to employment. They cause a decline in employment opportunities, at least temporarily, throughout industry as a whole, with the destruction of factories and production equipment affecting employment in manufacturing industry, while disruption to infrastructure and transport networks has a similar effect in the travel and tourism industry, as does the fall in consumer demand―resulting from popula-tion exodus―in the distribution, retail, service and real estate sectors.
However, at the same time, disasters also bring about an increase in employment op-portunities. This is because the restoration of infrastructure (roads, bridges, buildings, pow-er transmission lines, etc.), production equipment and homes destroyed by a disaster can be anticipated to have an effect equivalent to economic stimulus packages focused on fiscal stimulus. The increase in employment opportunities brought about by a post-disaster boom is called a “positive shock” by Chappell et al. (2007). In other words, although the employ-ment situation in a disaster-afflicted area generally deteriorates significantly in the immedi-ate aftermath of a disaster, employment opportunities should subsequently actually increase compared with the pre-disaster situation, due to the positive shock.
A familiar example of this can be seen in post-earthquake Kobe. In fact, 1995, when the disaster occurred, was the year that saw the city’s economy at its most buoyant since the collapse of the bubble economy. Despite the fact that the earthquake occurred in January, Kobe’s GDP growth rate for the whole of 1995 reached 1.4%, 0.8 points higher than the figure recorded in 1994, immediately before the disaster (Horwich 2000). One can see the positive shock of the earthquake from employment-related indicators, such as the rise in the active opening ratio and the fall in the unemployment rate that occurred immediately after the disaster.4
There are quite a few cases in which the effect of this positive shock lasts for a com-paratively long time for municipalities on the path to growth. For example, in a paper in which Ewing, Kruse, and Thompson (2005) analyzed time-series data for the USA, calcula-tions showed that the sequence of reconstruction activities that followed Hurricane Bret in 1997 resulted in a 0.75% fall in the natural rate of unemployment in Corpus Christi, Texas. In the case of the aforementioned Kobe as well, it is believed that the effect of the positive shock was sustained over a comparatively long period.
4 For detailed figures, see Mitsubishi UFJ Research and Consulting, “Chosa Repoto: Higashinihon
Daishinsai ga Koyo ni Oyobosu Eikyo—Hanshin Awaji Daishinsai kara Eta Kyokun wo Moto ni (2011 nen 9 gatsu) [Survey report: The impact of the Great East Japan Earthquake on employ-ment—Based on the lessons learned from the Great Hanshin Awaji Earthquake (September 2011)].” http://www.murc.jp/report_pdf/20110926_175605_0466081.pdf (accessed August 2012).

Japan Labor Review, vol. 9, no. 4, Autumn 2012
72
Source: Compiled by the author from United States Bureau of Labor Statistics, Local Area
Unemployment Statistics. Figure 5. Changes in the Number of Employees and the Unemployment Rate before
and after the Disaster in the New Orleans-Metairie-Kenner Region (January 2005– February 2011)
According to Horwich (2000), Kobe experienced a post-disaster population exodus of at
least 100,000 people at its highest, the majority of whom are believed to have been workers with some level of professional skills. However, the recovery in employment in Kobe in the immediate aftermath of the disaster was astonishing. According to the Ministry of Internal Affairs and Communications “Establishment and Enterprise Census,” the number of employ-ees working at all establishments and enterprises in Kobe recovered to 789,000 people by the year after the earthquake (October 1996), which was an increase of 17,000 people compared with the situation in July 1991, four years before the disaster. Although it is not the case that there was an uninterrupted pickup in post-disaster employment,5 the figure for the number of employees in Kobe in the most recent (2009) Economic Census carried out by the Ministry of Internal Affairs and Communications demonstrated a recovery to 788,000 people, a level that was higher, albeit only slightly, than the pre-disaster scale of employment.
On the other hand, in the case of municipalities experiencing stagnation, such as New Orleans, the expansion in employment opportunities brought about by the positive shock did not last long. Although the number of employees in New Orleans decreased considera-bly initially (peaking at a 27.5% fall as of October 2005), the figure gradually increased as reconstruction of the municipality subsequently took place, with the scale of employment recovering to 80% of the pre-disaster level by August 2006, a year after the disaster (Figure 5).
5 The number of employees in Kobe declined to 719,000 in 2006, a fall of 7.0% compared with the pre-disaster level in 1991 (Kobe City Government 2007).

How Will the 3.11 Earthquake Transform the Population and Labor Market in the Disaster Areas?
73
However, no marked improvement in the scale of employment was seen thereafter, and the total number of employees remains stagnant at around 80% of the pre-disaster level.
2. Patches of Light and Shade Emerge in the Changes in Average Wages in Disas-ter-Afflicted Areas and Areas Accepting Evacuees
What is perhaps somewhat unexpected is that a rise in average wages in disas-ter-afflicted areas is anticipated following a large-scale natural disaster. There are two main reasons for this. The first is the decline in workforce supply. When a major natural disaster occurs, a large number of fatalities and other casualties often result, and it is not unusual for tens or even hundreds of thousands of citizens to be compelled to evacuate their local communities. As a result, there is a tendency for the decline in the total labor force to be-come more pronounced than the fall in the volume of workforce demand. In that situation, it is likely that average wages after the disaster will actually rise (Vigdor 2008). The second reason is the culling of low-wage industries. In many cases, it is not possible for companies that had been weak in the first place and industries that lacked competitiveness to resume their business after a natural disaster, and average wages in the disaster-afflicted area are thought likely to rise as a result of these low-wage industries and companies being weeded out.
In the case of New Orleans, many of the industries that suffered the greatest damage as a result of the disaster (such as the retail and accommodation sectors) were low-wage industries, so the average wage rose by as much as 29.4% after the disaster (Dolfman, Wasser, and Bergman 2007). In the study by Vigdor (2008) as well, a rise in the average wage was reported in most business categories after the disaster.
As can be seen from Figure 6, in all of the industries other than entertainment, public utilities and the information industry, the average wage rate (wage per hour) of employees in New Orleans rose. The biggest rates of increase were seen in the industries for which there was the greatest need in the process of post-disaster reconstruction. A large volume of garbage was generated as a result of the disaster, so the wage rate in the waste disposal sec-tor rose by more than 50%. Moreover, the transport and storage of relief supplies was re-quired, so the wage rate in the transportation and warehousing sector rose by more than 40%. Furthermore, most of the city’s housing was destroyed by the disaster, so wage rates in the construction industry, which is responsible for building houses, and in the real estate business, which serves as an intermediary in the sale of homes, demonstrated high growth rates of just under 40% in both cases.
However, there is a possibility that a natural disaster might have a negative impact on the wage levels of local citizens outside the disaster-afflicted area. In particular, a fall in the average wage is anticipated in areas that take in a large number of evacuees from disas-ter-stricken areas. In the case of Hurricane Katrina, 100,000–150,000 evacuees from the dis-aster-afflicted area poured into the nearby Houston metropolitan area, resulting in a population

Japan Labor Review, vol. 9, no. 4, Autumn 2012
74
Source: Vigdor (2008).
Figure 6. Changes in Average Wage Rates after the Disaster in Orleans Parish, New Orleans (%, 2nd Quarter of 2005–2nd Quarter of 2007)
increase of 3-4%. It was expected that most of these evacuees would subsequently settle permanently in the Houston metropolitan area.6
In order to precisely measure the impact of Hurricane Katrina, during the period October 2005–October 2006, a section featuring questions that would enable analysts to determine whether or not a respondent was a Hurricane Katrina evacuee was incorporated into the questionnaires for the Current Population Survey (CPS), which is carried out monthly on a nationwide scale by the United States Bureau of Labor Statistics. Based on the individual data from the survey, McIntosh (2008) used a DID (Differ-ence-in-Difference) model to compare disparities in wages and employment rates, com-paring the situations before and after the disaster, as well as looking at differences be-tween local citizens in the Houston metropolitan area and citizens of other cities that were not affected by the disaster. As a result, it was discovered that the wages and employment rate (%) of local citizens in Houston fell by 1.8% and 0.5% respectively, due to the mas-sive influx of evacuees.
6 Susan Saulny, “Putting Down New Roots on More Solid Ground,” New York Times, September 7,
2005.

How Will the 3.11 Earthquake Transform the Population and Labor Market in the Disaster Areas?
75
Sources: Compiled by the author from Ministry of Internal Affairs and Communications, 2010
Population Census and National Institute of Population and Social Security Research, Population Statistics of Japan (2011).
Note: These are the proportions of the total national population accounted for by the total popu-lations of each prefecture.
Figure 7. Population Shares of the Three Tohoku Prefectures
(Unit: %, 1920–2010)
IV. Considering the Recovery of the Three Tohoku Prefectures
1. The Population and Labor Markets of the Three Tohoku Prefectures before the Major Earthquake
Pre-disaster Iwate Prefecture and Fukushima Prefecture actually had many similari-ties with New Orleans. On the other hand, Miyagi Prefecture was somewhere in the middle between New Orleans and Kobe in that, although it was not experiencing the problems of sustained population decline and underdeveloped tertiary industry, as was the case in New Orleans, neither was it on an upward path to growth, as was the case in Kobe.
From Figure 7, one can see that the population shares of Iwate and Fukushima Pre-fectures had been demonstrating a uniform downward trend since before the disaster. The proportion of the total population of Japan accounted for by the total populations of the two prefectures peaked at 4.2% in 1947, and these figures have been on the decline since then. By 2010, immediately before the earthquake, the share of the total population accounted for by the two prefectures had fallen to 2.8%. On the other hand, although the share of the total

Japan Labor Review, vol. 9, no. 4, Autumn 2012
76
population accounted for by Miyagi Prefecture had not been increasing by a great amount, no downward trend had been seen since 1970 (Figure 7).
The author believes the main cause of the decline in the population shares of Iwate and Fukushima Prefectures to be the fact that, just like New Orleans, they were seriously lagging behind in terms of the development of the information and communications indus-try and the finance and insurance industry, sectors that have been experiencing rapid growth in recent years. Due to the geographical conditions and the tradition of farming that they have inherited, both prefectures have a marked predominance in the fields of agriculture and forestry. Furthermore, Iwate Prefecture has made good use of another geographical condi-tion, in the form of its location adjacent to the abundant fishing grounds of the Pacific coast, so the fisheries industry has historically been a major sector. However, neither prefecture was able to adeptly cultivate a service sector to follow the new trend, so employment op-portunities for young people and households bringing up small children were limited.
Table 1 shows the figures for the degree to which the prefecture’s share of employ-ment exceeds its population share for each industry (unit: % points). One can interpret this to mean that the greater the excess in the employment share, the more that the industry in question within the prefecture absorbs a number of employees above the national average, making them dominant industries in the employment portfolio.
Looking at Table 1, one can see that the dominant industries in Iwate Prefecture (in order of the excess in the employment share) are forestry (+5.4 points), fisheries (+3.5 points), and agriculture (+1.9 points). The dominant industries in Fukushima Prefecture (in order of the excess in the employment share) are forestry (+1.6 points), agriculture (+1.6 points), and the electricity industry (+1.2 points). However, in almost all industries other than primary industries (excluding construction, electricity, gas, heat and water supply, and compound services), employment opportunities in the two prefectures are poorer than the national average.
On the other hand, while Miyagi Prefecture has in common with the other two pre-fectures a comparative advantage in the fisheries industry (+3.3 points) and the electricity industry (+0.6 points), it is catching up in terms of the development of its tertiary industries, to some extent. Of the tertiary industries, Miyagi Prefecture maintains an advantage—albeit slight—over the national average in the wholesale and retail (+0.19 points), education and learning support (+0.18 points), and transportation (+0.04 points) sectors. Thus, pre-disaster Miyagi Prefecture was experiencing moderate growth at around the same pace as the na-tional average, and the scale of its population and employment was also stable.
2. The Path to Recovery As Understood from the Two Keys As can be gathered from the studies of disasters carried out hitherto, there are two
keys to the recovery of disaster-afflicted areas. More specifically, these are human capital and the path to growth.

How Will the 3.11 Earthquake Transform the Population and Labor Market in the Disaster Areas?
77
Table 1. Employment Share Excess Rate by Industry in the Three Tohoku Prefectures
Source: Compiled by the author from the 2007 Employment Status Survey. Note: The population share of the total national population accounted for by the prefecture in
question (2010) was 1.04% for Iwate Prefecture, 1.83% for Miyagi Prefecture and 1.59% for Fukushima Prefecture.
The first key is human capital. Damage to physical capital can be remedied in the
short term, over a year or two, and it is comparatively simple to cover any shortfall by in-creasing the input of workforce and raising labor productivity. However, in the case of damage to human capital, which forms the core of production activities, it takes decades to

Japan Labor Review, vol. 9, no. 4, Autumn 2012
78
Table 2. Status of Damage and Recovery Forecast
Notes: 1. The number of victims is based on the National Police Agency, Damage Situation and
Police Countermeasures (March 2, 2012). The figures for victims include those listed as killed and those listed as missing.
2. The population of the prefecture is the estimated population immediately before the Great East Japan Earthquake (as of March 1).
recover to the original level. Accordingly, the greater the damage to human capital, the longer recovery will take.
The second key is the path to growth of the municipality. If an area is on a path to growth, a major disaster will be no more than a temporary shock (damage), and its effects will eventually disappear completely. Moreover, the positive shock resulting from recon-struction demand will stimulate the local economy, so one can expect that the potential growth rate in the disaster-stricken area will increase. On the other hand, for municipalities with a stagnant economy, a major disaster shifts the equilibrium points for the scale of pop-ulation and employment downwards, and it would seem that the impact of this will be semi-permanent. Moreover, it is anticipated that it will be difficult for the positive shock resulting from reconstruction demand to last a long time.
The scale of the damage to human capital in Miyagi and Iwate Prefectures due to this recent disaster is believed to be on about the same scale as that in Kobe resulting from the 1995 earthquake. Looking at Table 2, one can see that in Miyagi and Iwate Prefectures, 0.48% and 0.45% of the population of the respective prefectures fell victim to the disaster

How Will the 3.11 Earthquake Transform the Population and Labor Market in the Disaster Areas?
79
(the figure for Kobe was 0.42%).7 On the other hand, in Fukushima Prefecture, although the number of victims as recorded in official statistics is lower than in the other two prefec-tures, at 0.09% of the population, there was a mass exodus from the prefecture of those of working age bracket, focused primarily on young people and households bringing up small children, due to the accident at the Fukushima Daiichi Nuclear Power Plant; given that there is little prospect of their return to the prefecture in due course, one should view the damage to the human capital stock of Fukushima Prefecture as being immense in comparison with the damage in the other two prefectures.
Moreover, given that Miyagi Prefecture was somewhat on the path to growth, where-as the economies of Iwate and Fukushima Prefectures were somewhat stagnant even before the disaster, there is a strong possibility that disparities will emerge in the time required for reconstruction and the degree of recovery in each of the three prefectures.
If one compares Iwate and Miyagi Prefectures, which suffered a more or less equiva-lent level of damage to human capital, one can see that the latter was on the path to growth, so reconstruction is expected to proceed more smoothly. This projection is not altered by the fact that the physical damage suffered by Miyagi Prefecture as a result of the disaster was far greater than that experienced by Iwate Prefecture. The number of buildings completely or partially destroyed in Miyagi Prefecture was 223,000, which means that the number of buildings completely or partially destroyed per 1,000 population was 94.9 (the figure for Iwate Prefecture was 18.7 buildings/1,000 population).8 However, not only can the effect of being on the path to growth make up for this loss, but also it will be necessary to rebuild more buildings, so the positive shock of reconstruction will actually be powerful, and there is a strong possibility that the economy of Miyagi Prefecture will experience a significant rebound following the disaster. On the other hand, in Fukushima Prefecture, where the damage to human capital has been immense and where the economy was somewhat stag-nant even before the disaster, one would expect that it will take longer to achieve recovery there than in the other two prefectures, and that it will be difficult to regain its previous population and scale of employment.
3. The Status of Actual Post-Disaster Reconstruction Is Quite Closely Following Projections
If one looks solely at trends in employment, the economic climate and population, one can see that the recovery situation over the course of the year following this disaster has followed a route that runs broadly in line with theoretical projections.
7 The total number of victims in Kobe was 6,437 (Kobe City Government 2012), which is equiva-
lent to 0.42% of the total pre-disaster population of Kobe (1.519 million) as of October 1, 1994. 8 National Police Agency, “Higai Jokyo to Keisatsu Sochi [Damage situation and police counter-
measures],” March 2, 2012.

Japan Labor Review, vol. 9, no. 4, Autumn 2012
80
Table 3 shows changes in the number of new job openings, the active opening ratio and the diffusion index in the three Tohoku prefectures before and after the disaster. The number of new job openings indicates how many new jobs have been created. The active opening ratio (effective job openings/effective labor supply) indicates the balance of supply and demand in the labor force market; the higher the figure, the easier it is to find a job. On the other hand, the diffusion index (here, the DI coincident index is used) is a comprehen-sive indicator for gaining an understanding of economic trends; in general, if the DI value is above 50%, the economy is expanding, but if below, the economy can be deemed to be in recession.
Looking at Table 3, one can say that the number of new job openings and the active opening ratio in all three prefectures have been growing considerably since the disaster. The scale of the rise in all indicators has been in line with projections, with the biggest rises be-ing seen in Miyagi Prefecture. The number of job openings in post-disaster Miyagi Prefec-ture has grown by between 1.5 and 1.8 times compared with the same month of the previous year; as of January 2012, the new opening ratio in the prefecture was 0.82, a rise of 0.33 points compared with the level of 0.49 recorded immediately before the disaster.
On the other hand, although Fukushima Prefecture was considerably further ahead of Iwate Prefecture in terms of both the number of new job openings and the active opening ratio during the period from immediately after the disaster until December 2011, the situa-tion reversed in January 2012 and Iwate Prefecture took the lead.9 The author believes that these figures predict that it will be more difficult for Fukushima Prefecture to achieve a full-scale recovery in employment than it will be for Iwate Prefecture, as although the growth in employment in the former was faster than in the latter for a time, due to the need to deal with the nuclear power plant accident, the exodus of human capital from Fukushima Prefecture in the medium to long term is immense.
In addition, it was ascertained that economic expansion took place in Miyagi Prefec-ture for five consecutive months from August 2011, but the economy in Fukushima Prefec-ture entered a recessionary phase for a time in October and November that year (the rele-vant figures for Iwate Prefecture have not been published, so it is not possible to draw a comparison with other prefectures).
The status of the recovery in the total population of each prefecture has progressed broadly along the lines indicated by projections. The (estimated) population exodus from Miyagi Prefecture mostly stopped in May 2011, but a moderate outflow of the population subsequently continued in Iwate Prefecture. On the other hand, the population of Fukushima Prefecture has been departing faster than the outflow from Iwate Prefecture. If the popula-tion immediately before the disaster, as of March 1, 2011, is set at 100, then the population
9 The reason for this is unclear. The author surmises that this is because a large workforce was ini-tially required to deal with the accident at the Fukushima Daiichi Nuclear Power Plant, but from 2012, the work required to deal with the nuclear power plant accident had tapered off, so related employ-ment declined.

How
Will the 3.11 Earthquake Transform
the Population and Labor Market in the D
isaster Areas?
81
Table 3. Changes in the Active Opening Ratio and the Diffusion Index (January 2011–January 2012) Sources: Compiled by the author from Fukushima Labour Bureau, Saikin no Koyoshitsugyo no Josei ni tsuite (Heisei 24 nen 1
gatsu naiyo) [Concerning the recent employment and unemployment situation (January 2012 details)] (published March 2, 2012), Miyagi Labour Bureau, Miyagiken no Ippan Shokugyo Shokai Jokyo (Heisei 24 nen 1 gatsu naiyo) [General job placement situation in Miyagi prefecture (January 2012 details)] (published March 2, 2012), Iwate Prefecture FY2011 4th Meeting of the Iwate Prefecture Economic and Employment Measures Task Force Data Materials 2, Koyo Josei no Genjo ni tsuite [The Current Employment Situation] (meeting held February 6, 2012), and the diffusion indices published by the respective prefectural governments.
Notes: 1. The diffusion index for 2005 is set at 100. 2. No diffusion index has been published for Iwate Prefecture since May 2011.

Japan Labor Review, vol. 9, no. 4, Autumn 2012
82
Sources: Compiled by the author based on the monthly estimated population figures published
by each prefecture. Notes: 1. The monthly population estimates are made by taking the permanent population (as of
October 1) from the Population Census carried out in 2010 as the benchmark, while adjust-ing for the number of notifications of births, deaths, inward migrations, outward migrations, foreign national registrations and naturalizations recorded each month, with the result being viewed as the permanent population.
2. Despite the fact that people were actually relocating outside the prefecture, it is thought that there were many cases in which relocation procedures were not carried out, due to the post-disaster disruption, the allocation of donation money and compensation for the nuclear power plant accident. Consequently, there is a strong possibility that the aforementioned population estimates are higher than the actual situation. It will be necessary to await the results of the 2015 Population Census to see accurate figures that reflect the actual situa-tion.
Figure 8. Changes in Population before and after the Disaster
(January 2011–February 2012)
as of January 1, 2012 was 99.02 in Miyagi Prefecture, 98.76 in Iwate Prefecture, and 97.85 in Fukushima Prefecture (Figure 8).
V. In Place of a Conclusion: Being Smaller, Being Wealthier For the citizens of disaster-stricken areas, a major disaster does not bring only bad
things. As pointed out in Horwich (2000), the new economy will never be a revised version of the pre-disaster economy. While they destroy physical capital, such as buildings and fac-tories, disasters provide an ideal opportunity to attract new technology and investment. For
How Will the 3.11 Earthquake Transform the Population and Labor Market in the Disaster Areas?
83
example, in the case of Kobe, it is reported that the living environment in the city was actu-ally greatly improved after the disaster, through such initiatives as the introduction of a new type of sewerage system and a more efficient gas supply (Horwich 2000).
If local governments and the business community actually took advantage of the pre-dicament caused by the Great East Japan Earthquake as an opportunity to implement re-forms, such as improving the living environment, attracting new industries that make use of vacant lots, developing distribution networks, introducing new production technologies, and attracting the information and communications industry, there is a strong possibility that such reforms would progress more smoothly than they would have done before the disaster. If this can be achieved, it would seem to be possible to create a stronger economic system than existed in the disaster-afflicted areas before the disaster. In that sense, the disaster is both a crisis and a golden opportunity for the three Tohoku prefectures.
Due to their natural environments, siting conditions and traditions, etc., the agricul-ture, forestry and fishery industries are likely to continue to play a greater role in the future in these three Tohoku prefectures than in other regions. In the future, it will likely be neces-sary to increase the growth potential of primary industries through such endeavors as the introduction of new technologies to the agriculture, forestry and fishery industries, and en-hancing and achieving greater efficiency in the service industries supporting the sale and distribution of agriculture, forestry and fishery industry produce.
There is little prospect in the disaster-stricken areas of the kind of population increase and employment expansion seen in Tokyo, Hiroshima and Nagasaki Prefecture after the end of World War II, but one can have high expectations that each and every citizen of those prefectures will become more affluent after the disaster. Attaining a richer lifestyle than before the disaster is more than just a dream: it can be achieved by accelerating the weeding out and restructuring of uncompetitive low-wage businesses, improving labor productivity per capita through the introduction of new equipment and technology, and increasing the quantity of social capital per citizen as a result of the decreased population. At present, there is no way to confirm using accurate statistics whether the citizens of these three Tohoku prefectures have truly become more affluent, but at the very least, a rise in the household incomes and average wages of employed persons in these three prefectures has actually been reported since the disaster.10
The author believes that the goal should be “being smaller, being wealthier.” A vision for the future in which, although municipalities themselves become a little smaller, the indi-vidual citizens living there become more affluent and happier would be splendid. Inci-dentally, comparing the situation before and after the disaster, the following changes were seen in New Orleans (Figure 9).
10 For example, according to the Ministry of Internal Affairs and Communications “Family Income and Expenditure Survey,” the average monthly income in 2011 in Iwate Prefecture (Morioka) in the households of workers other than single persons was ¥503,000, an increase of 3.0% above the pre-disaster level in 2010.

Japan Labor Review, vol. 9, no. 4, Autumn 2012
84
Note: Compiled by the author from data published by the United States Census Bureau.
Figure 9. Changes in New Orleans before and after the Disaster
References
Bales, Richard F. 2005. Great Chicago Fire and the myth of Mrs. O’Leary’s cow. Jefferson NC: McFarland & Company, Inc.
Bronson, William. 2006. The earth shook, the sky burned; 100th anniversary edition: A photographic record of the 1906 San Francisco earthquake and fire. San Francisco: Chronicle Books.
Chappell, William F., Richard G. Forgette, David A. Swanson, and Mark V. Van Boening. 2007. Determinants of government aid to Katrina survivors: Evidence from survey data. Southern Economic Journal 74, no. 2:344–62.
Davis, Donald R., and David E. Weistein. 2002. Bones, bombs, and break points: The ge-ography of economic activity. The American Economic Review 92, no. 5:1269–89.
Dolfman, Michael. L., Solidelle Fortier Wasser, and Bruce Bergman. 2007. The effect of Hurricane Katrina on the New Orleans economy. Monthly Labor Review 130, no. 6:3–18.
Ewing, Bradley T., Kruse, Jamie B. and Thompson, Mark A. 2005. Empirical examination of the Corpus Christi unemployment rate and Hurricane Bret. Natural Hazards Review 6, no. 4:191–96.
Falk, William W., Matthew O. Hunt, and Larry L. Hunt. 2006. Hurricane Katrina and New Orleanians’ sense of place: Return and reconstruction or “Gone with the Wind”? Du Bois Review 3 (1): 115–28.
Horwich, George. 2000. Economic lessons of the Kobe earthquake. Economic Development and Culture Change 48, no. 3:521–42.
Kletzer, Lori G. 1998. Job Displacement. Journal of Economic Perspectives 12, no. 1:115–36.
Kobe City Government. 2007. Koubeshi no jigyosho: Heisei 18 nen jigyosho kigyo tokei chosa kekka [Establishments in Kobe: Results of the 2006 establishment and enter-prise census]. http://www.city.kobe.lg.jp/information/data/statistics/toukei/jigyousho/ data/18kiji.pdf (accessed August 3, 2012).
———. 2012. Hanshin-Awaji Daishinsai: Hisai jokyo oyobi fukkou he no Torikumi jokyo

How Will the 3.11 Earthquake Transform the Population and Labor Market in the Disaster Areas?
85
(Heisei 24 nen, 1 gatsu 1 nichi genzai) [The Great Hanshin Awaji Earthquake: The damage situation and the status of reconstruction initiatives (as of January 1, 2012)]. http://www.city.kobe.lg.jp/safety/hanshinawaji/revival/promote/img/hisaijyoukyou240101.pdf (accessed August 3, 2012).
Mankiw, N. Gregory. 1997. Macroeconomics. 3rd ed. New York: Worth. McIntosh, Molly Fifer. 2008. Measuring the labor market impacts of Hurricane Katrina mi-
gration: Evidence from Houston Texas. The American Economic Review 98, no. 2:54–57.
Vigdor, Jacob. 2008. The economic aftermath of Hurricane Katrina. Journal of Economic Perspectives 22, no. 4:135–54.