howard county 3q11
TRANSCRIPT
8/3/2019 Howard County 3Q11
http://slidepdf.com/reader/full/howard-county-3q11 1/3
8/3/2019 Howard County 3Q11
http://slidepdf.com/reader/full/howard-county-3q11 2/3
9891BrokenLandParkway,Suite302Columbia,MD21046·(410)290-3400·www.mcsheaco.com
Howar d County Office Market Overview 3rd Q 2011
Disclaimer: The information contained in this report was obtained from sources deemed to be reliable, but no warranty or representation, is made to the
accuracy thereof. This information is provided subject to correction of errors and omissions.
# ofBldgs RSF(1,000'S)
DirectVacant SubletVacant 3Q11 2010 2009 2008 2007
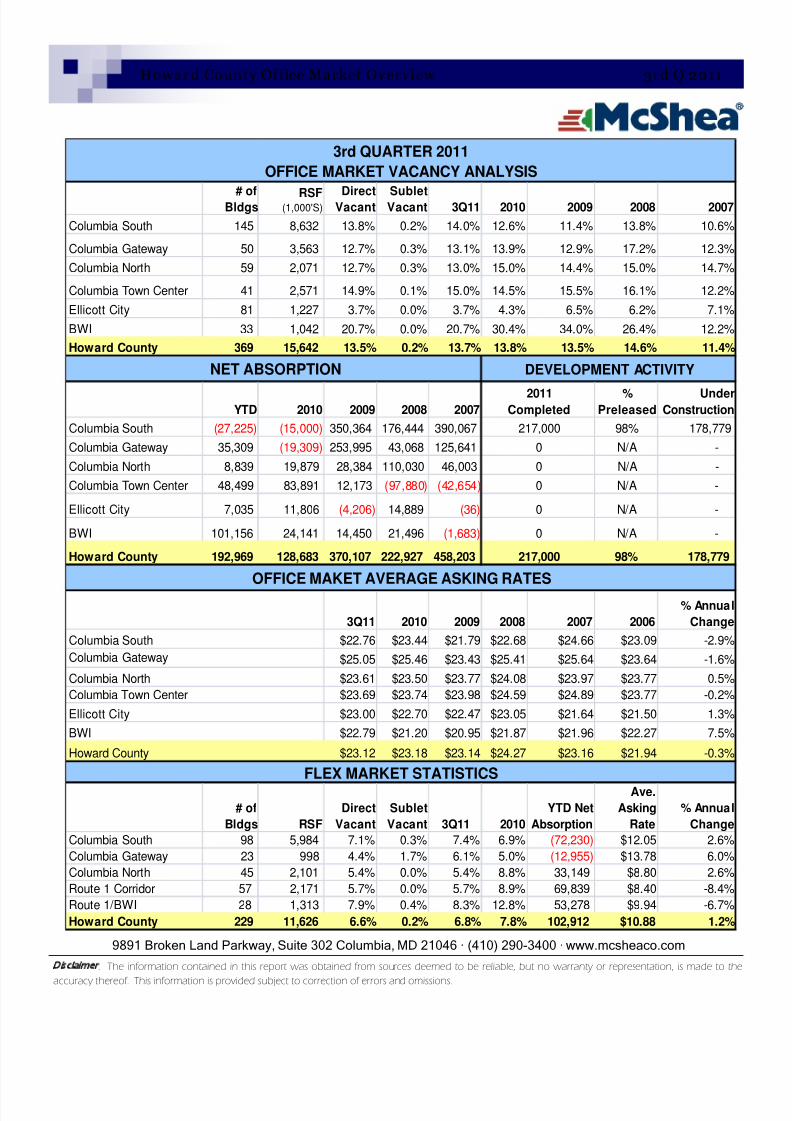
Columbia South 145 8,632 13.8% 0.2% 14.0% 12.6% 11.4% 13.8% 10.6%
Columbia Gateway 50 3,563 12.7% 0.3% 13.1% 13.9% 12.9% 17.2% 12.3%
Columbia North 59 2,071 12.7% 0.3% 13.0% 15.0% 14.4% 15.0% 14.7%
Columbia Town Center 41 2,571 14.9% 0.1% 15.0% 14.5% 15.5% 16.1% 12.2%
Ellicott City 81 1,227 3.7% 0.0% 3.7% 4.3% 6.5% 6.2% 7.1%
BWI 33 1,042 20.7% 0.0% 20.7% 30.4% 34.0% 26.4% 12.2%
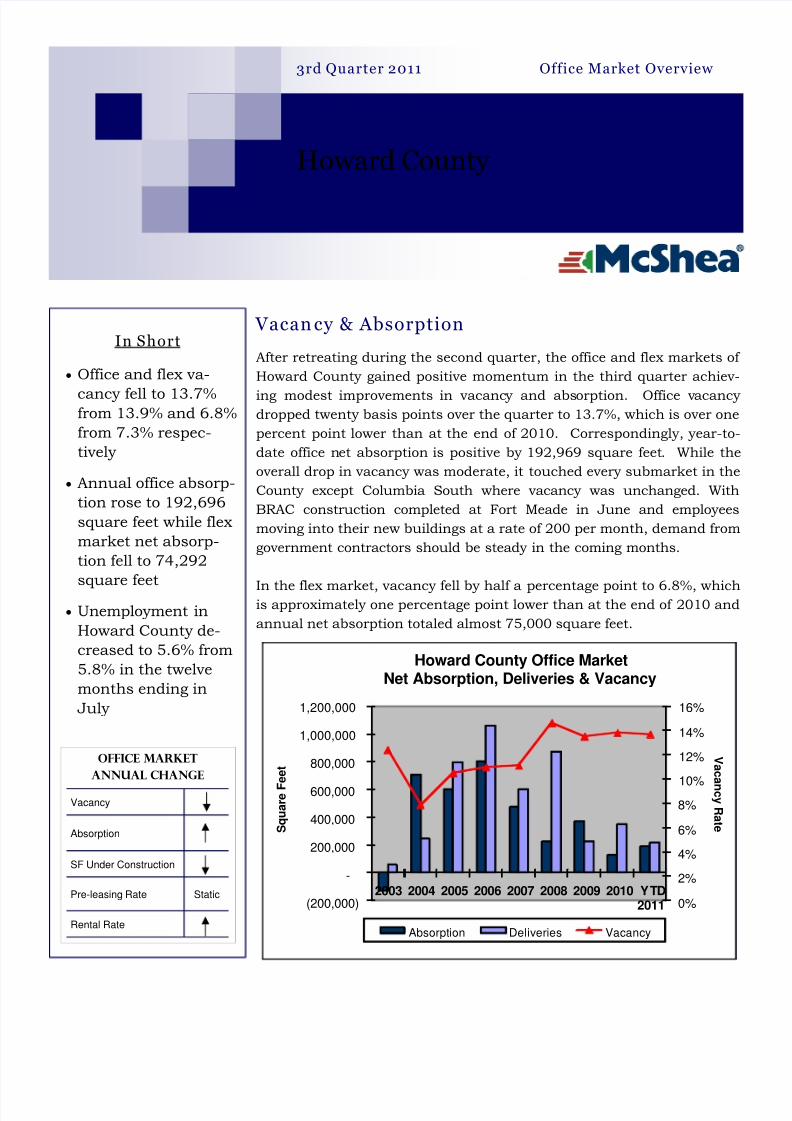
Howard County 369 15,642 13.5% 0.2% 13.7% 13.8% 13.5% 14.6% 11.4%
YTD 2010 2009 2008 2007%
PreleasedUnder
Construction
Columbia South (27,225) (15,000) 350,364 176,444 390,067 98% 178,779
Columbia Gateway 35,309 (19,309) 253,995 43,068 125,641 N/A -
Columbia North 8,839 19,879 28,384 110,030 46,003 N/A -
Columbia Town Center 48,499 83,891 12,173 (97,880) (42,654) N/A -
Ellicott City 7,035 11,806 (4,206) 14,889 (36) N/A -
BWI 101,156 24,141 14,450 21,496 (1,683) N/A -
Howard County 192,969 128,683 370,107 222,927 458,203 98% 178,779
3Q11 2010 2009 2008 2007 2006
% Annual
Change
$22.76 $23.44 $21.79 $22.68 $24.66 $23.09 -2.9%
$25.05 $25.46 $23.43 $25.41 $25.64 $23.64 -1.6%
$23.61 $23.50 $23.77 $24.08 $23.97 $23.77 0.5%
$23.69 $23.74 $23.98 $24.59 $24.89 $23.77 -0.2%
$23.00 $22.70 $22.47 $23.05 $21.64 $21.50 1.3%
$22.79 $21.20 $20.95 $21.87 $21.96 $22.27 7.5%
$23.12 $23.18 $23.14 $24.27 $23.16 $21.94 -0.3%
# of
Bldgs RSF
Direct
Vacant
Sublet
Vacant 3Q11 2010
YTD Net
Absorption
Ave.
Asking
Rate
% Annual
Change
Columbia South 98 5,984 7.1% 0.3% 7.4% 6.9% (72,230) $12.05 2.6%
Columbia Gateway 23 998 4.4% 1.7% 6.1% 5.0% (12,955) $13.78 6.0%
Columbia North 45 2,101 5.4% 0.0% 5.4% 8.8% 33,149 $8.80 2.6%
Route 1 Corridor 57 2,171 5.7% 0.0% 5.7% 8.9% 69,839 $8.40 -8.4%
Route 1/BWI 28 1,313 7.9% 0.4% 8.3% 12.8% 53,278 $9.94 -6.7%
Howard County 229 11,626 6.6% 0.2% 6.8% 7.8% 102,912 $10.88 1.2%
Ellicott City
Columbia South
Columbia Gateway
Columbia North
FLEX MARKET STATISTICS
3rd QUARTER 2011
OFFICE MARKET VACANCY ANALYSIS
NET ABSORPTION
2011Completed
DEVELOPMENT ACTIVITY
Howard County
217,000
0
217,000
0
0
0
0
Columbia Town Center
BWI
OFFICE MAKET AVERAGE ASKING RATES
8/3/2019 Howard County 3Q11
http://slidepdf.com/reader/full/howard-county-3q11 3/3
There were no groundbreakings during the third quarter leaving two buildings, both speculative, under
construction. 8160 Maple Lawn Boulevard in the Columbia South submarket is a 110,000 square foot
project and 6514 Meadowridge Road in Columbia North will total 68,799 square feet when it is com-
pleted early in 2012. No flex buildings were delivered or were under construction as of the third quar-ter. Two buildings delivered earlier this year; 9055 Sterling Drive and 8164 Washington Boulevard.
The 153,500 square foot building at 9055 Sterling Drive is 100% available while 8164 Washington
Boulevard, which is a mixed-use project has 23,000 square feet of retail available.
9891BrokenLandParkway,Suite200Columbia,MD21046·(410)290-3400·www.mcsheaco.com
Howar d County Office Market Overview 3rd Q 2011
Disclaimer: The information contained in this report was obtained from sources deemed to be reliable, but no warranty or representation, is made to the
accuracy thereof. This information is provided subject to correction of errors and omissions.
Developm ent Activity
No significant flex or office building sales were completed during the third quarter. Year-to-date sales
volume totals $44.25 million with an average price per square foot $131. Three properties have traded
hands this year the largest being 8930 Stanford Boulevard (154,394 square feet), which Howard County
picked up for $26 million or $168 per square foot. The other two sales completed this year included
10320 Little Patuxent Parkway, which First Potomac Realty Investors scooped up for $11 million, and7700 Montpelier Road, which Syndicated Equities Corp. purchased fully occupied by Johns Hopkins
Applied Physics Laboratory on a seven year lease for $7.25 million or $166 per square foot. While sales
activity has been moderate so far this year there are several properties on the market including the
AMB portfolio, a 20 office/flex building portfolio totaling 588,000 square feet and a portfolio of eight in-
dustrial buildings offered by TA Associates.
Investm ent Sales
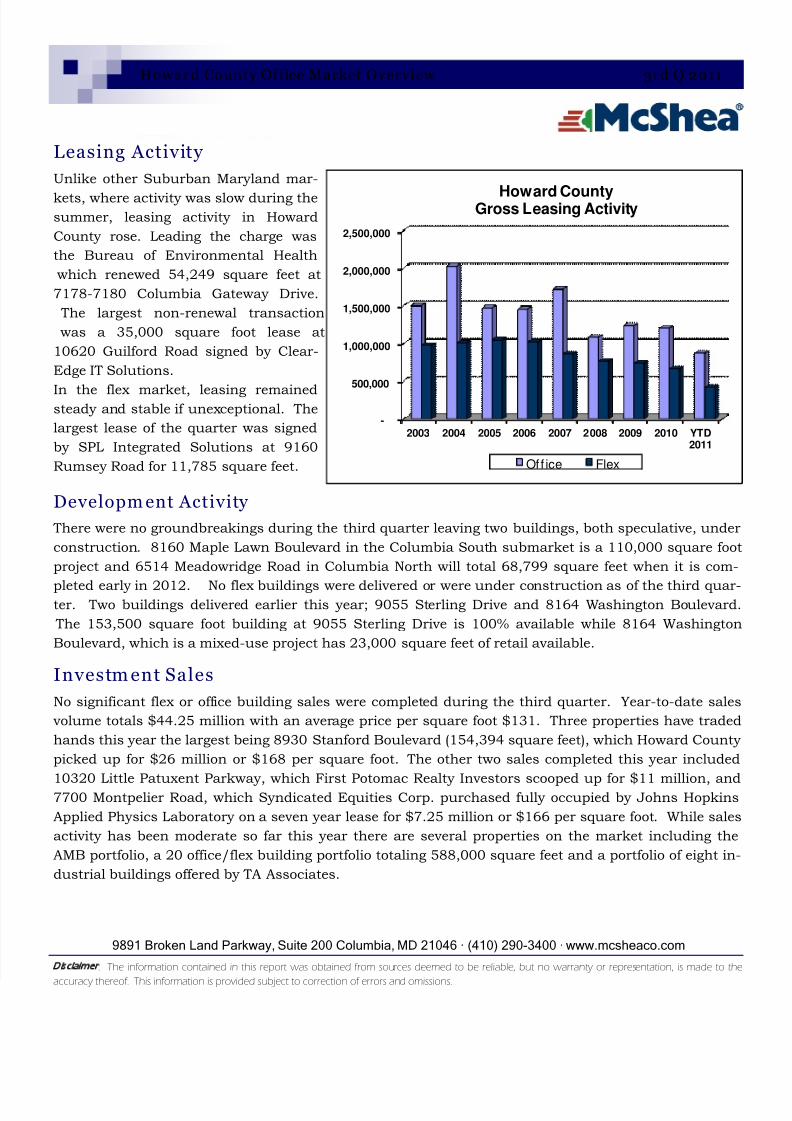
Leasing Activity
Unlike other Suburban Maryland mar-
kets, where activity was slow during thesummer, leasing activity in Howard
County rose. Leading the charge was
the Bureau of Environmental Health
which renewed 54,249 square feet at
7178-7180 Columbia Gateway Drive.
The largest non-renewal transaction
was a 35,000 square foot lease at
10620 Guilford Road signed by Clear-
Edge IT Solutions.
In the flex market, leasing remainedsteady and stable if unexceptional. The
largest lease of the quarter was signed
by SPL Integrated Solutions at 9160
Rumsey Road for 11,785 square feet.
-
500,000
1,000,000
1,500,000
2,000,000
2,500,000
2003 2004 2005 2006 2007 2008 2009 2010 YTD2011
Howard CountyGross Leasing Activity
Off ice Flex